
82.0MANIA OVERALL
MANIA RATING
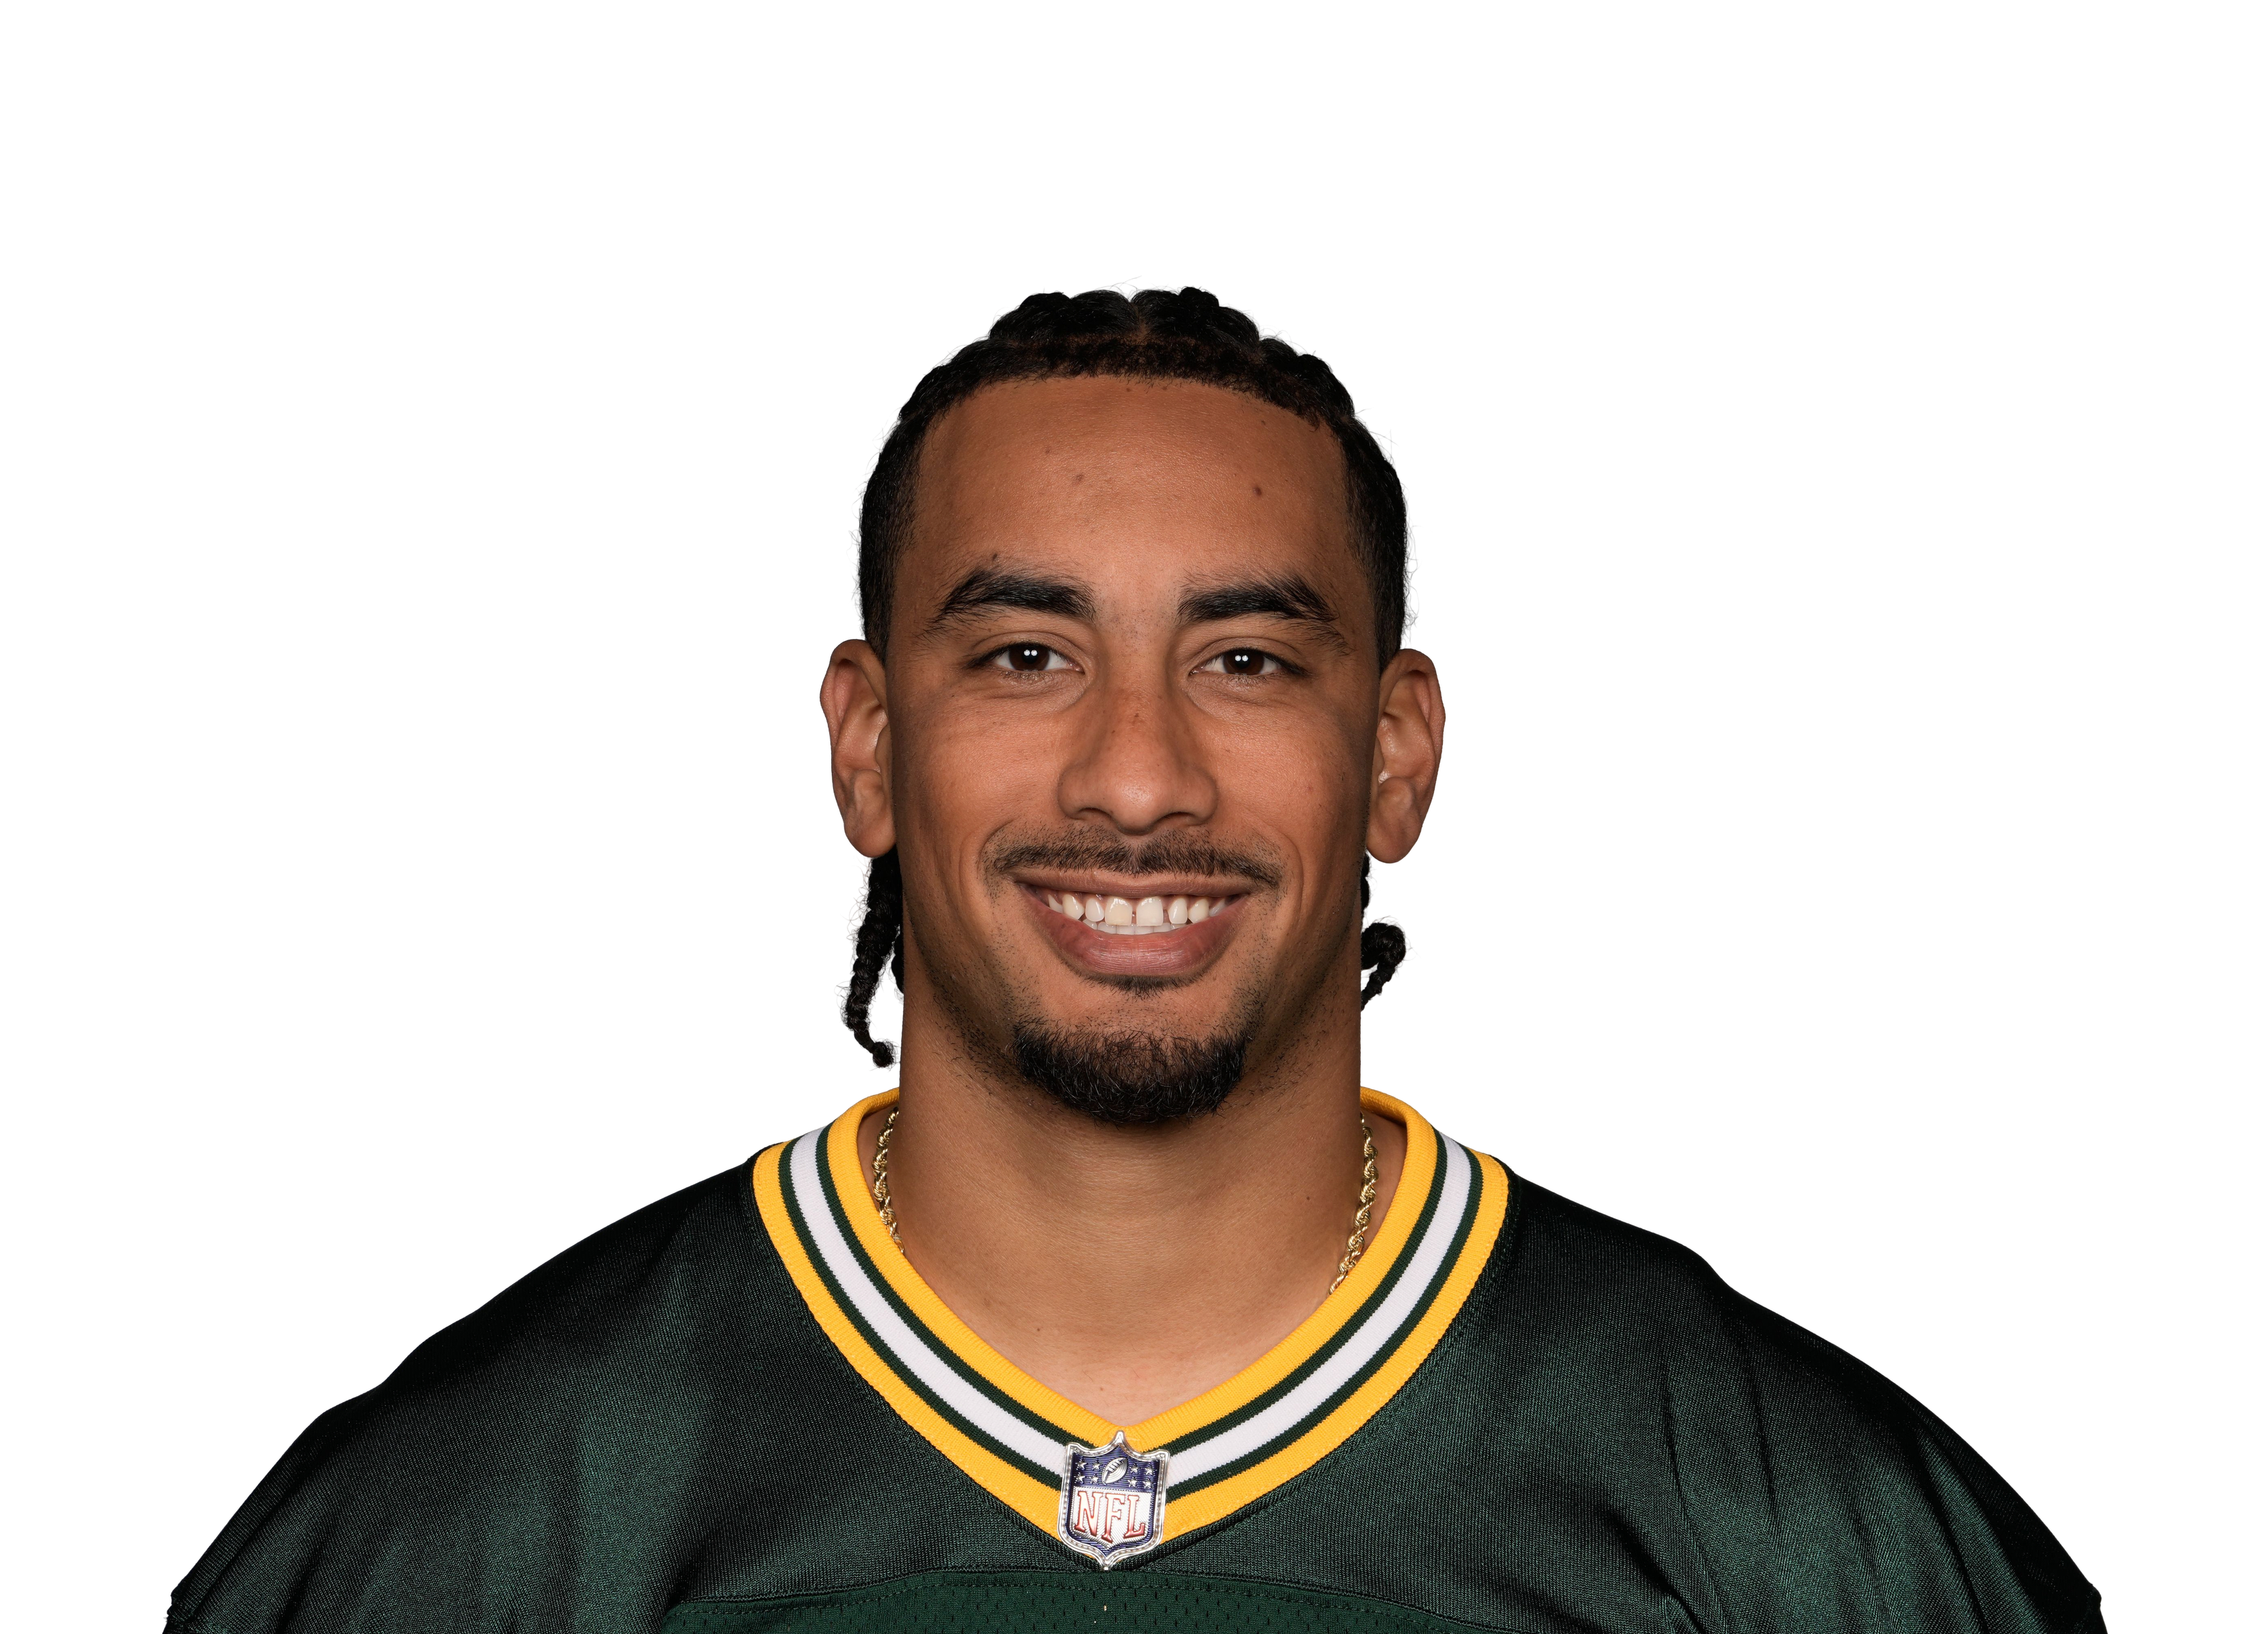
Jordan Love
 GB • QB • 10 games
#10 Overall QBCarrying his team
BYEWEEK 11 RATINGBye week
—WEEK 11 PROJECTIONPPR
19.6PPR / GAMEseason average
QB10QB RANKthis season
Games counted
Untick or tick any game and Mania Rating and the breakdown recalculate. Official Mania Rating 82.
19.6
PPR / Game
284
Pass Yds / Game
2
Pass TD / Game
0.7
INT / Game
63%
Completion %
7.7
Yards / Attempt
2
Rush Yds / Game
Mania breakdown
Production82
Passing92
Rushing31
Scoring80
Efficiency65
Mania breakdown
Percentile among quarterbacks. 100 is the best, 50 is average.
Fantasy points per game (PPR) against other quarterbacks. The biggest single piece, because points are what you start him for. Ranks better than 82% of quarterbacks.
PPR / game 8th
60% passing yards per game, 40% attempts per game. More throws and more yards mean a safer floor. Ranks better than 92% of quarterbacks.
Pass yards 2ndAttempts 7th
65% rushing yards per game, 35% rushing touchdowns per game. Quarterbacks who run get a big fantasy boost. Ranks better than 31% of quarterbacks.
Rush yards 28thRush TDs 12th
60% passing touchdowns per game, 40% how often his throws turn into touchdowns. Ranks better than 80% of quarterbacks.
Pass TDs 8thTD rate 10th
How well he actually plays, not just how much: 35% scoring impact (points he adds per throw), 20% accuracy, 15% yards per throw, 15% few interceptions, 15% few sacks. Ranks better than 65% of quarterbacks.
Scoring impact 12thAccuracy 13thYards / throw 10thInterceptions 12thSacks 14th
Top 30%MiddleBottom 40%Tap a category to see what it means.
Game log
Games10
PPR/G19.6
Game log
Love avg 19.6NFL top 12 QBs avg 20.9
Solid dot is what he scored. Hollow dot is our projection before the game.
| Game | Proj | PPR | Cmp/Att | Pass Yd | TD | INT | Rush Yd | Rush TD |
|---|---|---|---|---|---|---|---|---|
W1  MIN | — | 19.5 | 21/42 | 387 | 2 | 1 | 0 | 0 |
W2  NYJ | — | 13.8 | 16/29 | 145 | 2 | 0 | 0 | 0 |
W3  ATL | — | 18.5 | 28/53 | 312 | 2 | 1 | 0 | 0 |
W4  TB | — | 13.1 | 22/30 | 197 | 2 | 1 | -8 | 0 |
W5  CHI | — | 25.3 | 25/31 | 367 | 2 | 0 | 6 | 0 |
W6  DAL | — | 20.2 | 23/41 | 276 | 1 | 1 | 12 | 1 |
W7  DET | — | 17 | 27/45 | 274 | 2 | 1 | 0 | 0 |
W8  CAR | — | 21.5 | 30/41 | 288 | 3 | 1 | 0 | 0 |
W9  NE | — | 36.2 | 23/29 | 372 | 3 | 0 | 13 | 1 |
| W10 MIN | — | 10.8 | 17/27 | 220 | 1 | 1 | 0 | 0 |
Opponent color:Easy for QBsAverageTough
Schedule ahead
11 bye12 LA13 NO14 BUF15 MIA16 CHI17 HOU18 DET
Green easier, red tougher
Schedule ahead
Colored by what each defense has given up to QBs so far. Green is an easier matchup, red is a tougher one.
Wk 11 byeWk 12 LAWk 13 NOWk 14 BUFWk 15 MIAWk 16 CHIWk 17 HOUWk 18 DETSee every team's QB schedule ›
The real story
Carrying his offense
He scores a lot and plays well, even though he gets less help than most QBs (more pressure, fewer yards from his receivers).
The real story
Carrying his offenseHe scores a lot and plays well, even though he gets less help than most QBs (more pressure, fewer yards from his receivers). This one is real.
Each bar is a percentile among quarterbacks. 100 is the best, 50 is average. Points scored above How well he plays can mean his teammates are helping. The other way around means he is better than his stats look.
The team around him
Less than most
45Line
61Weapons
3Catching
26Overall
Tap to open
The team around him
How much help he gets. Tap any circle to see all quarterbacks ranked.
Compared with starting quarterbacks.
45#18 of 32Offensive lineAverage • pressured 23% (avg 23%)See ranking ›
61#13 of 32WeaponsAverage • Matthew Golden, Tucker Kraft, Pierre StrongSee ranking ›
19#31 of 32After the catchWeak • 5.0 yds per catch, 24 dropsSee ranking ›
39#24 of 32Overall helpLess than mostSee ranking ›
He gets less help than most. His numbers are harder to come by.
Starters are quarterbacks who are first on their team’s depth chart or have taken at least half of their team’s dropbacks. Weapons use the current Mania Rating of his best three receivers, tight end and back. Anyone who is out this week does not count. Pressure rate depends a little on how long he holds the ball, and yards after the catch depend a little on the scheme, so treat this as a good guide, not a final grade.
By the numbers
PPR points / G
19.6
Pass yards / G
284
Pass TDs / G
2.0
Interceptions / G
0.7
By the numbers
PPR points per game
19.6
8th of 32QB avg 16.5
Passing yards per game
284
2nd of 32QB avg 233
Passing TDs per game
2.0
8th of 32QB avg 1.5
Interceptions per game
0.7
14th of 32QB avg 0.7
Completion rate
63.0%
21st of 32QB avg 64.0%
Yards per attempt
7.7
10th of 32QB avg 7.2
Rushing yards per game
2
28th of 32QB avg 15
Rushing TDs per game
0.20
12th of 32QB avg 0.18
Advanced passing
Scoring impact12th of 32
Accuracy13th of 32
Avoids sacks14th of 32
Open for the full breakdown
How a QB is rated
Mania Rating82.0
Quarterback rankQB10 of 44
Open to see how it is built
How a QB is rated
- Grade five categories.Each bar on the left is his percentile among quarterbacks. 100 is the best, 50 is average.
- Blend them.Production 35%, Passing 15%, Rushing 12%, Scoring 13%, Efficiency 25%. Production counts the most, and Efficiency (how well he plays: scoring impact, accuracy, sacks, interceptions) is next, so a QB cannot rate high on empty volume alone.Blend 72.8
- Match it to the whole league.He is QB10 of 44. That spot is lined up with the same spot among running backs, receivers and tight ends, so QB1 is rated like WR1.Mania Rating 82.0
- Week 11 rating.This week's projected points, graded on the same scale.
Where he sits
9. T. Lawrence83.1
10. J. Love82.0
11. J. Goff80.5
Where he sits
The quarterbacks right around him in Mania Rating. Tap a name to open his profile.
| # | Player | PPR / G | Mania |
|---|---|---|---|
| 7 | Patrick MahomesKC | 19.7 | 85.1 |
| 8 | Drake MayeNE | 19.9 | 83.7 |
| 9 | Trevor LawrenceJAX | 19.3 | 83.1 |
| 10 | Jordan LoveGB | 19.6 | 82.0 |
| 11 | Jared GoffDET | 18.6 | 80.5 |
| 12 | Caleb WilliamsCHI | 18.4 | 79.2 |
| 13 | Kirk CousinsMIN | 18.8 | 78.7 |
StatPer gameSeasonRank
Overall
Games—10—
PPR points19.6195.977›
Passing
Passing yards284283897›
Passing TDs2.02077›
Interceptions0.7758›
Completions—232—
Attempts36.8368—
Completion %63.0%63%35›
Yards per attempt7.7—71›
Rushing
Rush yards22313›
Rush TDs0.20265›
Carries1.3——
Tap any stat to see everyone ranked. Bars: green top 30%, yellow middle, red bottom 40%.
Advanced passing
The same stats the pros use, in plain words. Green means better than most of the 32 QBs. The small mark on each bar is the QB average.
Scoring impactAverage
+0.14 points added per throw
12th of 32 QBs · average +0.06See everyone ›
EPA per dropback. How many points his offense gains every time he drops back to pass, compared with a normal play. The best single measure of how much a QB helps his team score.
AccuracyAverage
+1.0% completions beyond what is expected
13th of 32 QBs · average +0.8%See everyone ›
Completion % over expected. His completion rate compared with what an average QB would complete on the same throws. A hard throw counts for more, so he is not punished for tough passes.
Avoids sacksAverage
6.4% of dropbacks end in a sack
14th of 32 QBs · average 6.8%See everyone ›
Sack rate. How often he gets sacked. Lower is better. It is partly the offensive line and partly how quickly he gets rid of the ball.
Bad throwsAverage
15.5% of throws miss the target
21st of 32 QBs · average 14.8%See everyone ›
Off-target rate. How often his throws are charted as off target, not counting throwaways. Lower is better.
Throw depthDeep passer
9.4 yards, on average, the ball travels
2nd of 32 QBs · average 7.9See everyone ›
Air yards per throw. How far downfield he throws. This is style, not quality. Deep throwers have bigger highs and lows. Short throwers are steadier.
Pressure he facesNormal
23.2% of dropbacks are pressured
18th of 32 QBs · average 23.3%See everyone ›
Pressure rate. How often defenders get to him. That is mostly his offensive line, so this is context and not a grade on him.
Dropped passesContext
24 passes his receivers dropped
Not his fault, but every drop costs him fantasy points.
82.0
Mania Rating
Excellent Overall QB Rating
BYE
Week 11 Rating
Bye week
Jordan Love
GB • QB • 10 games#10 Overall QBCarrying his team
Games counted
Untick or tick any game and Mania Rating and the breakdown recalculate. Official Mania Rating 82.
Game log
Games10
PPR/G19.6
Game log
Love avg 19.6NFL top 12 QBs avg 20.9
Solid dot is what he scored. Hollow dot is our projection before the game.
| Game | Proj | PPR | Cmp/Att | Pass Yd | TD | INT | Rush Yd | Rush TD |
|---|---|---|---|---|---|---|---|---|
| W1 MIN | — | 19.5 | 21/42 | 387 | 2 | 1 | 0 | 0 |
| W2 NYJ | — | 13.8 | 16/29 | 145 | 2 | 0 | 0 | 0 |
| W3 ATL | — | 18.5 | 28/53 | 312 | 2 | 1 | 0 | 0 |
| W4 TB | — | 13.1 | 22/30 | 197 | 2 | 1 | -8 | 0 |
| W5 CHI | — | 25.3 | 25/31 | 367 | 2 | 0 | 6 | 0 |
| W6 DAL | — | 20.2 | 23/41 | 276 | 1 | 1 | 12 | 1 |
| W7 DET | — | 17 | 27/45 | 274 | 2 | 1 | 0 | 0 |
| W8 CAR | — | 21.5 | 30/41 | 288 | 3 | 1 | 0 | 0 |
| W9 NE | — | 36.2 | 23/29 | 372 | 3 | 0 | 13 | 1 |
| W10 MIN | — | 10.8 | 17/27 | 220 | 1 | 1 | 0 | 0 |
Opponent color:Easy for QBsAverageTough
Schedule ahead
11 bye12 LA13 NO14 BUF15 MIA16 CHI17 HOU18 DET
Green easier, red tougher
Schedule ahead
Colored by what each defense has given up to QBs so far. Green is an easier matchup, red is a tougher one.
Wk 11 byeWk 12 LAWk 13 NOWk 14 BUFWk 15 MIAWk 16 CHIWk 17 HOUWk 18 DETSee every team's QB schedule ›
The team around him
Less than most
45Line
61Weapons
3Catching
26Overall
Tap to open
The team around him
How much help he gets. Tap any circle to see all quarterbacks ranked.
Compared with starting quarterbacks.
45#18 of 32Offensive lineAverage • pressured 23% (avg 23%)See ranking ›
61#13 of 32WeaponsAverage • Matthew Golden, Tucker Kraft, Pierre StrongSee ranking ›
19#31 of 32After the catchWeak • 5.0 yds per catch, 24 dropsSee ranking ›
39#24 of 32Overall helpLess than mostSee ranking ›
He gets less help than most. His numbers are harder to come by.
Starters are quarterbacks who are first on their team’s depth chart or have taken at least half of their team’s dropbacks. Weapons use the current Mania Rating of his best three receivers, tight end and back. Anyone who is out this week does not count. Pressure rate depends a little on how long he holds the ball, and yards after the catch depend a little on the scheme, so treat this as a good guide, not a final grade.
Advanced passing
Scoring impact12th of 32
Accuracy13th of 32
Avoids sacks14th of 32
Open for the full breakdown
Where he sits
9. T. Lawrence83.1
10. J. Love82.0
11. J. Goff80.5
Where he sits
The quarterbacks right around him in Mania Rating. Tap a name to open his profile.
| # | Player | PPR / G | Mania |
|---|---|---|---|
| 7 | Patrick MahomesKC | 19.7 | 85.1 |
| 8 | Drake MayeNE | 19.9 | 83.7 |
| 9 | Trevor LawrenceJAX | 19.3 | 83.1 |
| 10 | Jordan LoveGB | 19.6 | 82.0 |
| 11 | Jared GoffDET | 18.6 | 80.5 |
| 12 | Caleb WilliamsCHI | 18.4 | 79.2 |
| 13 | Kirk CousinsMIN | 18.8 | 78.7 |
StatPer gameSeasonRank
Overall
Games—10—
PPR points19.6195.977›
Passing
Passing yards284283897›
Passing TDs2.02077›
Interceptions0.7758›
Completions—232—
Attempts36.8368—
Completion %63.0%63%35›
Yards per attempt7.7—71›
Rushing
Rush yards22313›
Rush TDs0.20265›
Carries1.3——
Tap any stat to see everyone ranked. Bars: green top 30%, yellow middle, red bottom 40%.
Advanced passing
The same stats the pros use, in plain words. Green means better than most of the 32 QBs. The small mark on each bar is the QB average.
Scoring impactAverage
+0.14 points added per throw
12th of 32 QBs · average +0.06See everyone ›
EPA per dropback. How many points his offense gains every time he drops back to pass, compared with a normal play. The best single measure of how much a QB helps his team score.
AccuracyAverage
+1.0% completions beyond what is expected
13th of 32 QBs · average +0.8%See everyone ›
Completion % over expected. His completion rate compared with what an average QB would complete on the same throws. A hard throw counts for more, so he is not punished for tough passes.
Avoids sacksAverage
6.4% of dropbacks end in a sack
14th of 32 QBs · average 6.8%See everyone ›
Sack rate. How often he gets sacked. Lower is better. It is partly the offensive line and partly how quickly he gets rid of the ball.
Bad throwsAverage
15.5% of throws miss the target
21st of 32 QBs · average 14.8%See everyone ›
Off-target rate. How often his throws are charted as off target, not counting throwaways. Lower is better.
Throw depthDeep passer
9.4 yards, on average, the ball travels
2nd of 32 QBs · average 7.9See everyone ›
Air yards per throw. How far downfield he throws. This is style, not quality. Deep throwers have bigger highs and lows. Short throwers are steadier.
Pressure he facesNormal
23.2% of dropbacks are pressured
18th of 32 QBs · average 23.3%See everyone ›
Pressure rate. How often defenders get to him. That is mostly his offensive line, so this is context and not a grade on him.
Dropped passesContext
24 passes his receivers dropped
Not his fault, but every drop costs him fantasy points.
Mania breakdown
Production82
Passing92
Rushing31
Scoring80
Efficiency65
Mania breakdown
Percentile among quarterbacks. 100 is the best, 50 is average.
Fantasy points per game (PPR) against other quarterbacks. The biggest single piece, because points are what you start him for. Ranks better than 82% of quarterbacks.
PPR / game 8th
60% passing yards per game, 40% attempts per game. More throws and more yards mean a safer floor. Ranks better than 92% of quarterbacks.
Pass yards 2ndAttempts 7th
65% rushing yards per game, 35% rushing touchdowns per game. Quarterbacks who run get a big fantasy boost. Ranks better than 31% of quarterbacks.
Rush yards 28thRush TDs 12th
60% passing touchdowns per game, 40% how often his throws turn into touchdowns. Ranks better than 80% of quarterbacks.
Pass TDs 8thTD rate 10th
How well he actually plays, not just how much: 35% scoring impact (points he adds per throw), 20% accuracy, 15% yards per throw, 15% few interceptions, 15% few sacks. Ranks better than 65% of quarterbacks.
Scoring impact 12thAccuracy 13thYards / throw 10thInterceptions 12thSacks 14th
Top 30%MiddleBottom 40%Tap a category to see what it means.
The real story
Carrying his offense
He scores a lot and plays well, even though he gets less help than most QBs (more pressure, fewer yards from his receivers).
The real story
Carrying his offenseHe scores a lot and plays well, even though he gets less help than most QBs (more pressure, fewer yards from his receivers). This one is real.
Each bar is a percentile among quarterbacks. 100 is the best, 50 is average. Points scored above How well he plays can mean his teammates are helping. The other way around means he is better than his stats look.
By the numbers
PPR points / G
19.6
Pass yards / G
284
Pass TDs / G
2.0
Interceptions / G
0.7
By the numbers
PPR points per game
19.6
8th of 32QB avg 16.5
Passing yards per game
284
2nd of 32QB avg 233
Passing TDs per game
2.0
8th of 32QB avg 1.5
Interceptions per game
0.7
14th of 32QB avg 0.7
Completion rate
63.0%
21st of 32QB avg 64.0%
Yards per attempt
7.7
10th of 32QB avg 7.2
Rushing yards per game
2
28th of 32QB avg 15
Rushing TDs per game
0.20
12th of 32QB avg 0.18
19.6
PPR / Game
284
Pass Yds / Game
2
Pass TD / Game
0.7
INT / Game
63%
Completion %
7.7
Yards / Attempt
2
Rush Yds / Game
How a QB is rated
Mania Rating82.0
Quarterback rankQB10 of 44
Open to see how it is built
How a QB is rated
- Grade five categories.Each bar on the left is his percentile among quarterbacks. 100 is the best, 50 is average.
- Blend them.Production 35%, Passing 15%, Rushing 12%, Scoring 13%, Efficiency 25%. Production counts the most, and Efficiency (how well he plays: scoring impact, accuracy, sacks, interceptions) is next, so a QB cannot rate high on empty volume alone.Blend 72.8
- Match it to the whole league.He is QB10 of 44. That spot is lined up with the same spot among running backs, receivers and tight ends, so QB1 is rated like WR1.Mania Rating 82.0
- Week 11 rating.This week's projected points, graded on the same scale.