
40.3MANIA OVERALL
MANIA RATING • DEPTH
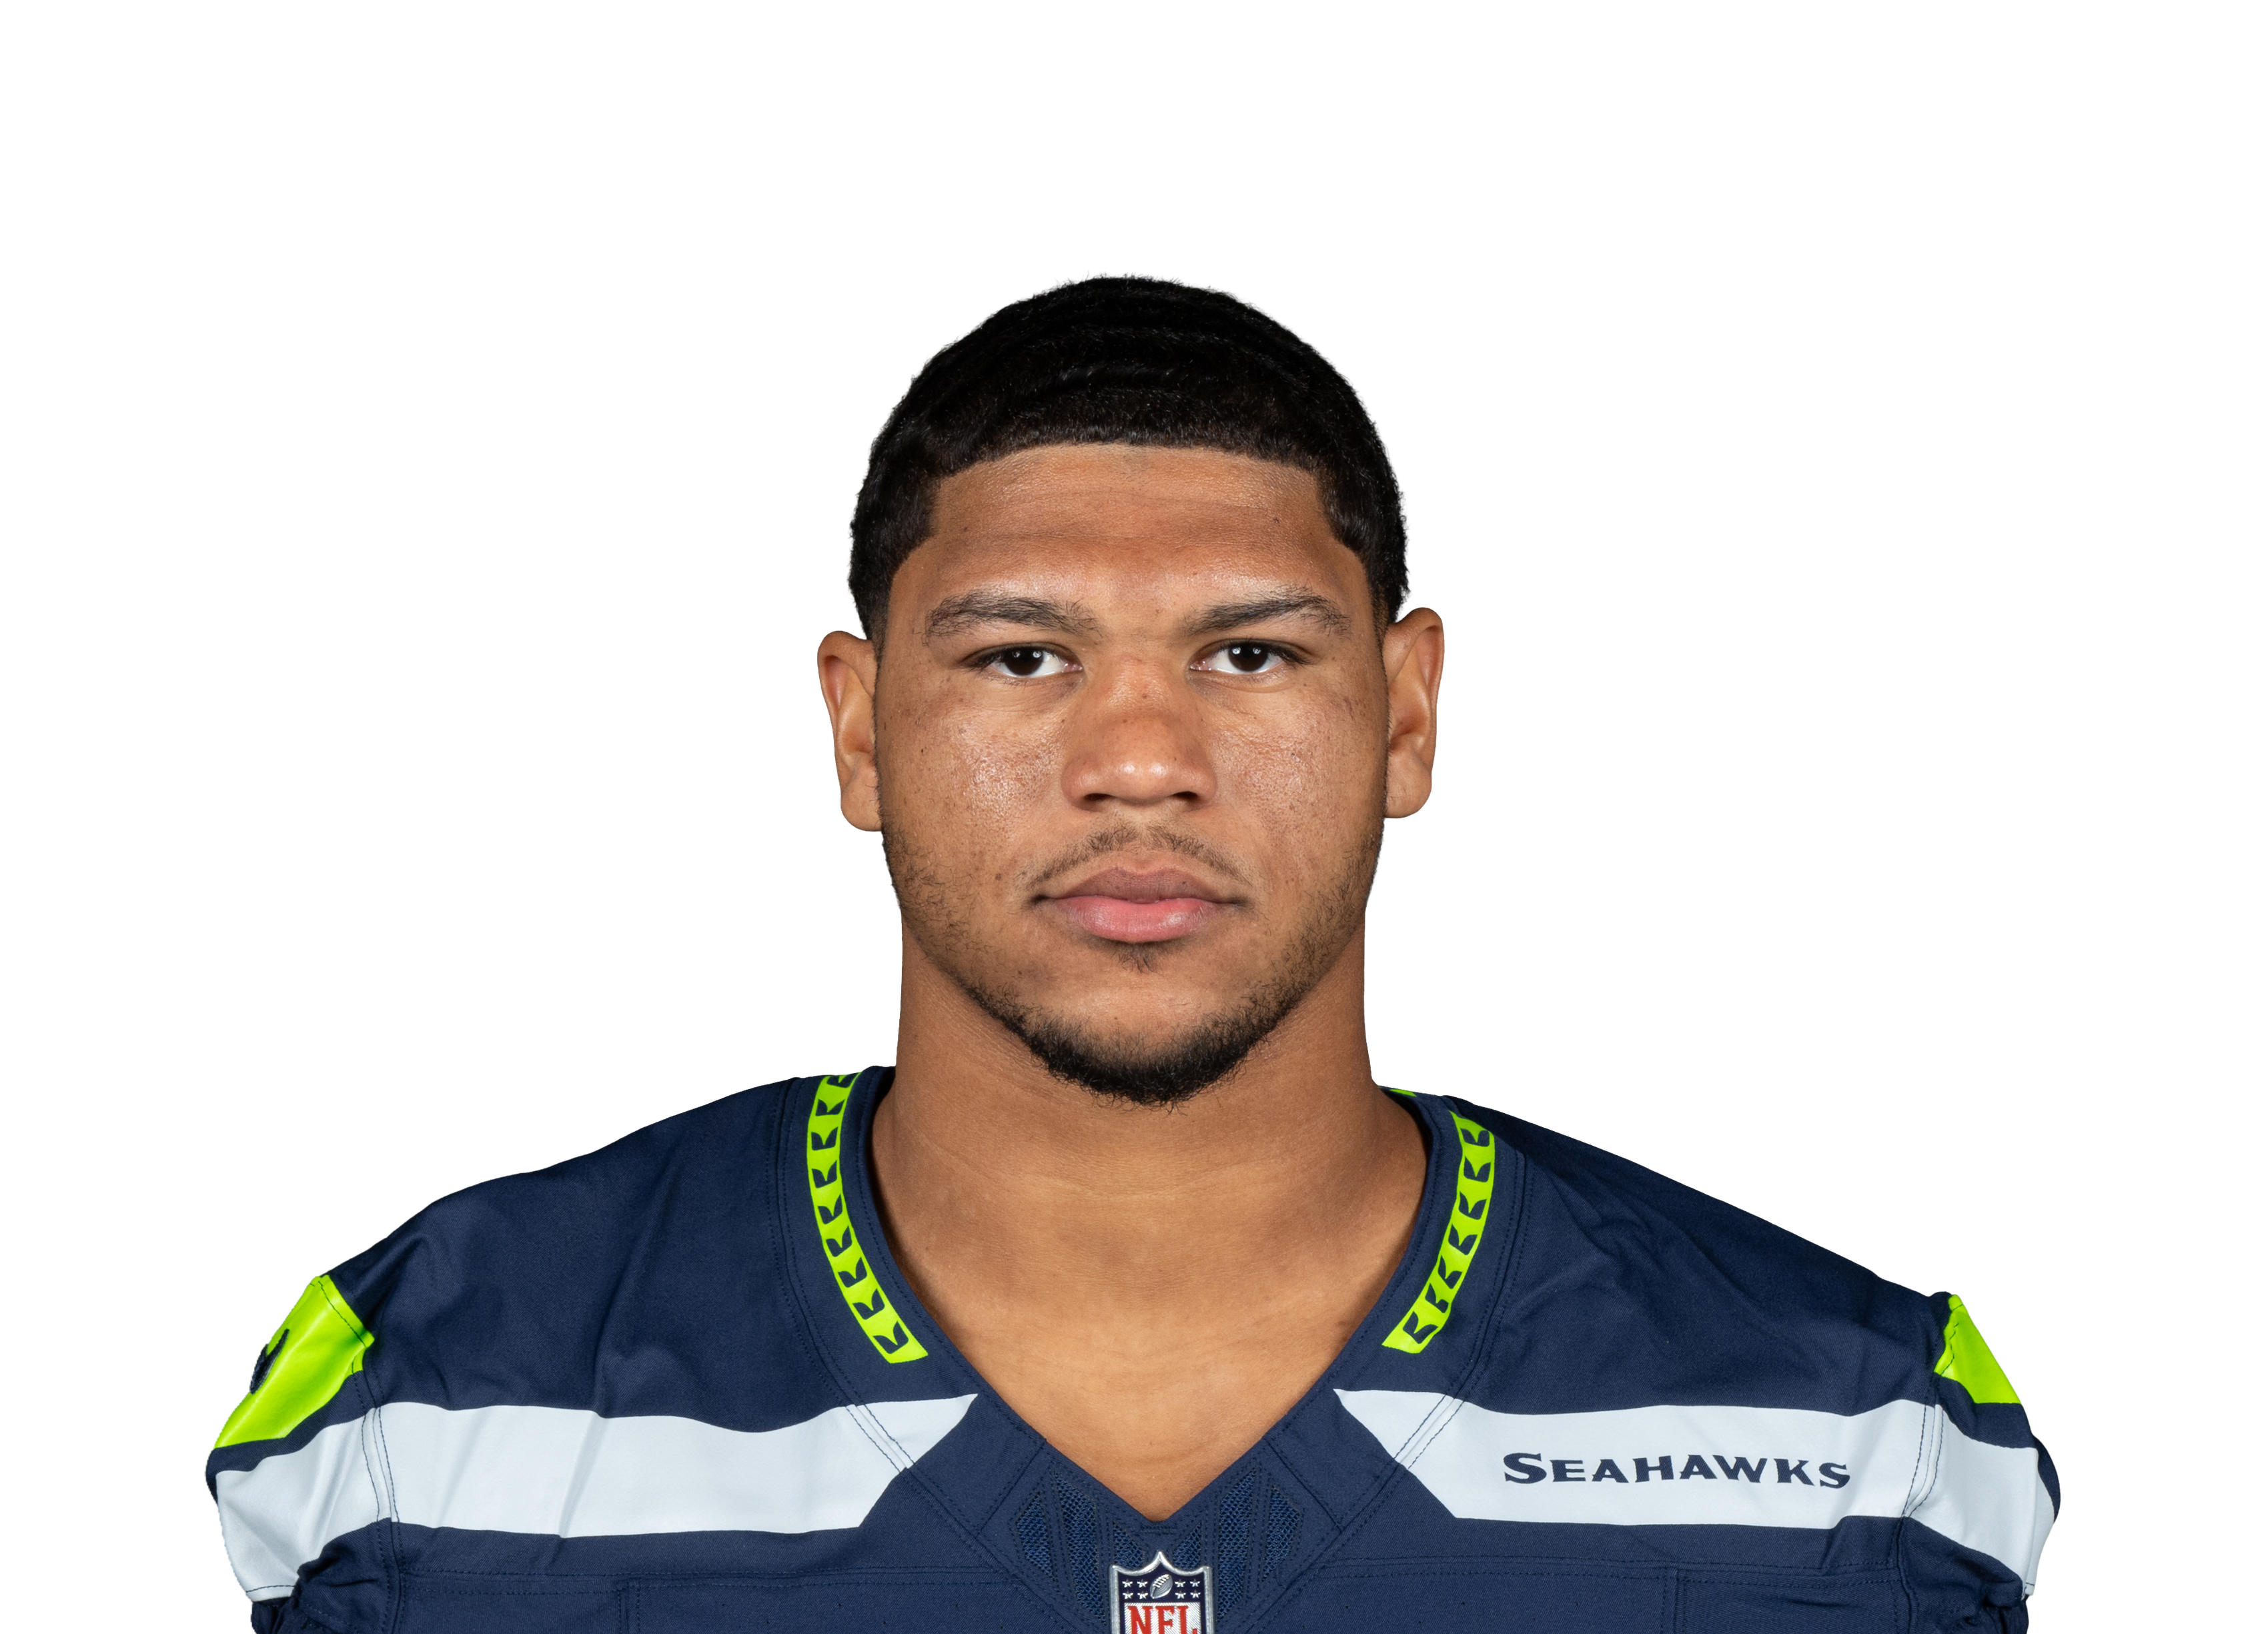
Elijah Arroyo
 SEA • TE • 2 games
#460 OverallTE82#2 TE on SEADepth TE3 ›Age 23
BYEWEEK 11 RATINGBye week
—WEEK 11 PROJECTIONPPR
4%TARGET SHARE16th percentile
26.5%SNAP SHARE1st percentile
Games counted
Untick or tick any game and Mania Rating, matchup and Week 11 Rating all recalculate. Official Mania Rating 40.3.
Week 11 Rating = recent role + opponent + the latest injury report (updated Sat Nov 21, 6:30 AM ET). Check final inactives before you set your lineup.
Mania breakdown
Fantasy Production16
Target Volume12
Team Target Role23
Red-Zone Threat0
Per-Target Efficiency40
Mania breakdown
Percentile among TEs. 100 is the best, 50 is average.
How many fantasy points and total yards he is actually producing, compared with players at his position. Ranks better than 16% of TEs.
How often he is targeted: targets per game, receptions and his share of the team targets. Ranks better than 12% of TEs.
How big a slice of his team passing game belongs to him: target share, air-yard share and snaps. Ranks better than 23% of TEs.
How often the offense uses him near the goal line: red-zone targets and end-zone targets. Ranks better than 0% of TEs.
What he produces with each chance instead of just rewarding volume: yards per target, catch rate and fantasy points per opportunity. Ranks better than 40% of TEs.
Top 30%MiddleBottom 40%Tap a category to see what it means.
Week 11 matchup
Bye week
No matchup to adjust for.
Week 11 matchup
Bye week
No game this week, so there is no matchup to adjust for.
Usage
Snaps
27%
Target share
4%
Targets/G
1.0
PPR/G
1.4
By the numbers
PPR / Game
1.4
15th percentileTE avg 5.9
Targets / Game
1
14th percentileTE avg 3.2
Receiving Yards / Game
8.5
22nd percentileTE avg 23.3
Receptions / Game
0.5
8th percentileTE avg 2.3
Share of Team Targets
3.8%
16th percentileTE avg 10.4%
Share of Team Air Yards
7.9%
56th percentileTE avg 8.5%
Red-Zone Targets / Game
0
13th percentileTE avg 0.5
End-Zone Targets / Game
0
35th percentileTE avg 0.2
Snap Share
26.5%
1st percentileTE avg 56.9%
TDs / Game
0
34th percentileTE avg 0.2
SEA TE room
A. Barner14%
E. Arroyo4%
E. Saubert2%
Share of targets
SEA TE room, week by week
Targets and receiving yards each week, with his share of the team targets and his snap percentage.
| Player | W1 | W2 | W3 | W4 | W5 | W6 | W7 | W8 | W9 | W10 | Per game |
|---|---|---|---|---|---|---|---|---|---|---|---|
| AJ Barner | 213 yds8% targets88% snaps | 18 yds4% targets80% snaps | 969 yds20% targets91% snaps | 312 yds15% targets90% snaps | 520 yds19% targets95% snaps | 416 yds9% targets93% snaps | 542 yds19% targets80% snaps | 523 yds15% targets95% snaps | 47 yds14% targets72% snaps | 319 yds18% targets84% snaps | 4.123 yds a game • 5.6 per target14% targets87% snaps |
| Elijah Arroyo | — | 117 yds4% targets21% snaps | — | — | 10 yds4% targets32% snaps | — | — | — | — | — | 1.09 yds a game • 8.5 per target4% targets27% snaps |
| Eric Saubert | 00 yds0% targets20% snaps | 1-10 yds4% targets24% snaps | 213 yds4% targets27% snaps | 00 yds0% targets30% snaps | 00 yds0% targets35% snaps | 10 yds2% targets19% snaps | 117 yds4% targets32% snaps | — | 10 yds4% targets48% snaps | — | 0.83 yds a game • 3.3 per target2% targets29% snaps |
Each cell is targets that week, with receiving yards, share of team targets and snap percentage. Click a name to open that player.
Game log
Games2
PPR/G1.4
Game log
Arroyo avg 1.4NFL top 12 TEs avg 13.3
Solid dot is what he scored. Hollow dot is our projection before the game.
| Use | Game | Proj | PPR | Tgt | Rec | Rec Yd | Car | Rush Yd | TD | Snap |
|---|---|---|---|---|---|---|---|---|---|---|
W2 vs ARI | 3.6 | 2.7 | 1 | 1 | 17 | 0 | 0 | 0 | 21% | |
W5 vs SF | 2.4 | 0 | 1 | 0 | 0 | 0 | 0 | 0 | 32% |
Opponent color:Easy defense for TEsAverageTough
Schedule ahead
11 bye12 SF13 DAL14 NYG15 PHI16 LA17 CAR18 LA
Green easier, red tougher
Schedule ahead
Colored by what each defense has given up to TEs so far. Green is an easier matchup, red is a tougher one.
Wk 11 byeWk 12 SFWk 13 DALWk 14 NYGWk 15 PHIWk 16 LAWk 17 CARWk 18 LASee every team's TE schedule ›
StatPer gameSeasonRank
Overall
Games—21›
PPR points1.42.715›
Receiving
Targets1214›
Catches0.518›
Receiving yards8.51722›
Yards per target8.5—80›
Rushing
Scrimmage yards8.51722›
Usage
Snap %27%—1›
Target share %3.8%—16›
Touch share %1.7%—8›
Air yards share %7.9%3256›
Tap any stat to see everyone ranked. Bars: green top 30%, yellow middle, red bottom 40%.
40.3
Mania Rating
Overall profile • Depth
BYE
Week 11 Rating
Bye week
Elijah Arroyo
SEA • TE • 2 games#460 OverallTE82#2 TE on SEADepth TE3 ›Age 23
On bye
This weekOn bye
Games counted
Untick or tick any game and Mania Rating, matchup and Week 11 Rating all recalculate. Official Mania Rating 40.3.
Week 11 Rating = recent role + opponent + the latest injury report (updated Sat Nov 21, 6:30 AM ET). Check final inactives before you set your lineup.
Week 11 matchup
Bye week
No matchup to adjust for.
Week 11 matchup
Bye week
No game this week, so there is no matchup to adjust for.
SEA TE room
A. Barner14%
E. Arroyo4%
E. Saubert2%
Share of targets
SEA TE room, week by week
Targets and receiving yards each week, with his share of the team targets and his snap percentage.
| Player | W1 | W2 | W3 | W4 | W5 | W6 | W7 | W8 | W9 | W10 | Per game |
|---|---|---|---|---|---|---|---|---|---|---|---|
| AJ Barner | 213 yds8% targets88% snaps | 18 yds4% targets80% snaps | 969 yds20% targets91% snaps | 312 yds15% targets90% snaps | 520 yds19% targets95% snaps | 416 yds9% targets93% snaps | 542 yds19% targets80% snaps | 523 yds15% targets95% snaps | 47 yds14% targets72% snaps | 319 yds18% targets84% snaps | 4.123 yds a game • 5.6 per target14% targets87% snaps |
| Elijah Arroyo | — | 117 yds4% targets21% snaps | — | — | 10 yds4% targets32% snaps | — | — | — | — | — | 1.09 yds a game • 8.5 per target4% targets27% snaps |
| Eric Saubert | 00 yds0% targets20% snaps | 1-10 yds4% targets24% snaps | 213 yds4% targets27% snaps | 00 yds0% targets30% snaps | 00 yds0% targets35% snaps | 10 yds2% targets19% snaps | 117 yds4% targets32% snaps | — | 10 yds4% targets48% snaps | — | 0.83 yds a game • 3.3 per target2% targets29% snaps |
Each cell is targets that week, with receiving yards, share of team targets and snap percentage. Click a name to open that player.
Game log
Games2
PPR/G1.4
Game log
Arroyo avg 1.4NFL top 12 TEs avg 13.3
Solid dot is what he scored. Hollow dot is our projection before the game.
| Use | Game | Proj | PPR | Tgt | Rec | Rec Yd | Car | Rush Yd | TD | Snap |
|---|---|---|---|---|---|---|---|---|---|---|
| W2vs ARI | 3.6 | 2.7 | 1 | 1 | 17 | 0 | 0 | 0 | 21% | |
| W5vs SF | 2.4 | 0 | 1 | 0 | 0 | 0 | 0 | 0 | 32% |
Opponent color:Easy defense for TEsAverageTough
Schedule ahead
11 bye12 SF13 DAL14 NYG15 PHI16 LA17 CAR18 LA
Green easier, red tougher
Schedule ahead
Colored by what each defense has given up to TEs so far. Green is an easier matchup, red is a tougher one.
Wk 11 byeWk 12 SFWk 13 DALWk 14 NYGWk 15 PHIWk 16 LAWk 17 CARWk 18 LASee every team's TE schedule ›
StatPer gameSeasonRank
Overall
Games—21›
PPR points1.42.715›
Receiving
Targets1214›
Catches0.518›
Receiving yards8.51722›
Yards per target8.5—80›
Rushing
Scrimmage yards8.51722›
Usage
Snap %27%—1›
Target share %3.8%—16›
Touch share %1.7%—8›
Air yards share %7.9%3256›
Tap any stat to see everyone ranked. Bars: green top 30%, yellow middle, red bottom 40%.
Mania breakdown
Fantasy Production16
Target Volume12
Team Target Role23
Red-Zone Threat0
Per-Target Efficiency40
Mania breakdown
Percentile among TEs. 100 is the best, 50 is average.
How many fantasy points and total yards he is actually producing, compared with players at his position. Ranks better than 16% of TEs.
How often he is targeted: targets per game, receptions and his share of the team targets. Ranks better than 12% of TEs.
How big a slice of his team passing game belongs to him: target share, air-yard share and snaps. Ranks better than 23% of TEs.
How often the offense uses him near the goal line: red-zone targets and end-zone targets. Ranks better than 0% of TEs.
What he produces with each chance instead of just rewarding volume: yards per target, catch rate and fantasy points per opportunity. Ranks better than 40% of TEs.
Top 30%MiddleBottom 40%Tap a category to see what it means.
Usage
Snaps
27%
Target share
4%
Targets/G
1.0
PPR/G
1.4
By the numbers
PPR / Game
1.4
15th percentileTE avg 5.9
Targets / Game
1
14th percentileTE avg 3.2
Receiving Yards / Game
8.5
22nd percentileTE avg 23.3
Receptions / Game
0.5
8th percentileTE avg 2.3
Share of Team Targets
3.8%
16th percentileTE avg 10.4%
Share of Team Air Yards
7.9%
56th percentileTE avg 8.5%
Red-Zone Targets / Game
0
13th percentileTE avg 0.5
End-Zone Targets / Game
0
35th percentileTE avg 0.2
Snap Share
26.5%
1st percentileTE avg 56.9%
TDs / Game
0
34th percentileTE avg 0.2