

Cole Kmet
 CHI • TE • 7 games
Pick a teammate with or without. Pick more than one to combine them, like a game without the QB and without the other back.

16.0 PPR points a game allowed to tight ends, 7th most of 32 defenses.
| Player | PPR | Tgt | Rec | Rec Yd | Rec TD | Rush Yd |
|---|---|---|---|---|---|---|
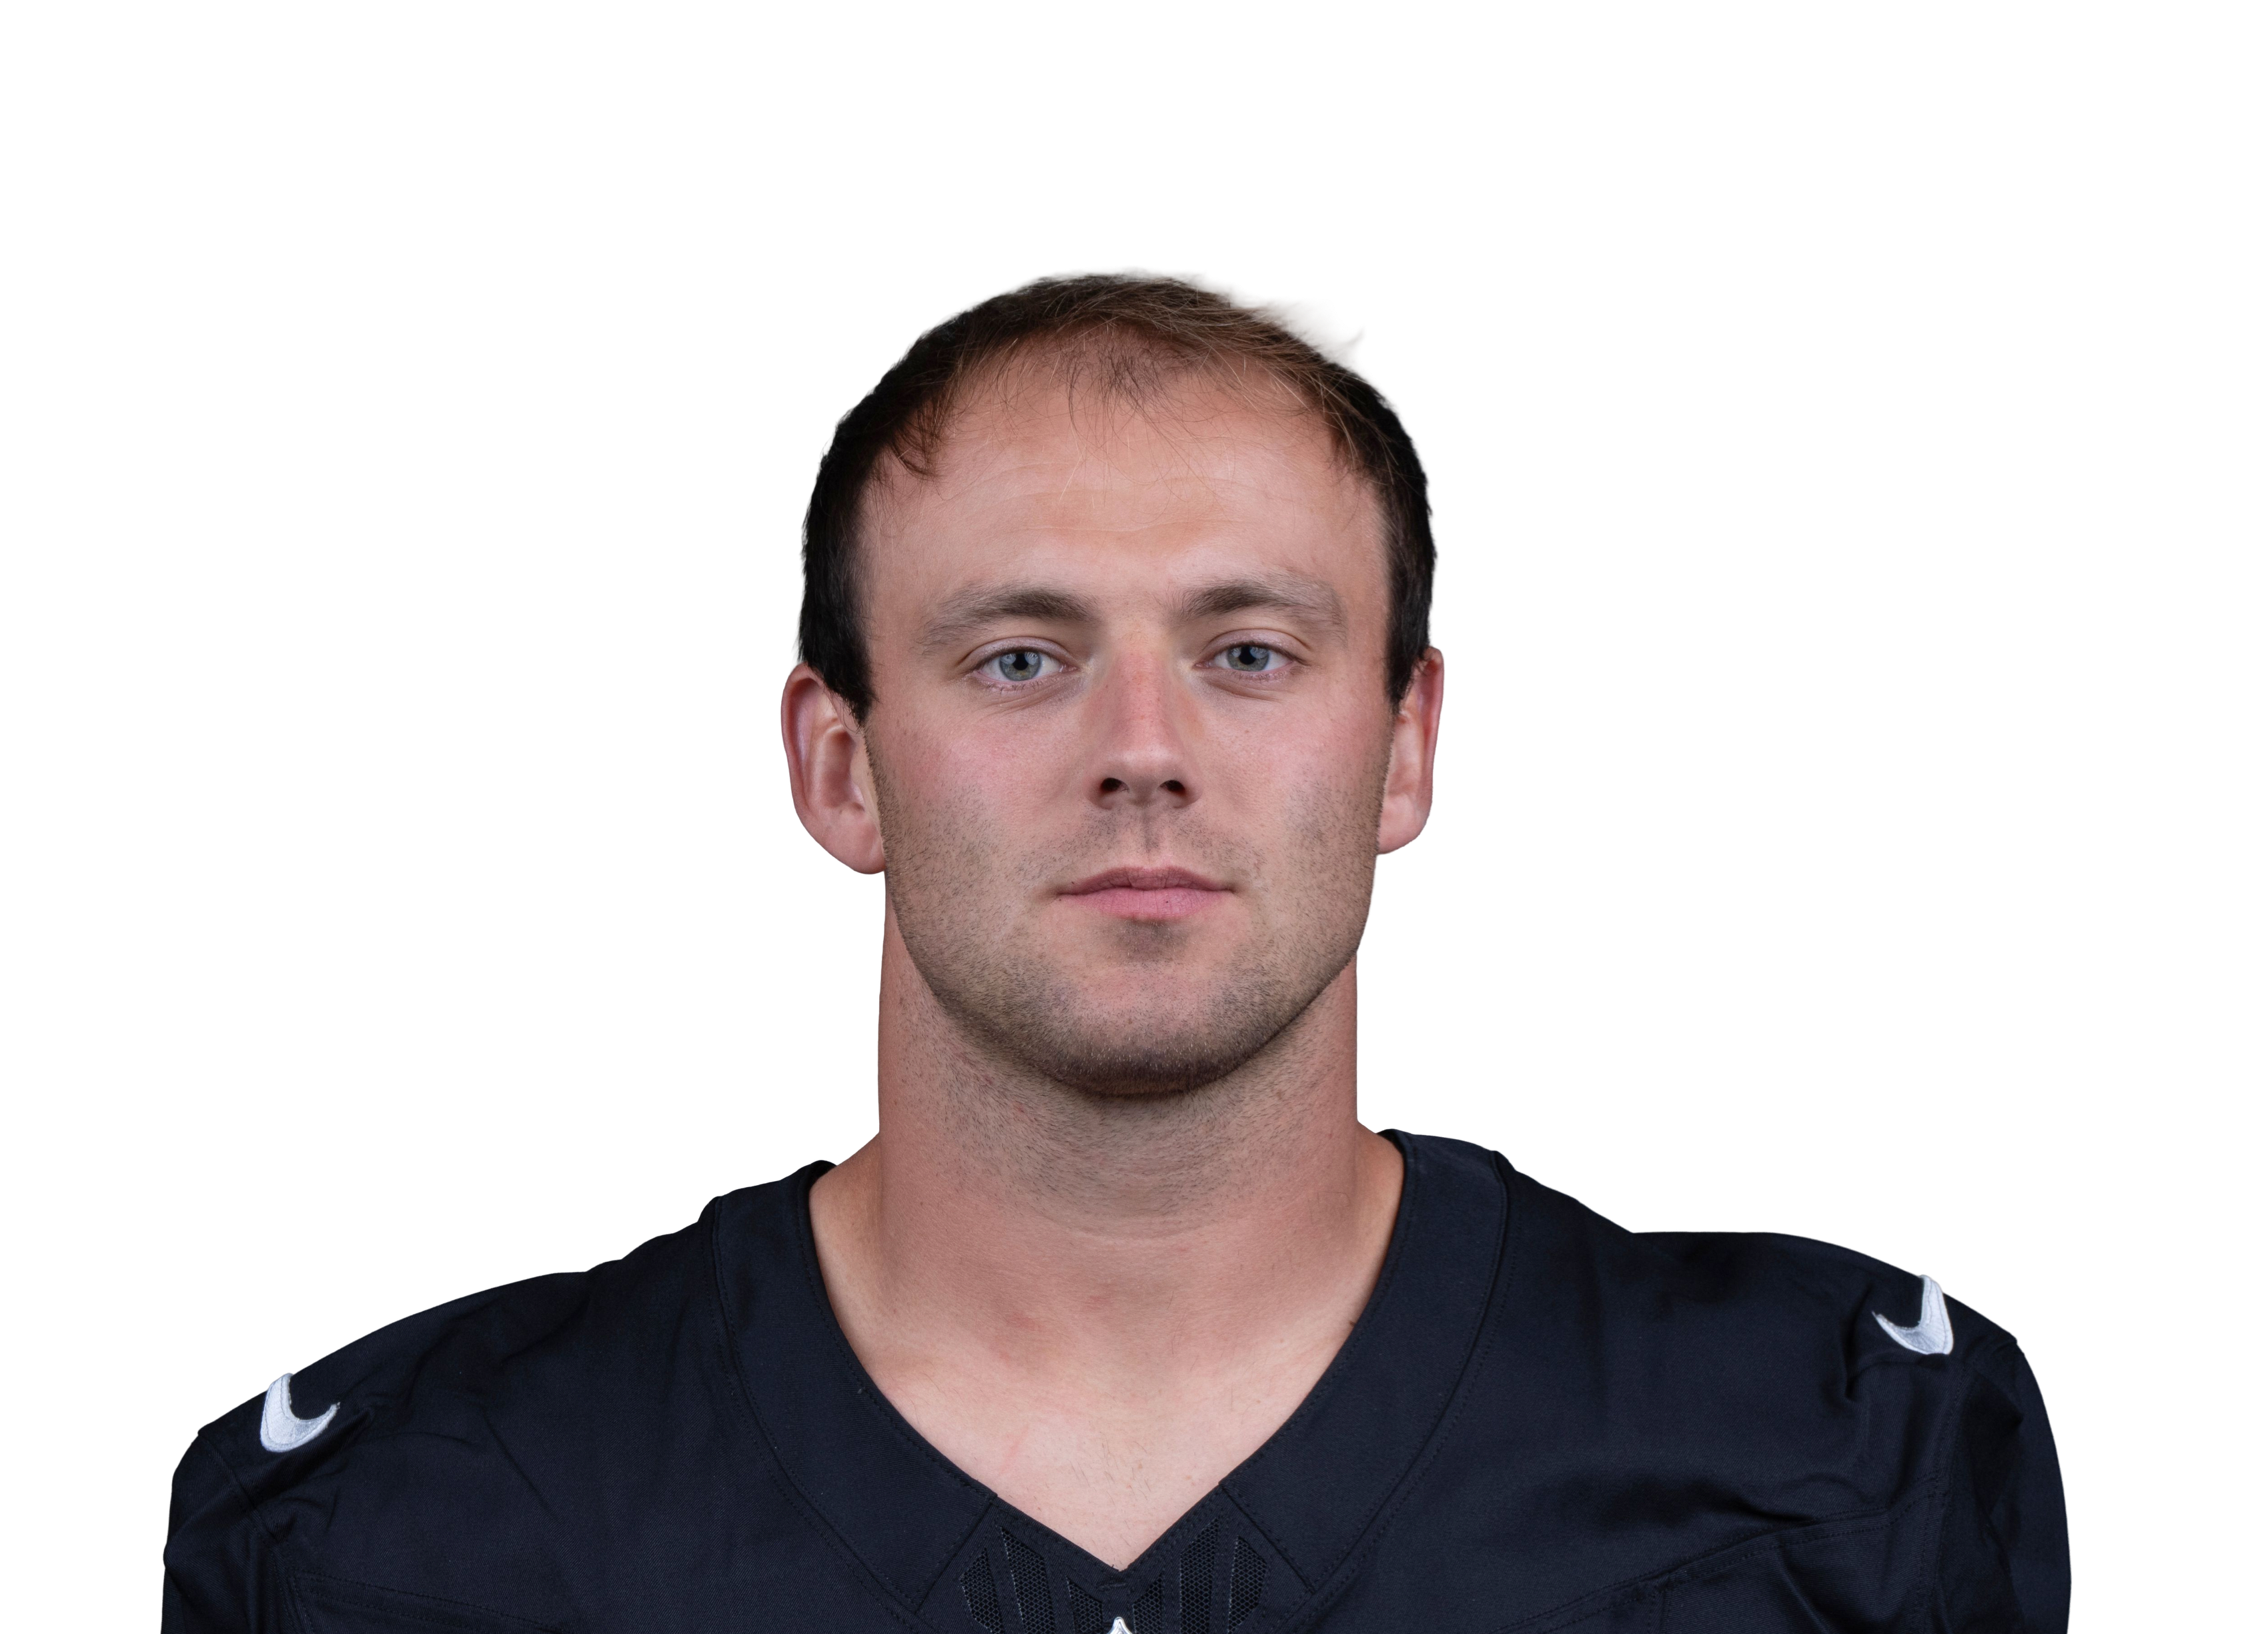 Brock Bowersvs LV • Wk 3 | 27.6 | 13 | 10 | 116 | 1 | 0 |
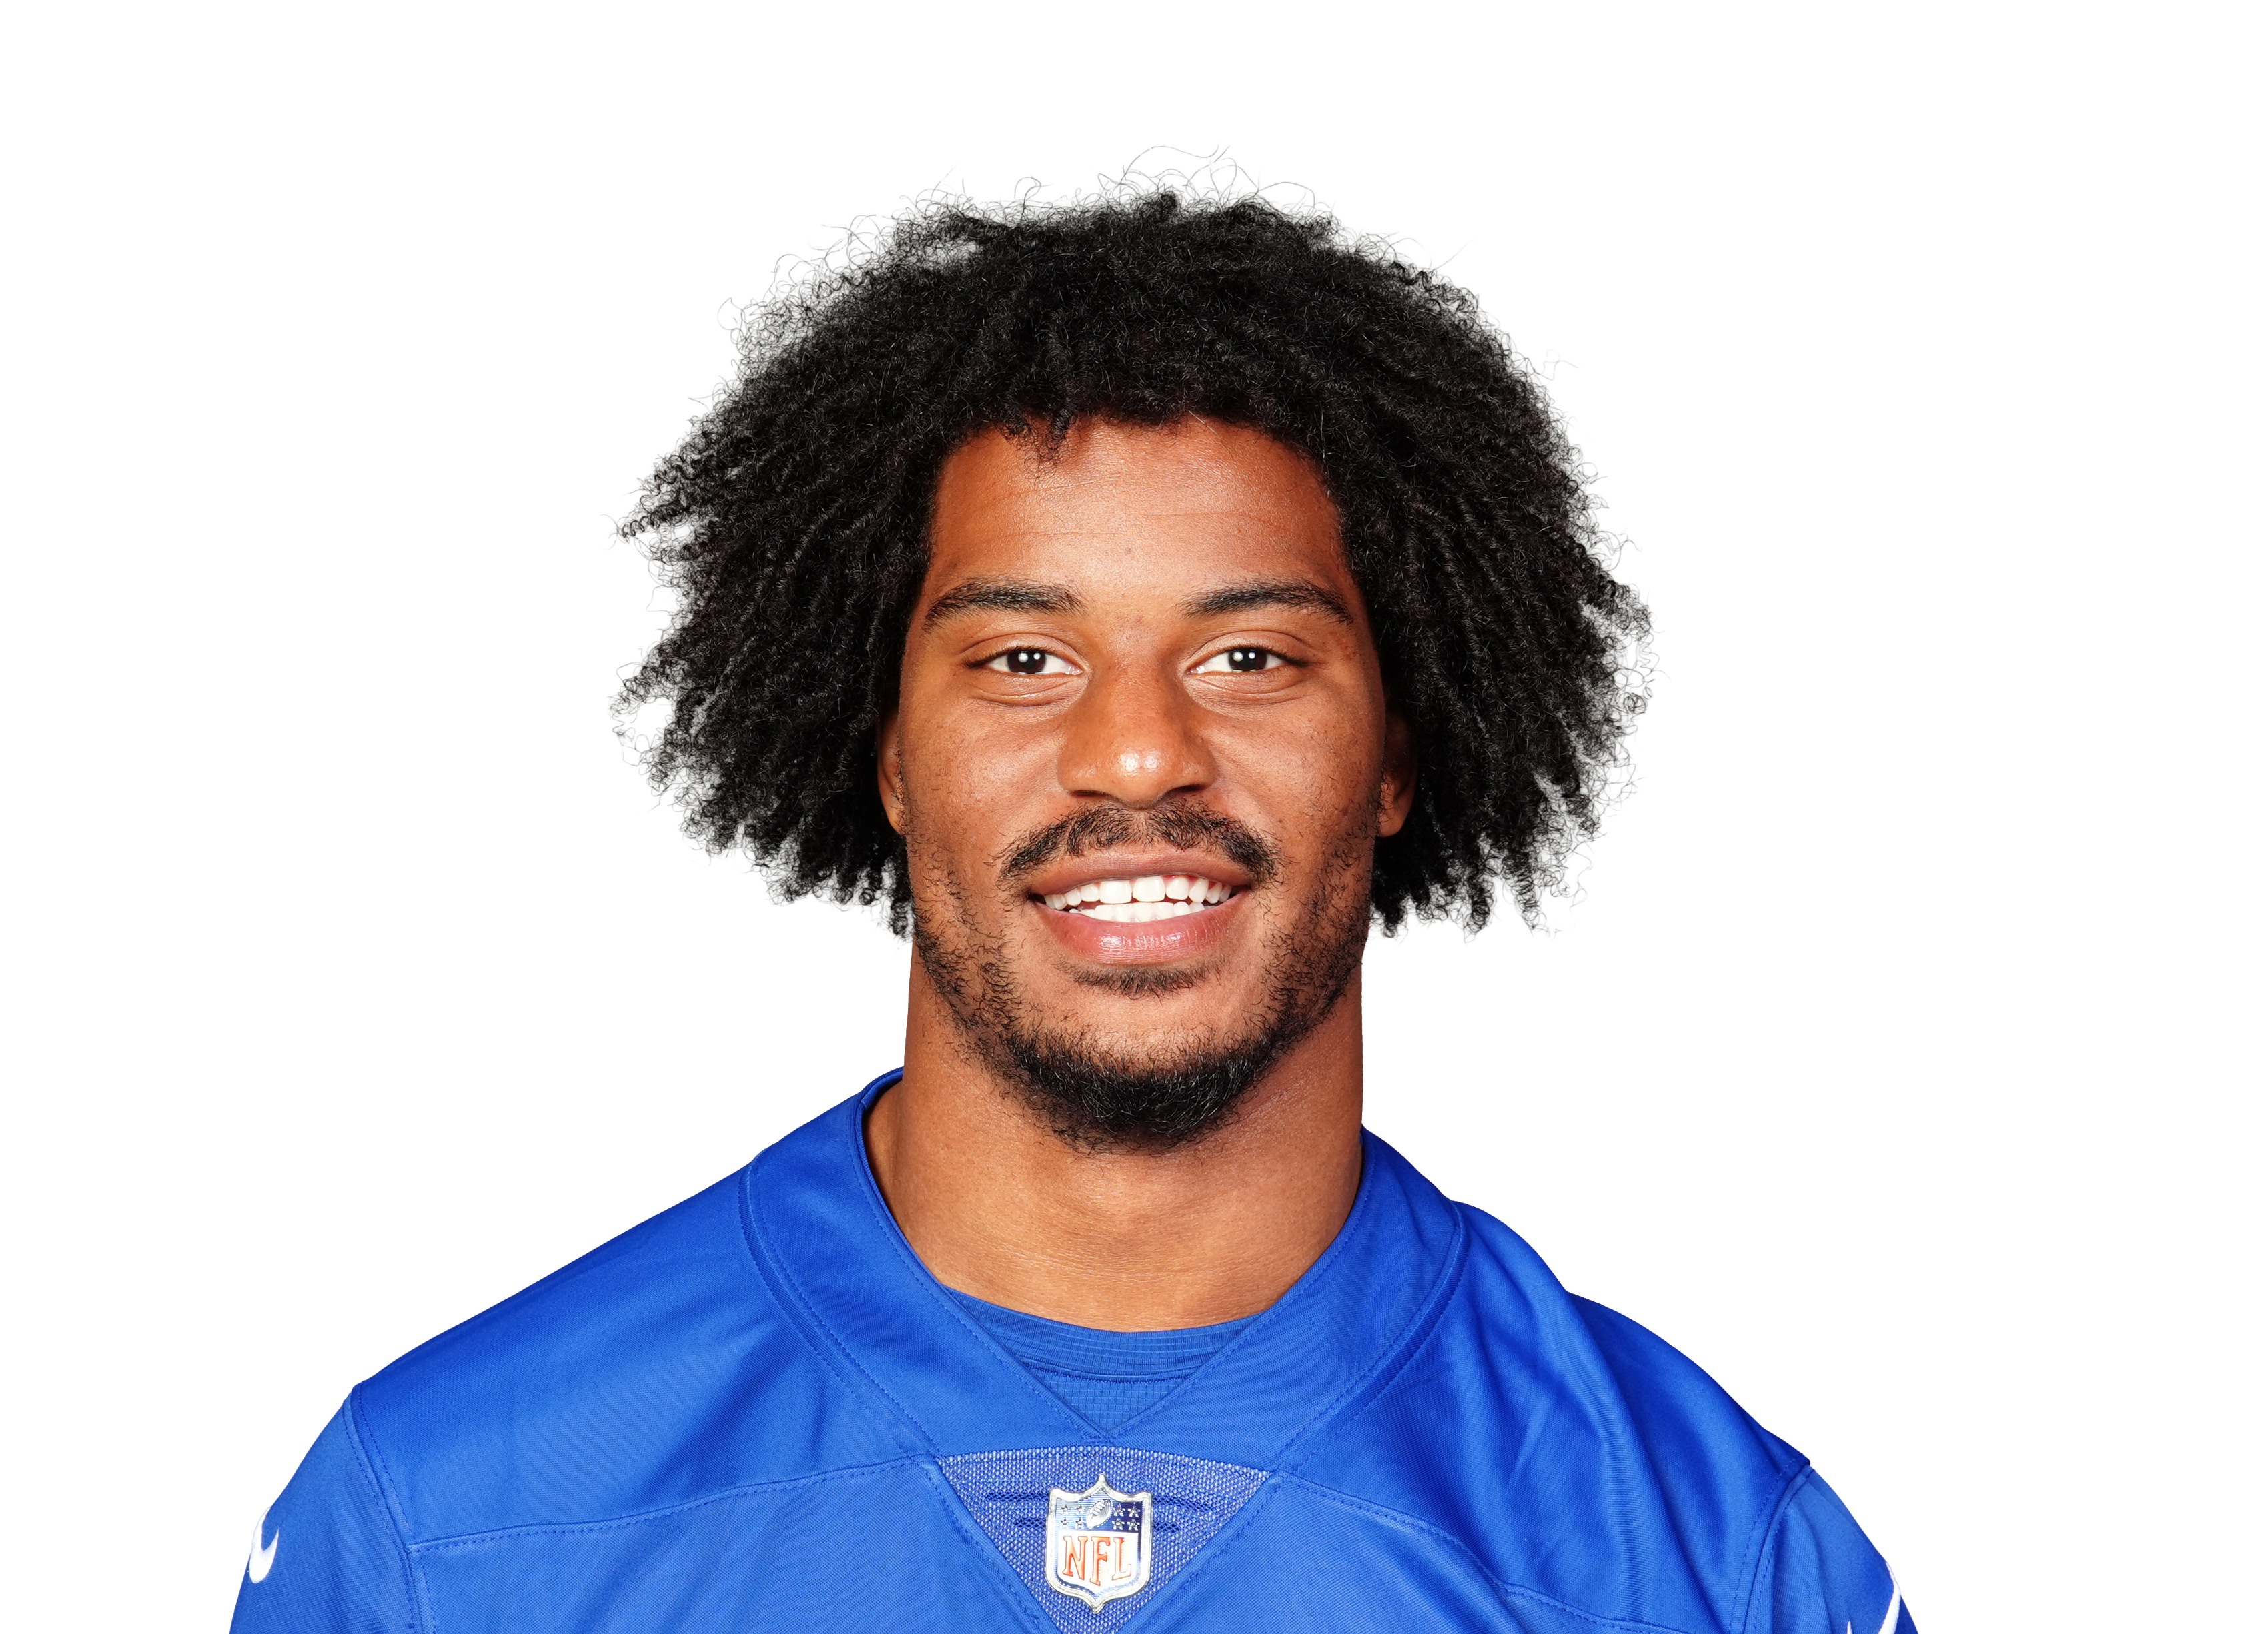 Isaiah Likely@ NYG • Wk 6 | 23.9 | 11 | 6 | 99 | 1 | 0 |
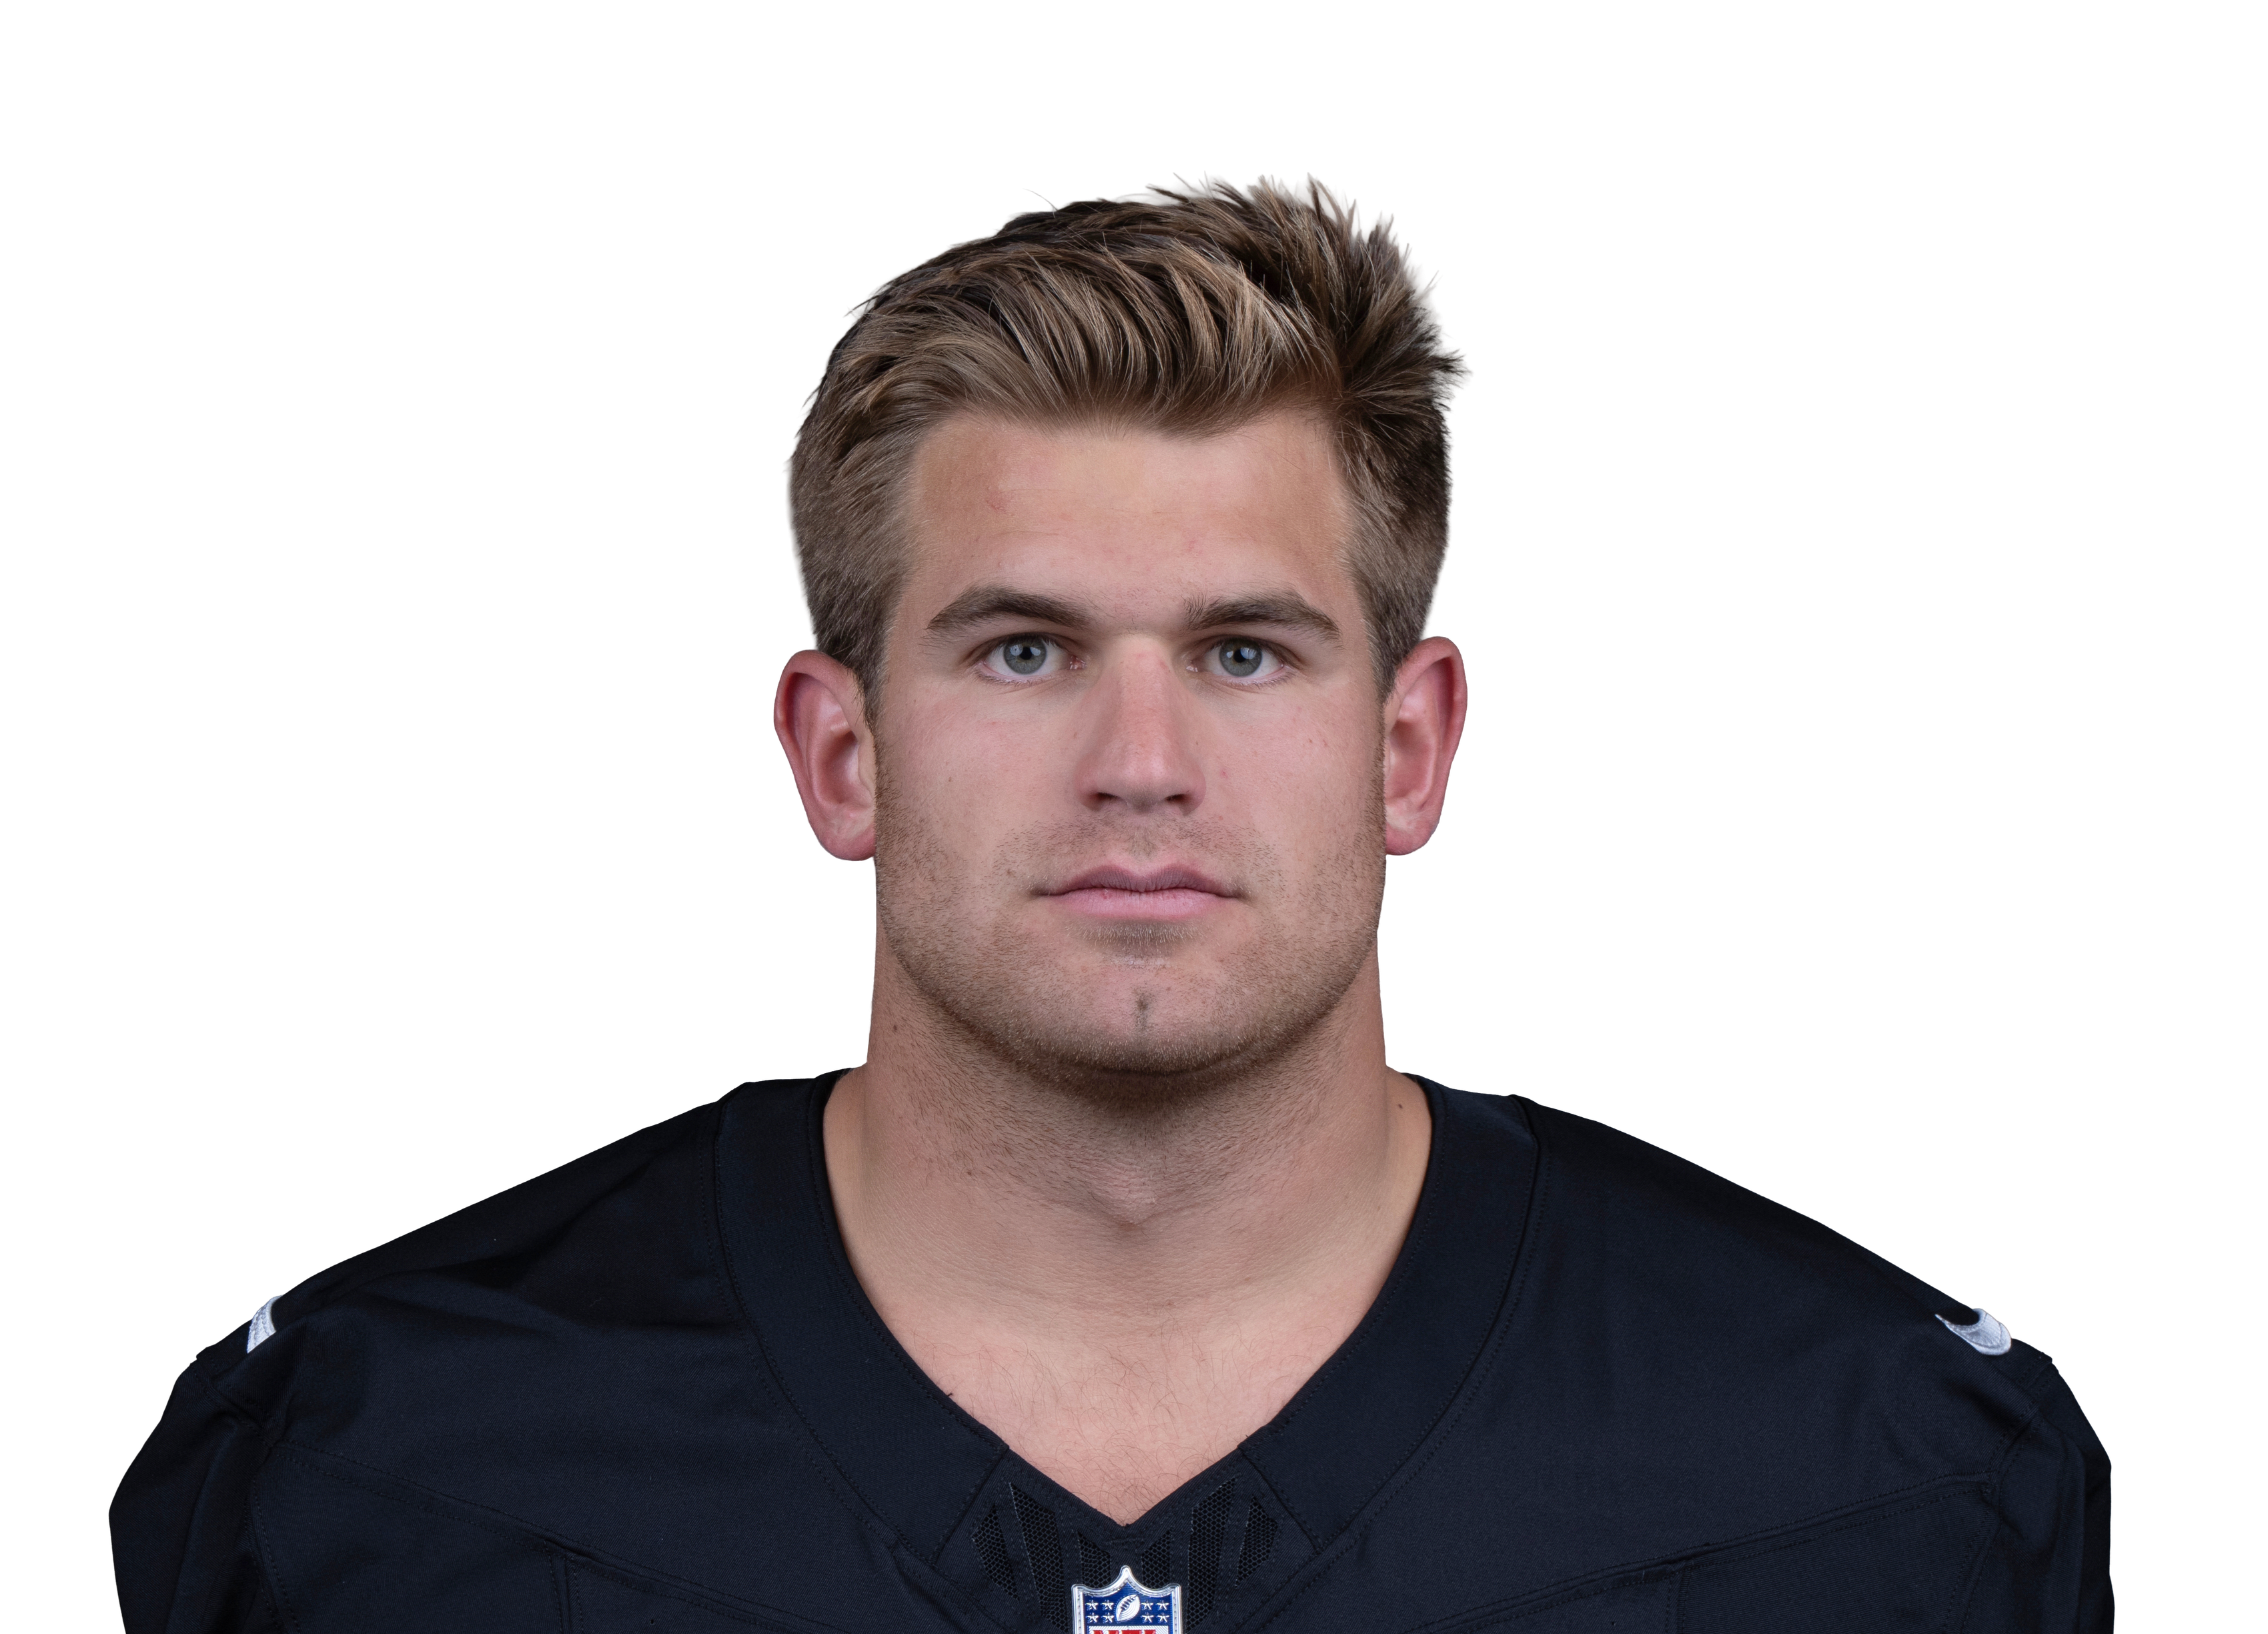 Michael Mayervs LV • Wk 3 | 12.2 | 3 | 3 | 32 | 1 | 0 |
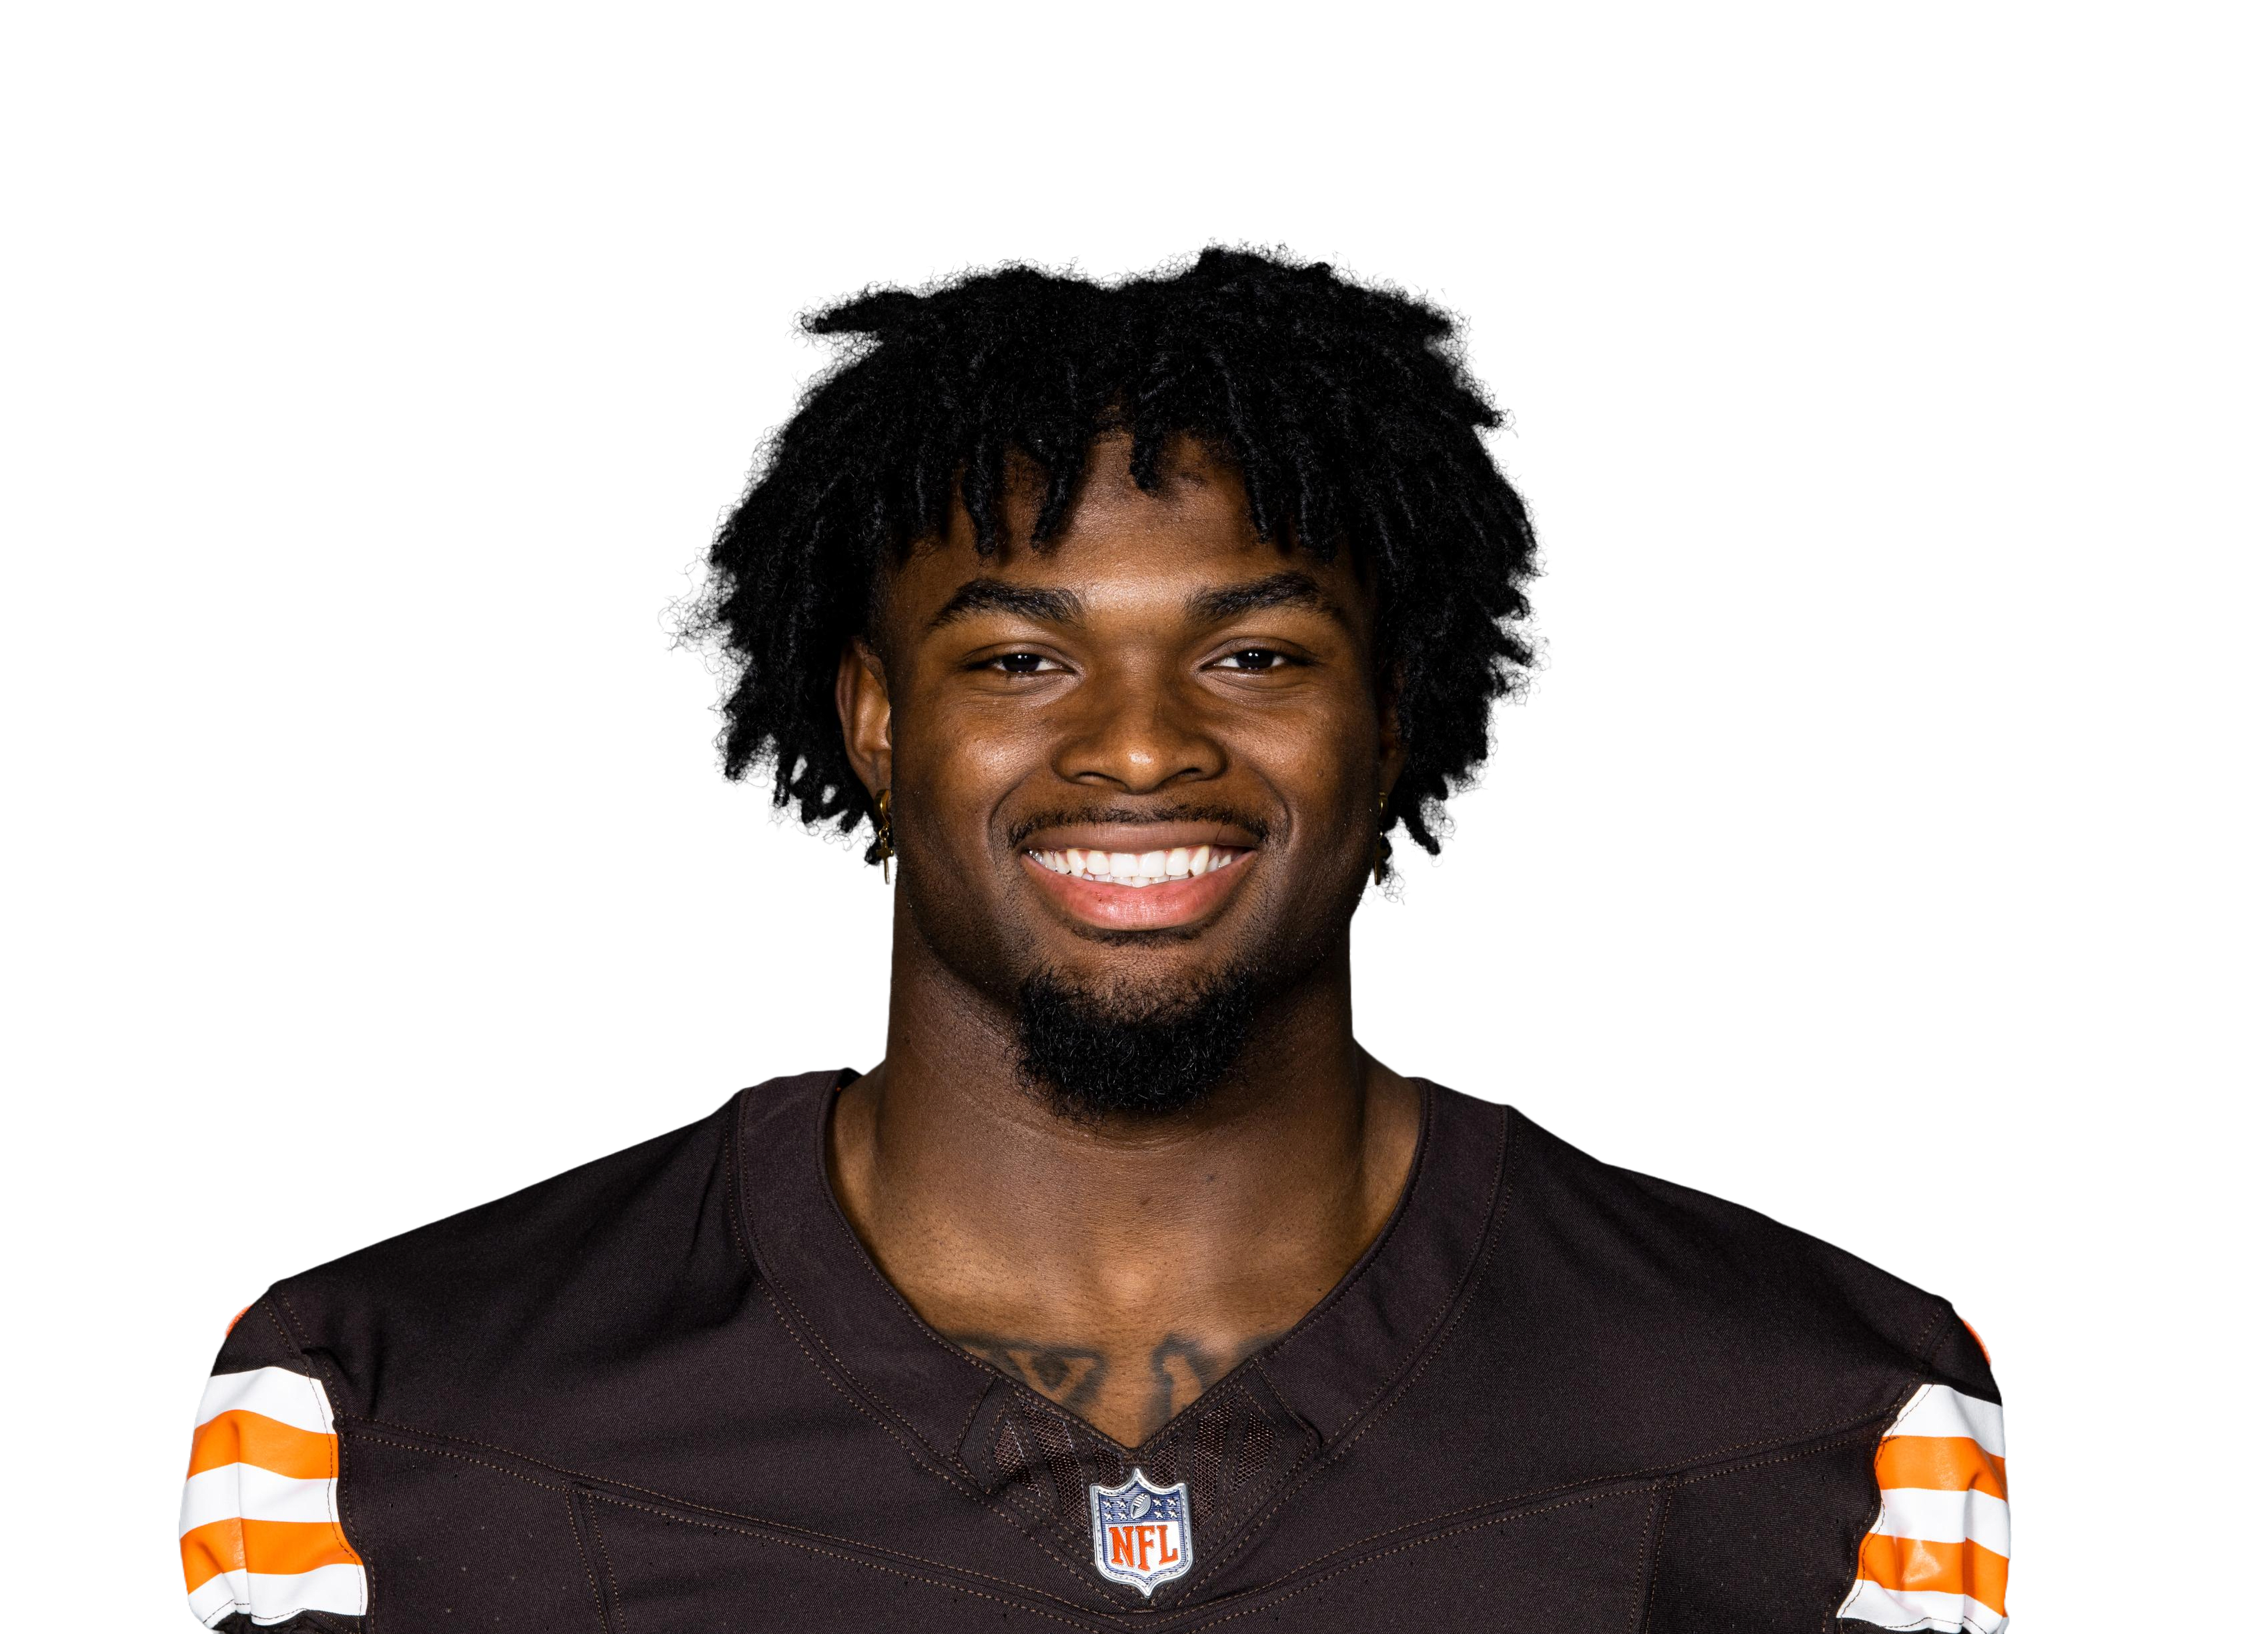 Harold Fannin Jr.vs CLE • Wk 9 | 12.2 | 2 | 2 | 42 | 1 | 0 |
 Mark Andrews@ BAL • Wk 2 | 10.9 | 7 | 6 | 49 | 0 | 0 |
 Sam LaPorta@ DET • Wk 1 | 9.8 | 8 | 5 | 48 | 0 | 0 |
 Tommy Tremblevs CAR • Wk 10 | 8.8 | 5 | 4 | 48 | 0 | 0 |
 Gavin Bartholomewvs MIN • Wk 5 | 8.3 | 6 | 5 | 33 | 0 | 0 |
 Kyle Pittsvs ATL • Wk 4 | 7.7 | 3 | 3 | 47 | 0 | 0 |
 Darnell Washingtonvs PIT • Wk 7 | 7.4 | 1 | 1 | 4 | 1 | 0 |
 Darren Wallervs CAR • Wk 10 | 4.4 | 4 | 2 | 24 | 0 | 0 |
 Pat Freiermuthvs PIT • Wk 7 | 4.0 | 4 | 2 | 20 | 0 | 0 |
 Ben Yurosekvs MIN • Wk 5 | 2.0 | 1 | 1 | 10 | 0 | 0 |
 Austin Hoopervs ATL • Wk 4 | 1.9 | 1 | 1 | 9 | 0 | 0 |
 T.J. Hockensonvs MIN • Wk 5 | 1.7 | 1 | 1 | 7 | 0 | 0 |
 Brock Wright@ DET • Wk 1 | 1.5 | 1 | 1 | 5 | 0 | 0 |
 Durham Smythe@ BAL • Wk 2 | 0.0 | 1 | 0 | 0 | 0 | 0 |
 Charlie Woernervs ATL • Wk 4 | 0.0 | 1 | 0 | 0 | 0 | 0 |
 Blake Whiteheartvs CLE • Wk 9 | 0.0 | 1 | 0 | 0 | 0 | 0 |
 Mitchell Evansvs CAR • Wk 10 | 0.0 | 1 | 0 | 0 | 0 | 0 |
Fantasy points first, then the stats that matter for his position. Ring around each photo is that player's Mania Rating. Tap a name to open his profile.
| Player | W1 | W2 | W3 | W4 | W5 | W6 | W7 | W8 | W9 | Per game |
|---|---|---|---|---|---|---|---|---|---|---|
| Colston Loveland | 20 yds8% targets87% snaps | 33 yds10% targets86% snaps | 431 yds12% targets79% snaps | 957 yds29% targets92% snaps | 519 yds13% targets80% snaps | 765 yds21% targets88% snaps | 1269 yds40% targets84% snaps | 965 yds27% targets93% snaps | 654 yds17% targets87% snaps | 6.340 yds a game • 6.4 per target20% targets86% snaps |
| Cole Kmet | 335 yds12% targets57% snaps | 10 yds3% targets69% snaps | 10 yds3% targets60% snaps | 213 yds7% targets73% snaps | 28 yds5% targets42% snaps | 23 yds6% targets74% snaps | 328 yds10% targets55% snaps | — | — | 2.012 yds a game • 6.2 per target6% targets61% snaps |
| Stephen Carlson | — | — | — | — | — | — | — | — | 00 yds0% targets21% snaps | 0.00 yds a game0% targets21% snaps |
| Sam Roush | — | 39 yds10% targets27% snaps | 116 yds3% targets22% snaps | 18 yds3% targets25% snaps | 00 yds0% targets7% snaps | 00 yds0% targets31% snaps | — | — | 223 yds6% targets52% snaps | 1.29 yds a game • 8.0 per target4% targets27% snaps |
| Use | Game | Proj | PPR | Tgt | Rec | Rec Yd | Car | Rush Yd | TD | Snap |
|---|---|---|---|---|---|---|---|---|---|---|
W1 vs CAR | 6.3 | 11.5 | 3 | 2 | 35 | 0 | 0 | 1 | 57% | |
W2 vs MIN | 5.1 | 0 | 1 | 0 | 0 | 0 | 0 | 0 | 69% | |
W3 vs PHI | 4.1 | 0 | 1 | 0 | 0 | 0 | 0 | 0 | 60% | |
W4 vs NYJ | 4.2 | 3.3 | 2 | 2 | 13 | 0 | 0 | 0 | 73% | |
W5 vs GB | 4.0 | 1.8 | 2 | 1 | 8 | 0 | 0 | 0 | 42% | |
W6 vs ATL | 3.9 | 2.3 | 2 | 2 | 3 | 0 | 0 | 0 | 74% | |
W7 vs NE | 4.2 | 5.8 | 3 | 3 | 28 | 0 | 0 | 0 | 55% |
Too few plays to rank yet (needs 35 targets, he has 14). Here are his raw numbers so far.
Cole Kmet
CHI • TE • 7 gamesPick a teammate with or without. Pick more than one to combine them, like a game without the QB and without the other back.
| Player | W1 | W2 | W3 | W4 | W5 | W6 | W7 | W8 | W9 | Per game |
|---|---|---|---|---|---|---|---|---|---|---|
| Colston Loveland | 20 yds8% targets87% snaps | 33 yds10% targets86% snaps | 431 yds12% targets79% snaps | 957 yds29% targets92% snaps | 519 yds13% targets80% snaps | 765 yds21% targets88% snaps | 1269 yds40% targets84% snaps | 965 yds27% targets93% snaps | 654 yds17% targets87% snaps | 6.340 yds a game • 6.4 per target20% targets86% snaps |
| Cole Kmet | 335 yds12% targets57% snaps | 10 yds3% targets69% snaps | 10 yds3% targets60% snaps | 213 yds7% targets73% snaps | 28 yds5% targets42% snaps | 23 yds6% targets74% snaps | 328 yds10% targets55% snaps | — | — | 2.012 yds a game • 6.2 per target6% targets61% snaps |
| Stephen Carlson | — | — | — | — | — | — | — | — | 00 yds0% targets21% snaps | 0.00 yds a game0% targets21% snaps |
| Sam Roush | — | 39 yds10% targets27% snaps | 116 yds3% targets22% snaps | 18 yds3% targets25% snaps | 00 yds0% targets7% snaps | 00 yds0% targets31% snaps | — | — | 223 yds6% targets52% snaps | 1.29 yds a game • 8.0 per target4% targets27% snaps |
| Use | Game | Proj | PPR | Tgt | Rec | Rec Yd | Car | Rush Yd | TD | Snap |
|---|---|---|---|---|---|---|---|---|---|---|
| W1vs CAR | 6.3 | 11.5 | 3 | 2 | 35 | 0 | 0 | 1 | 57% | |
| W2vs MIN | 5.1 | 0 | 1 | 0 | 0 | 0 | 0 | 0 | 69% | |
| W3vs PHI | 4.1 | 0 | 1 | 0 | 0 | 0 | 0 | 0 | 60% | |
| W4vs NYJ | 4.2 | 3.3 | 2 | 2 | 13 | 0 | 0 | 0 | 73% | |
| W5vs GB | 4.0 | 1.8 | 2 | 1 | 8 | 0 | 0 | 0 | 42% | |
| W6vs ATL | 3.9 | 2.3 | 2 | 2 | 3 | 0 | 0 | 0 | 74% | |
| W7vs NE | 4.2 | 5.8 | 3 | 3 | 28 | 0 | 0 | 0 | 55% |
Too few plays to rank yet (needs 35 targets, he has 14). Here are his raw numbers so far.
16.0 PPR points a game allowed to tight ends, 7th most of 32 defenses.
| Player | PPR | Tgt | Rec | Rec Yd | Rec TD | Rush Yd |
|---|---|---|---|---|---|---|
| Brock Bowersvs LV • Wk 3 | 27.6 | 13 | 10 | 116 | 1 | 0 |
| Isaiah Likely@ NYG • Wk 6 | 23.9 | 11 | 6 | 99 | 1 | 0 |
| Michael Mayervs LV • Wk 3 | 12.2 | 3 | 3 | 32 | 1 | 0 |
| Harold Fannin Jr.vs CLE • Wk 9 | 12.2 | 2 | 2 | 42 | 1 | 0 |
| Mark Andrews@ BAL • Wk 2 | 10.9 | 7 | 6 | 49 | 0 | 0 |
| Sam LaPorta@ DET • Wk 1 | 9.8 | 8 | 5 | 48 | 0 | 0 |
| Tommy Tremblevs CAR • Wk 10 | 8.8 | 5 | 4 | 48 | 0 | 0 |
| Gavin Bartholomewvs MIN • Wk 5 | 8.3 | 6 | 5 | 33 | 0 | 0 |
| Kyle Pittsvs ATL • Wk 4 | 7.7 | 3 | 3 | 47 | 0 | 0 |
| Darnell Washingtonvs PIT • Wk 7 | 7.4 | 1 | 1 | 4 | 1 | 0 |
| Darren Wallervs CAR • Wk 10 | 4.4 | 4 | 2 | 24 | 0 | 0 |
| Pat Freiermuthvs PIT • Wk 7 | 4.0 | 4 | 2 | 20 | 0 | 0 |
| Ben Yurosekvs MIN • Wk 5 | 2.0 | 1 | 1 | 10 | 0 | 0 |
| Austin Hoopervs ATL • Wk 4 | 1.9 | 1 | 1 | 9 | 0 | 0 |
| T.J. Hockensonvs MIN • Wk 5 | 1.7 | 1 | 1 | 7 | 0 | 0 |
| Brock Wright@ DET • Wk 1 | 1.5 | 1 | 1 | 5 | 0 | 0 |
| Durham Smythe@ BAL • Wk 2 | 0.0 | 1 | 0 | 0 | 0 | 0 |
| Charlie Woernervs ATL • Wk 4 | 0.0 | 1 | 0 | 0 | 0 | 0 |
| Blake Whiteheartvs CLE • Wk 9 | 0.0 | 1 | 0 | 0 | 0 | 0 |
| Mitchell Evansvs CAR • Wk 10 | 0.0 | 1 | 0 | 0 | 0 | 0 |
Fantasy points first, then the stats that matter for his position. Ring around each photo is that player's Mania Rating. Tap a name to open his profile.