
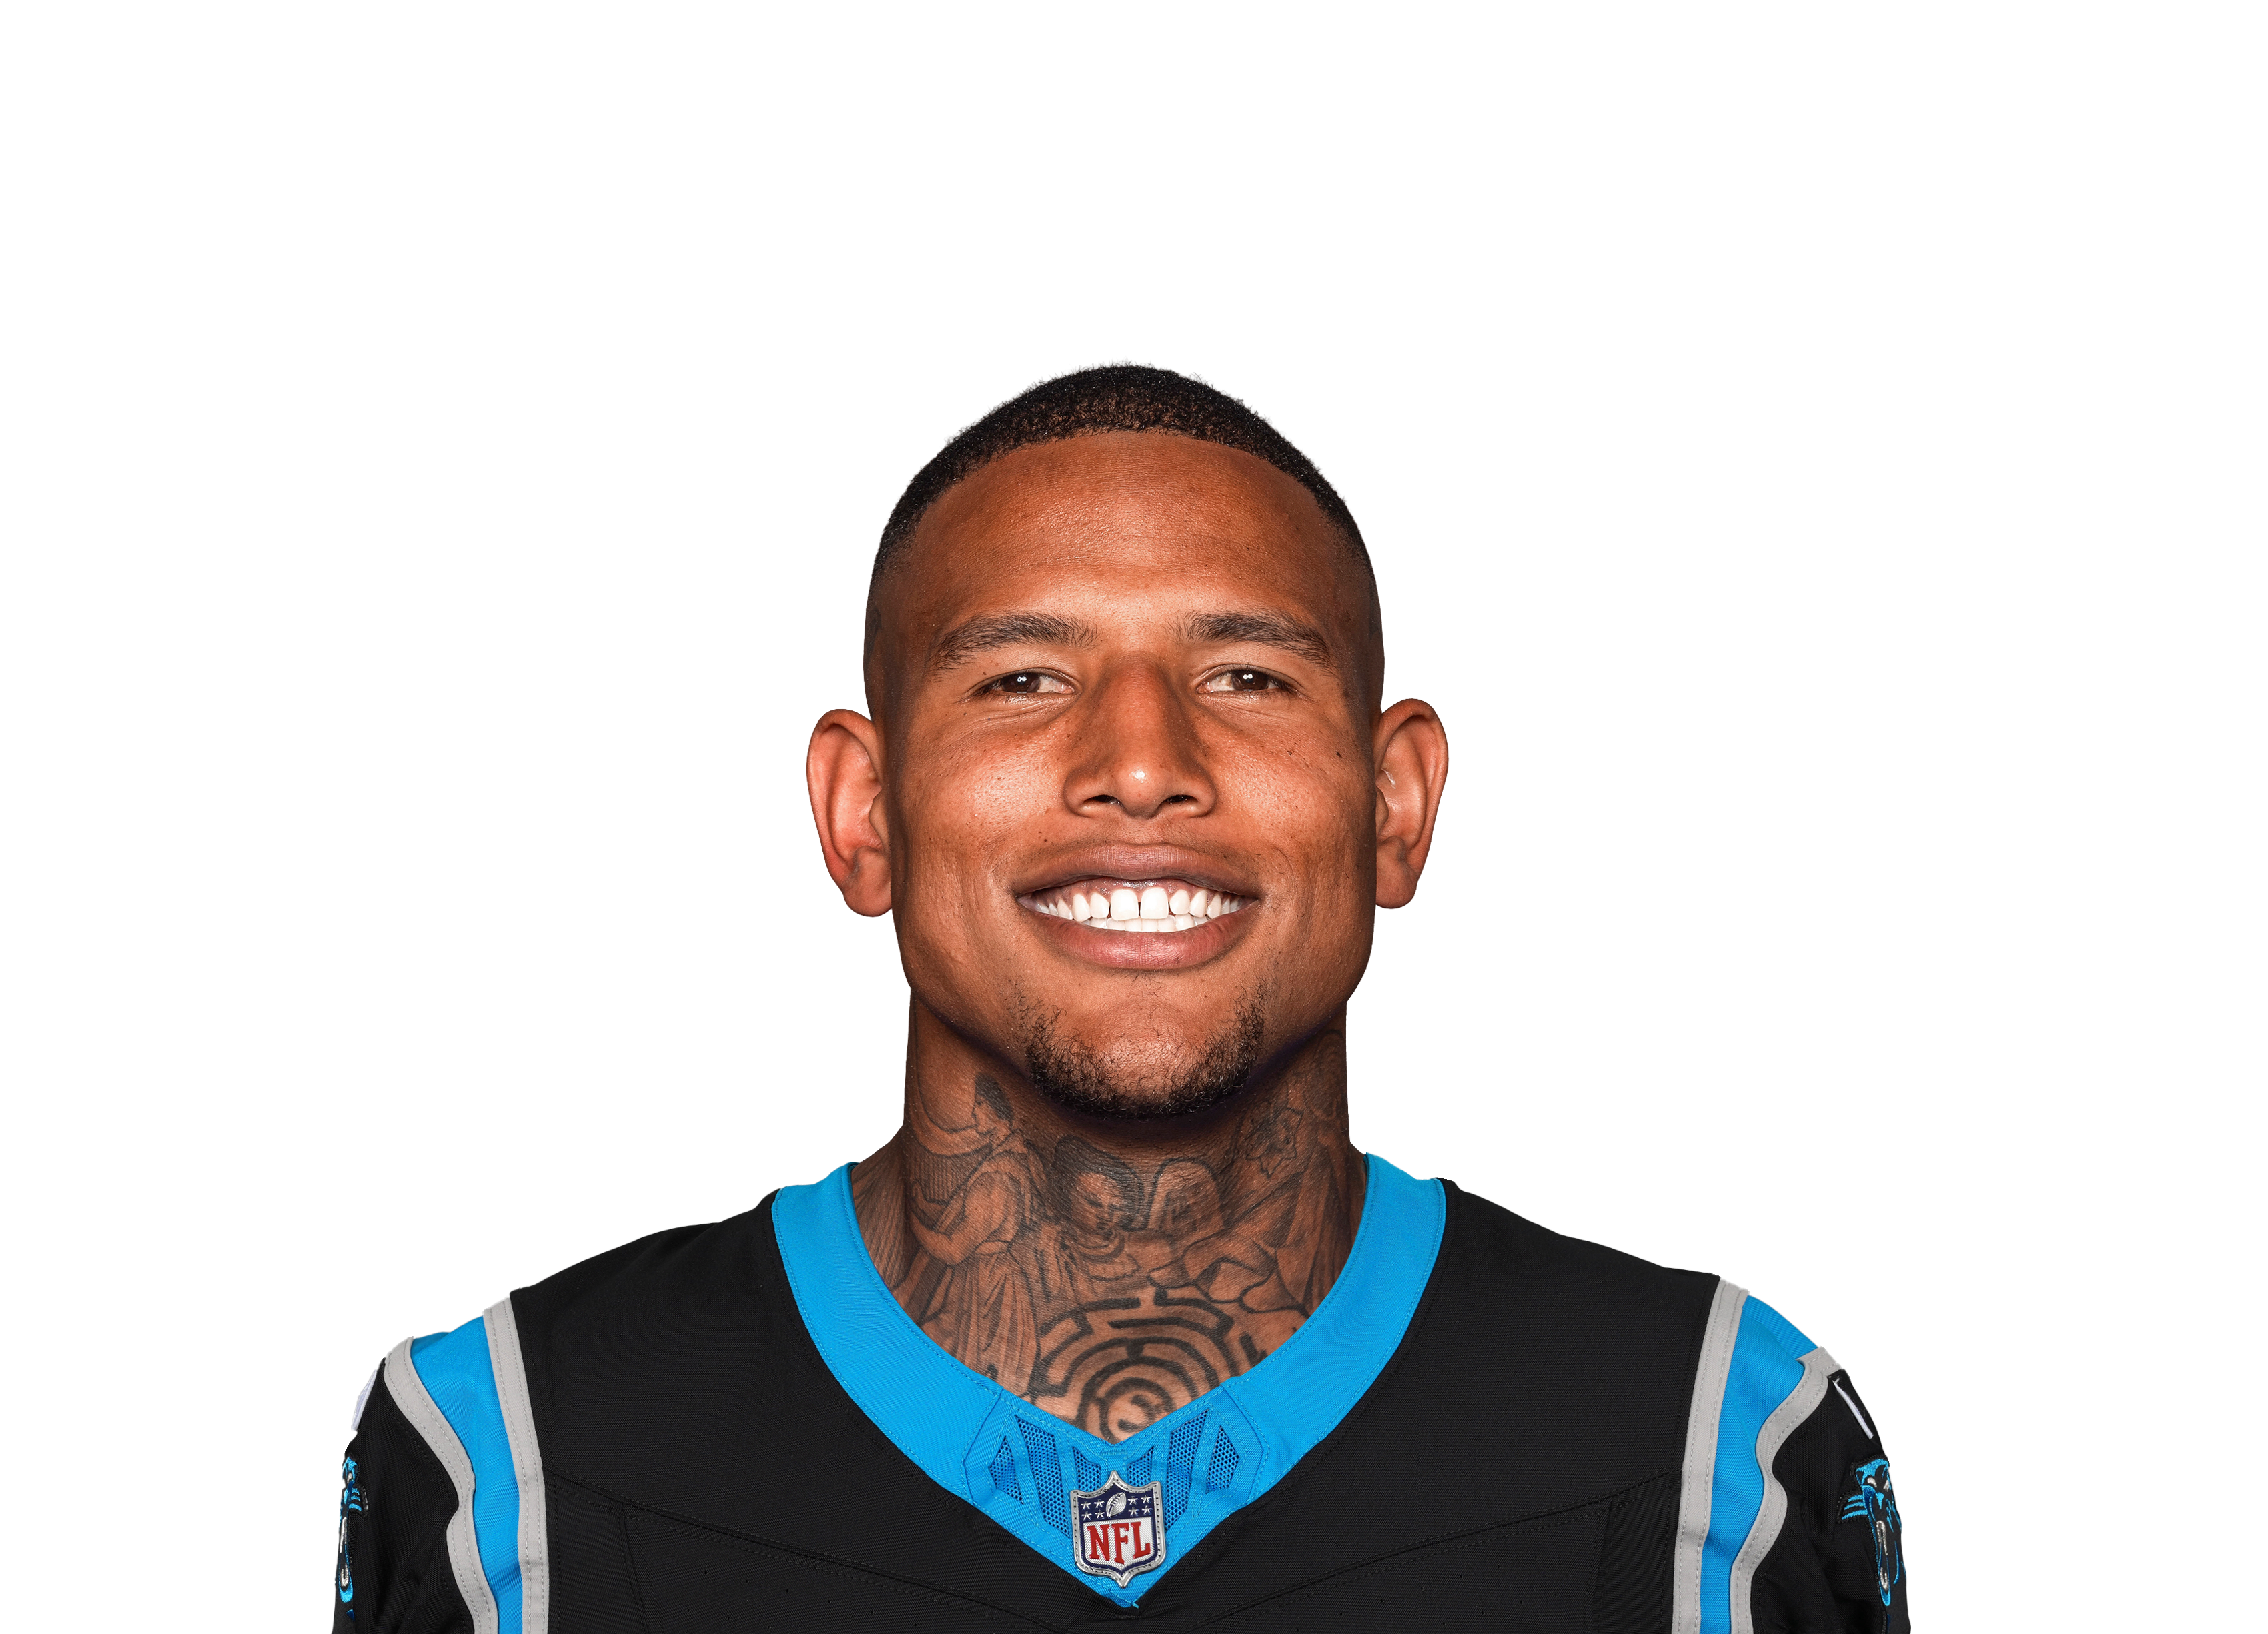
Darren Waller
Pick a teammate with or without. Pick more than one to combine them, like a game without the QB and without the other back.
Questionable (Knee) • Rating -1.52 teammate notes ▾
 CAR
 BAL
How this is built
12.9 PPR points a game allowed to tight ends, 17th most of 32 defenses.
| Player | PPR | Tgt | Rec | Rec Yd | Rec TD | Rush Yd |
|---|---|---|---|---|---|---|
 Dalton Kincaid@ BUF • Wk 8 | 18.6 | 6 | 4 | 86 | 1 | 0 |
 Kyle Pitts@ ATL • Wk 5 | 15.2 | 6 | 5 | 42 | 1 | 0 |
 Juwan Johnsonvs NO • Wk 2 | 10.6 | 4 | 4 | 66 | 0 | 0 |
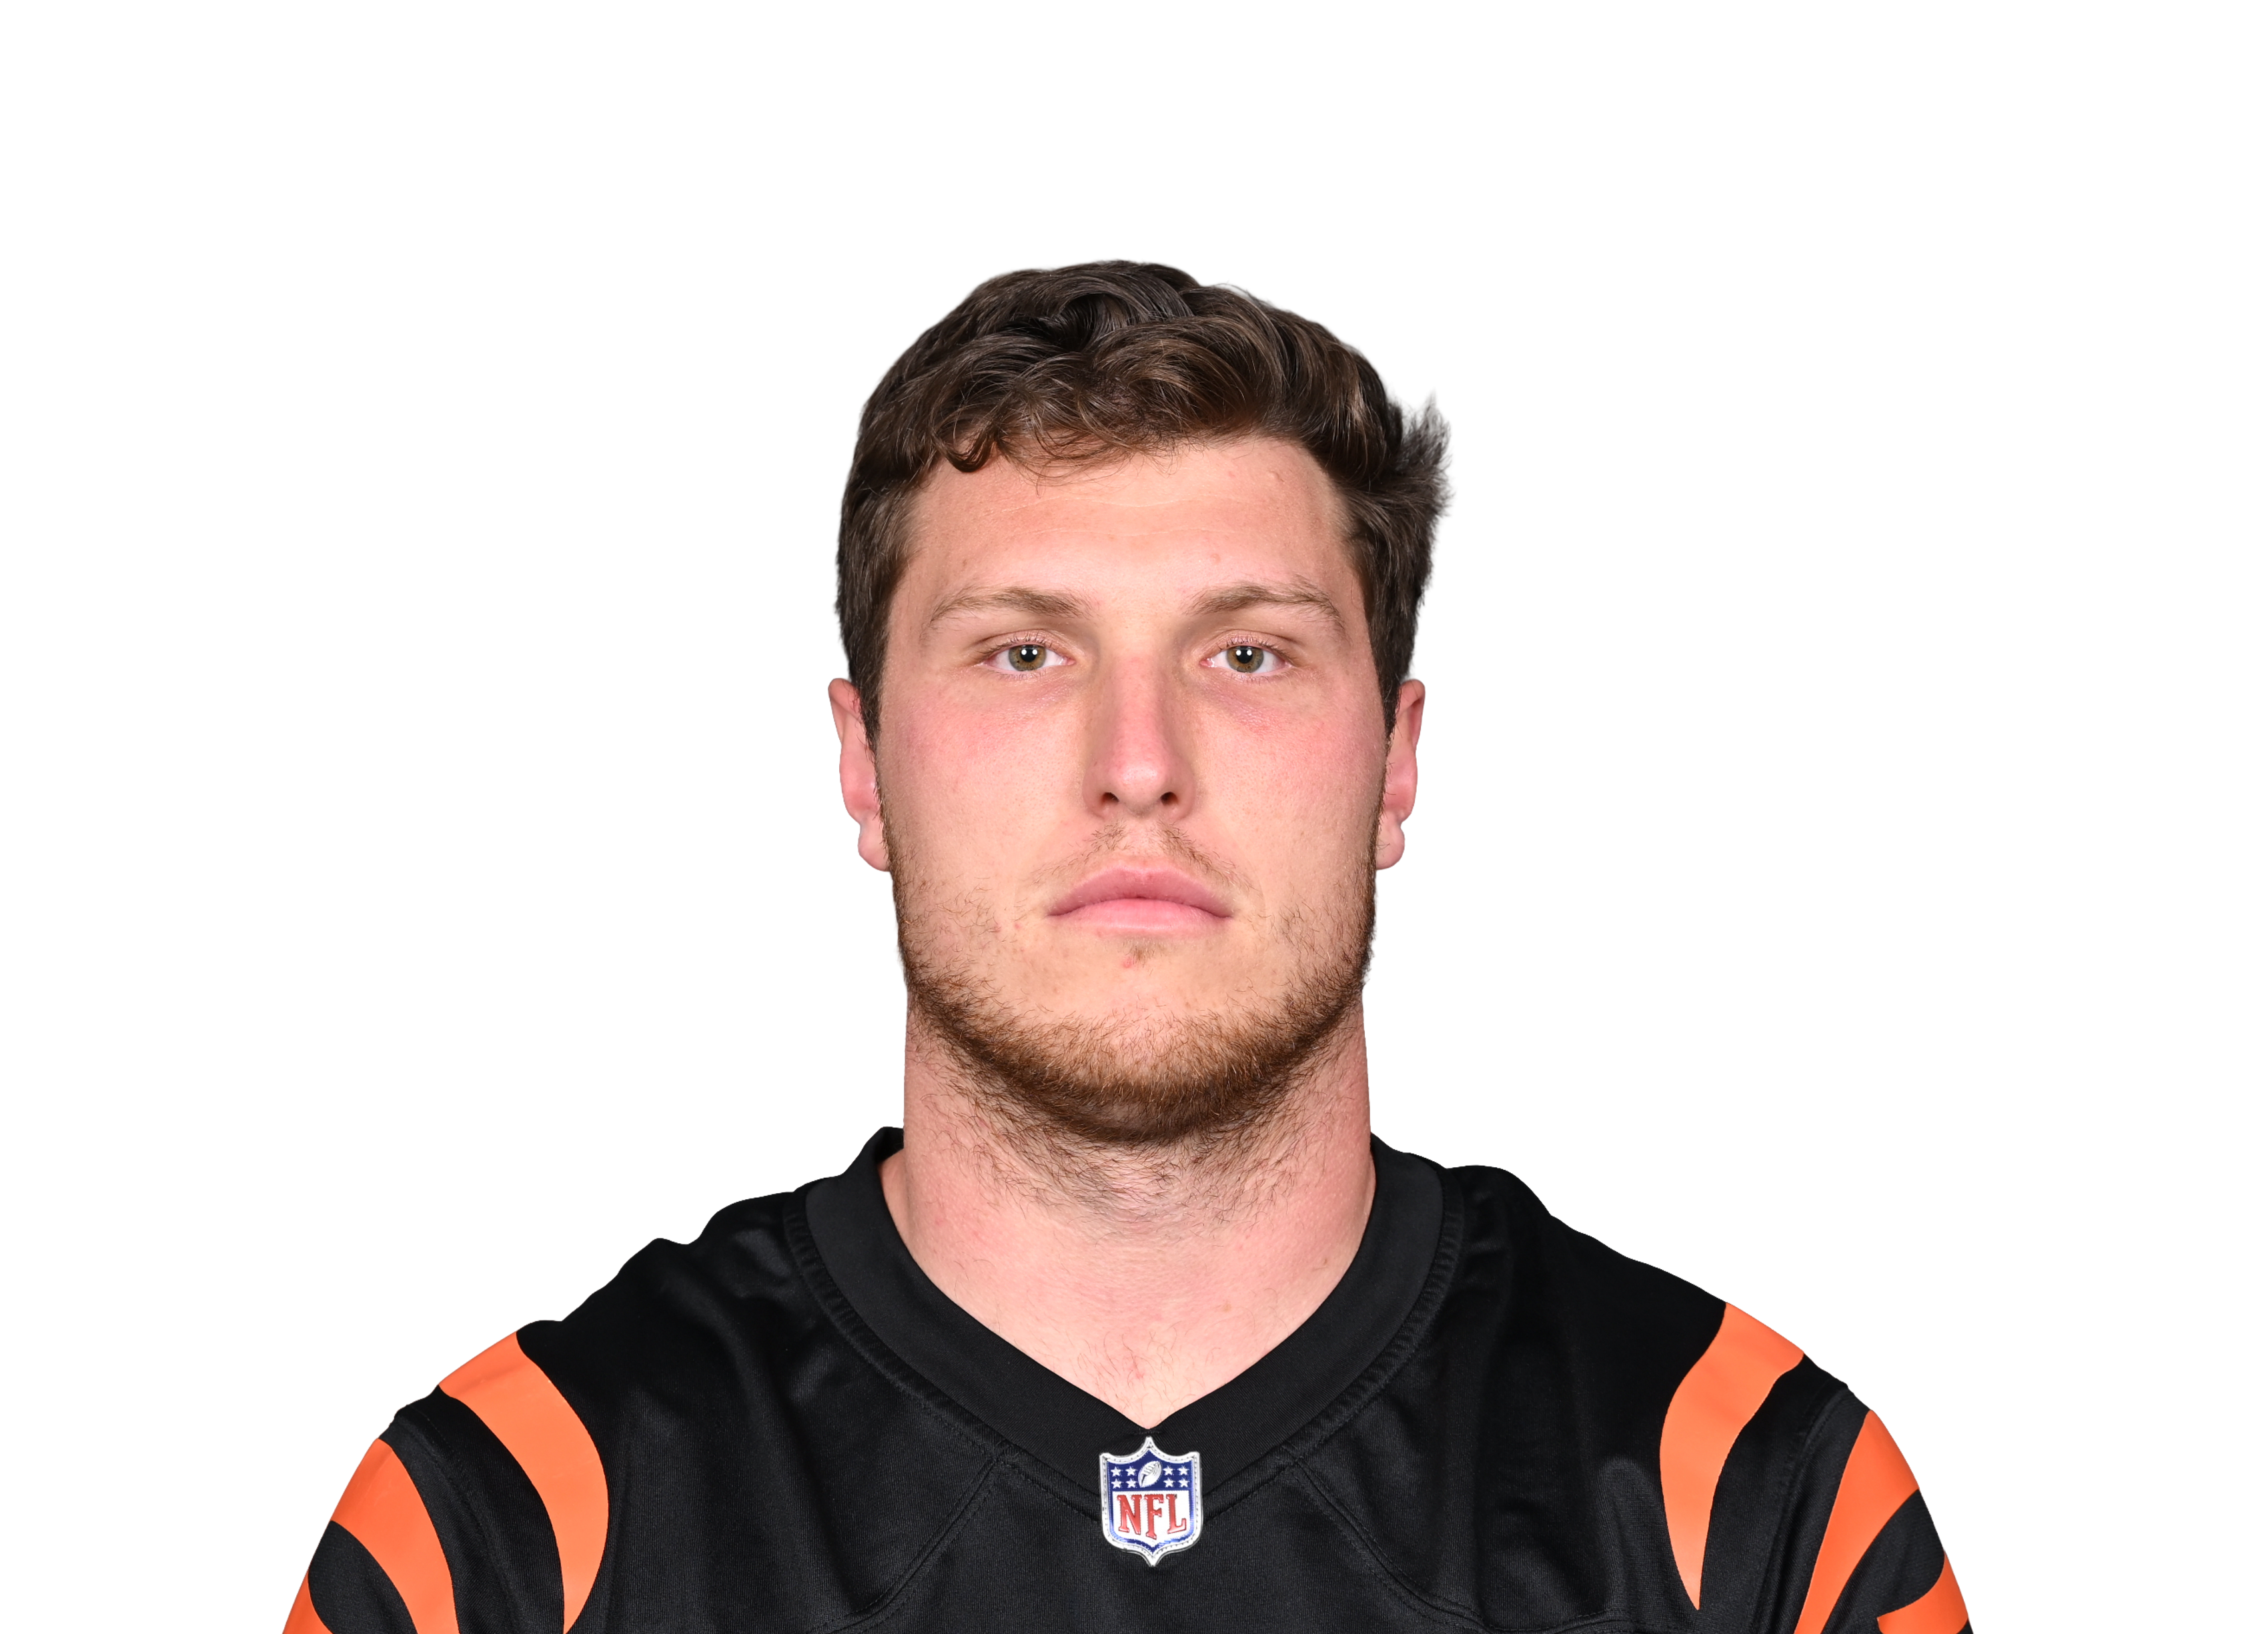 Drew Samplevs CIN • Wk 7 | 10.4 | 2 | 2 | 24 | 1 | 0 |
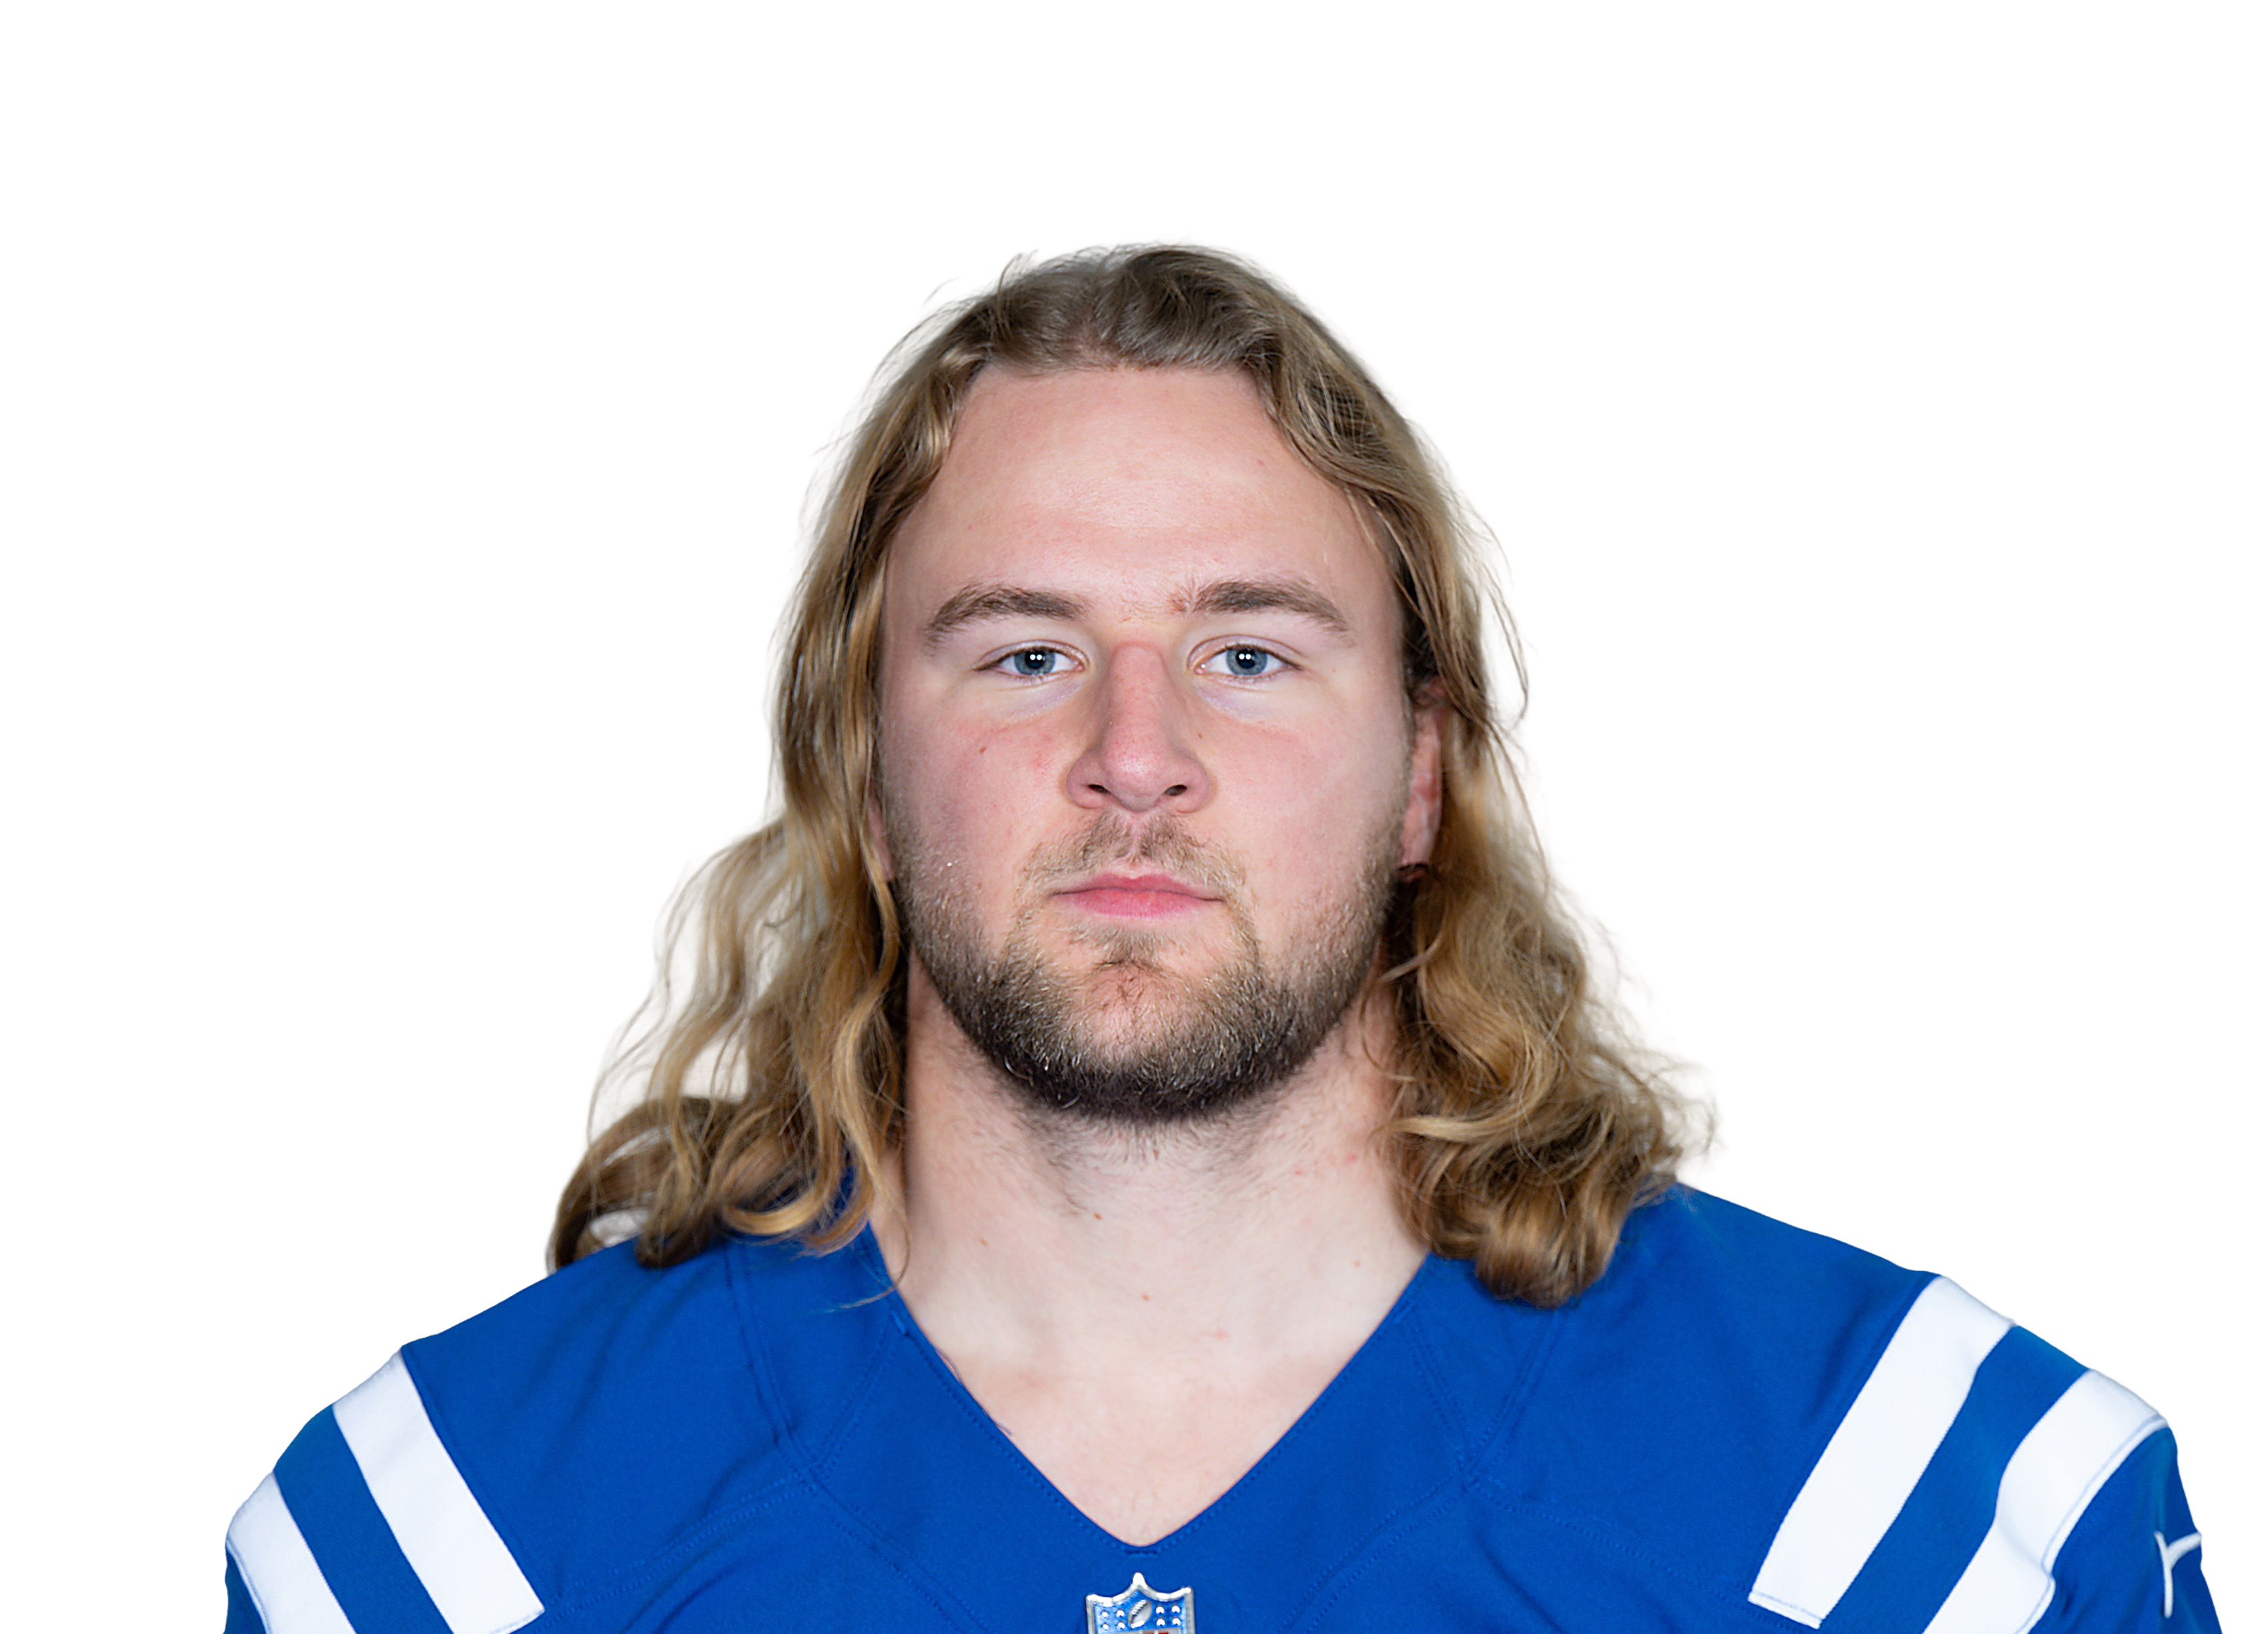 Tyler Warren@ IND • Wk 1 | 10.3 | 5 | 3 | 13 | 1 | 0 |
 Jake Ferguson@ DAL • Wk 3 | 9.3 | 5 | 3 | 23 | 1 | 0 |
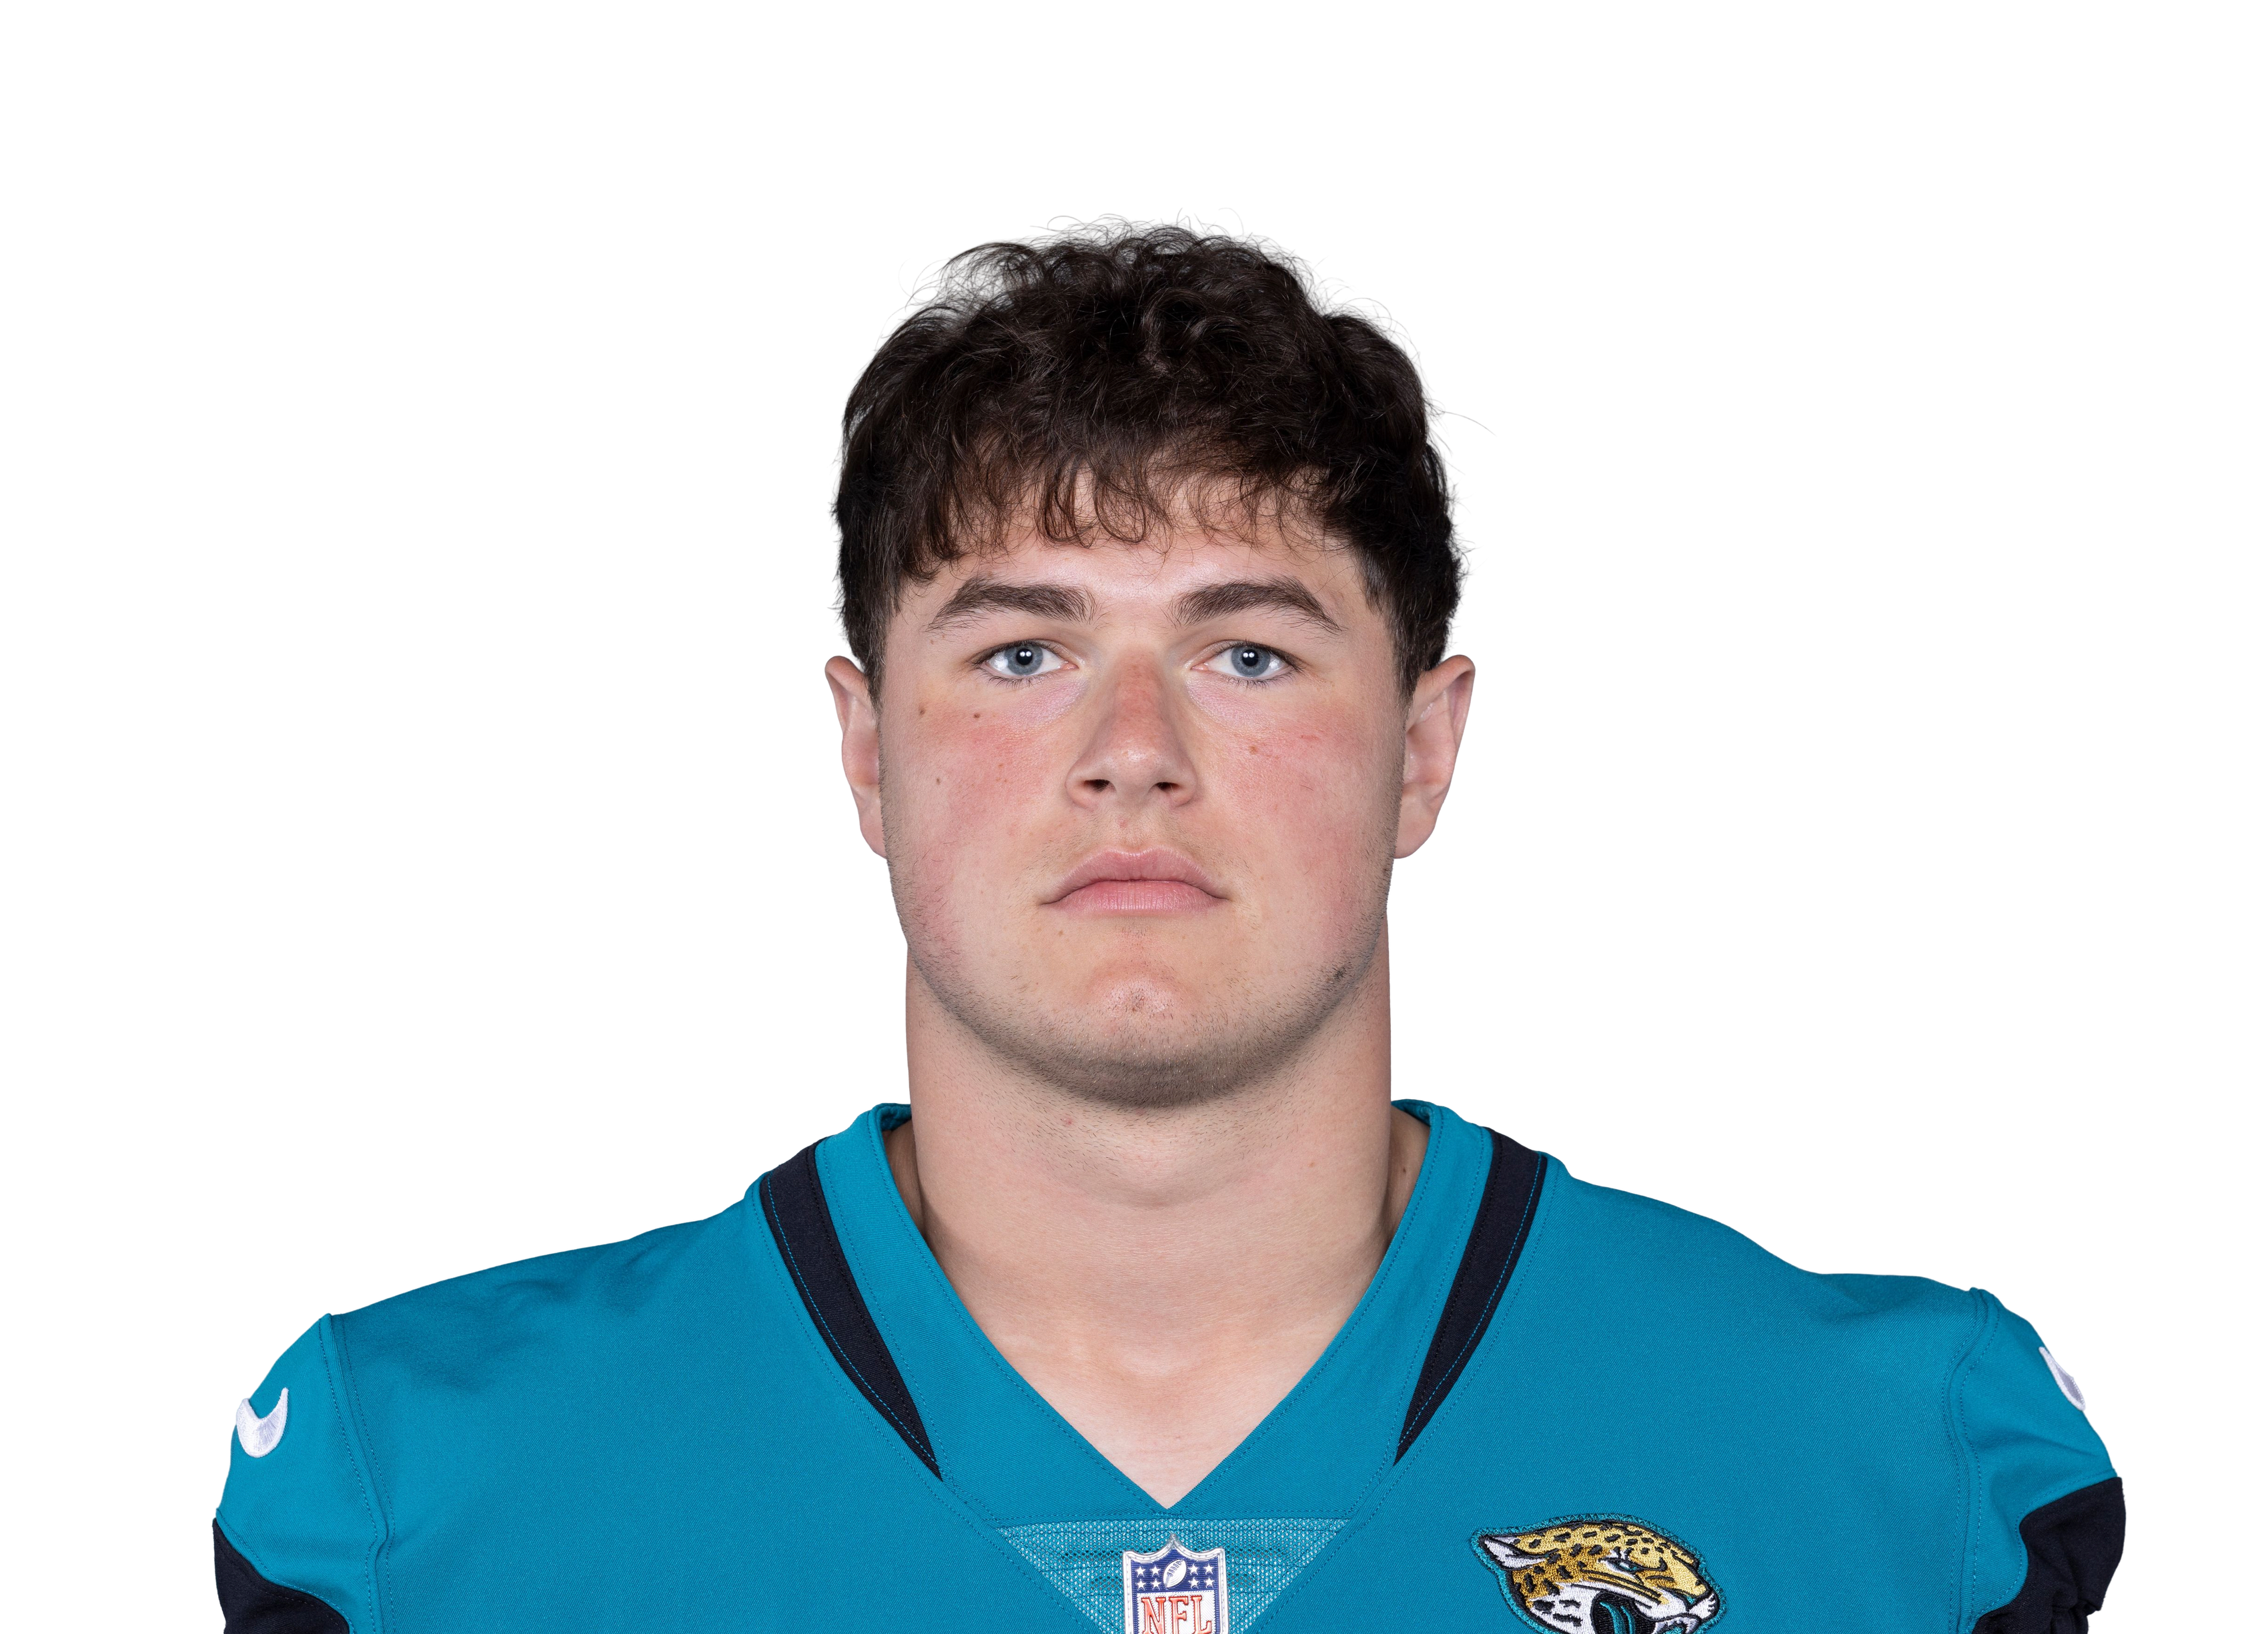 Nate Boerkirchervs JAX • Wk 9 | 8.1 | 3 | 2 | 61 | 0 | 0 |
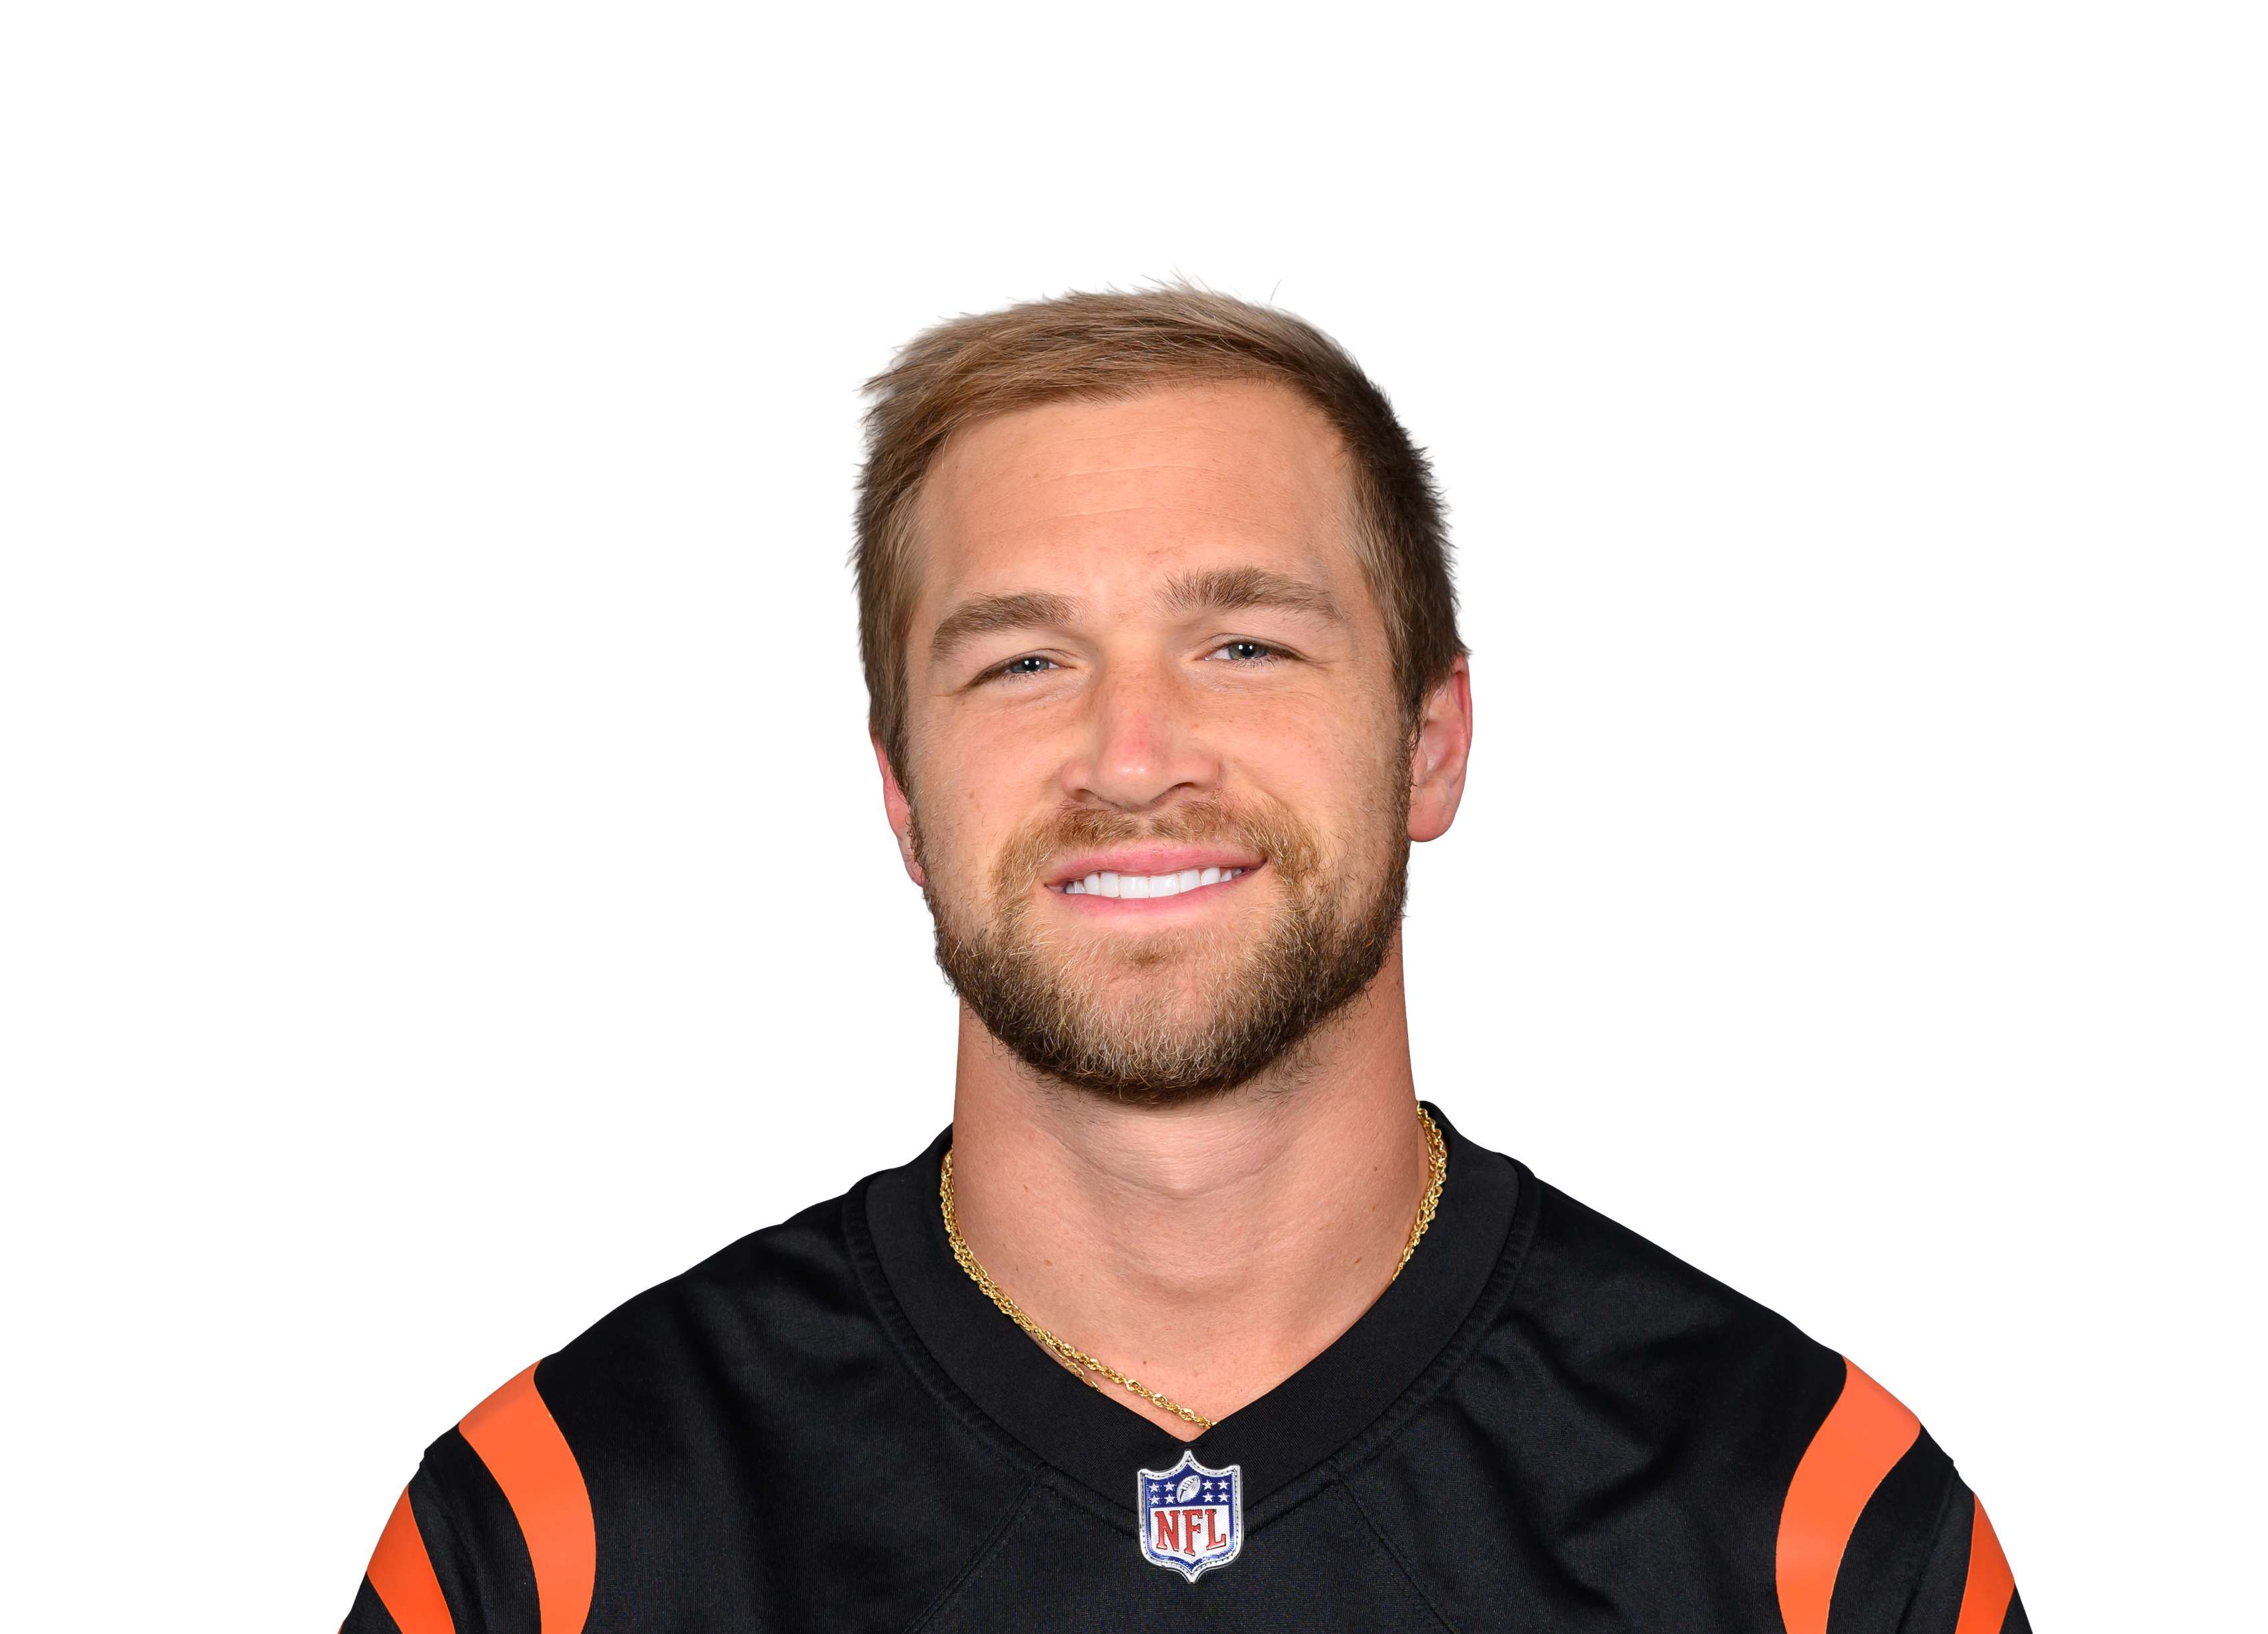 Mike Gesickivs CIN • Wk 7 | 7.6 | 1 | 1 | 6 | 1 | 0 |
 Erick Allvs CIN • Wk 7 | 5.6 | 3 | 3 | 26 | 0 | 0 |
 Brenton Strangevs JAX • Wk 9 | 4.2 | 2 | 2 | 22 | 0 | 0 |
 Charlie Kolarvs LAC • Wk 10 | 3.6 | 3 | 2 | 16 | 0 | 0 |
 Gunnar Helmvs TEN • Wk 4 | 3.5 | 1 | 1 | 5 | 0 | 0 |
 Tanner Koziolvs JAX • Wk 9 | 3.5 | 2 | 2 | 15 | 0 | 0 |
 Brevyn Spann-Ford@ DAL • Wk 3 | 2.9 | 1 | 1 | 19 | 0 | 0 |
 Charlie Woerner@ ATL • Wk 5 | 2.3 | 2 | 1 | 13 | 0 | 0 |
 Luke Schoonmaker@ DAL • Wk 3 | 1.9 | 1 | 1 | 9 | 0 | 0 |
 Harold Fannin Jr.@ CLE • Wk 6 | 1.9 | 3 | 1 | 9 | 0 | 0 |
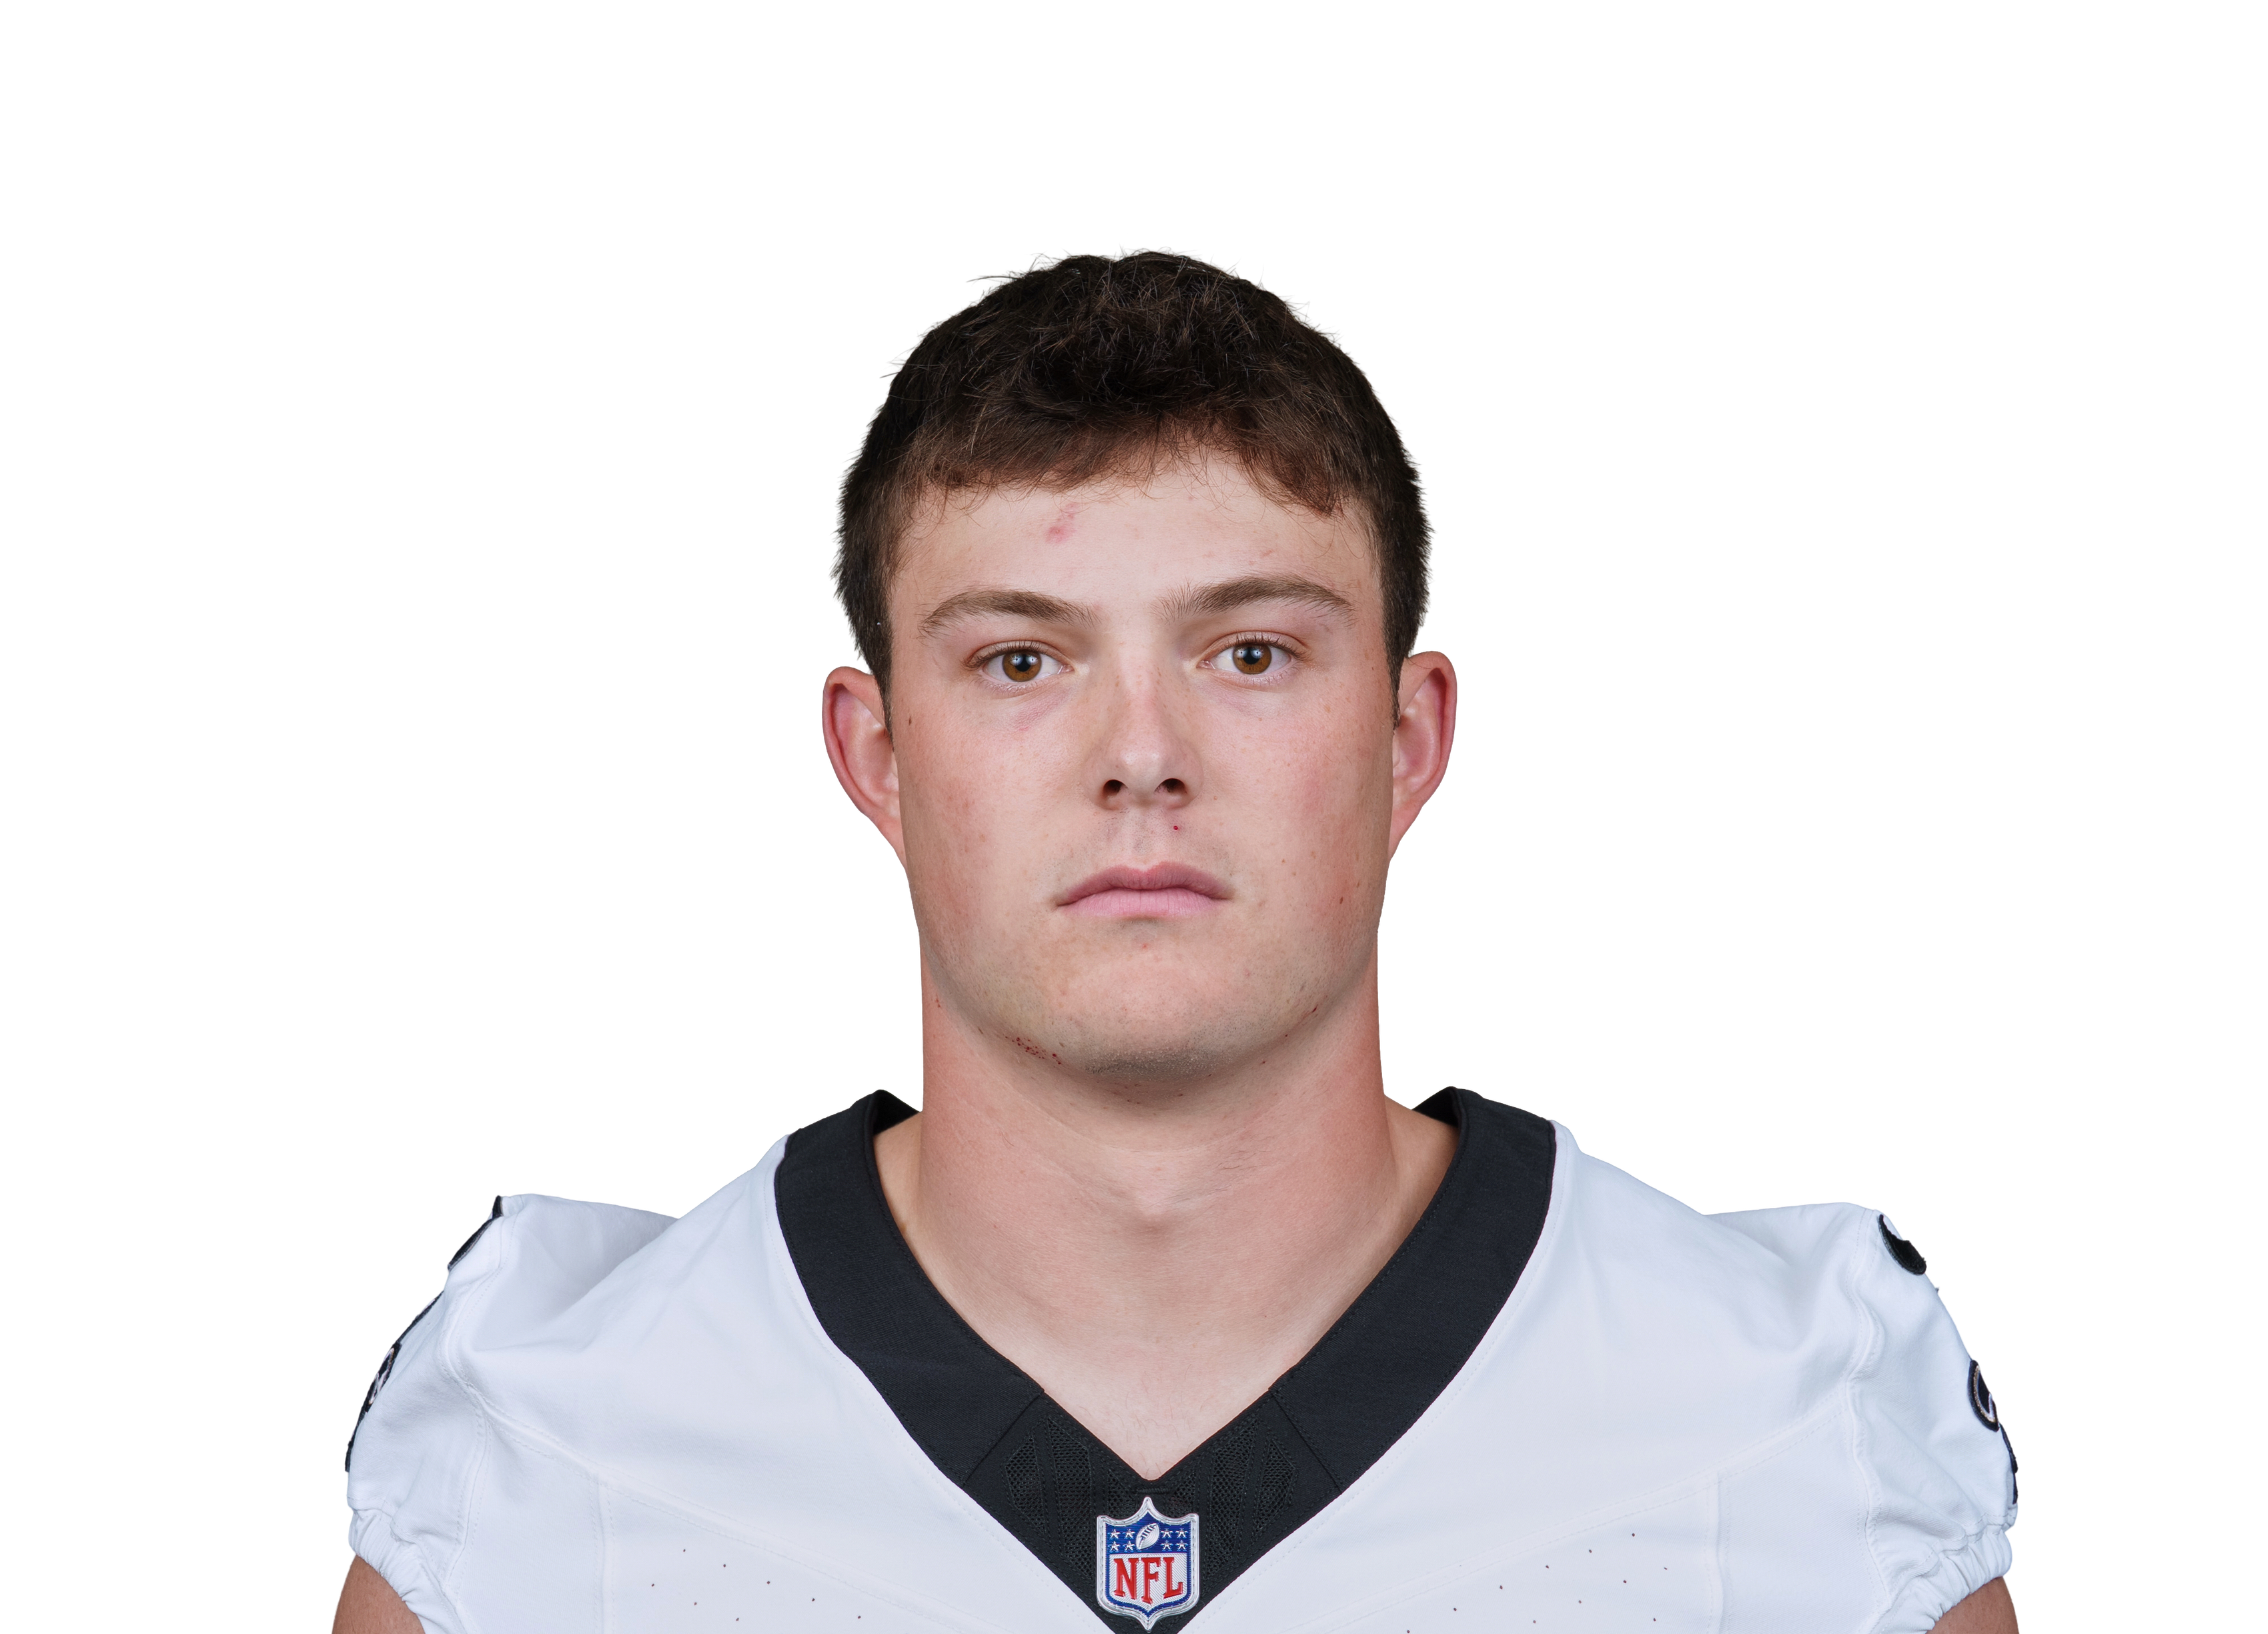 Oscar Delpvs NO • Wk 2 | 1.8 | 1 | 1 | 8 | 0 | 0 |
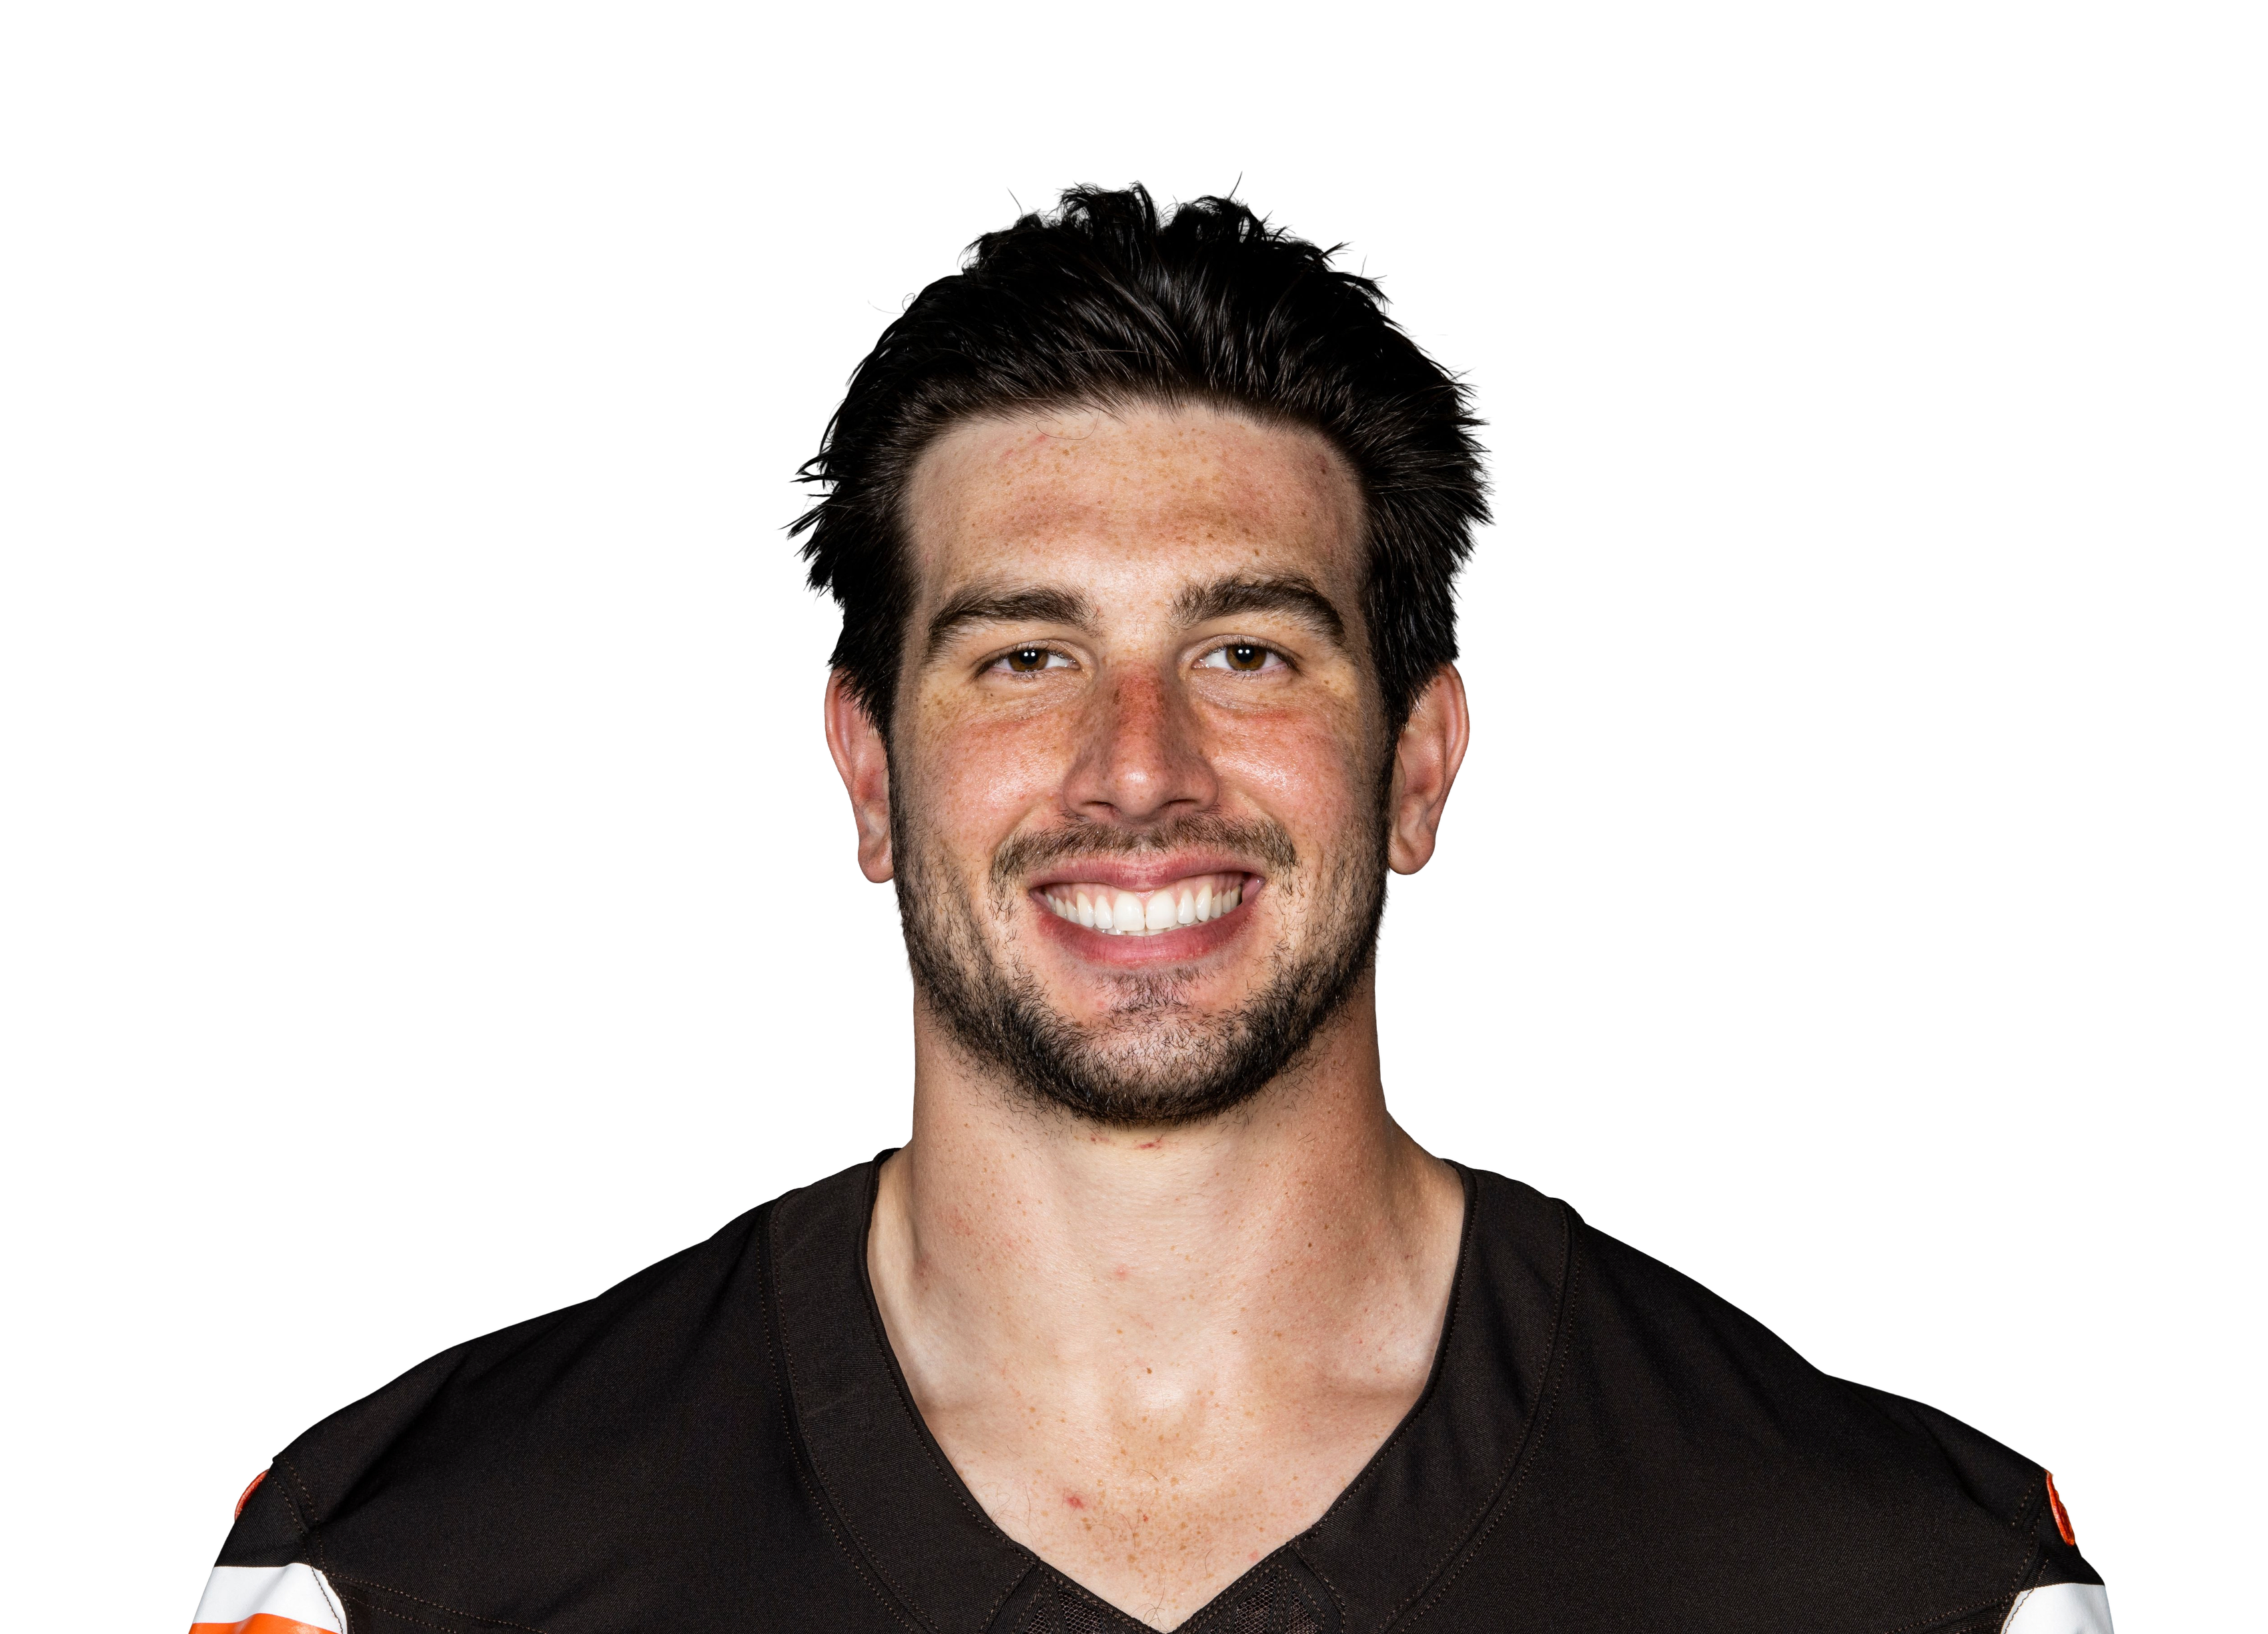 Blake Whiteheart@ CLE • Wk 6 | 1.8 | 1 | 1 | 8 | 0 | 0 |
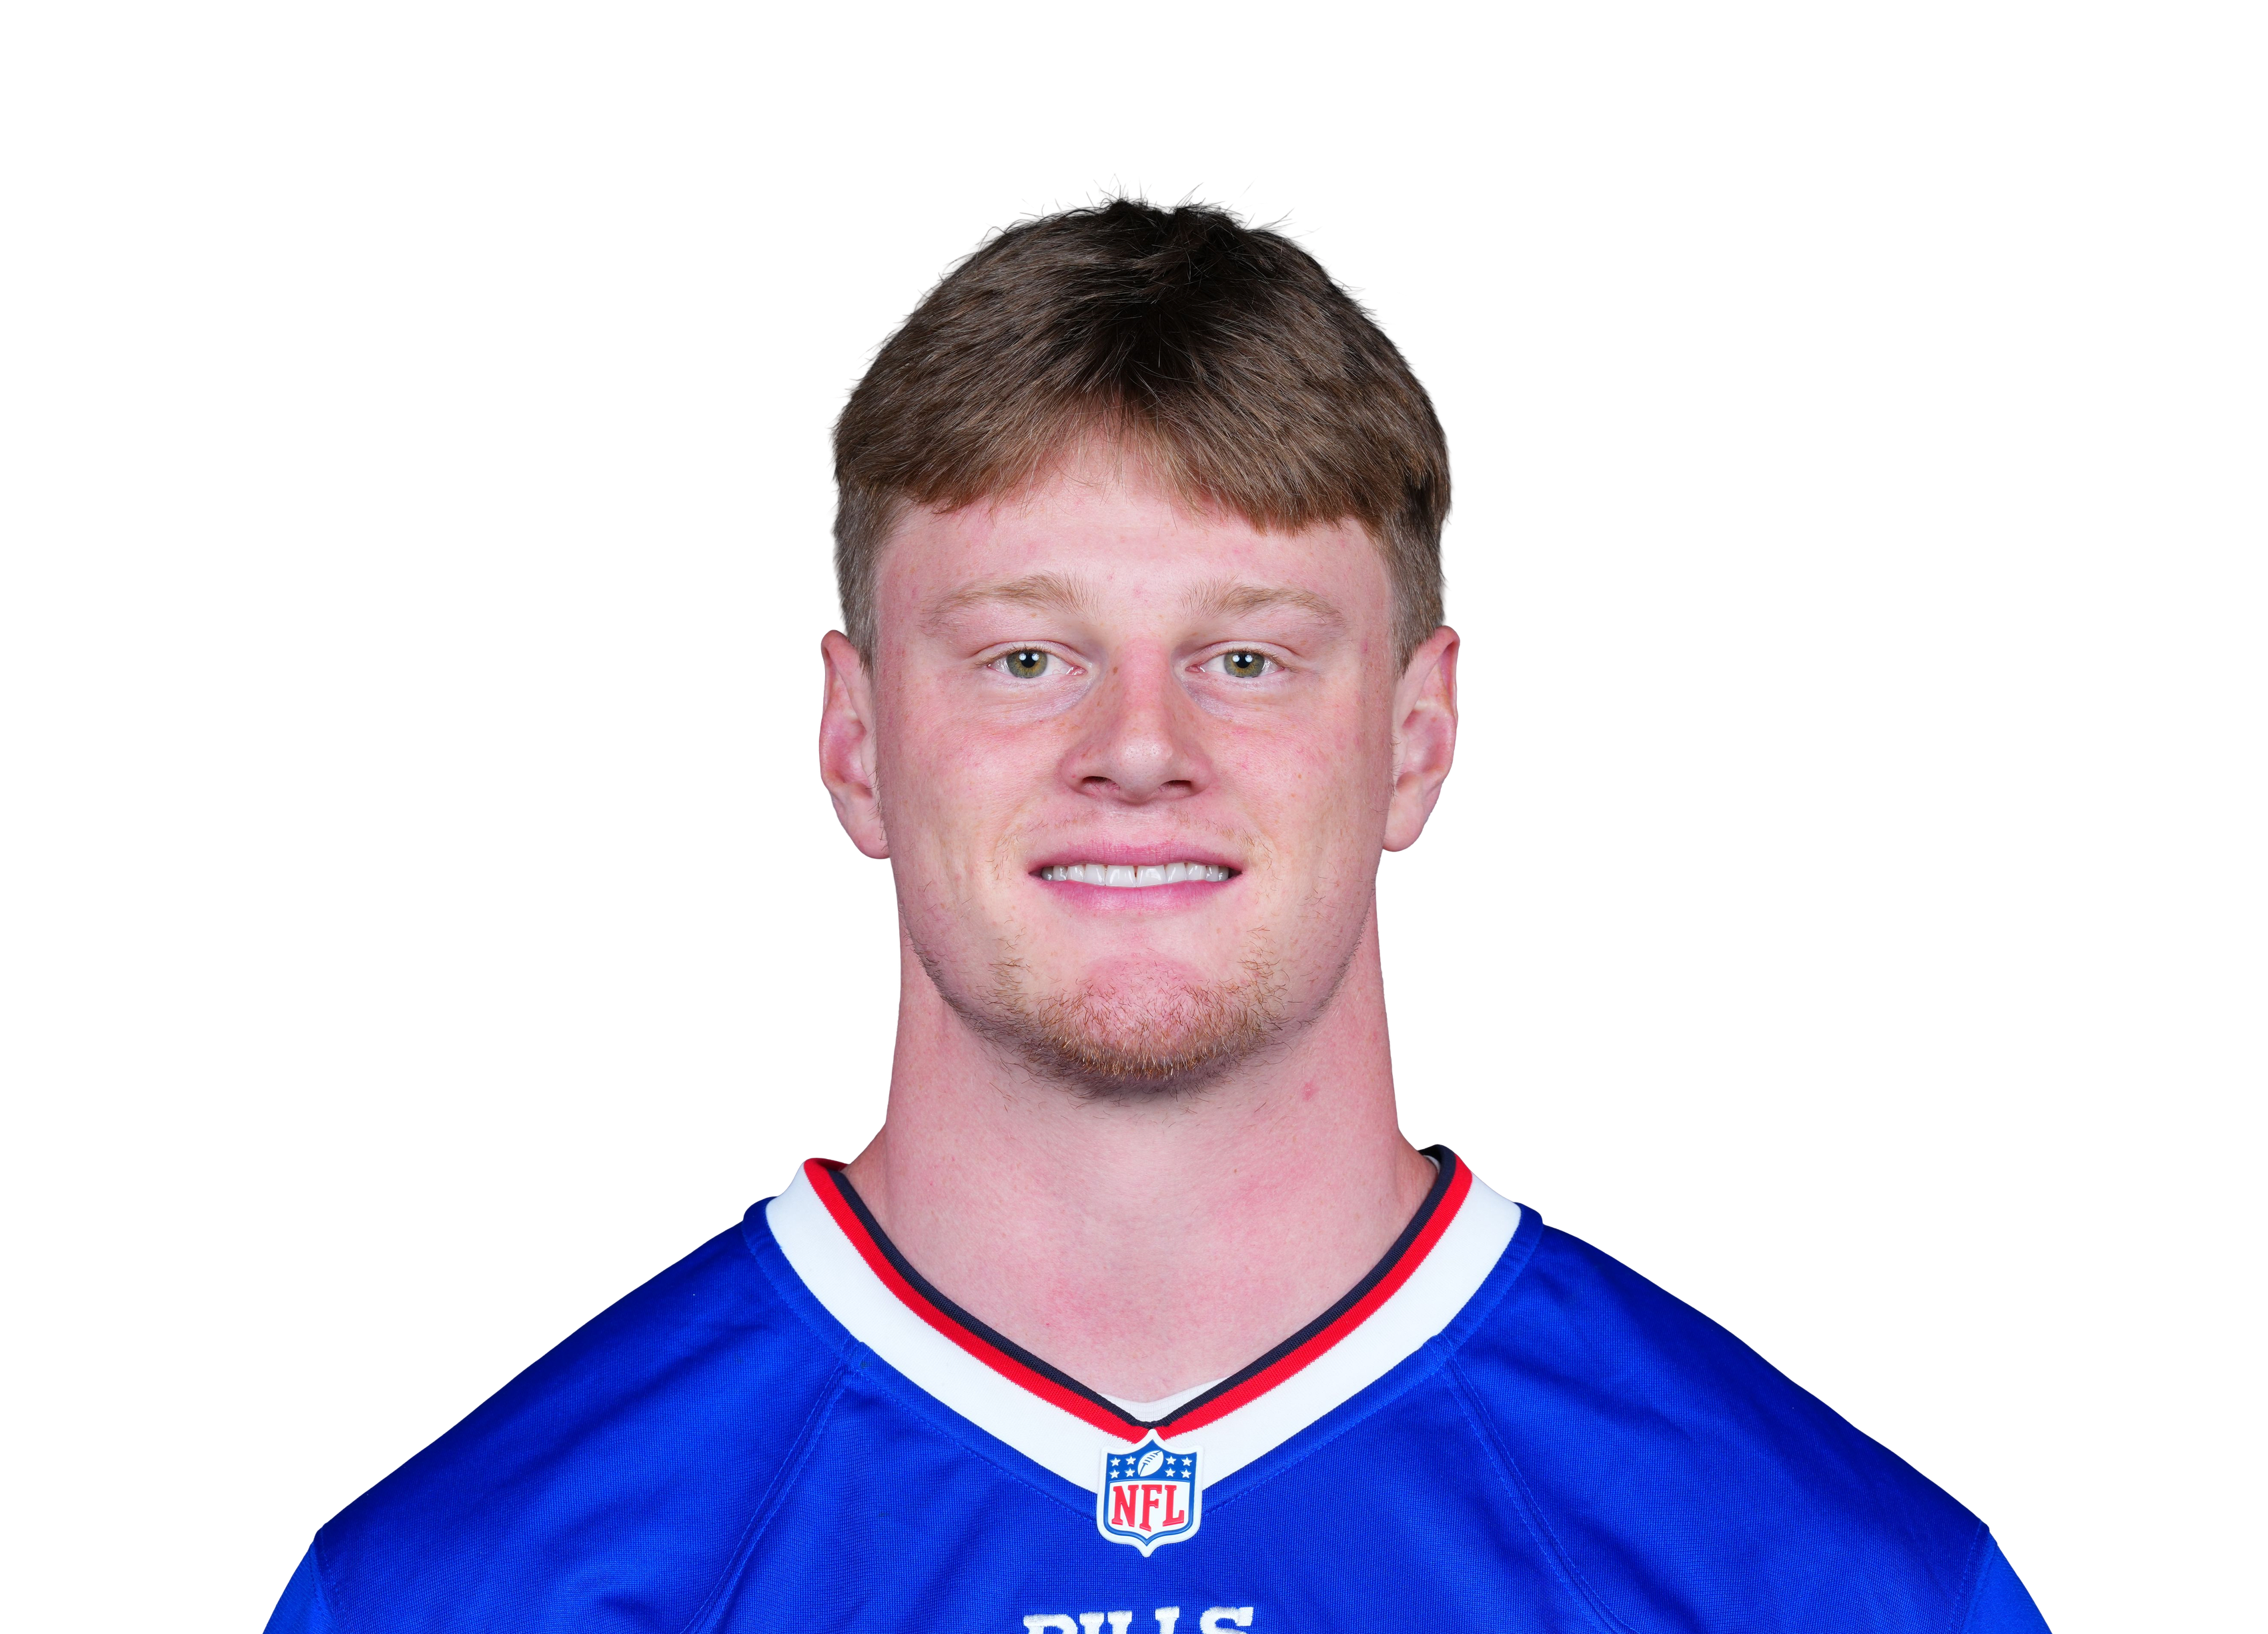 Jackson Hawes@ BUF • Wk 8 | 1.7 | 2 | 1 | 7 | 0 | 0 |
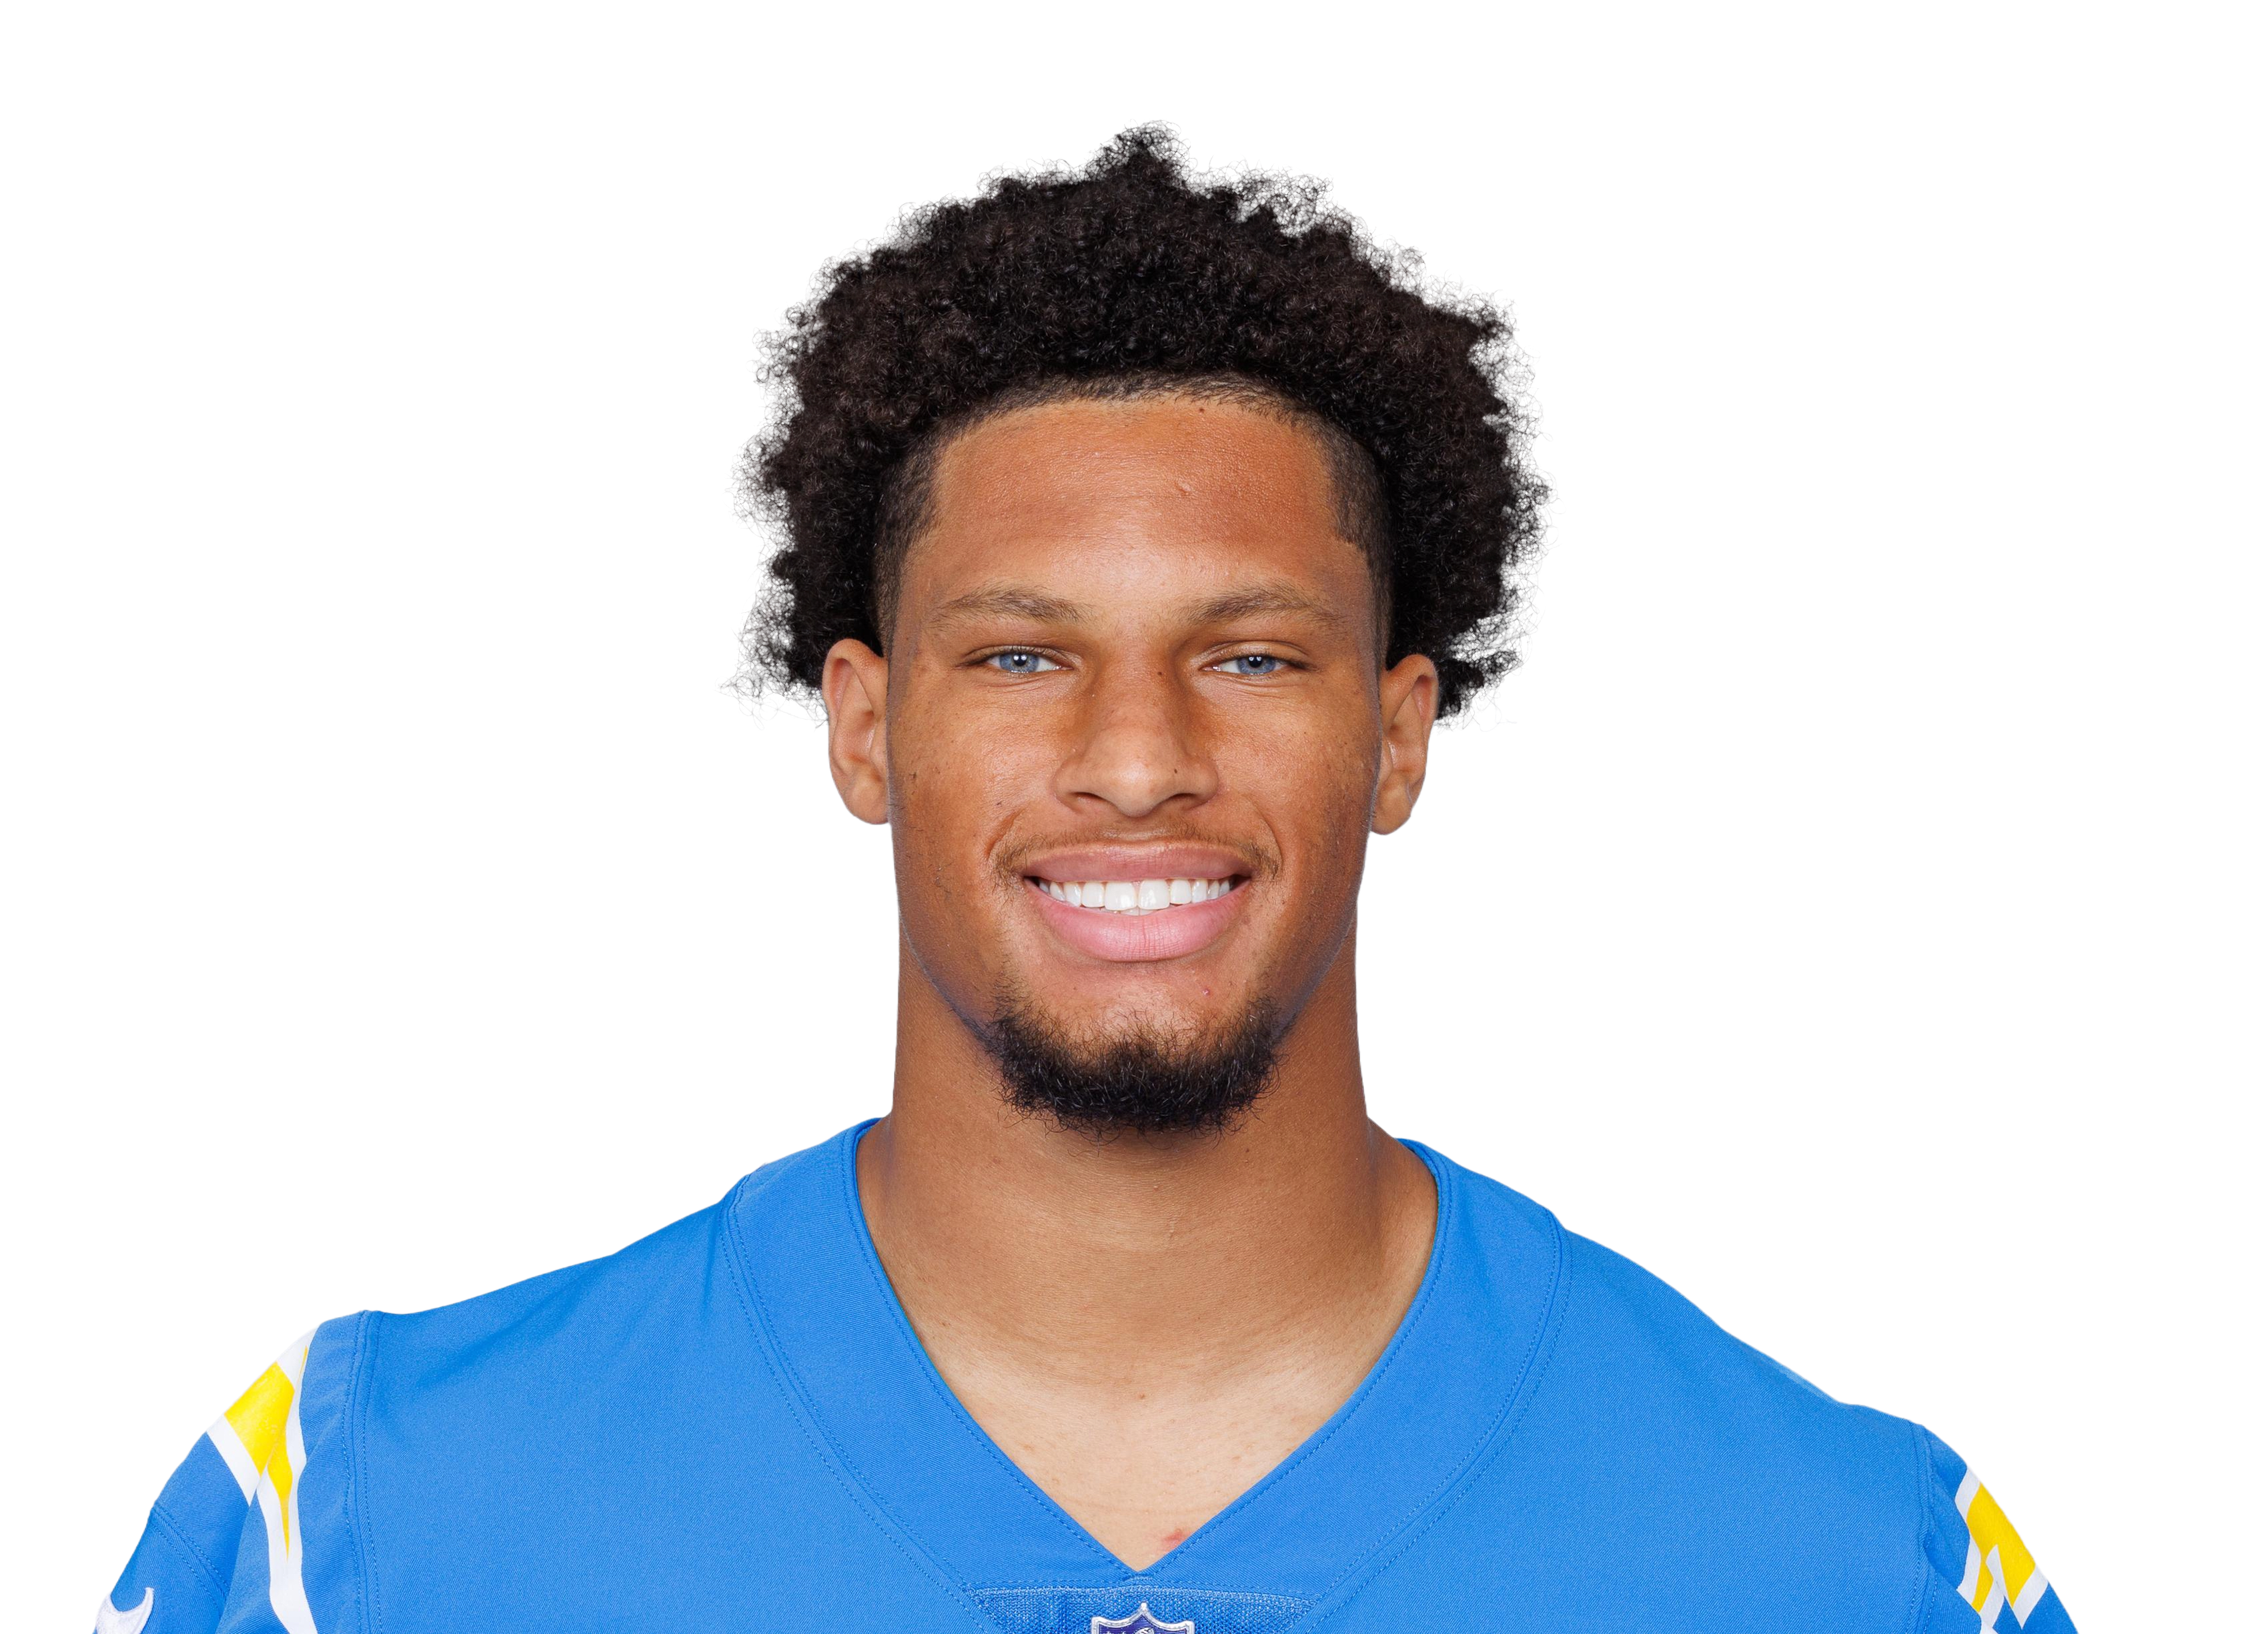 Oronde Gadsden IIvs LAC • Wk 10 | 1.7 | 1 | 1 | 7 | 0 | 0 |
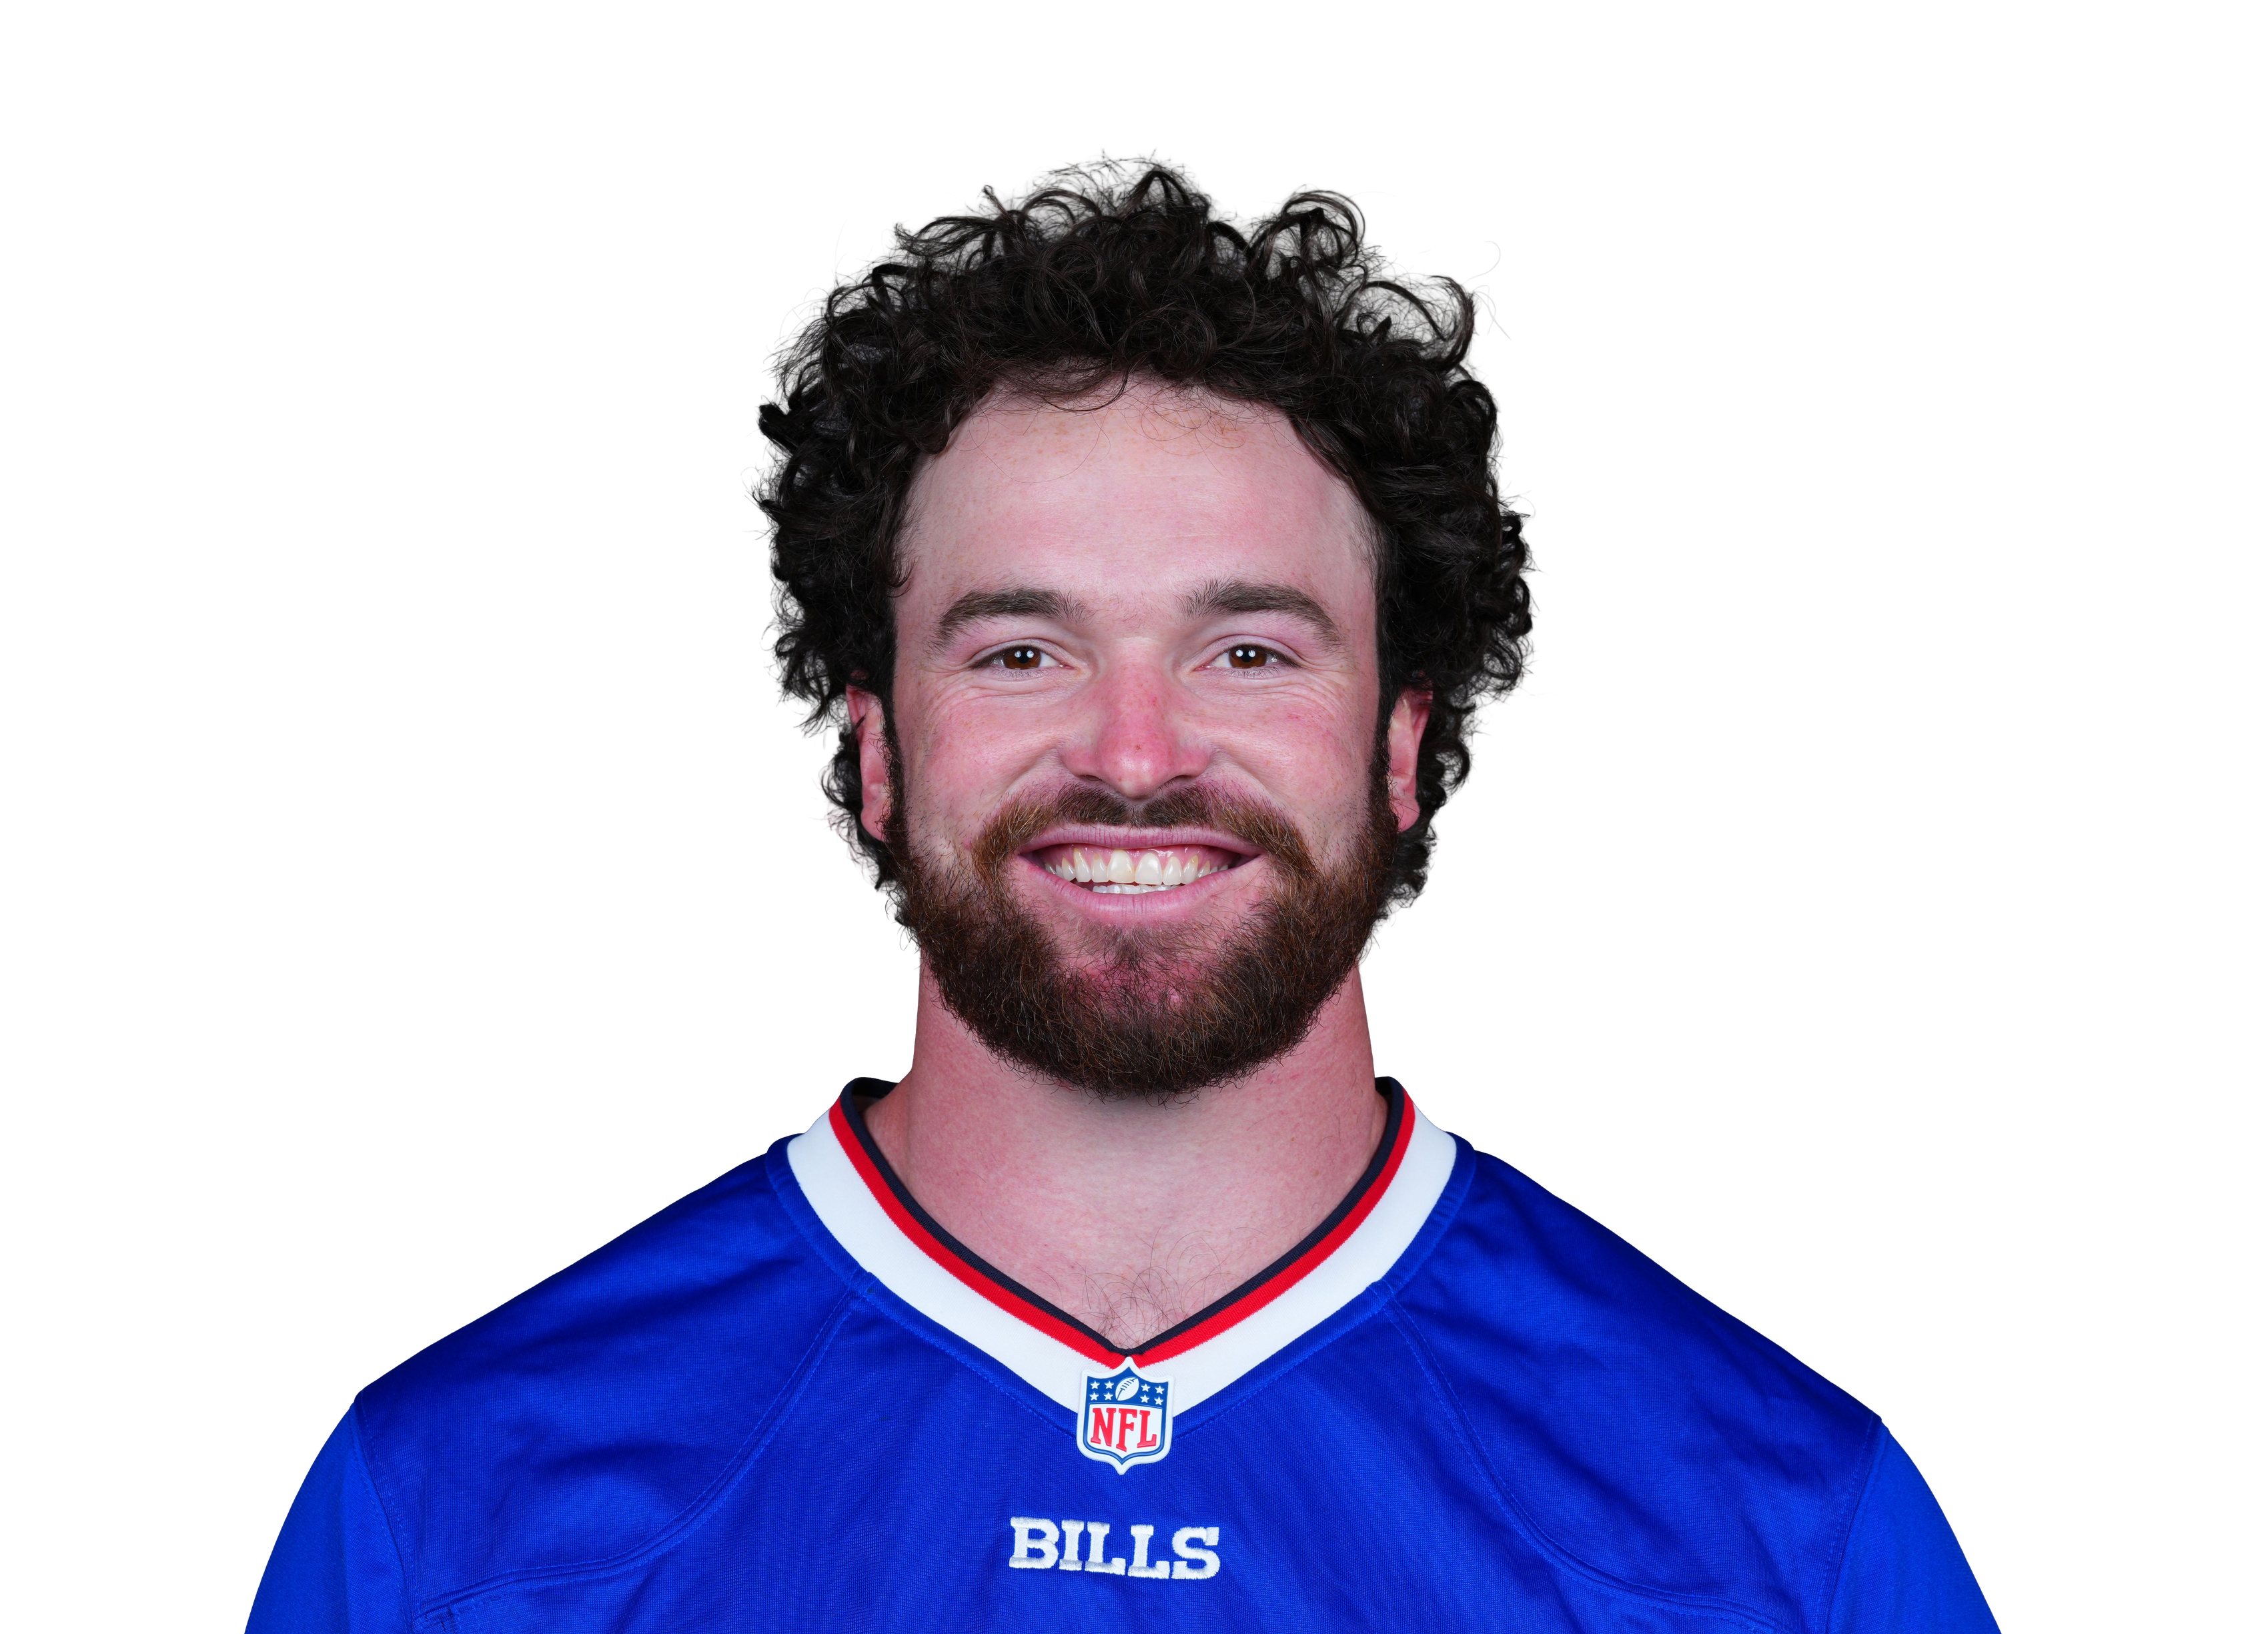 Dawson Knox@ BUF • Wk 8 | 1.6 | 2 | 1 | 6 | 0 | 0 |
 Daniel Bellingervs TEN • Wk 4 | 1.2 | 1 | 1 | 2 | 0 | 0 |
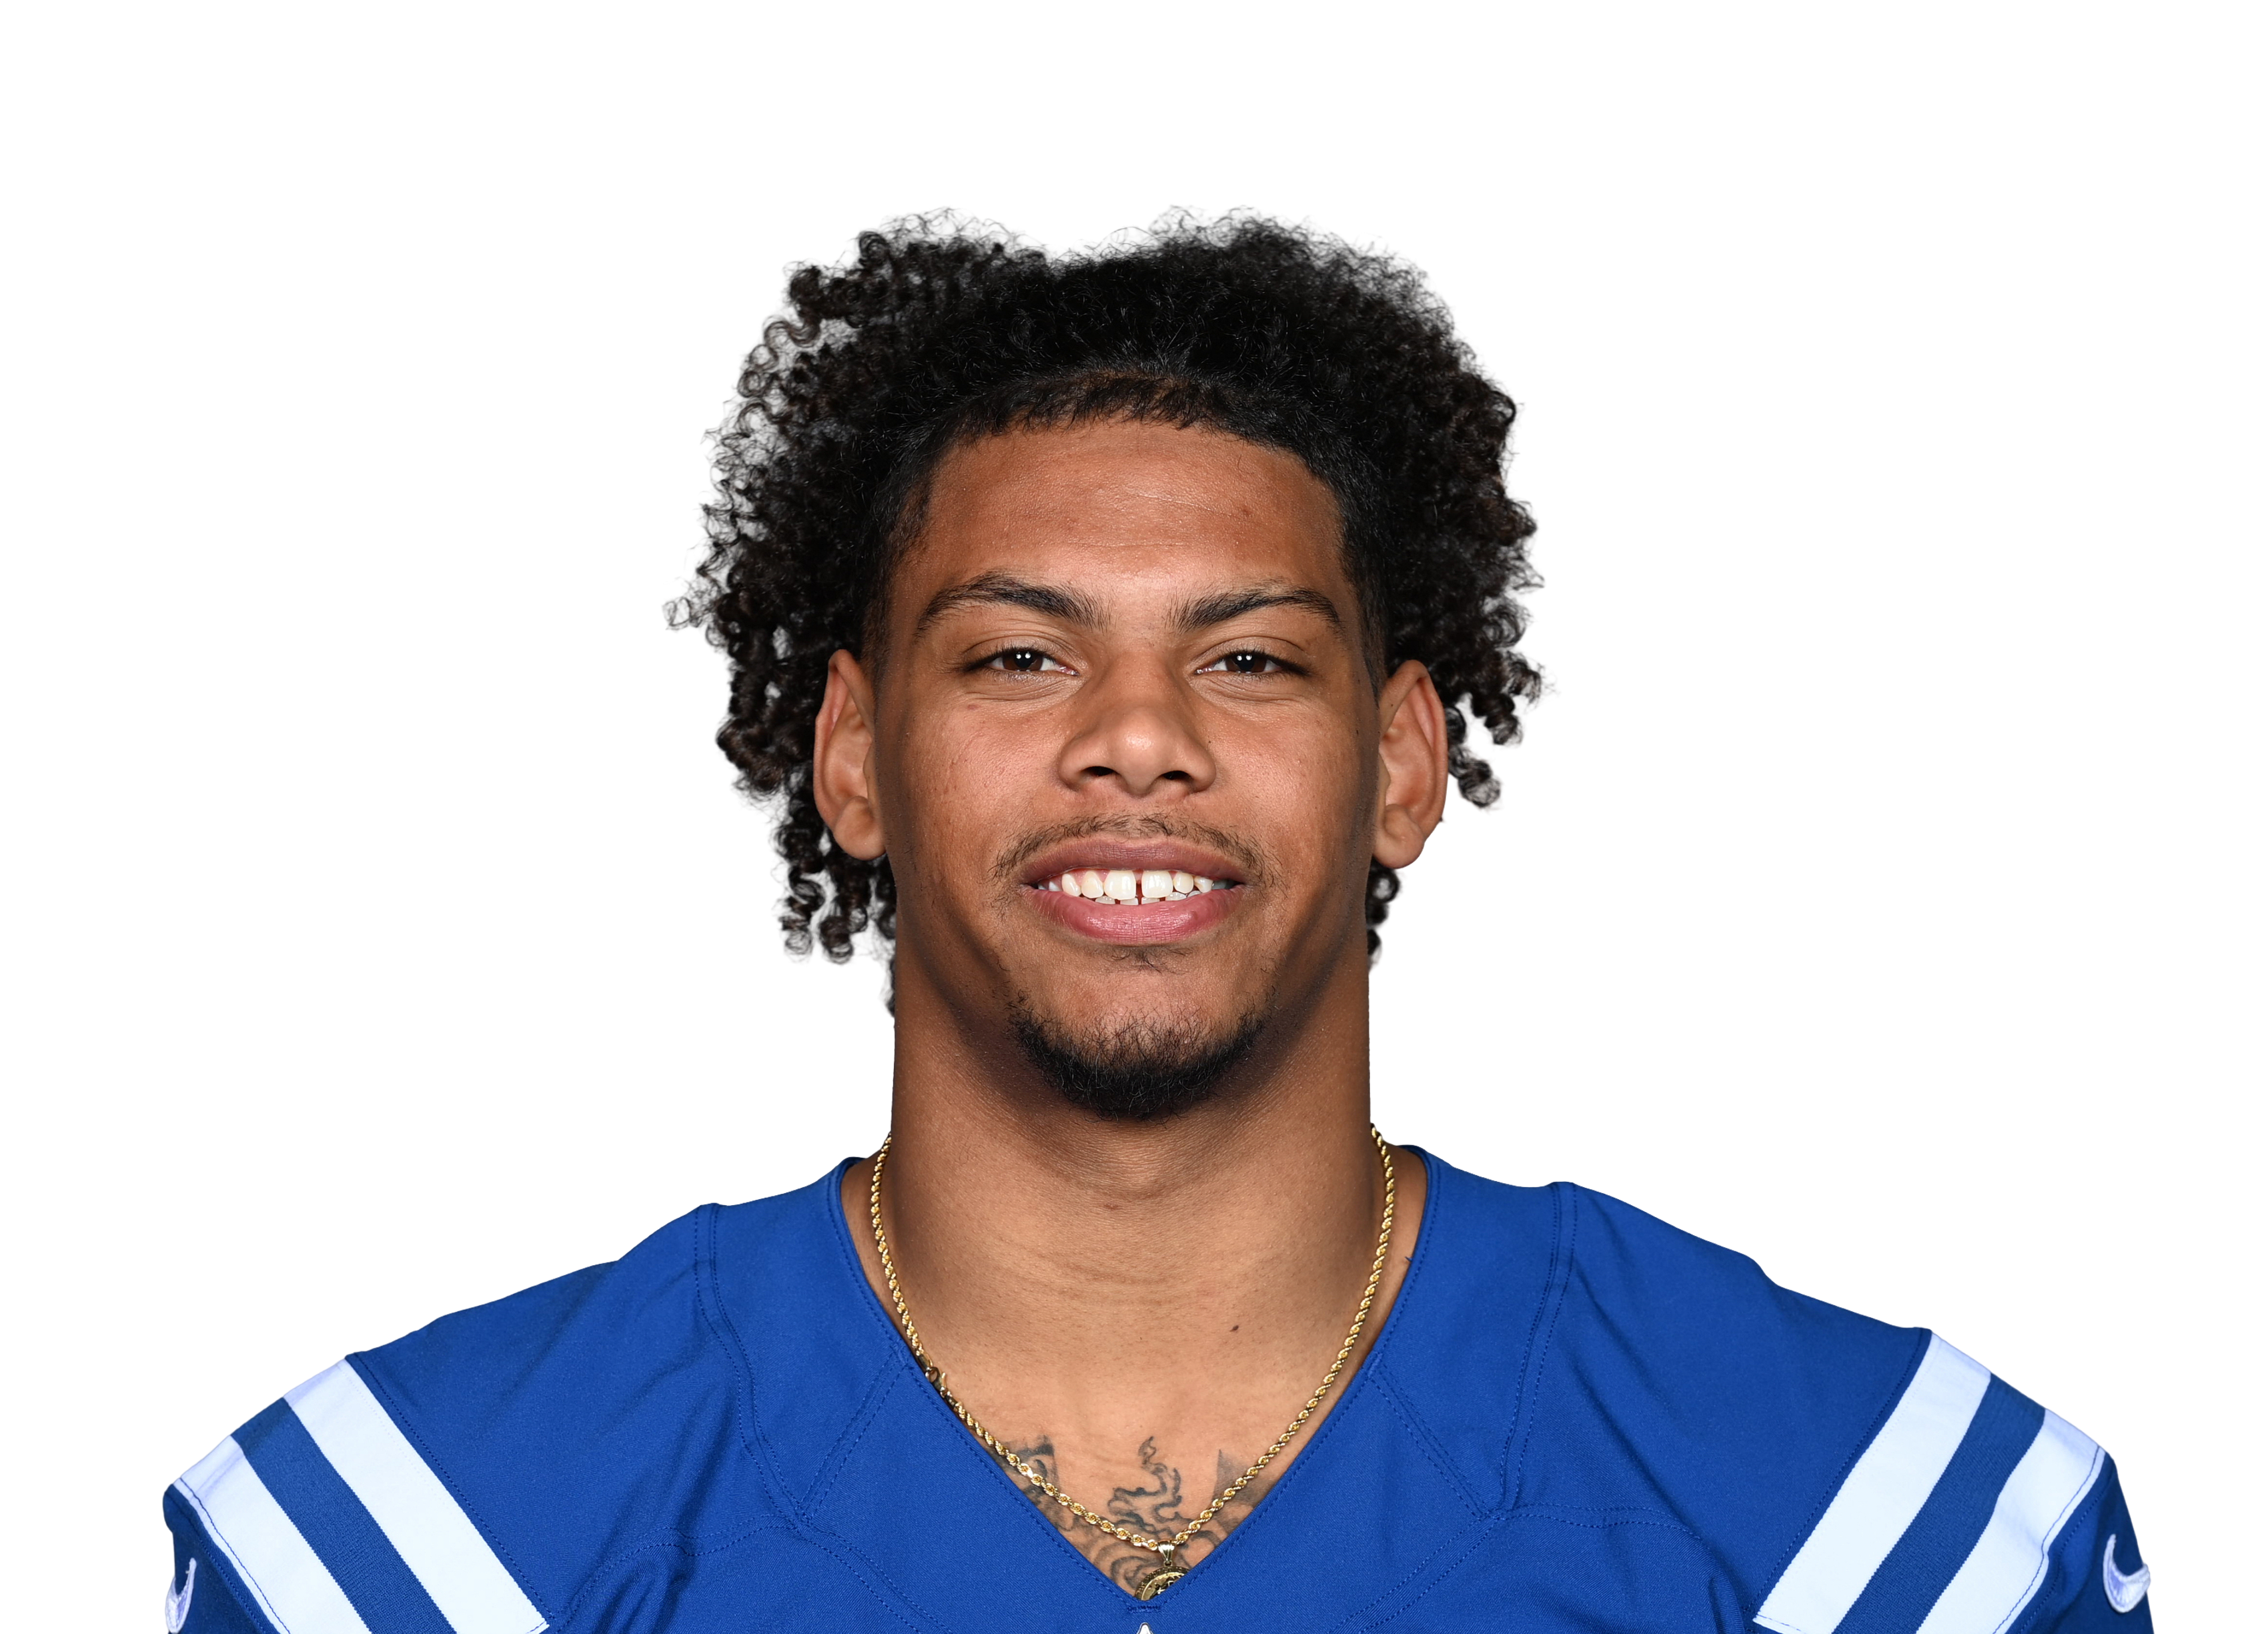 Andrew Ogletree@ IND • Wk 1 | 0.0 | 1 | 0 | 0 | 0 | 0 |
Fantasy points first, then the stats that matter for his position. Ring around each photo is that player's Mania Rating. Tap a name to open his profile.
| Player | W1 | W2 | W3 | W4 | W6 | W7 | W8 | W9 | W10 | Per game |
|---|---|---|---|---|---|---|---|---|---|---|
| Darren Waller | 228 yds6% targets35% snaps | 333 yds9% targets44% snaps | 851 yds19% targets51% snaps | 636 yds15% targets53% snaps | 20 yds6% targets46% snaps | 250 yds7% targets45% snaps | 211 yds6% targets62% snaps | 1090 yds27% targets53% snaps | 424 yds14% targets61% snaps | 4.336 yds a game • 8.3 per target12% targets50% snaps |
| Tommy Tremble | 525 yds15% targets56% snaps | 24 yds6% targets56% snaps | 441 yds10% targets48% snaps | 412 yds10% targets51% snaps | 446 yds11% targets68% snaps | 28 yds7% targets48% snaps | 319 yds9% targets60% snaps | 624 yds16% targets70% snaps | 548 yds17% targets67% snaps | 3.925 yds a game • 6.5 per target11% targets58% snaps |
| Mitchell Evans | 29 yds6% targets40% snaps | 113 yds3% targets58% snaps | 336 yds7% targets27% snaps | 18 yds3% targets61% snaps | 10 yds3% targets54% snaps | 239 yds7% targets50% snaps | 222 yds6% targets32% snaps | 220 yds5% targets47% snaps | 10 yds3% targets50% snaps | 1.716 yds a game • 9.8 per target5% targets47% snaps |
| Feleipe Franks | 00 yds0% targets7% snaps | 00 yds0% targets6% snaps | 00 yds0% targets0% snaps | 00 yds0% targets0% snaps | 00 yds0% targets5% snaps | — | — | — | 00 yds0% targets3% snaps | 0.00 yds a game0% targets4% snaps |
| Use | Game | Proj | PPR | Tgt | Rec | Rec Yd | Car | Rush Yd | TD | Snap |
|---|---|---|---|---|---|---|---|---|---|---|
W1 vs CHI | 7.1 | 4.8 | 2 | 2 | 28 | 0 | 0 | 0 | 35% | |
W2 vs ATL | 5.9 | 18.3 | 3 | 3 | 33 | 0 | 0 | 2 | 44% | |
W3 vs CLE | 6.5 | 10.1 | 8 | 5 | 51 | 0 | 0 | 0 | 51% | |
W4 vs DET | 8.9 | 6.6 | 6 | 3 | 36 | 0 | 0 | 0 | 53% | |
W6 vs PHI | 6.6 | 0 | 2 | 0 | 0 | 0 | 0 | 0 | 46% | |
W7 vs TB | 6.5 | 12 | 2 | 1 | 50 | 0 | 0 | 1 | 45% | |
W8 vs GB | 6.5 | 2.1 | 2 | 1 | 11 | 0 | 0 | 0 | 62% | |
W9 vs DEN | 6.2 | 23 | 10 | 8 | 90 | 0 | 0 | 1 | 53% | |
W10 vs NO | 8.7 | 4.4 | 4 | 2 | 24 | 0 | 0 | 0 | 61% |
Ranked against 27 TEs with at least 35 targets. He is still a small sample (39 targets), so his ranks lean toward average. Ranks account for how much work each number is based on, so a perfect record on a few plays does not beat one over a full workload. Tap a stat to see the full ranking.
Darren Waller
Pick a teammate with or without. Pick more than one to combine them, like a game without the QB and without the other back.
Questionable (Knee) • Rating -1.52 teammate notes ▾
CARBALHow this is built
| Player | W1 | W2 | W3 | W4 | W6 | W7 | W8 | W9 | W10 | Per game |
|---|---|---|---|---|---|---|---|---|---|---|
| Darren Waller | 228 yds6% targets35% snaps | 333 yds9% targets44% snaps | 851 yds19% targets51% snaps | 636 yds15% targets53% snaps | 20 yds6% targets46% snaps | 250 yds7% targets45% snaps | 211 yds6% targets62% snaps | 1090 yds27% targets53% snaps | 424 yds14% targets61% snaps | 4.336 yds a game • 8.3 per target12% targets50% snaps |
| Tommy Tremble | 525 yds15% targets56% snaps | 24 yds6% targets56% snaps | 441 yds10% targets48% snaps | 412 yds10% targets51% snaps | 446 yds11% targets68% snaps | 28 yds7% targets48% snaps | 319 yds9% targets60% snaps | 624 yds16% targets70% snaps | 548 yds17% targets67% snaps | 3.925 yds a game • 6.5 per target11% targets58% snaps |
| Mitchell Evans | 29 yds6% targets40% snaps | 113 yds3% targets58% snaps | 336 yds7% targets27% snaps | 18 yds3% targets61% snaps | 10 yds3% targets54% snaps | 239 yds7% targets50% snaps | 222 yds6% targets32% snaps | 220 yds5% targets47% snaps | 10 yds3% targets50% snaps | 1.716 yds a game • 9.8 per target5% targets47% snaps |
| Feleipe Franks | 00 yds0% targets7% snaps | 00 yds0% targets6% snaps | 00 yds0% targets0% snaps | 00 yds0% targets0% snaps | 00 yds0% targets5% snaps | — | — | — | 00 yds0% targets3% snaps | 0.00 yds a game0% targets4% snaps |
| Use | Game | Proj | PPR | Tgt | Rec | Rec Yd | Car | Rush Yd | TD | Snap |
|---|---|---|---|---|---|---|---|---|---|---|
| W1vs CHI | 7.1 | 4.8 | 2 | 2 | 28 | 0 | 0 | 0 | 35% | |
| W2vs ATL | 5.9 | 18.3 | 3 | 3 | 33 | 0 | 0 | 2 | 44% | |
| W3vs CLE | 6.5 | 10.1 | 8 | 5 | 51 | 0 | 0 | 0 | 51% | |
| W4vs DET | 8.9 | 6.6 | 6 | 3 | 36 | 0 | 0 | 0 | 53% | |
| W6vs PHI | 6.6 | 0 | 2 | 0 | 0 | 0 | 0 | 0 | 46% | |
| W7vs TB | 6.5 | 12 | 2 | 1 | 50 | 0 | 0 | 1 | 45% | |
| W8vs GB | 6.5 | 2.1 | 2 | 1 | 11 | 0 | 0 | 0 | 62% | |
| W9vs DEN | 6.2 | 23 | 10 | 8 | 90 | 0 | 0 | 1 | 53% | |
| W10vs NO | 8.7 | 4.4 | 4 | 2 | 24 | 0 | 0 | 0 | 61% |
Ranked against 27 TEs with at least 35 targets. He is still a small sample (39 targets), so his ranks lean toward average. Ranks account for how much work each number is based on, so a perfect record on a few plays does not beat one over a full workload. Tap a stat to see the full ranking.
12.9 PPR points a game allowed to tight ends, 17th most of 32 defenses.
| Player | PPR | Tgt | Rec | Rec Yd | Rec TD | Rush Yd |
|---|---|---|---|---|---|---|
| Dalton Kincaid@ BUF • Wk 8 | 18.6 | 6 | 4 | 86 | 1 | 0 |
| Kyle Pitts@ ATL • Wk 5 | 15.2 | 6 | 5 | 42 | 1 | 0 |
| Juwan Johnsonvs NO • Wk 2 | 10.6 | 4 | 4 | 66 | 0 | 0 |
| Drew Samplevs CIN • Wk 7 | 10.4 | 2 | 2 | 24 | 1 | 0 |
| Tyler Warren@ IND • Wk 1 | 10.3 | 5 | 3 | 13 | 1 | 0 |
| Jake Ferguson@ DAL • Wk 3 | 9.3 | 5 | 3 | 23 | 1 | 0 |
| Nate Boerkirchervs JAX • Wk 9 | 8.1 | 3 | 2 | 61 | 0 | 0 |
| Mike Gesickivs CIN • Wk 7 | 7.6 | 1 | 1 | 6 | 1 | 0 |
| Erick Allvs CIN • Wk 7 | 5.6 | 3 | 3 | 26 | 0 | 0 |
| Brenton Strangevs JAX • Wk 9 | 4.2 | 2 | 2 | 22 | 0 | 0 |
| Charlie Kolarvs LAC • Wk 10 | 3.6 | 3 | 2 | 16 | 0 | 0 |
| Gunnar Helmvs TEN • Wk 4 | 3.5 | 1 | 1 | 5 | 0 | 0 |
| Tanner Koziolvs JAX • Wk 9 | 3.5 | 2 | 2 | 15 | 0 | 0 |
| Brevyn Spann-Ford@ DAL • Wk 3 | 2.9 | 1 | 1 | 19 | 0 | 0 |
| Charlie Woerner@ ATL • Wk 5 | 2.3 | 2 | 1 | 13 | 0 | 0 |
| Luke Schoonmaker@ DAL • Wk 3 | 1.9 | 1 | 1 | 9 | 0 | 0 |
| Harold Fannin Jr.@ CLE • Wk 6 | 1.9 | 3 | 1 | 9 | 0 | 0 |
| Oscar Delpvs NO • Wk 2 | 1.8 | 1 | 1 | 8 | 0 | 0 |
| Blake Whiteheart@ CLE • Wk 6 | 1.8 | 1 | 1 | 8 | 0 | 0 |
| Jackson Hawes@ BUF • Wk 8 | 1.7 | 2 | 1 | 7 | 0 | 0 |
| Oronde Gadsden IIvs LAC • Wk 10 | 1.7 | 1 | 1 | 7 | 0 | 0 |
| Dawson Knox@ BUF • Wk 8 | 1.6 | 2 | 1 | 6 | 0 | 0 |
| Daniel Bellingervs TEN • Wk 4 | 1.2 | 1 | 1 | 2 | 0 | 0 |
| Andrew Ogletree@ IND • Wk 1 | 0.0 | 1 | 0 | 0 | 0 | 0 |
Fantasy points first, then the stats that matter for his position. Ring around each photo is that player's Mania Rating. Tap a name to open his profile.