LAC
62.7MANIA RATINGOverall profile · Depth
MANIA RATING • DEPTH

Oronde Gadsden II

Age 23 · LAC · TE · 9 games
#198 OverallTE40#2 TE on LACDepth TE2 ›
TE29 this week
64.1WEEK 11 RATINGStart value vs NYJ
5.9WEEK 11 PROJECTIONPPR
12%TARGET SHARE58th percentile
45.7%SNAP SHARE29th percentile
Games counted
Untick or tick any game and Mania Rating, matchup and Week 11 Rating all recalculate. Official Mania Rating 62.7.
Mix and match games

Pick a teammate with or without. Pick more than one to combine them, like a game without the QB and without the other back.

Herbert QB ✓ current
Johnston WR
Harris WR
Kolar TE
Teammate injuries shift his Week 11 Rating1 teammate note ▾

Charlie Kolar (TE, Questionable) +1.3 • without him that work was worth 8.9 pts vs 4.2 with (2 games)
Injury report updated Sat Nov 21, 6:45 AM ET
Week 11 Rating = recent role + opponent + the latest injury report (updated Sat Nov 21, 6:45 AM ET). Check final inactives before you set your lineup.
Mania breakdown
Fantasy Production47
Target Volume57
Team Target Role56
Red-Zone Threat64
Per-Target Efficiency26
Mania breakdown
Percentile among TEs. 100 is the best, 50 is average.
47
How many fantasy points and total yards he is actually producing, compared with players at his position. Ranks better than 47% of TEs.
57
How often he is targeted: targets per game, receptions and his share of the team targets. Ranks better than 57% of TEs.
56
How big a slice of his team passing game belongs to him: target share, air-yard share and snaps. Ranks better than 56% of TEs.
64
How often the offense uses him near the goal line: red-zone targets and end-zone targets. Ranks better than 64% of TEs.
26
What he produces with each chance instead of just rewarding volume: yards per target, catch rate and fantasy points per opportunity. Ranks better than 26% of TEs.
Top 30%MiddleBottom 40%Tap a category to see what it means.
Week 11 projection
5.9
projected points
Floor 0.6 · Ceiling 12.6
+0.1Game script
0.0Matchup
+0.4Injuries
Week 11 projection
LAC
VSPPR
NYJ
Easy matchup • NYJ is #11 in points allowed to TEs
5.9
projected pointsReceiving 3.1 targets, 2.3 catches, 24 yds • 0.20 TD
Floor 0.64 of 5 games land hereCeiling 12.6
Vegas lines included. From usage alone: 5.8. Sportsbook lines imply 6.0. Blended: 5.9. Right now he is in line with the sportsbooks.
+0.1Game script
0.0Matchup
+0.4Injuries
How this is built
Recent and last-season usage, the Vegas spread and total, how this defense treats his position, and the injury report (teammates out, QB out). The three boxes show how many points each moved it. When sportsbook player lines are posted (Wednesday to Sunday) they are blended in, leaning on them most for new starters and players with few games. PPR scoring only. Tested on past seasons it is about 5% closer than a plain season average.
Week 11 matchup
vs NYJ
Tough matchup
Adjustment-1.2 pts
Allows to TEs11th most
Week11
Week 11 matchup
vs NYJ
-0.6Rating boost
Neutral matchup11th easiest of 32 defenses for TEs
ToughEasy
14.1PPR a game NYJ allows to TEs
6.7Similar players, usual PPR a game
9.3Same players against NYJ
Players with a role like his scored 9.3 PPR a game against NYJ, versus 6.7 in their usual games (+40%). That moves his Week 11 Rating by -0.6. It is a small sample this early, so it counts for little.
How tight ends did against NYJ

14.1 PPR points a game allowed to tight ends, 11th most of 32 defenses.

PlayerPPRTgtRecRec YdRec TDRush Yd
Brock Bowersvs LV • Wk 828.21079220
Travis Kelce@ KC • Wk 917.3647201
Hunter Henry@ NE • Wk 614.8544810
Greg Dulcichvs MIA • Wk 713.6558600
Colston Loveland@ CHI • Wk 411.7965700
Michael Mayervs LV • Wk 810.3655300
Dalton Kincaidvs BUF • Wk 107.8325800
Sam LaPorta@ DET • Wk 37.4434400
Gunnar Helm@ TEN • Wk 16.8542800
Tucker Kraftvs GB • Wk 23.5321500
Cole Kmet@ CHI • Wk 43.3221300
Brock Wright@ DET • Wk 32.722700
Eli Raridon@ NE • Wk 62.1311100
Noah Gray@ KC • Wk 92.1111100
Jackson Meeks@ DET • Wk 31.811800
Sam Roush@ CHI • Wk 41.811800
Daniel Bellinger@ TEN • Wk 11.711700
Dawson Knoxvs BUF • Wk 101.731700
Harold Fannin Jr.vs CLE • Wk 51.441400
Jake Briningstool@ KC • Wk 91.321300
Seydou Traorevs MIA • Wk 70.010000

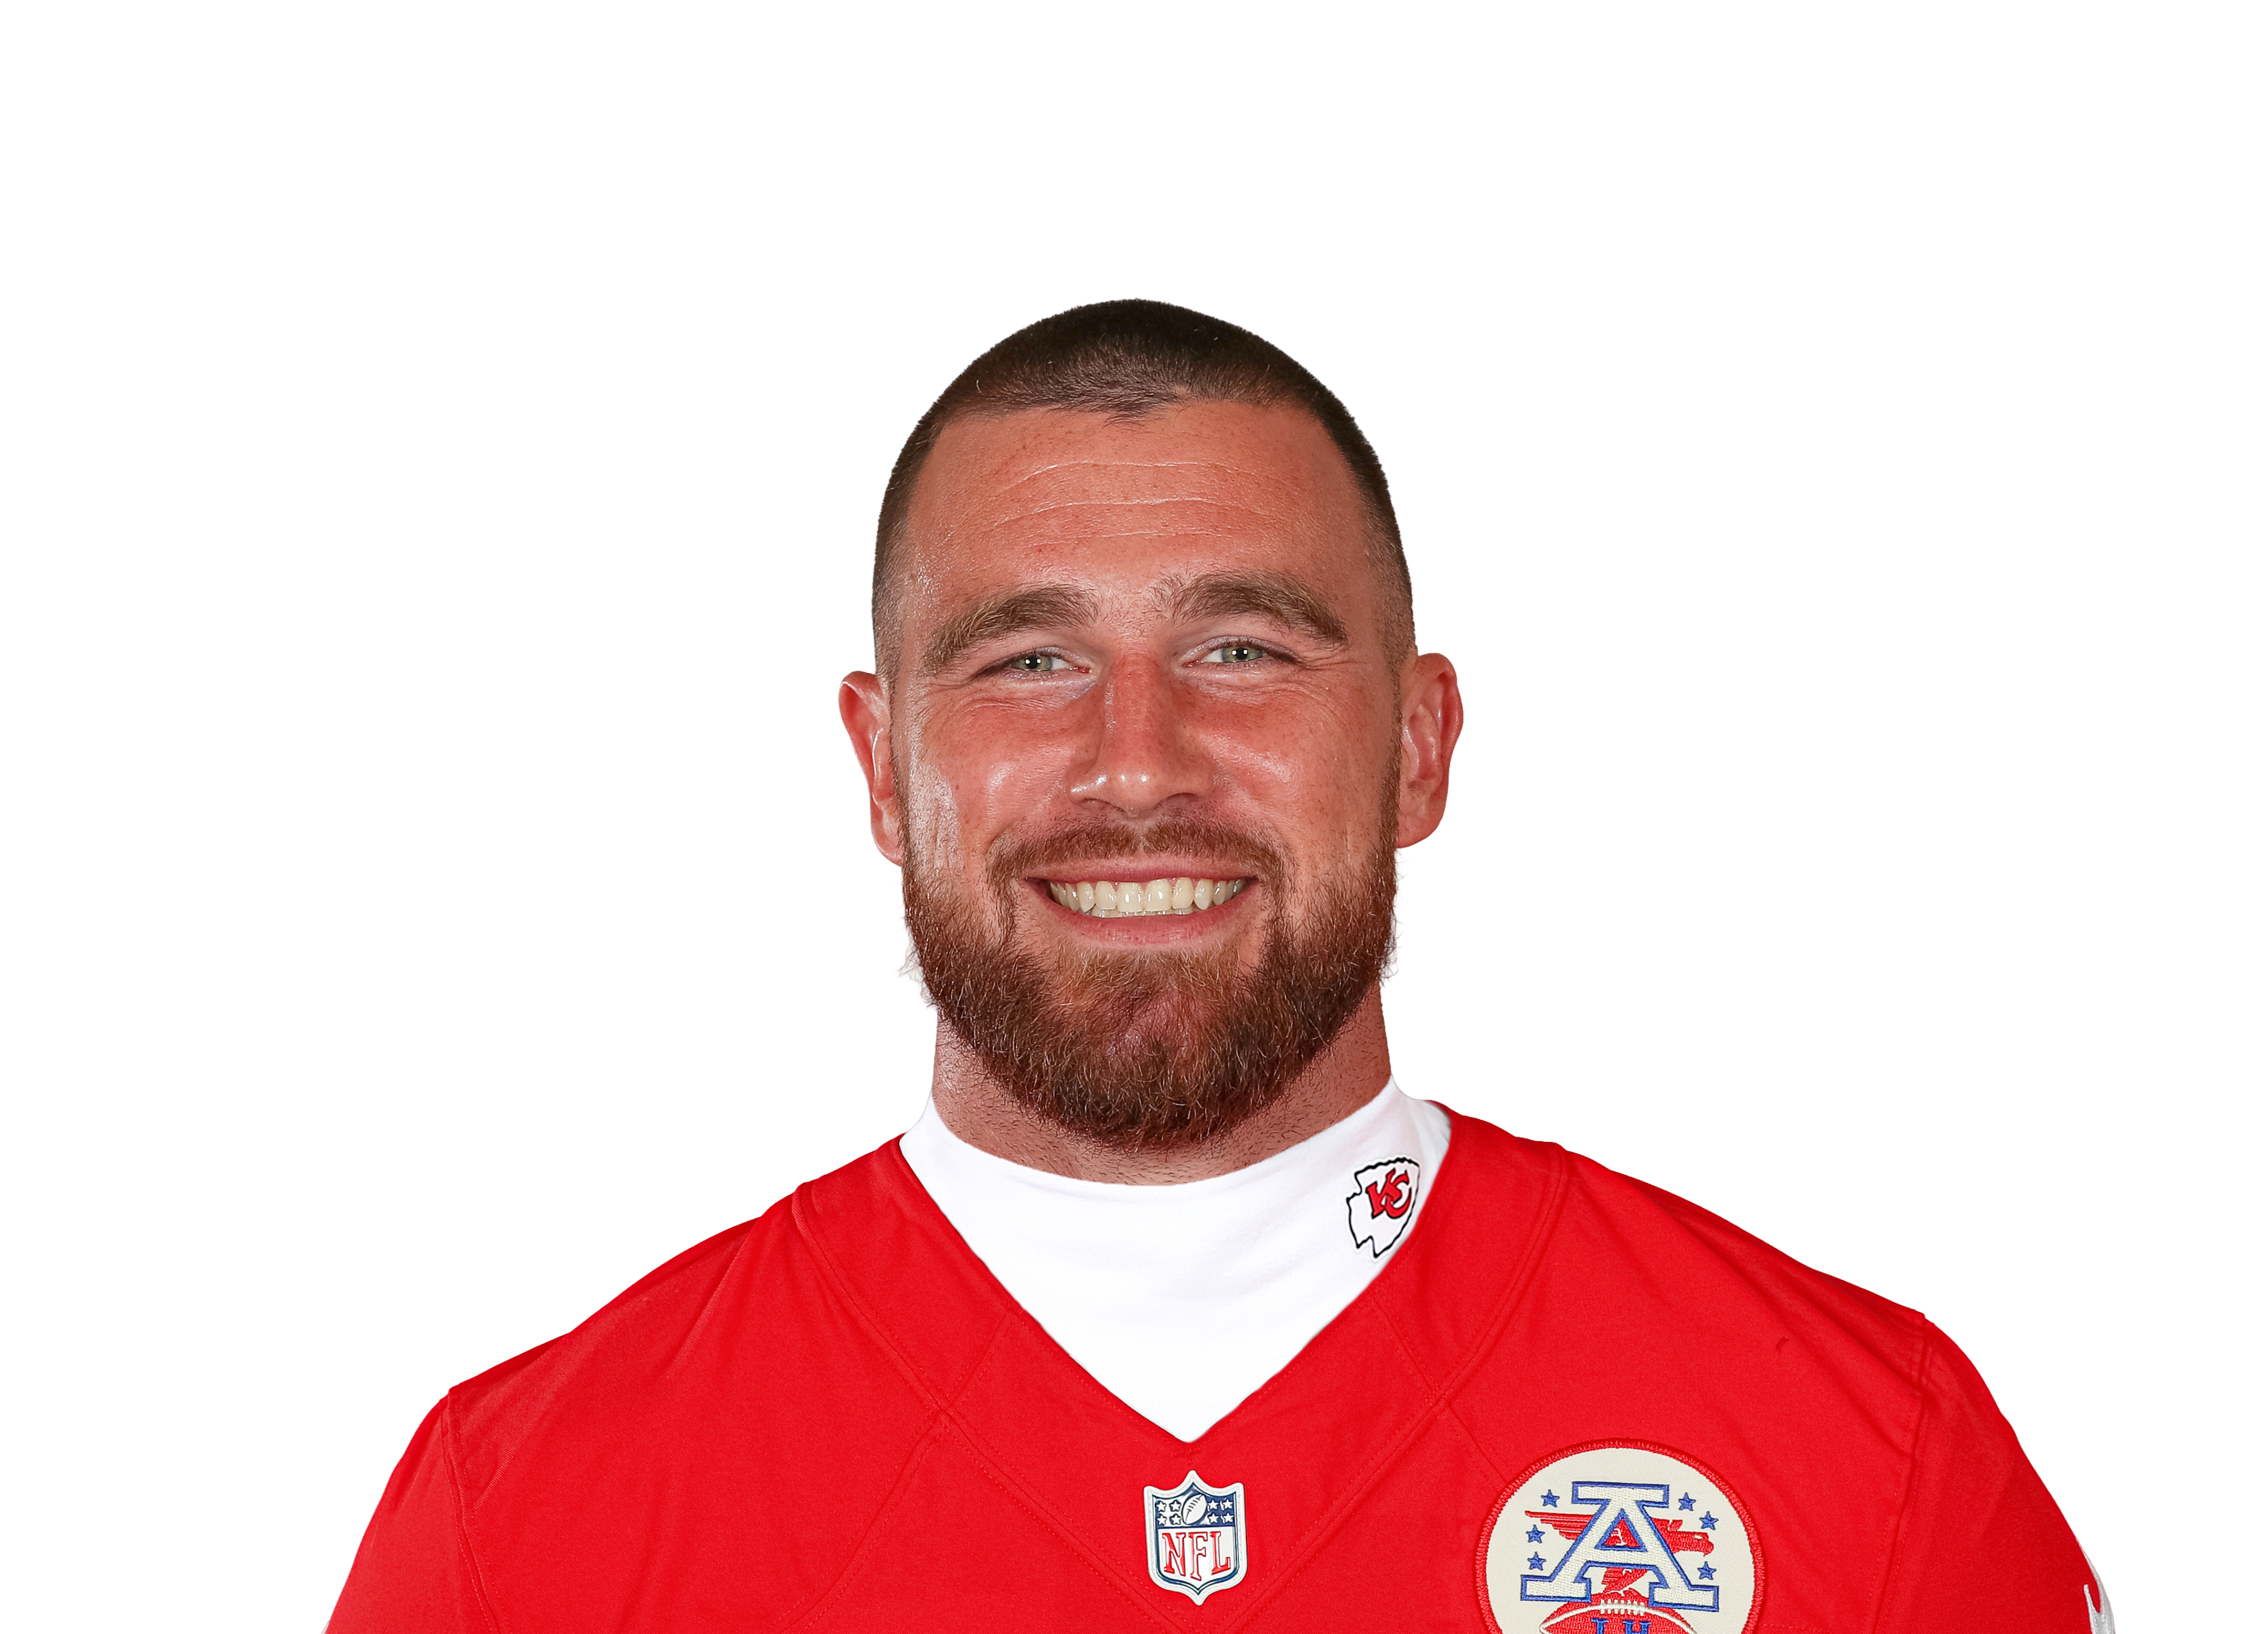
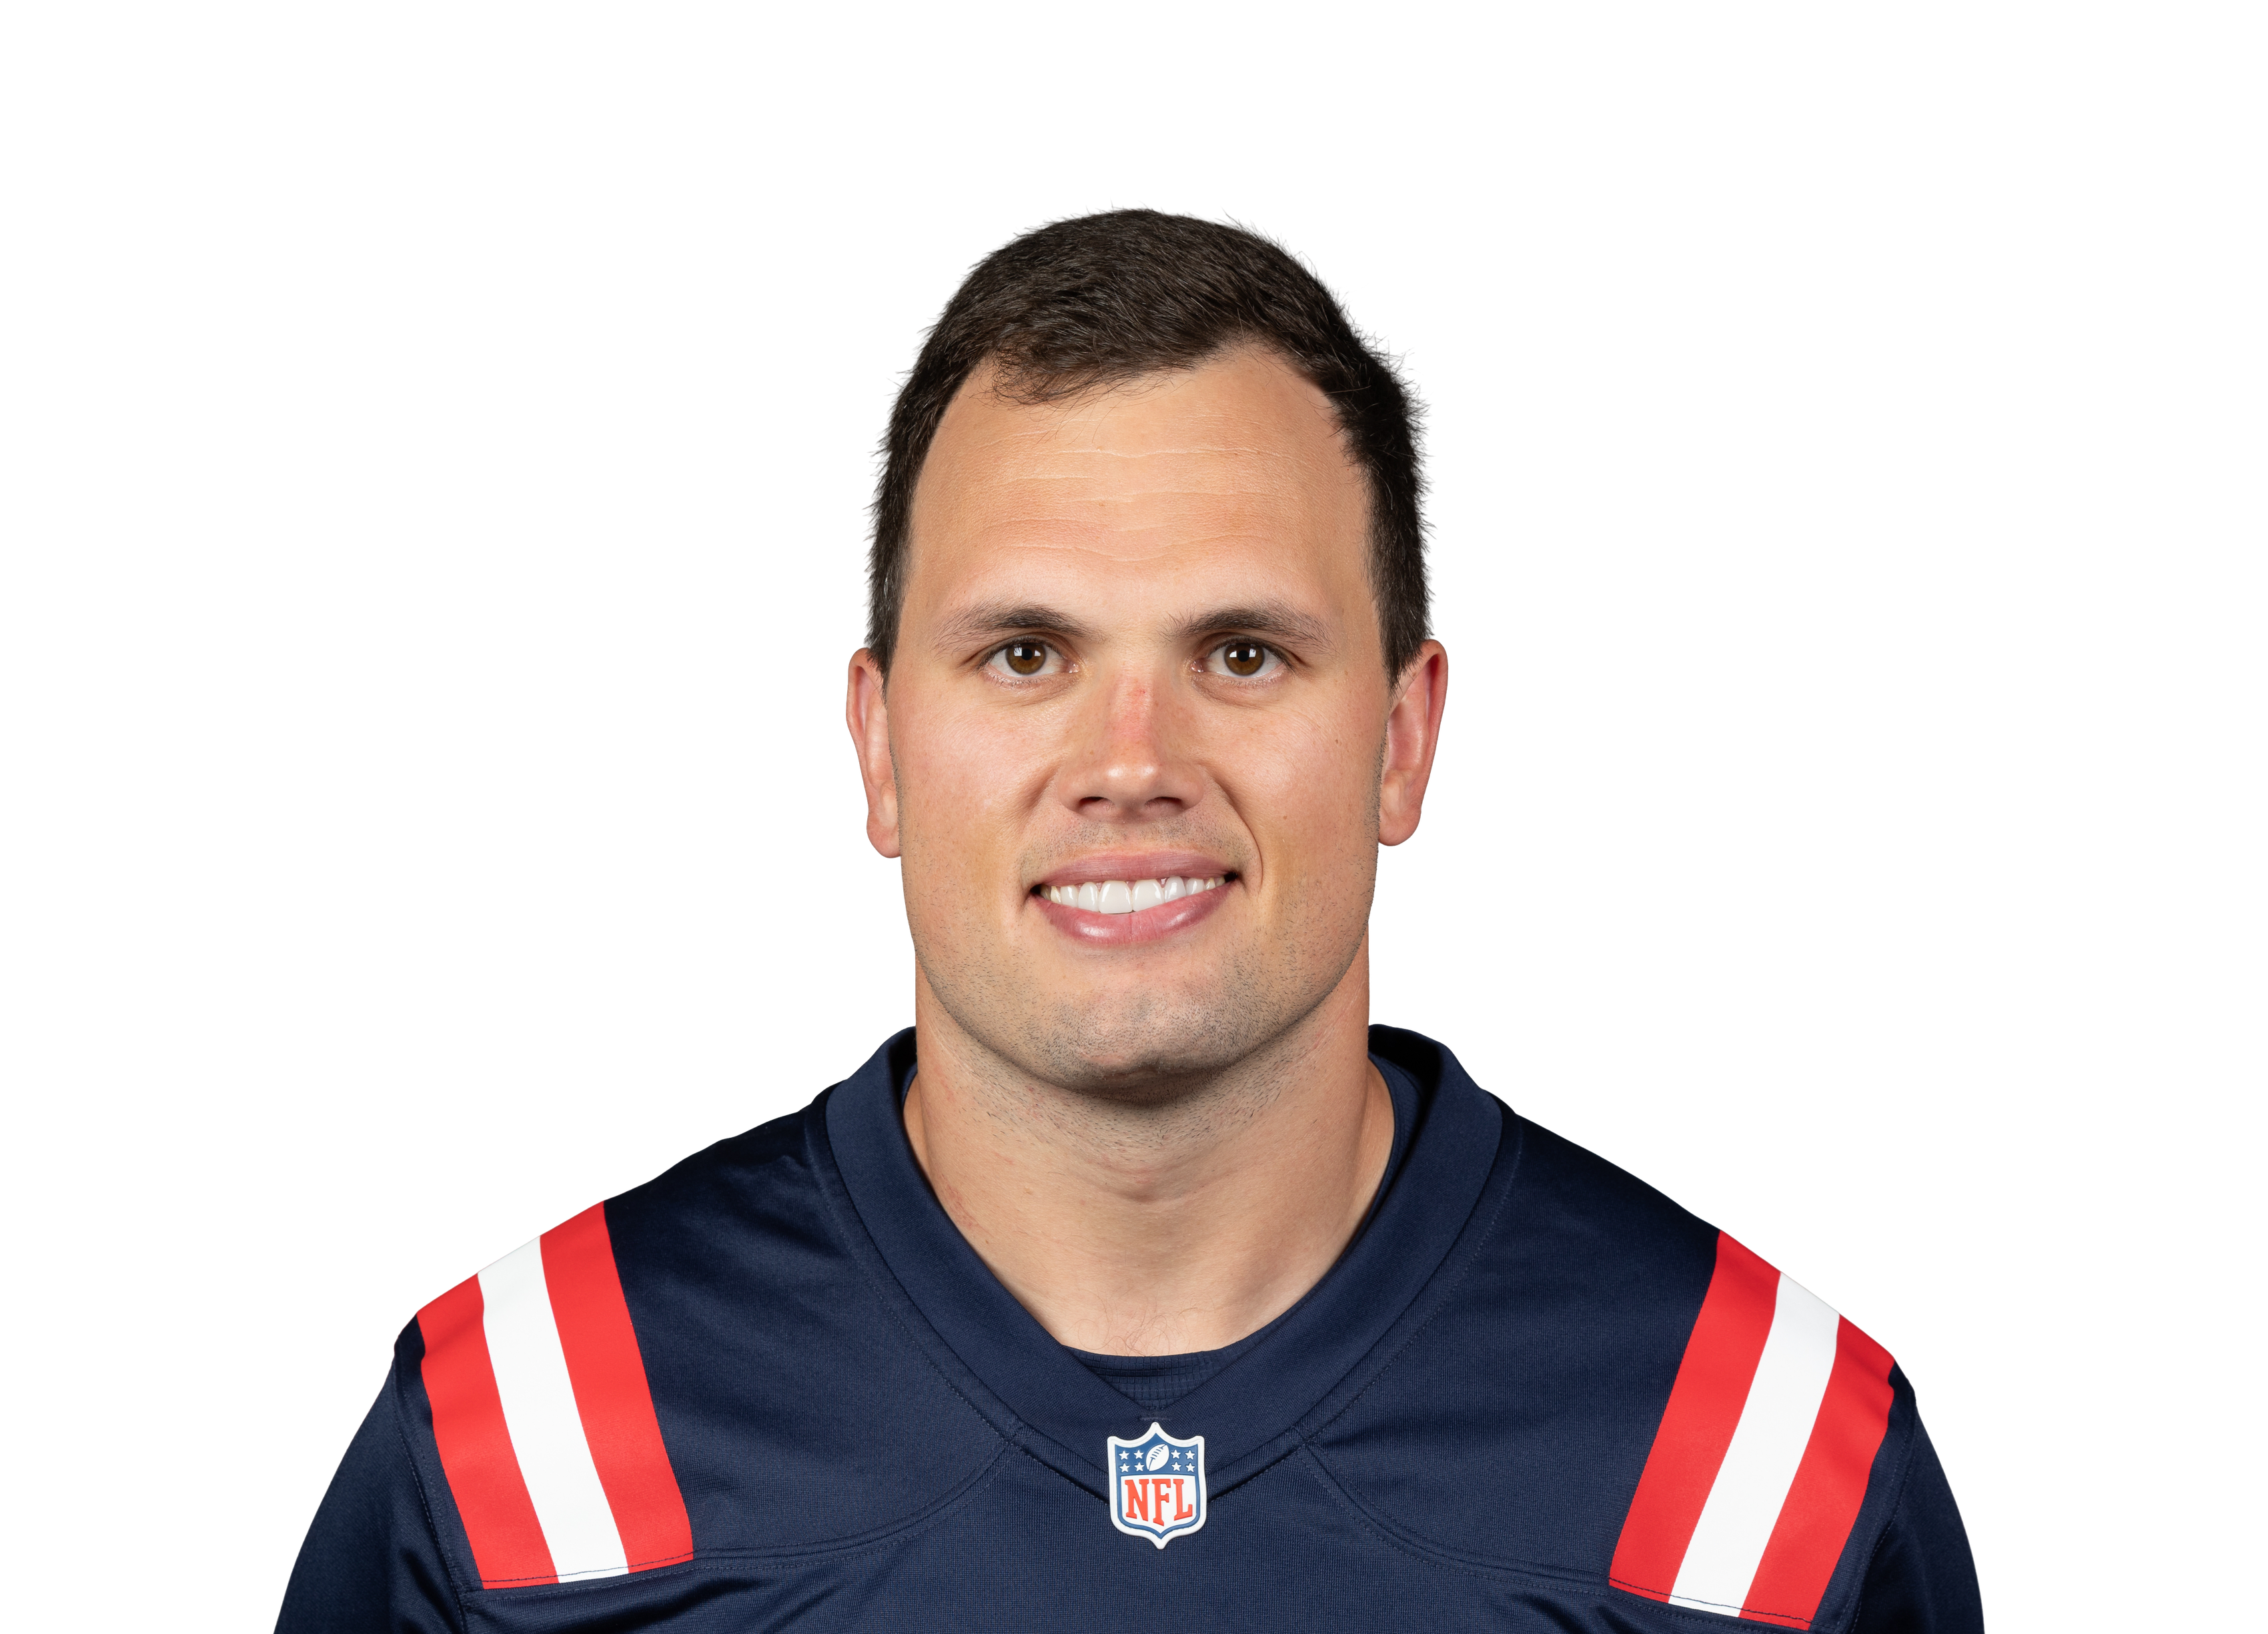
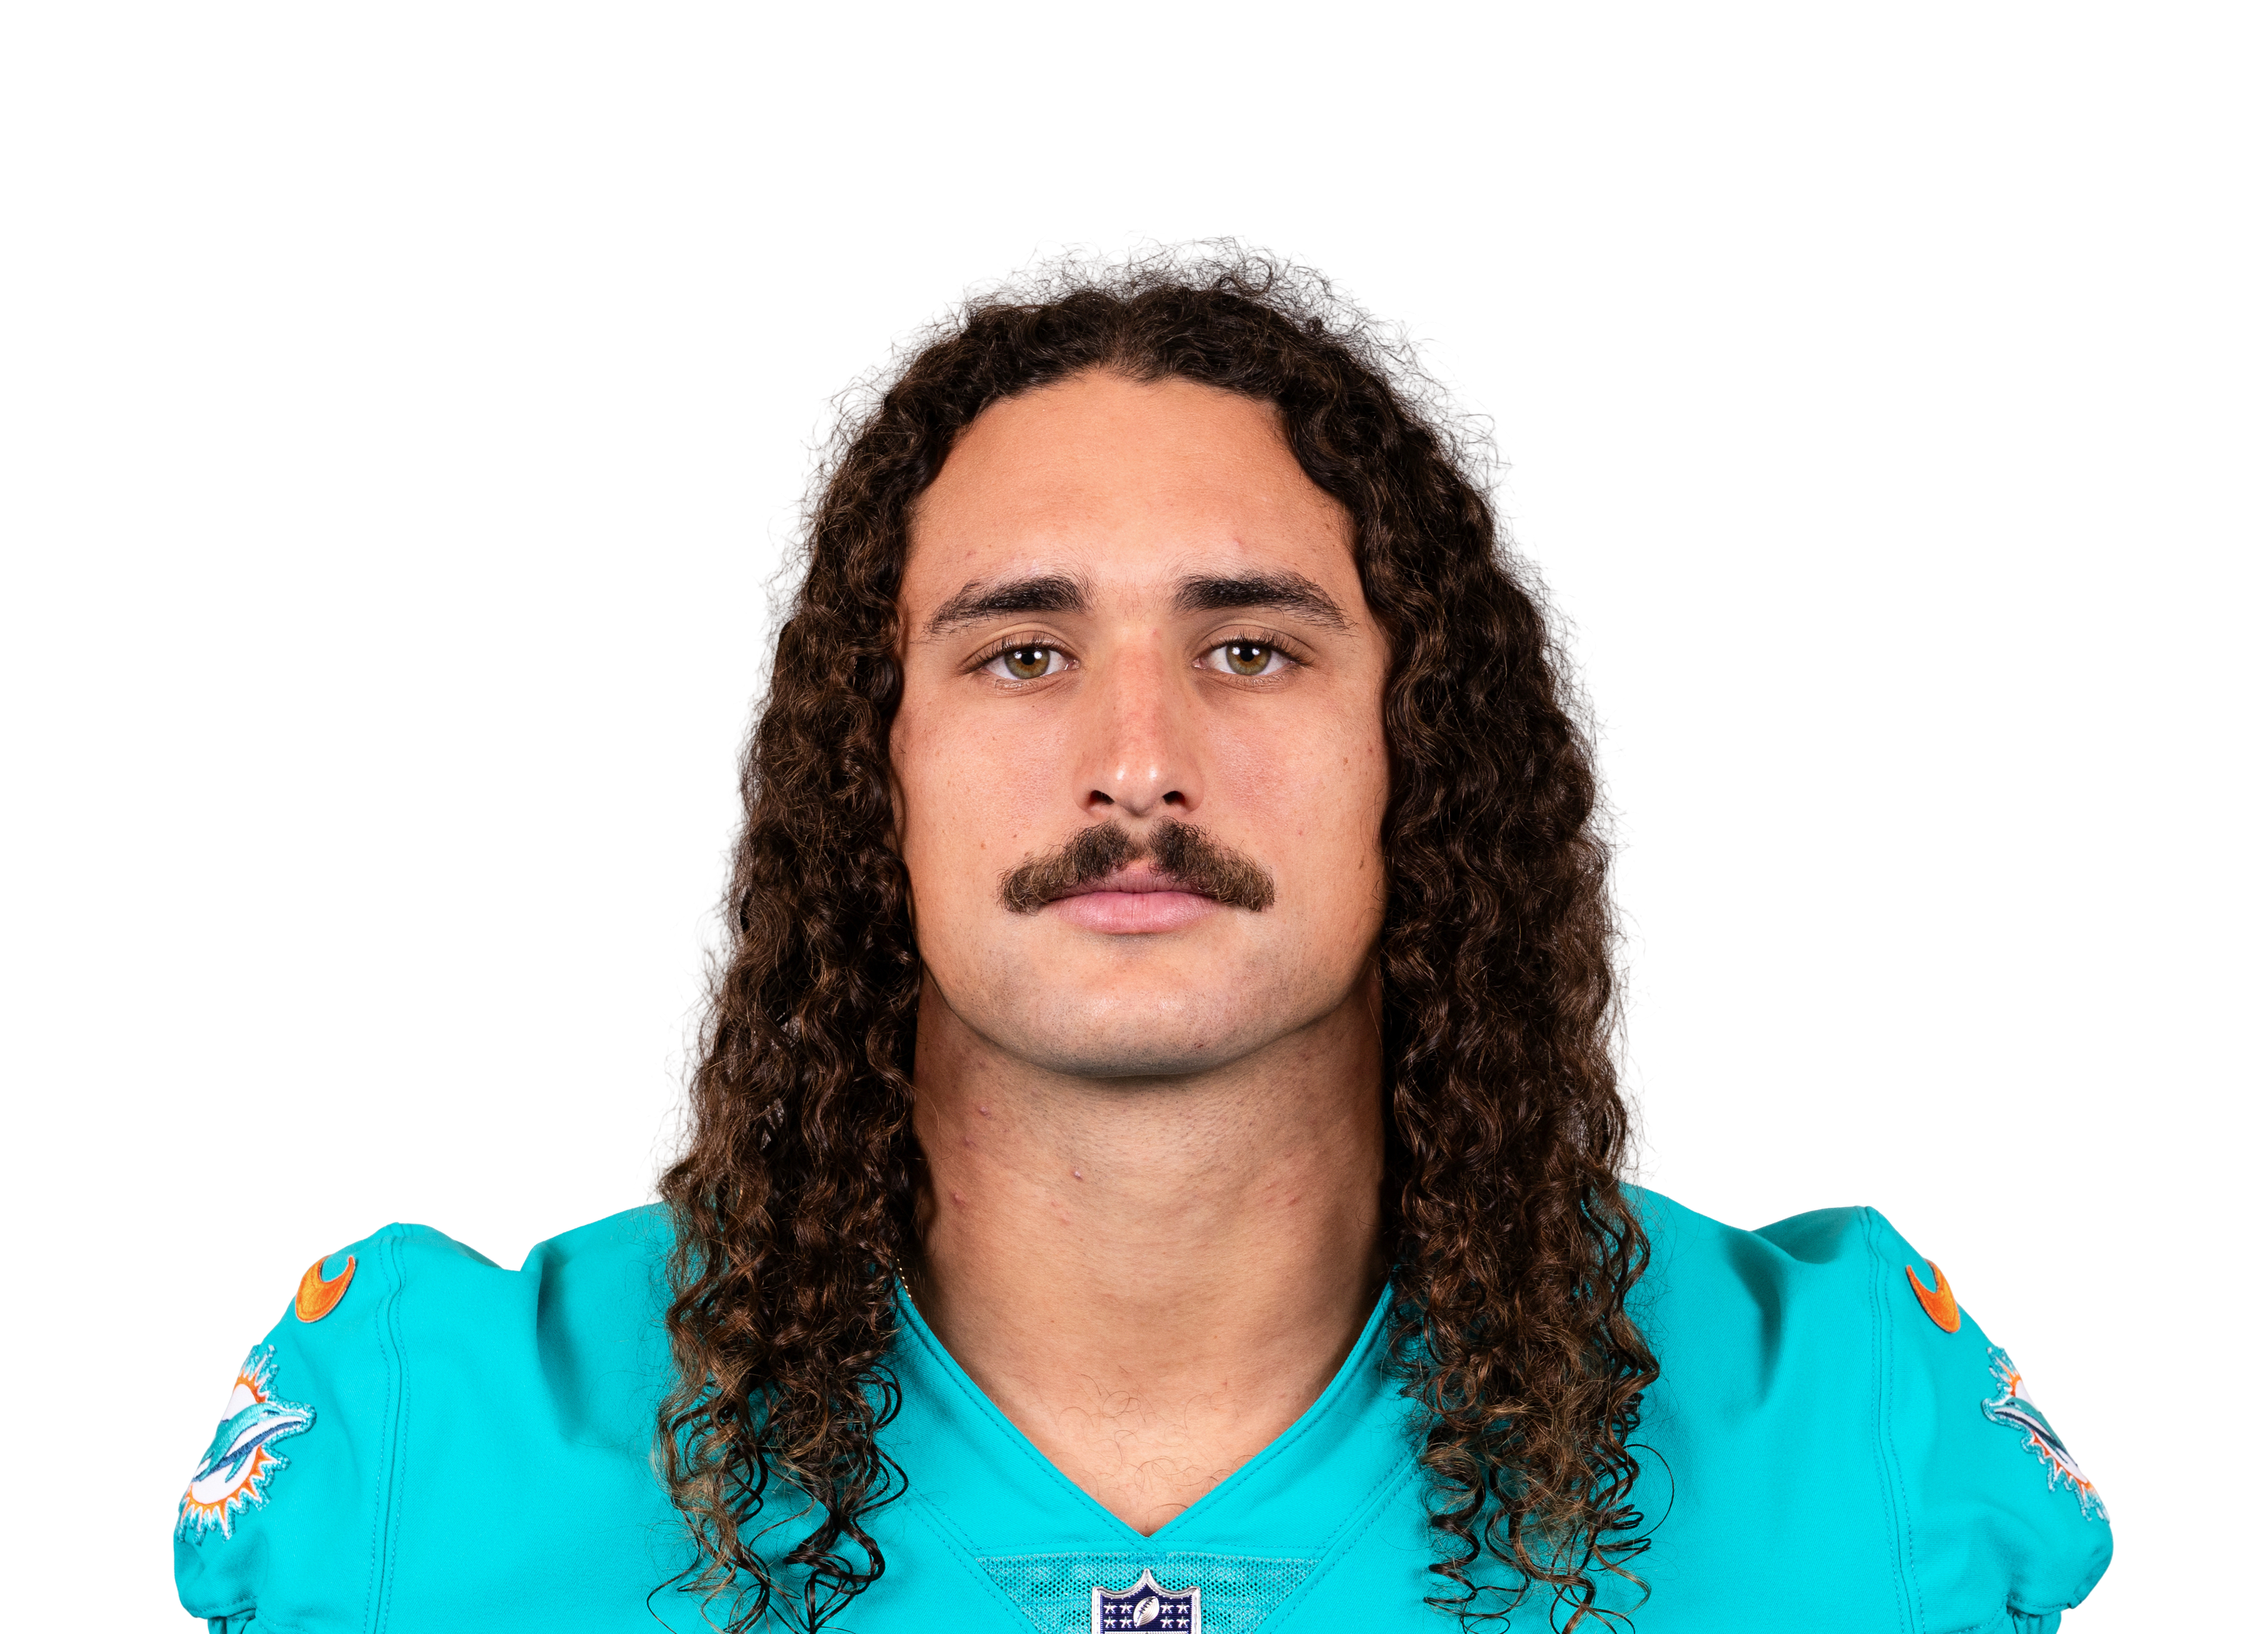
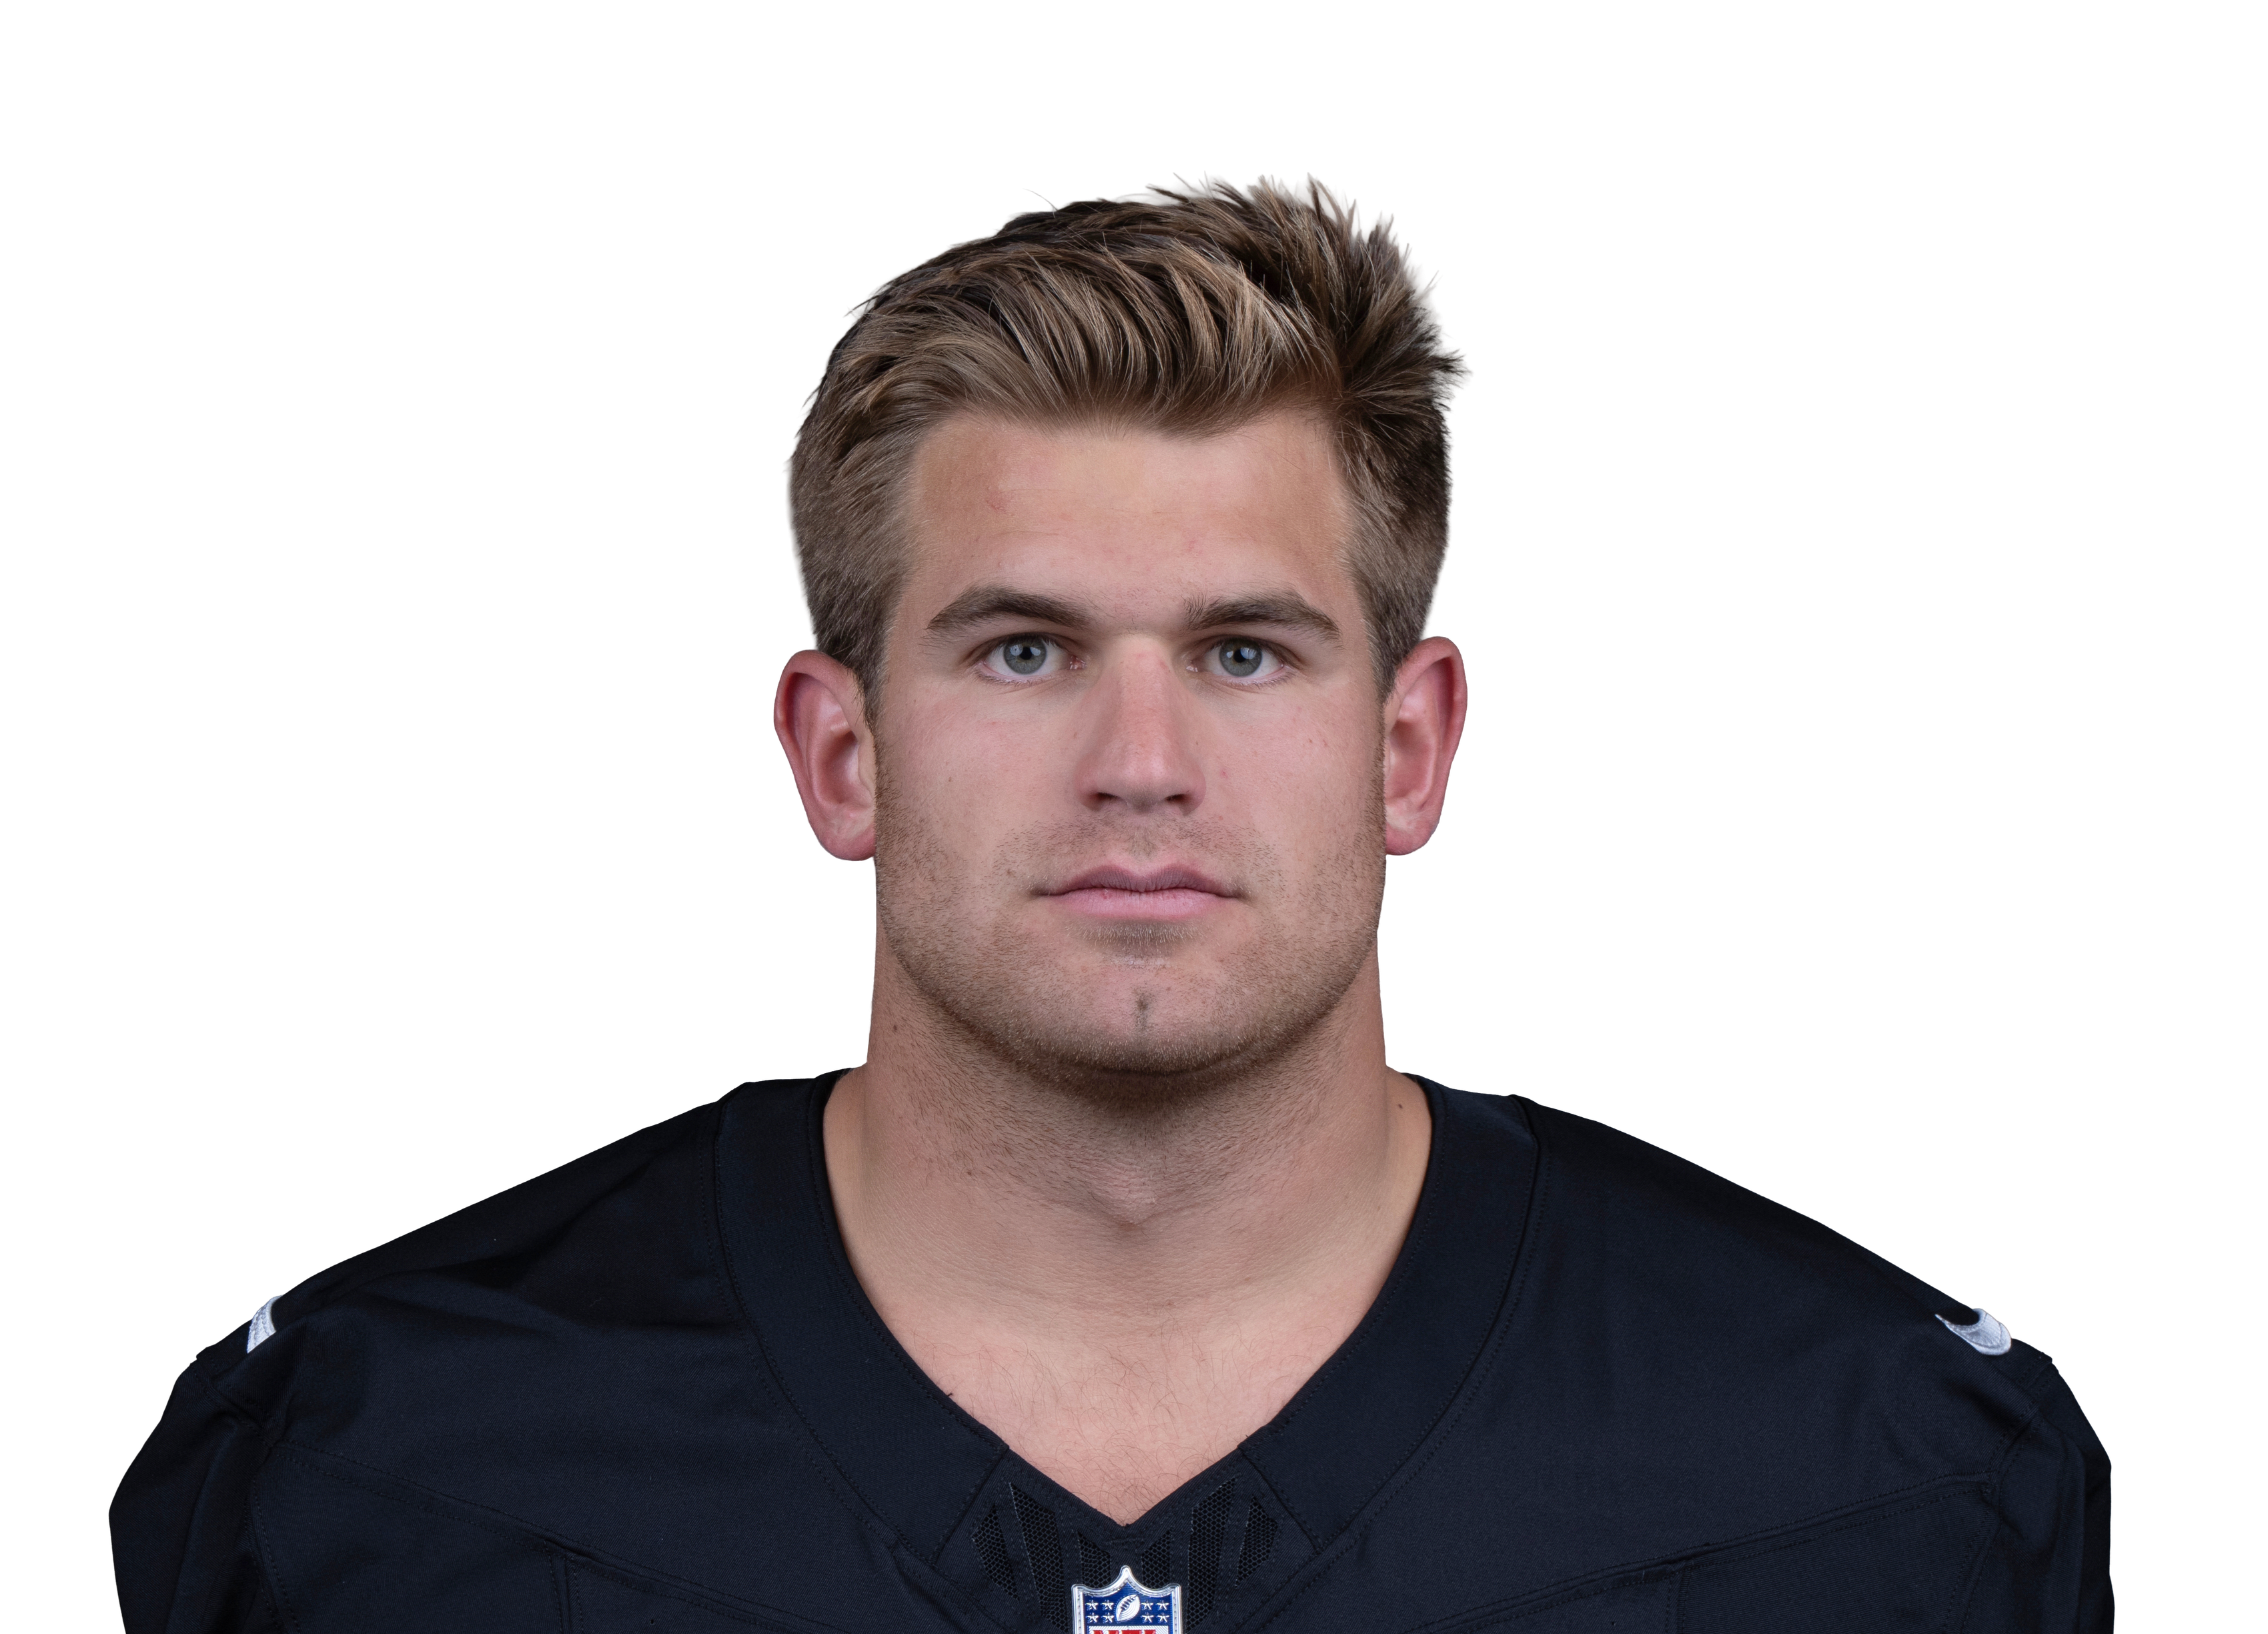
Fantasy points first, then the stats that matter for his position. Ring around each photo is that player's Mania Rating. Tap a name to open his profile.

Usage
Snaps
46%
Target share
12%
Targets/G
3.5
PPR/G
5.0
By the numbers
PPR / Game
5
49th percentileTE avg 5.9
Targets / Game
3.5
59th percentileTE avg 3.2
Receiving Yards / Game
19.9
51st percentileTE avg 23.3
Receptions / Game
2.3
55th percentileTE avg 2.3
Share of Team Targets
11.6%
58th percentileTE avg 10.4%
Share of Team Air Yards
12.1%
71st percentileTE avg 8.5%
Red-Zone Targets / Game
0.7
76th percentileTE avg 0.5
End-Zone Targets / Game
0.2
52nd percentileTE avg 0.2
Snap Share
45.8%
30th percentileTE avg 56.9%
TDs / Game
0.1
43rd percentileTE avg 0.2
LAC TE room
D. Njoku19%
C. Kolar13%
O. Gadsden II12%
P. Herbert0%
Share of targets
LAC TE room, week by week
Targets and receiving yards each week, with his share of the team targets and his snap percentage.
PlayerW1W2W3W4W5W6W8W9W10Per game
David Njoku558 yds19% targets55% snaps39 yds12% targets16% snaps———————4.034 yds a game • 8.4 per target15% targets36% snaps
Oronde Gadsden II232 yds7% targets18% snaps218 yds8% targets44% snaps30 yds9% targets57% snaps836 yds26% targets55% snaps10 yds5% targets58% snaps517 yds14% targets49% snaps552 yds17% targets48% snaps317 yds10% targets46% snaps17 yds6% targets21% snaps3.320 yds a game • 6.0 per target11% targets44% snaps
Charlie Kolar00 yds0% targets55% snaps321 yds12% targets62% snaps——437 yds19% targets76% snaps620 yds17% targets66% snaps420 yds13% targets62% snaps331 yds10% targets65% snaps316 yds19% targets72% snaps3.321 yds a game • 6.3 per target13% targets65% snaps
Patrick Herbert———00 yds0% targets6% snaps—————0.00 yds a game0% targets6% snaps
Hayden Rucci——00 yds0% targets41% snaps—17 yds5% targets18% snaps00 yds0% targets13% snaps—00 yds0% targets15% snaps—0.32 yds a game • 7.0 per target1% targets22% snaps
Each cell is targets that week, with receiving yards, share of team targets and snap percentage. Click a name to open that player.
Game log
8.8W4
0W5
4.7W6
10.2W8
3.7W9
1.7W10
Games9
PPR/G5.0
Game log
5.2W19.8W20W38.8W40W54.7W610.2W83.7W91.7W10
II avg 4.9NFL top 12 TEs avg 13.3
Solid dot is what he scored. Hollow dot is our projection before the game.
UseGameProjPPRTgtRecRec YdCarRush YdTDSnap
W1vs ARI 8.85.2223200018%
W2vs LV 6.49.8221800144%
W3vs BUF 5.9030000057%
W4vs SEA 5.58.8853612055%
W5vs DEN 8.5010000058%
W6vs KC 6.54.7531700049%
W8vs LA 5.810.2555200048%
W9vs HOU 6.93.7321700046%
W10vs BAL 6.11.711700021%
Opponent color:Easy defense for TEsAverageTough
Schedule ahead
11 NYJ12 NE13 TB14 LV15 SF16 MIA17 KC18 DEN
Green easier, red tougher
Schedule ahead
Colored by what each defense has given up to TEs so far. Green is an easier matchup, red is a tougher one.
Wk 11 NYJWk 12 NEWk 13 TBWk 14 LVWk 15 SFWk 16 MIAWk 17 KCWk 18 DEN
See every team's TE schedule ›
StatPer gameSeasonRank
Overall
Games—990›
PPR points544.148›
Touchdowns0.12143›
Receiving
Targets3.53060›
Catches2.32055›
Receiving yards19.917950›
Receiving TDs—170›
Yards per target5.7—34›
Yards per catch2—95›
Rushing
Carries0.1181›
Rush yards0.2286›
Scrimmage yards20.218152›
Usage
Snap %46%—29›
Target share %11.6%—58›
Touch share %6.1%—57›
Carry share %0.5%—90›
Air yards share %12.1%21272›
Scoring chances
Red-zone targets0.7672›
End-zone targets0.2252›
Tap any stat to see everyone ranked. Bars: green top 30%, yellow middle, red bottom 40%.
Advanced stats

Too few plays to rank yet (needs 35 targets, he has 30). Here are his raw numbers so far.

DropsNot ranked
3 on 30 targets · 10.0%
Broken tacklesNot ranked
0 on 20 catches
Yards after the catchNot ranked
4.1 per catch
LAC
62.7
Mania Rating
Overall profile · Depth
64.1
Week 11 Rating
Start value vs NYJ

Oronde Gadsden II

Age 23 · LAC · TE · 9 games
#198 OverallTE40#2 TE on LACDepth TE2 ›
Week 11 projection 5.9 PPR ›TE29 this week
TE29 this week
Games counted
Untick or tick any game and Mania Rating, matchup and Week 11 Rating all recalculate. Official Mania Rating 62.7.
Mix and match games

Pick a teammate with or without. Pick more than one to combine them, like a game without the QB and without the other back.

Herbert QB ✓ current
Johnston WR
Harris WR
Kolar TE
Teammate injuries shift his Week 11 Rating1 teammate note ▾
Charlie Kolar (TE, Questionable) +1.3 • without him that work was worth 8.9 pts vs 4.2 with (2 games)
Injury report updated Sat Nov 21, 6:45 AM ET
Week 11 Rating = recent role + opponent + the latest injury report (updated Sat Nov 21, 6:45 AM ET). Check final inactives before you set your lineup.
Week 11 projection
5.9
projected points
Floor 0.6 · Ceiling 12.6
+0.1Game script
0.0Matchup
+0.4Injuries
Week 11 projection
LAC
VSPPR
NYJ
Easy matchup • NYJ is #11 in points allowed to TEs
5.9
projected pointsReceiving 3.1 targets, 2.3 catches, 24 yds • 0.20 TD
Floor 0.64 of 5 games land hereCeiling 12.6
Vegas lines included. From usage alone: 5.8. Sportsbook lines imply 6.0. Blended: 5.9. Right now he is in line with the sportsbooks.
+0.1Game script
0.0Matchup
+0.4Injuries
How this is built
Recent and last-season usage, the Vegas spread and total, how this defense treats his position, and the injury report (teammates out, QB out). The three boxes show how many points each moved it. When sportsbook player lines are posted (Wednesday to Sunday) they are blended in, leaning on them most for new starters and players with few games. PPR scoring only. Tested on past seasons it is about 5% closer than a plain season average.
LAC TE room
D. Njoku19%
C. Kolar13%
O. Gadsden II12%
P. Herbert0%
Share of targets
LAC TE room, week by week
Targets and receiving yards each week, with his share of the team targets and his snap percentage.
PlayerW1W2W3W4W5W6W8W9W10Per game
David Njoku558 yds19% targets55% snaps39 yds12% targets16% snaps———————4.034 yds a game • 8.4 per target15% targets36% snaps
Oronde Gadsden II232 yds7% targets18% snaps218 yds8% targets44% snaps30 yds9% targets57% snaps836 yds26% targets55% snaps10 yds5% targets58% snaps517 yds14% targets49% snaps552 yds17% targets48% snaps317 yds10% targets46% snaps17 yds6% targets21% snaps3.320 yds a game • 6.0 per target11% targets44% snaps
Charlie Kolar00 yds0% targets55% snaps321 yds12% targets62% snaps——437 yds19% targets76% snaps620 yds17% targets66% snaps420 yds13% targets62% snaps331 yds10% targets65% snaps316 yds19% targets72% snaps3.321 yds a game • 6.3 per target13% targets65% snaps
Patrick Herbert———00 yds0% targets6% snaps—————0.00 yds a game0% targets6% snaps
Hayden Rucci——00 yds0% targets41% snaps—17 yds5% targets18% snaps00 yds0% targets13% snaps—00 yds0% targets15% snaps—0.32 yds a game • 7.0 per target1% targets22% snaps
Each cell is targets that week, with receiving yards, share of team targets and snap percentage. Click a name to open that player.
Game log
8.8W4
0W5
4.7W6
10.2W8
3.7W9
1.7W10
Games9
PPR/G5.0
Game log
5.2W19.8W20W38.8W40W54.7W610.2W83.7W91.7W10
II avg 4.9NFL top 12 TEs avg 13.3
Solid dot is what he scored. Hollow dot is our projection before the game.
UseGameProjPPRTgtRecRec YdCarRush YdTDSnap
W1vs ARI 8.85.2223200018%
W2vs LV 6.49.8221800144%
W3vs BUF 5.9030000057%
W4vs SEA 5.58.8853612055%
W5vs DEN 8.5010000058%
W6vs KC 6.54.7531700049%
W8vs LA 5.810.2555200048%
W9vs HOU 6.93.7321700046%
W10vs BAL 6.11.711700021%
Opponent color:Easy defense for TEsAverageTough
Schedule ahead
11 NYJ12 NE13 TB14 LV15 SF16 MIA17 KC18 DEN
Green easier, red tougher
Schedule ahead
Colored by what each defense has given up to TEs so far. Green is an easier matchup, red is a tougher one.
Wk 11 NYJWk 12 NEWk 13 TBWk 14 LVWk 15 SFWk 16 MIAWk 17 KCWk 18 DEN
See every team's TE schedule ›
StatPer gameSeasonRank
Overall
Games—990›
PPR points544.148›
Touchdowns0.12143›
Receiving
Targets3.53060›
Catches2.32055›
Receiving yards19.917950›
Receiving TDs—170›
Yards per target5.7—34›
Yards per catch2—95›
Rushing
Carries0.1181›
Rush yards0.2286›
Scrimmage yards20.218152›
Usage
Snap %46%—29›
Target share %11.6%—58›
Touch share %6.1%—57›
Carry share %0.5%—90›
Air yards share %12.1%21272›
Scoring chances
Red-zone targets0.7672›
End-zone targets0.2252›
Tap any stat to see everyone ranked. Bars: green top 30%, yellow middle, red bottom 40%.
Advanced stats

Too few plays to rank yet (needs 35 targets, he has 30). Here are his raw numbers so far.

DropsNot ranked
3 on 30 targets · 10.0%
Broken tacklesNot ranked
0 on 20 catches
Yards after the catchNot ranked
4.1 per catch
Mania breakdown
Fantasy Production47
Target Volume57
Team Target Role56
Red-Zone Threat64
Per-Target Efficiency26
Mania breakdown
Percentile among TEs. 100 is the best, 50 is average.
47
How many fantasy points and total yards he is actually producing, compared with players at his position. Ranks better than 47% of TEs.
57
How often he is targeted: targets per game, receptions and his share of the team targets. Ranks better than 57% of TEs.
56
How big a slice of his team passing game belongs to him: target share, air-yard share and snaps. Ranks better than 56% of TEs.
64
How often the offense uses him near the goal line: red-zone targets and end-zone targets. Ranks better than 64% of TEs.
26
What he produces with each chance instead of just rewarding volume: yards per target, catch rate and fantasy points per opportunity. Ranks better than 26% of TEs.
Top 30%MiddleBottom 40%Tap a category to see what it means.
Week 11 matchup
vs NYJ
Tough matchup
Adjustment-1.2 pts
Allows to TEs11th most
Week11
Week 11 matchup
vs NYJ
-0.6Rating boost
Neutral matchup11th easiest of 32 defenses for TEs
ToughEasy
14.1PPR a game NYJ allows to TEs
6.7Similar players, usual PPR a game
9.3Same players against NYJ
Players with a role like his scored 9.3 PPR a game against NYJ, versus 6.7 in their usual games (+40%). That moves his Week 11 Rating by -0.6. It is a small sample this early, so it counts for little.
How tight ends did against NYJ

14.1 PPR points a game allowed to tight ends, 11th most of 32 defenses.

PlayerPPRTgtRecRec YdRec TDRush Yd
Brock Bowersvs LV • Wk 828.21079220
Travis Kelce@ KC • Wk 917.3647201
Hunter Henry@ NE • Wk 614.8544810
Greg Dulcichvs MIA • Wk 713.6558600
Colston Loveland@ CHI • Wk 411.7965700
Michael Mayervs LV • Wk 810.3655300
Dalton Kincaidvs BUF • Wk 107.8325800
Sam LaPorta@ DET • Wk 37.4434400
Gunnar Helm@ TEN • Wk 16.8542800
Tucker Kraftvs GB • Wk 23.5321500
Cole Kmet@ CHI • Wk 43.3221300
Brock Wright@ DET • Wk 32.722700
Eli Raridon@ NE • Wk 62.1311100
Noah Gray@ KC • Wk 92.1111100
Jackson Meeks@ DET • Wk 31.811800
Sam Roush@ CHI • Wk 41.811800
Daniel Bellinger@ TEN • Wk 11.711700
Dawson Knoxvs BUF • Wk 101.731700
Harold Fannin Jr.vs CLE • Wk 51.441400
Jake Briningstool@ KC • Wk 91.321300
Seydou Traorevs MIA • Wk 70.010000

Fantasy points first, then the stats that matter for his position. Ring around each photo is that player's Mania Rating. Tap a name to open his profile.

Usage
Snaps
46%
Target share
12%
Targets/G
3.5
PPR/G
5.0
By the numbers
PPR / Game
5
49th percentileTE avg 5.9
Targets / Game
3.5
59th percentileTE avg 3.2
Receiving Yards / Game
19.9
51st percentileTE avg 23.3
Receptions / Game
2.3
55th percentileTE avg 2.3
Share of Team Targets
11.6%
58th percentileTE avg 10.4%
Share of Team Air Yards
12.1%
71st percentileTE avg 8.5%
Red-Zone Targets / Game
0.7
76th percentileTE avg 0.5
End-Zone Targets / Game
0.2
52nd percentileTE avg 0.2
Snap Share
45.8%
30th percentileTE avg 56.9%
TDs / Game
0.1
43rd percentileTE avg 0.2

More on Oronde Gadsden II

Start/sit this week

More TEs

Rankings

Tools

Mania Ratings and projections through Week 10 of the 2026 season, updated during the week. Tap anything above to open the full interactive profile in Fantasy Mania.