

Jake Ferguson
 DAL • TE • 8 games
Pick a teammate with or without. Pick more than one to combine them, like a game without the QB and without the other back.

12.6 PPR points a game allowed to tight ends, 20th most of 32 defenses.
| Player | PPR | Tgt | Rec | Rec Yd | Rec TD | Rush Yd |
|---|---|---|---|---|---|---|
 Mike Gesicki@ CIN • Wk 8 | 17.6 | 6 | 4 | 76 | 1 | 0 |
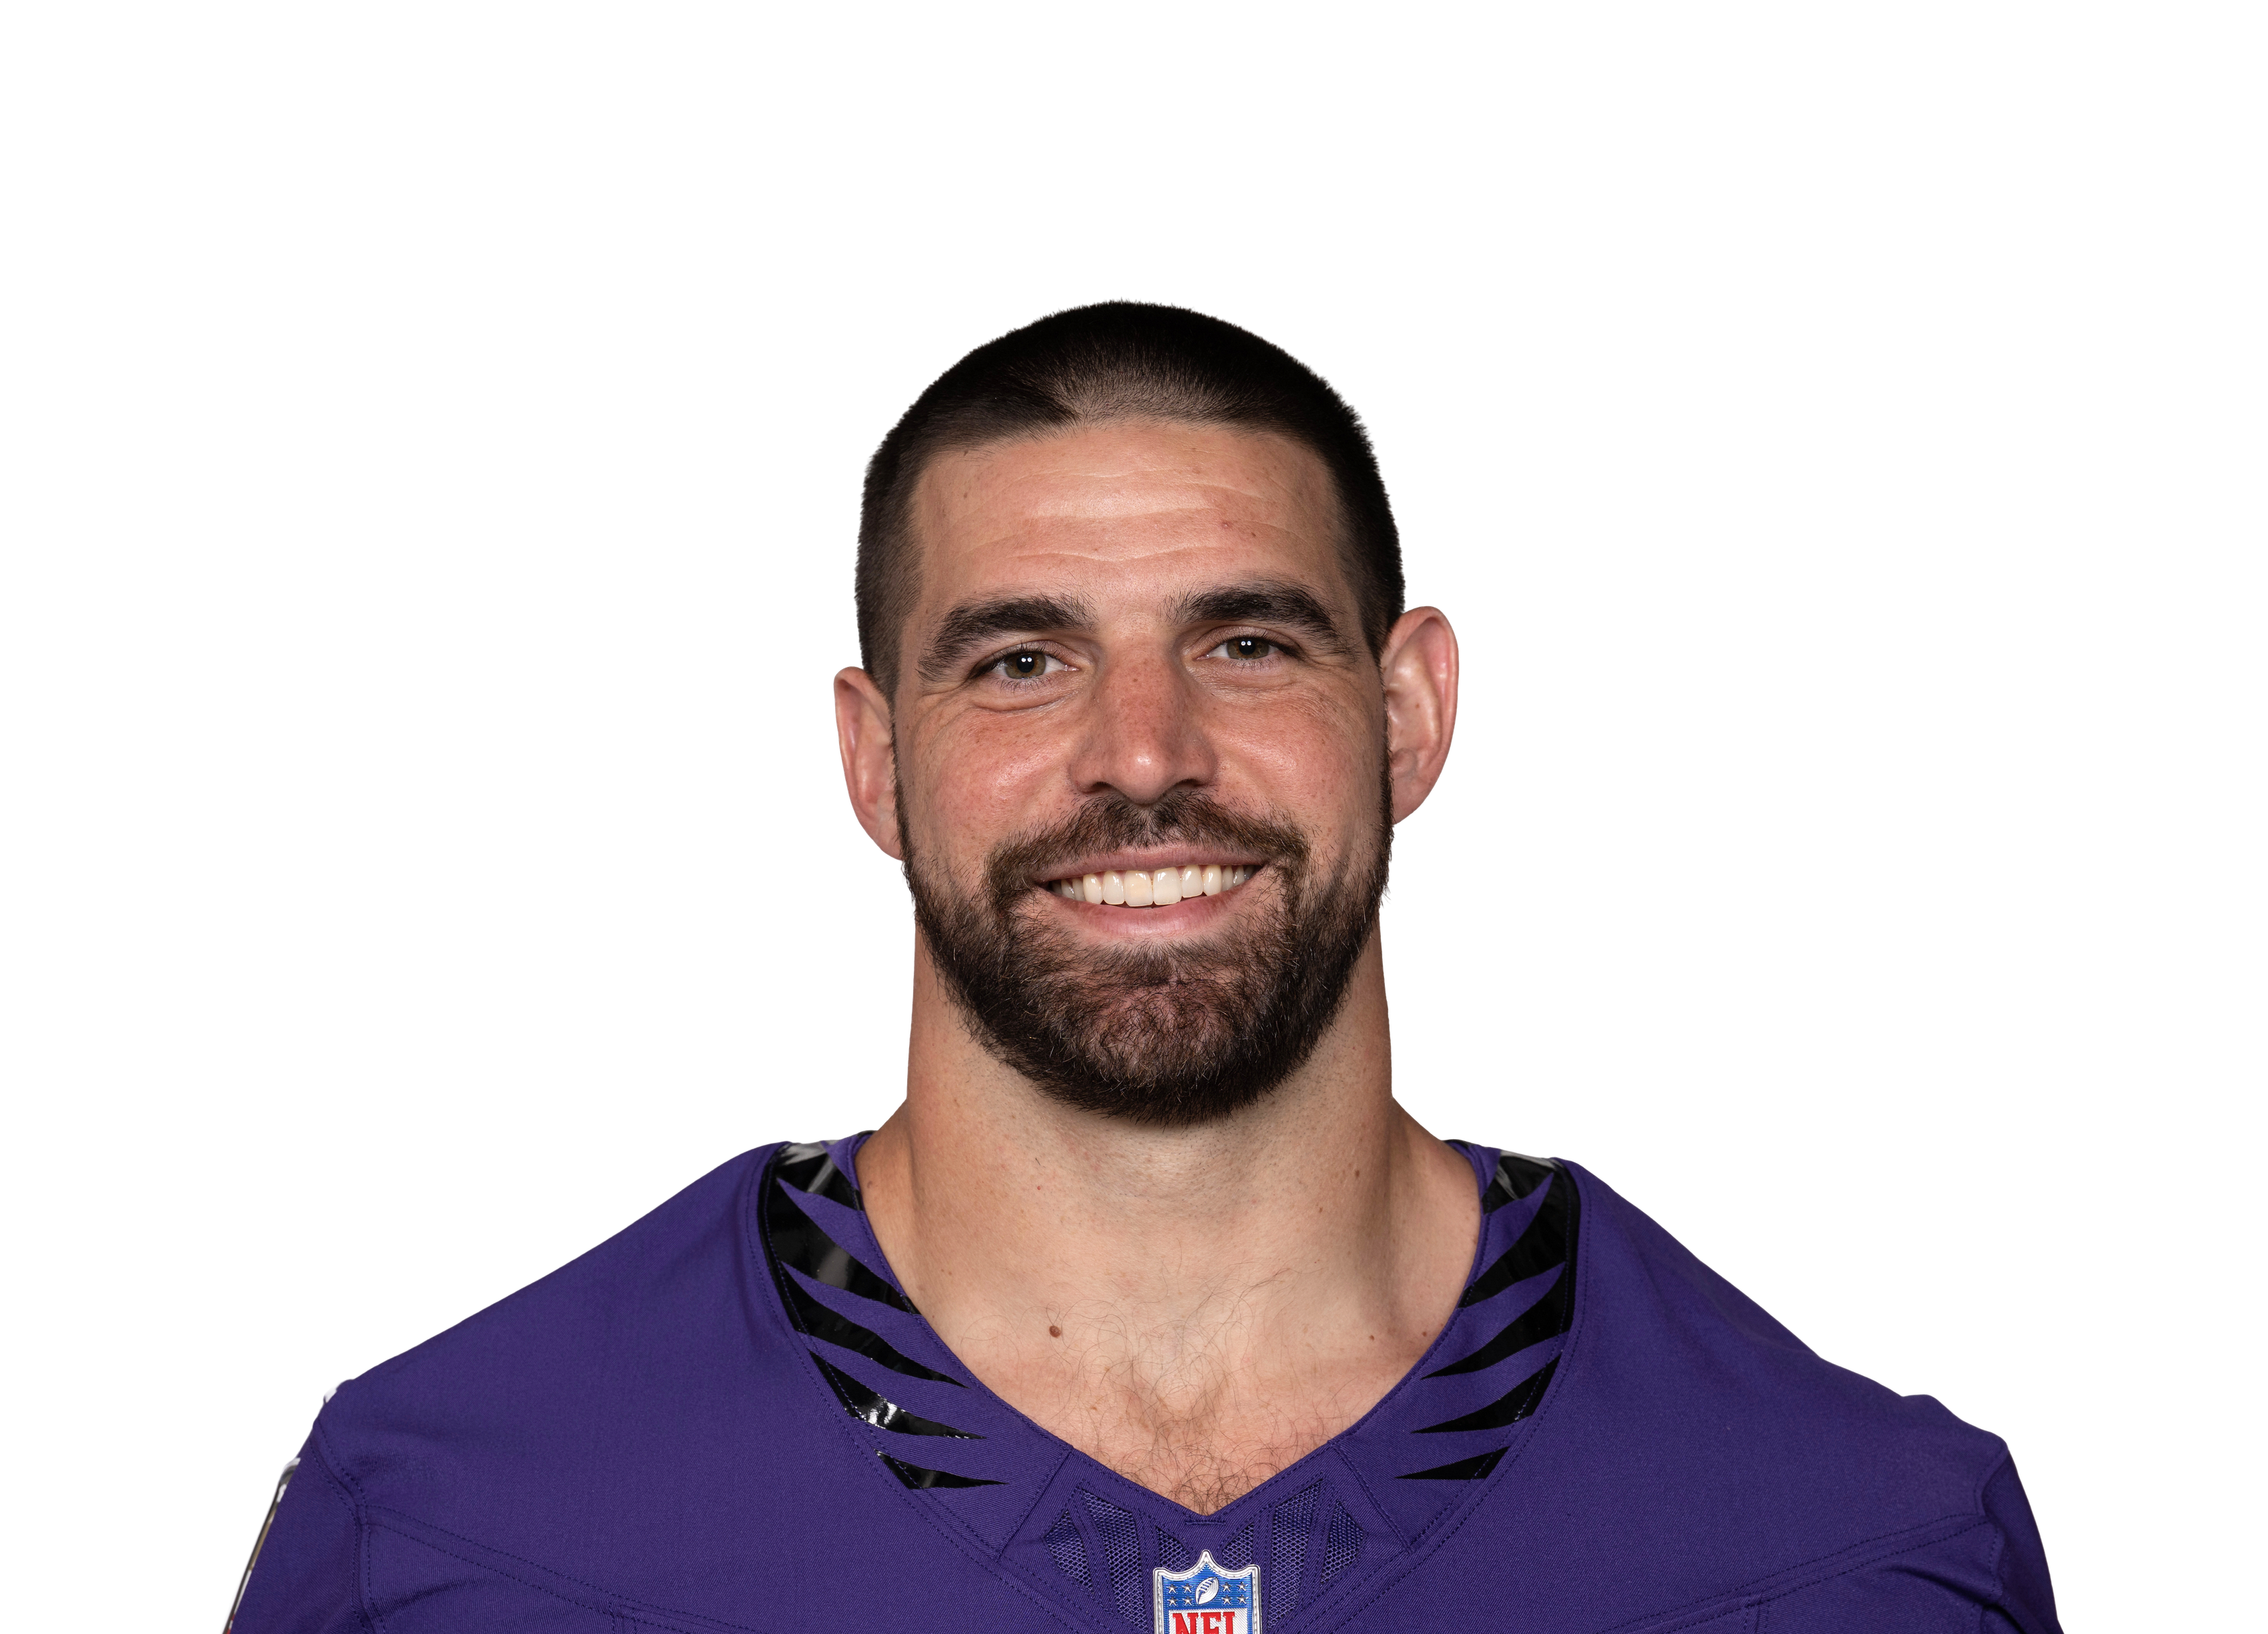 Mark Andrews@ BAL • Wk 4 | 13.7 | 6 | 5 | 27 | 1 | 0 |
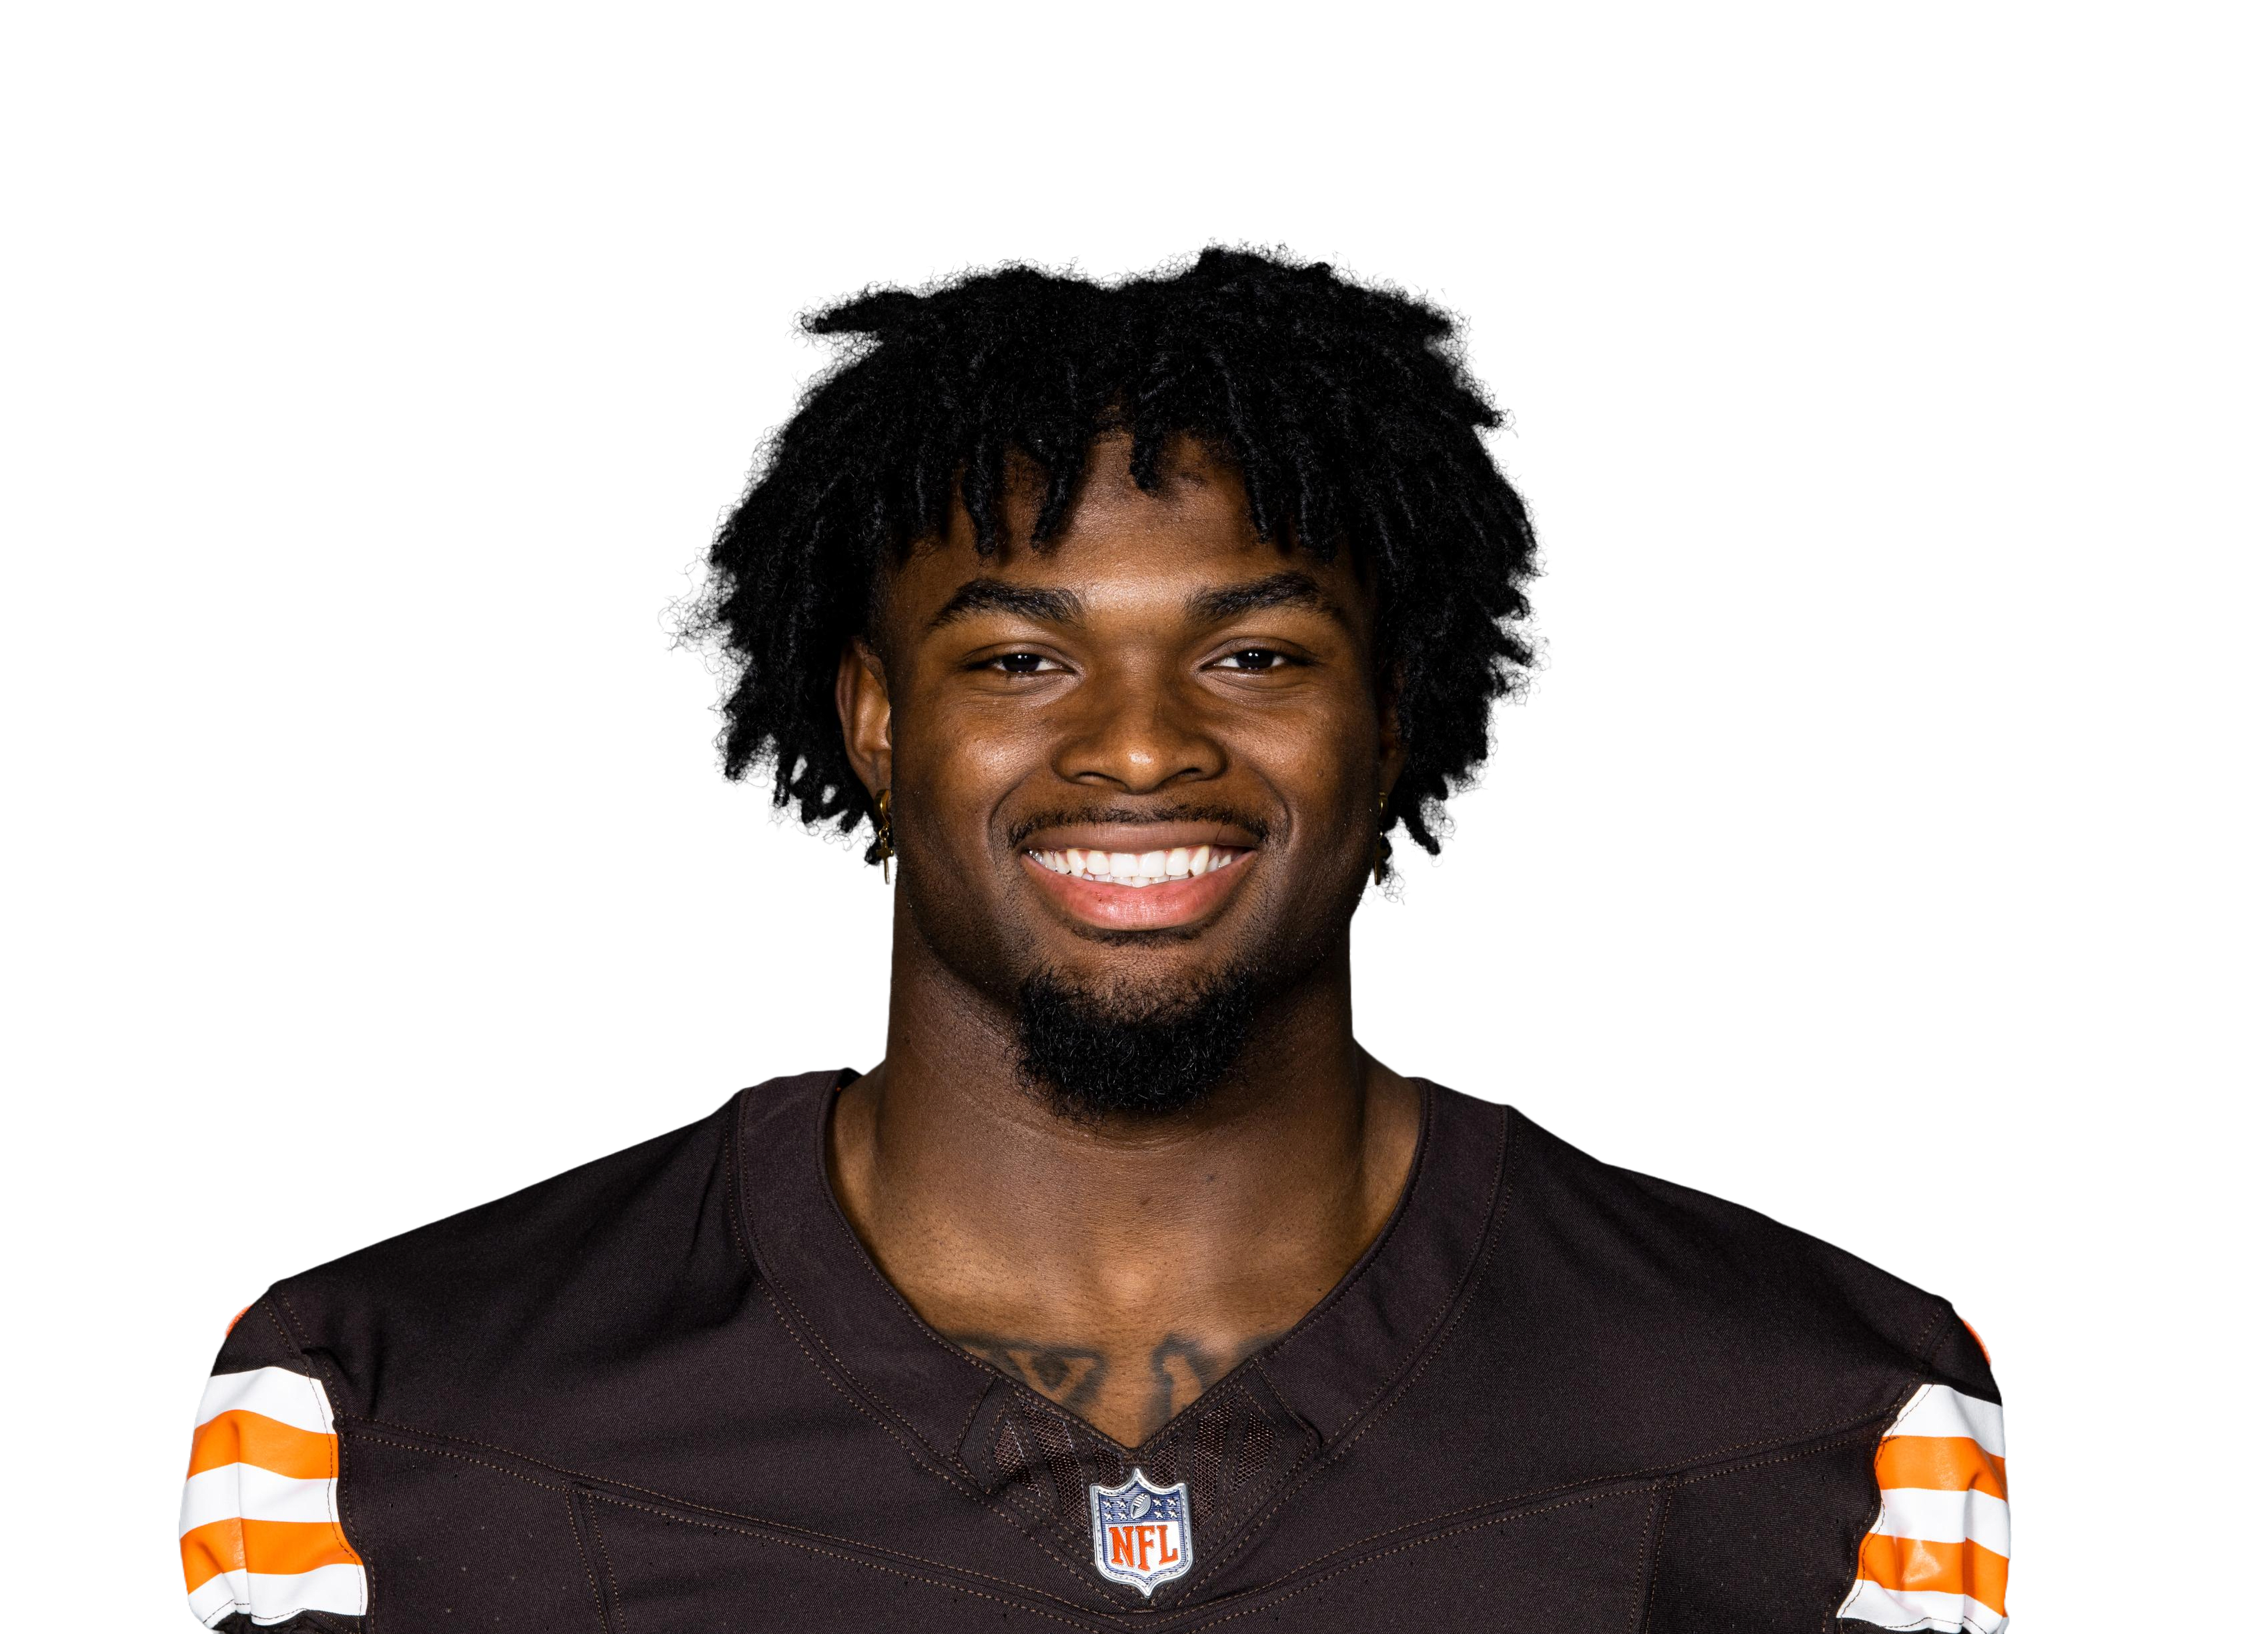 Harold Fannin Jr.vs CLE • Wk 7 | 13.1 | 9 | 6 | 91 | 0 | 0 |
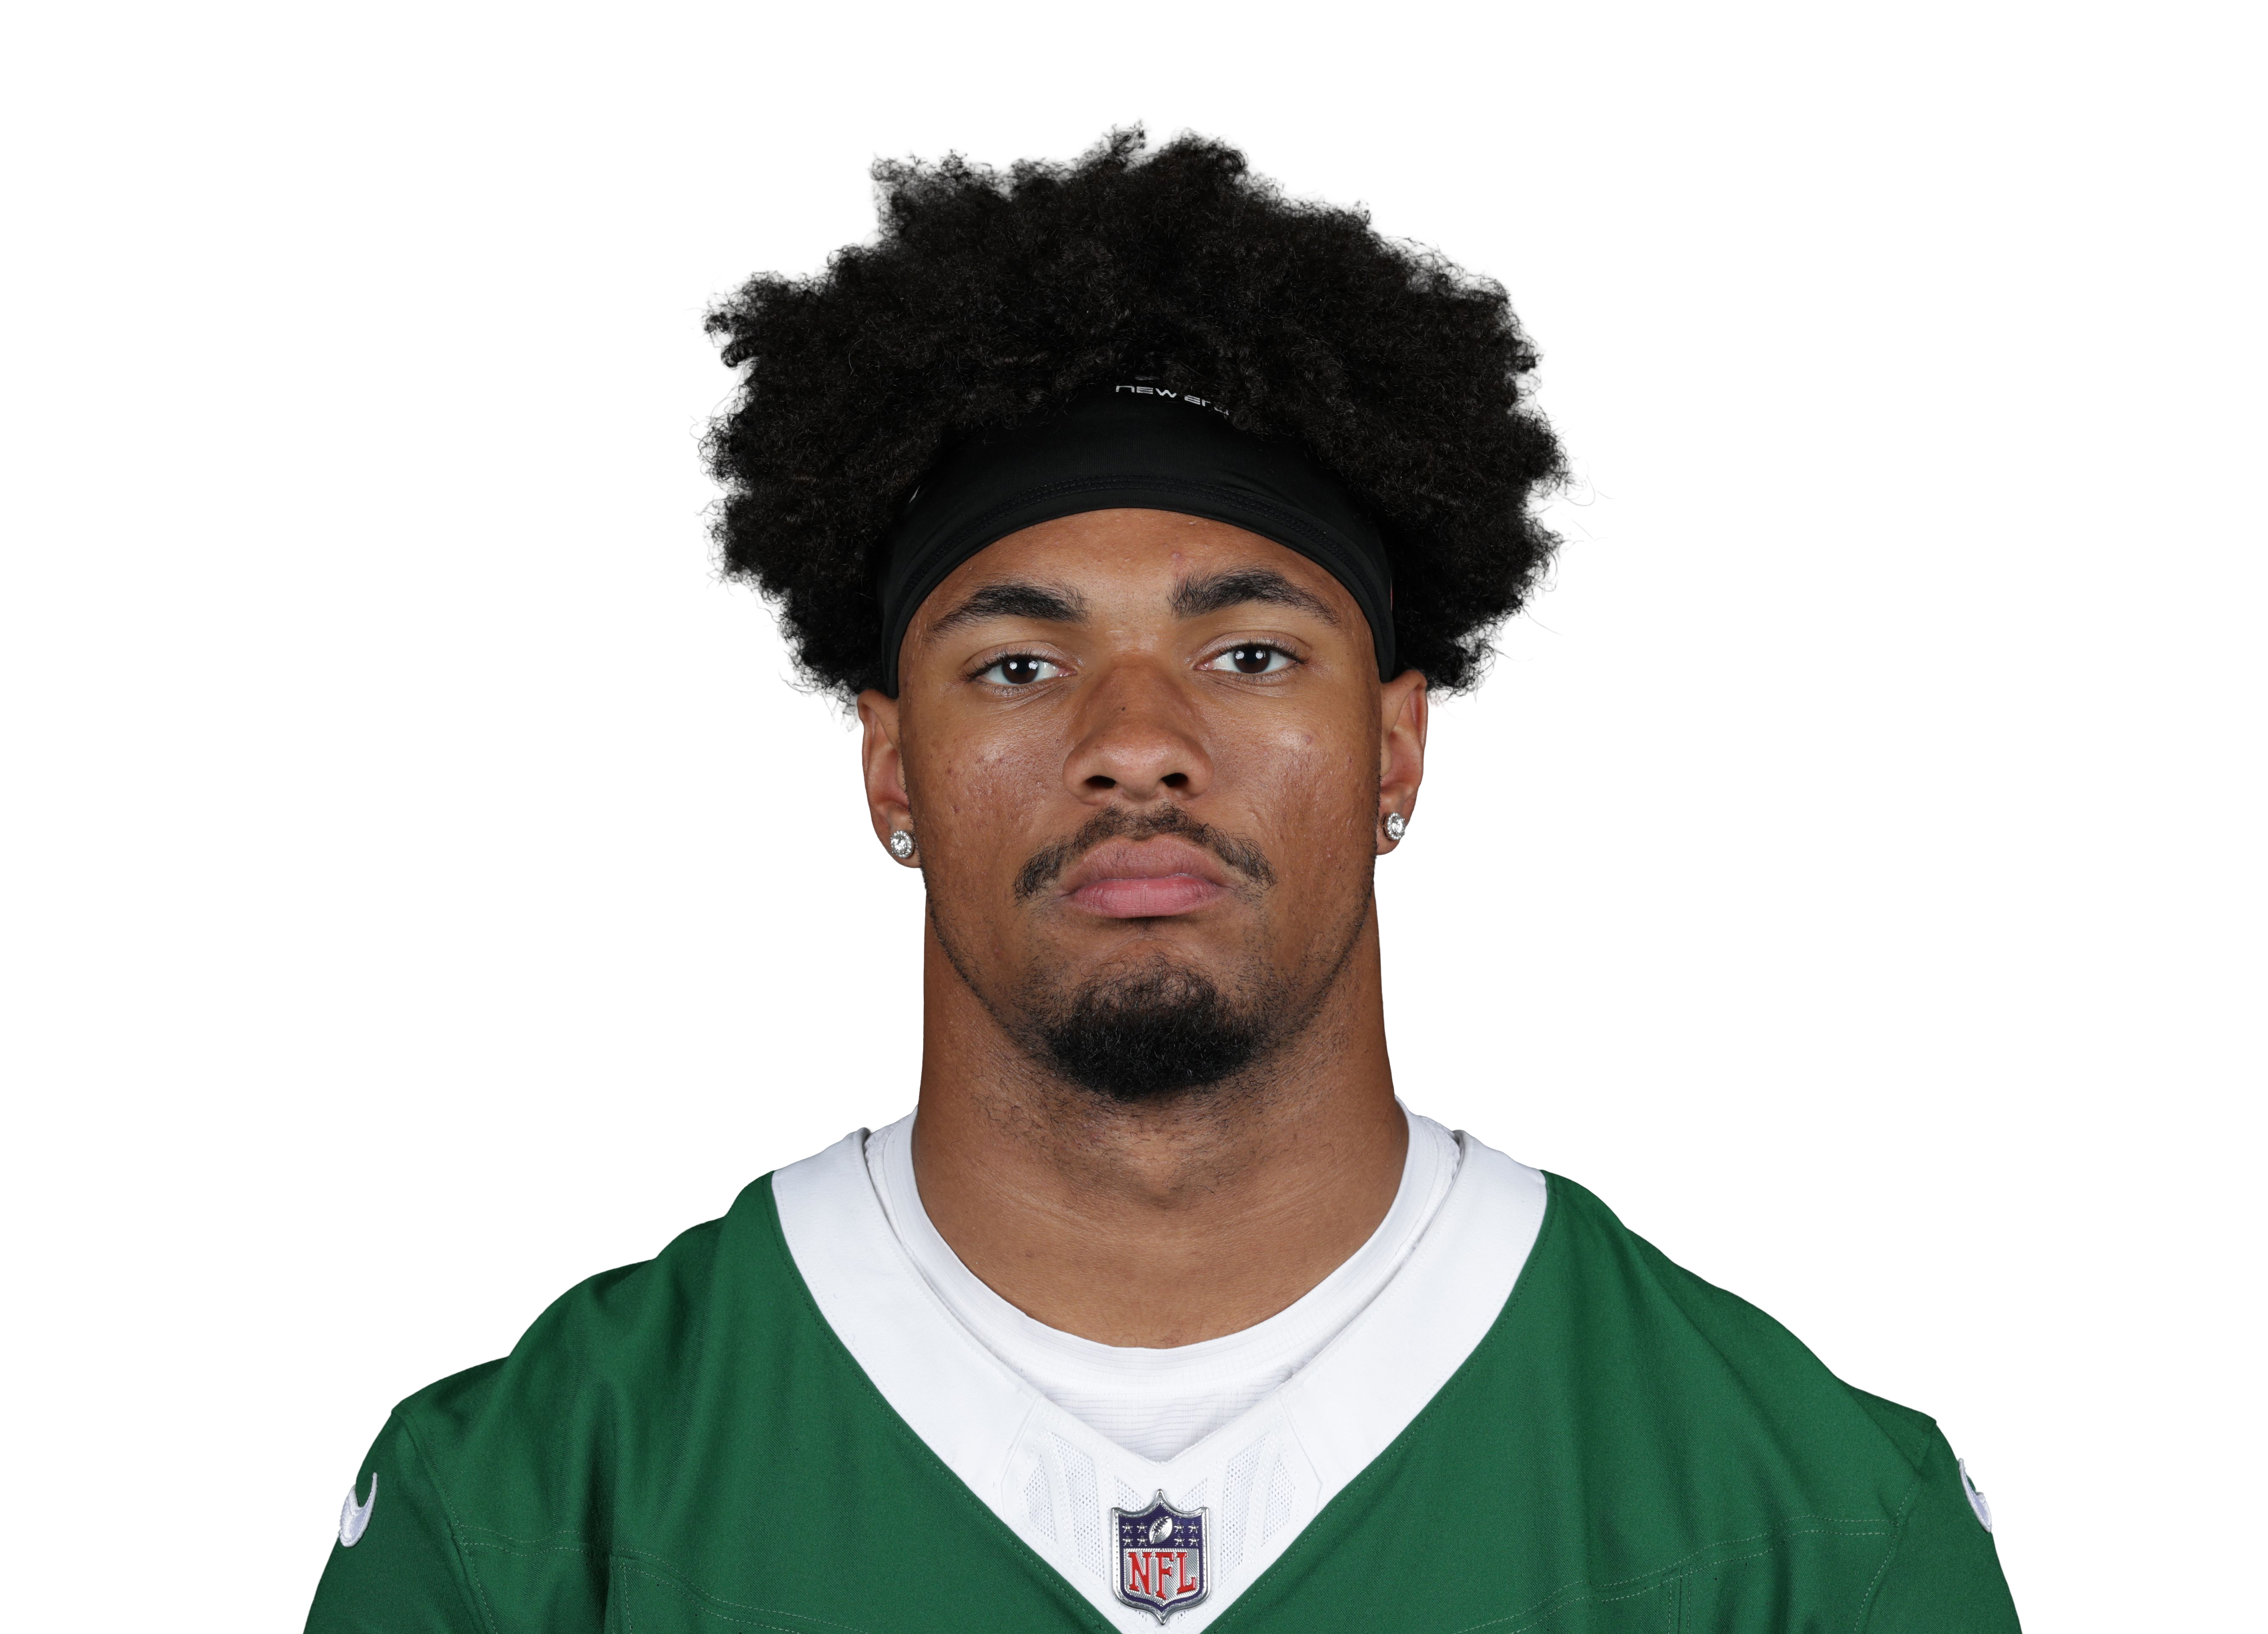 Kenyon Sadiqvs NYJ • Wk 1 | 11.4 | 3 | 3 | 21 | 0 | 3 |
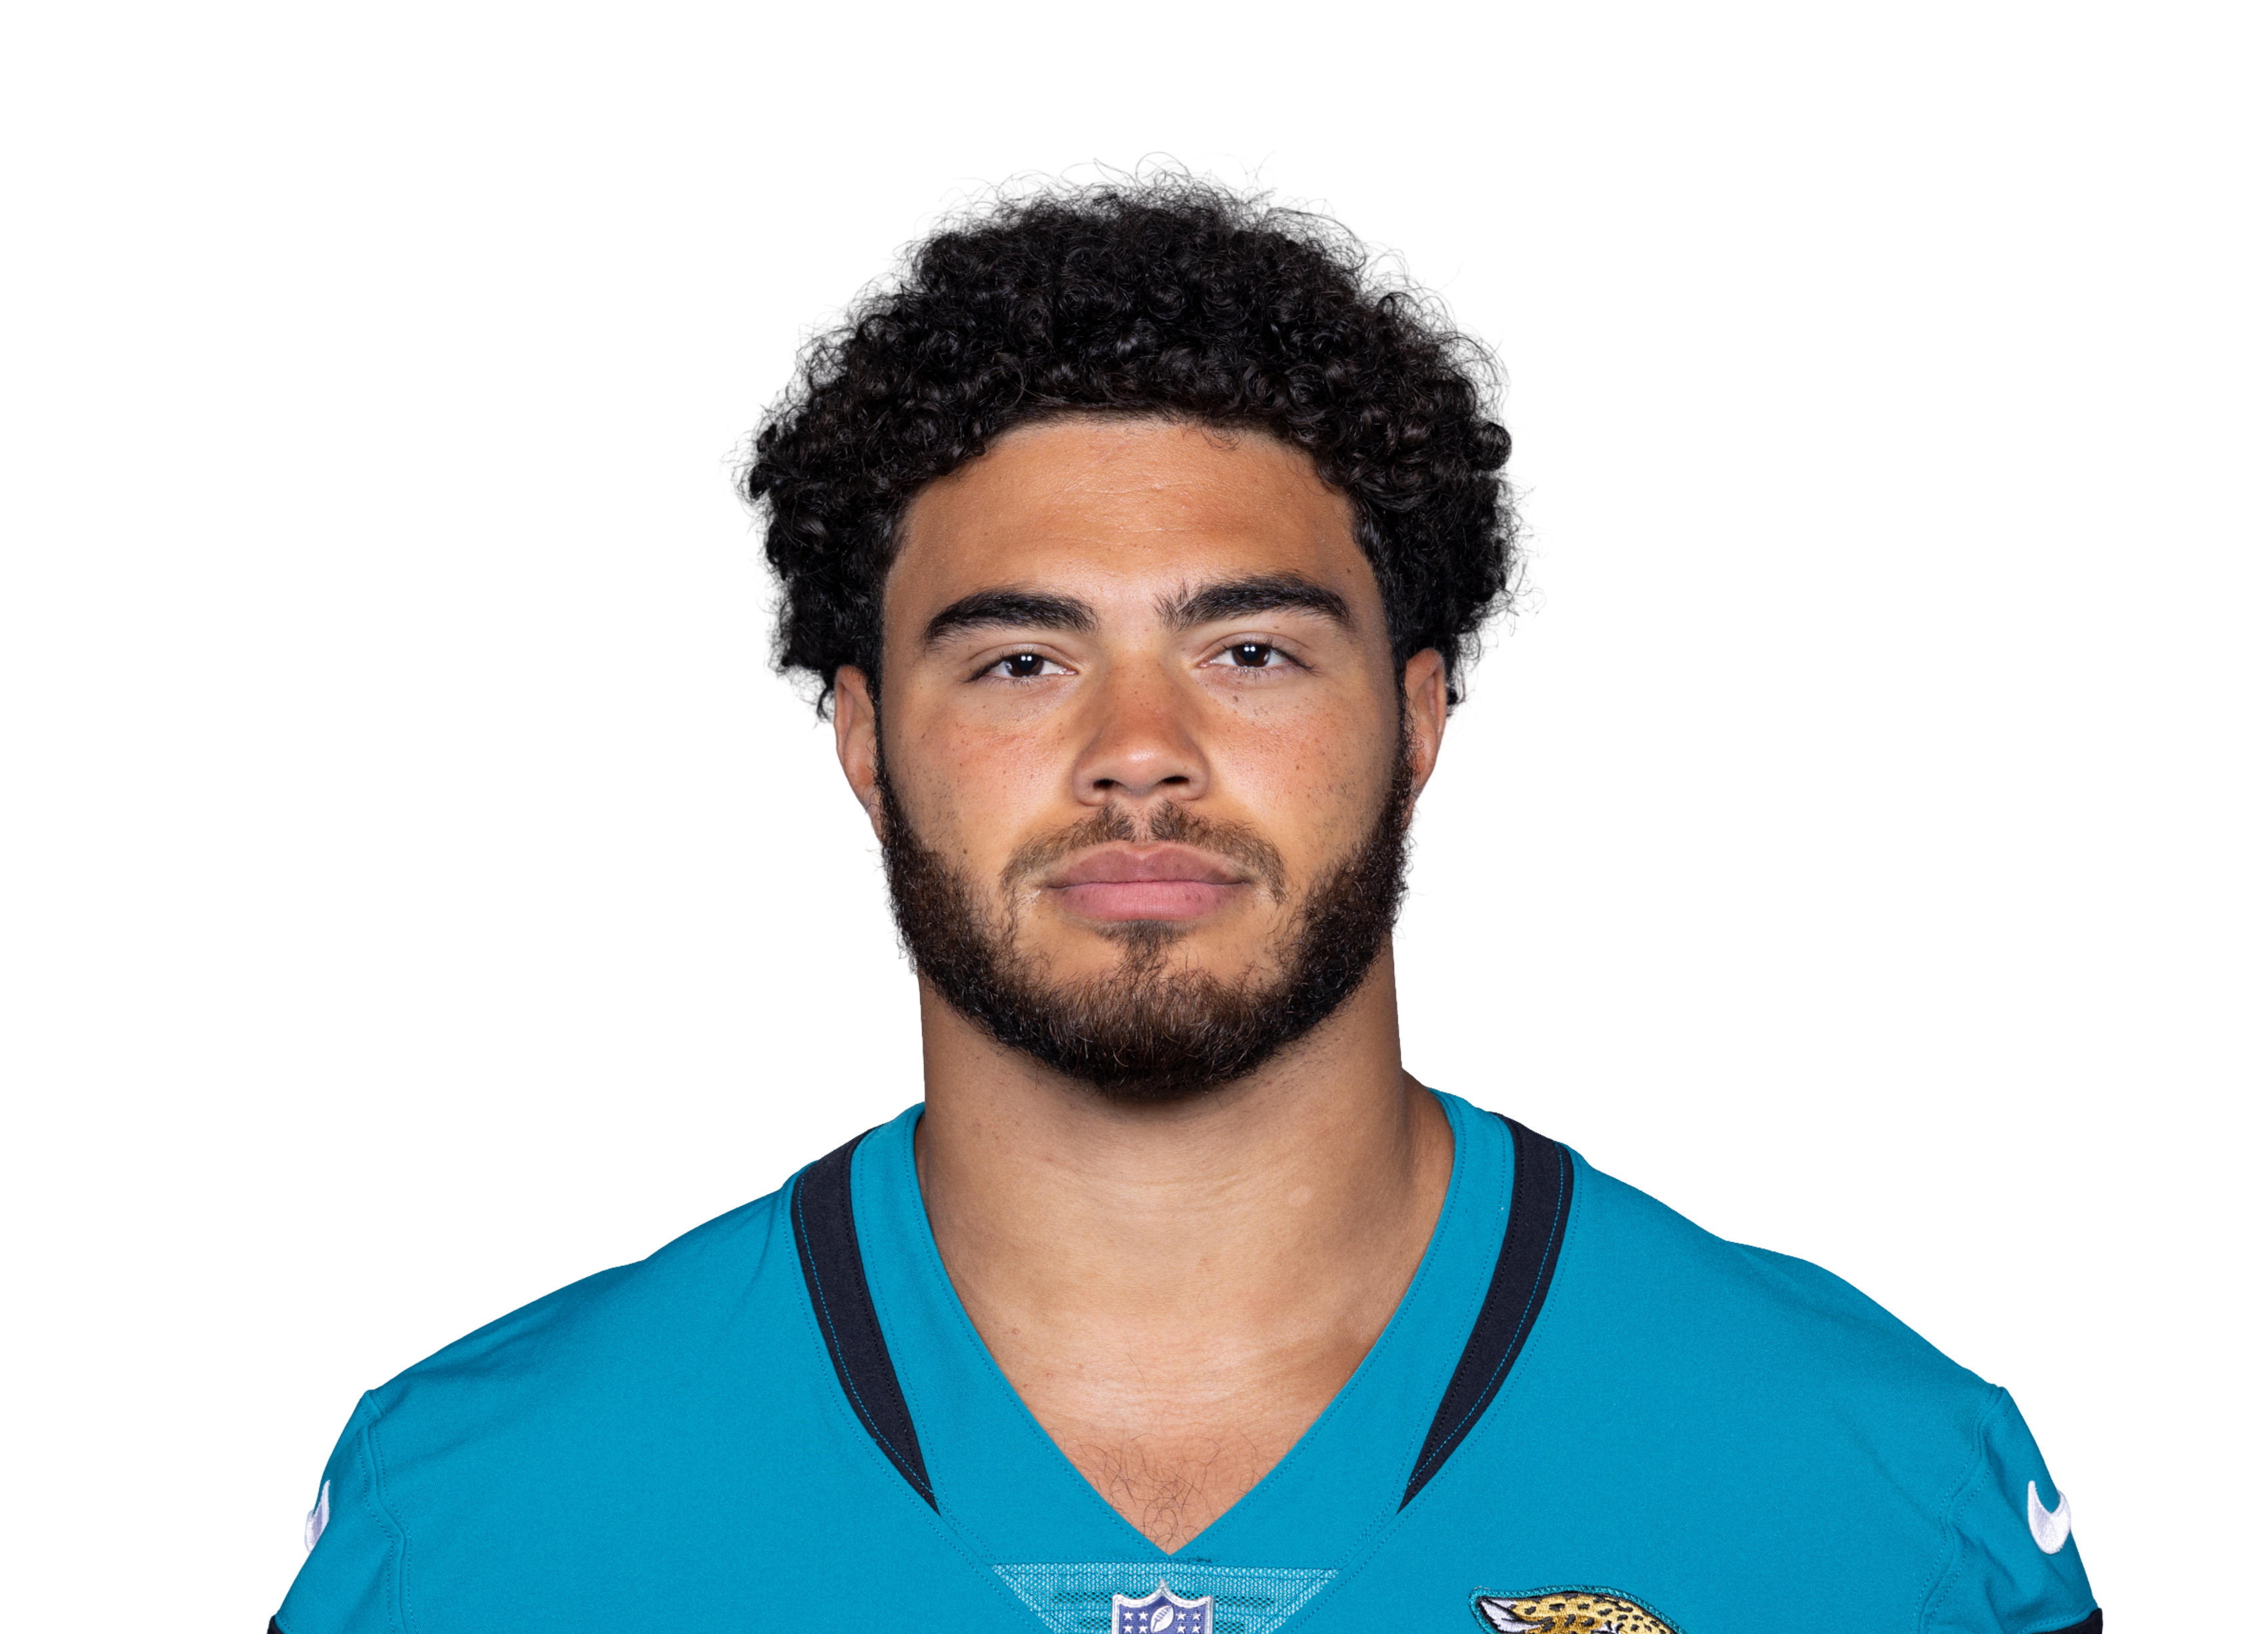 Brenton Strangevs JAX • Wk 10 | 8.9 | 3 | 2 | 9 | 1 | 0 |
 Mo Alie-Cox@ IND • Wk 6 | 7.1 | 1 | 1 | 1 | 1 | 0 |
 Jack Endries@ CIN • Wk 8 | 7.1 | 1 | 1 | 1 | 1 | 0 |
 Dalton Schultzvs HOU • Wk 5 | 6.0 | 4 | 3 | 30 | 0 | 0 |
 Matthew Hibner@ BAL • Wk 4 | 5.4 | 2 | 2 | 34 | 0 | 0 |
 Will Mallory@ IND • Wk 6 | 4.0 | 6 | 2 | 20 | 0 | 0 |
 Isaiah Likely@ NYG • Wk 3 | 3.3 | 5 | 2 | 13 | 0 | 0 |
 Johnny Mundtvs PHI • Wk 2 | 2.8 | 3 | 2 | 8 | 0 | 0 |
 Foster Moreauvs HOU • Wk 5 | 2.8 | 3 | 2 | 8 | 0 | 0 |
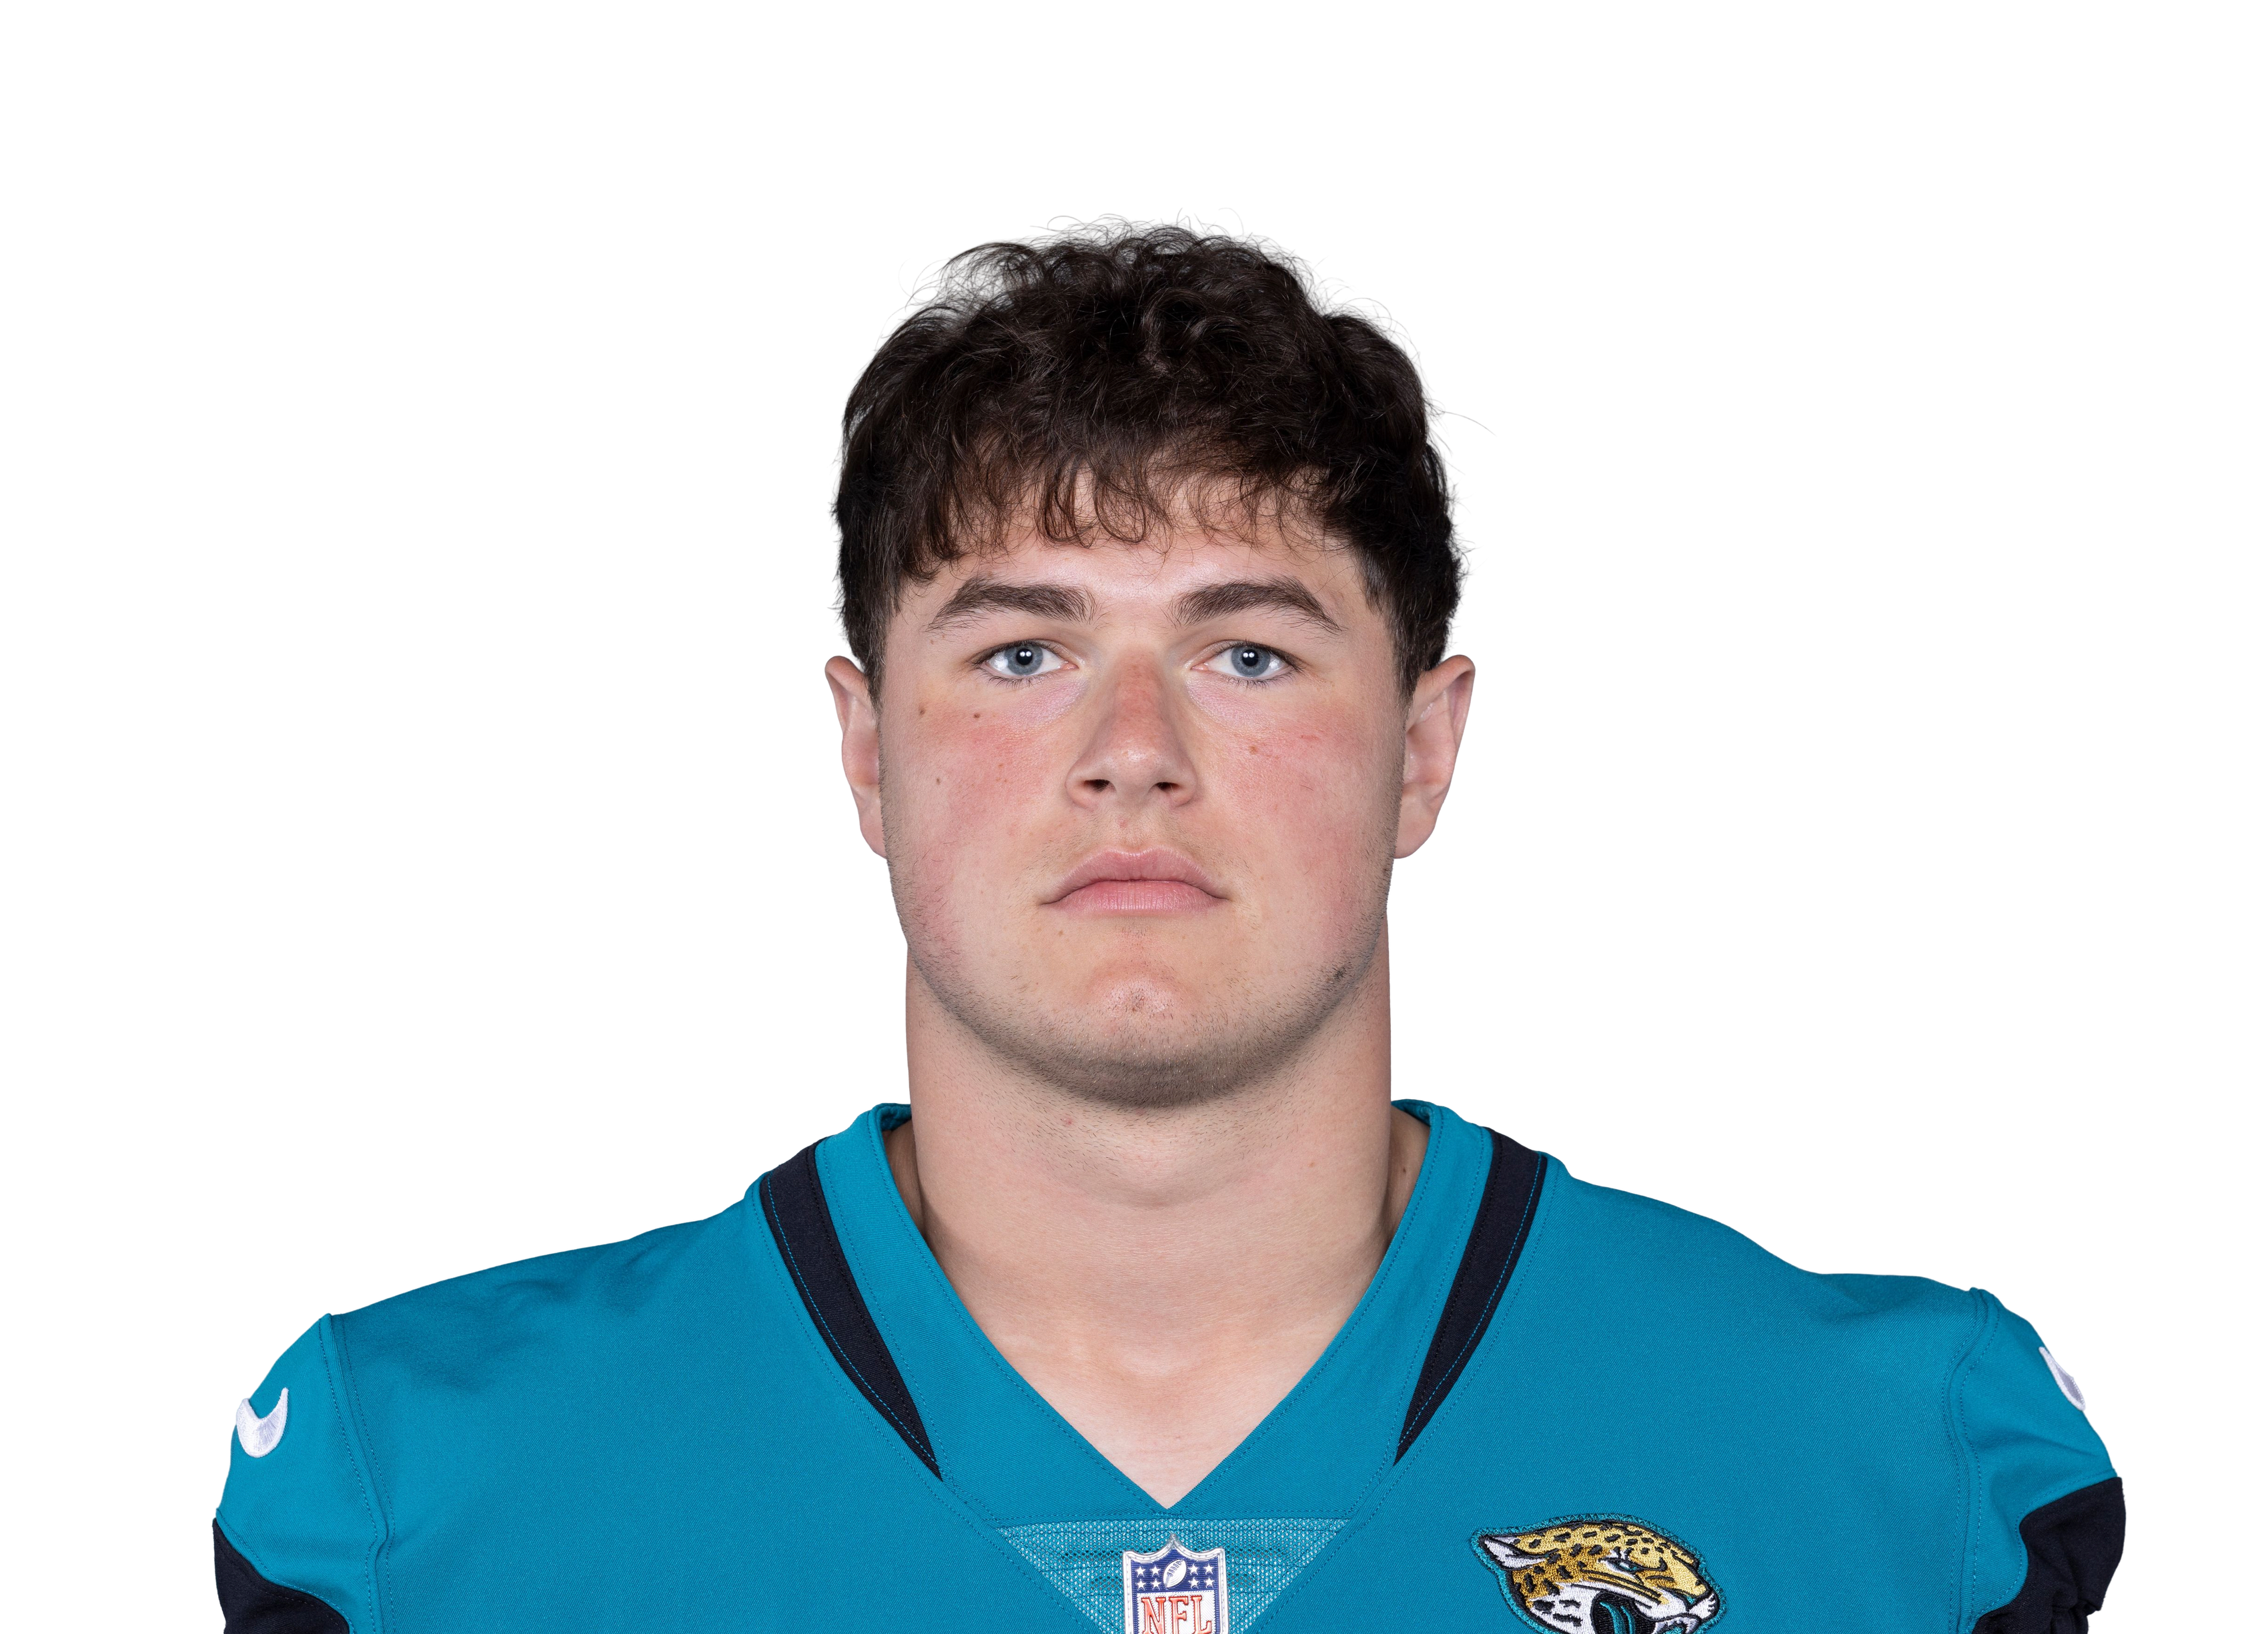 Nate Boerkirchervs JAX • Wk 10 | 2.2 | 2 | 1 | 12 | 0 | 0 |
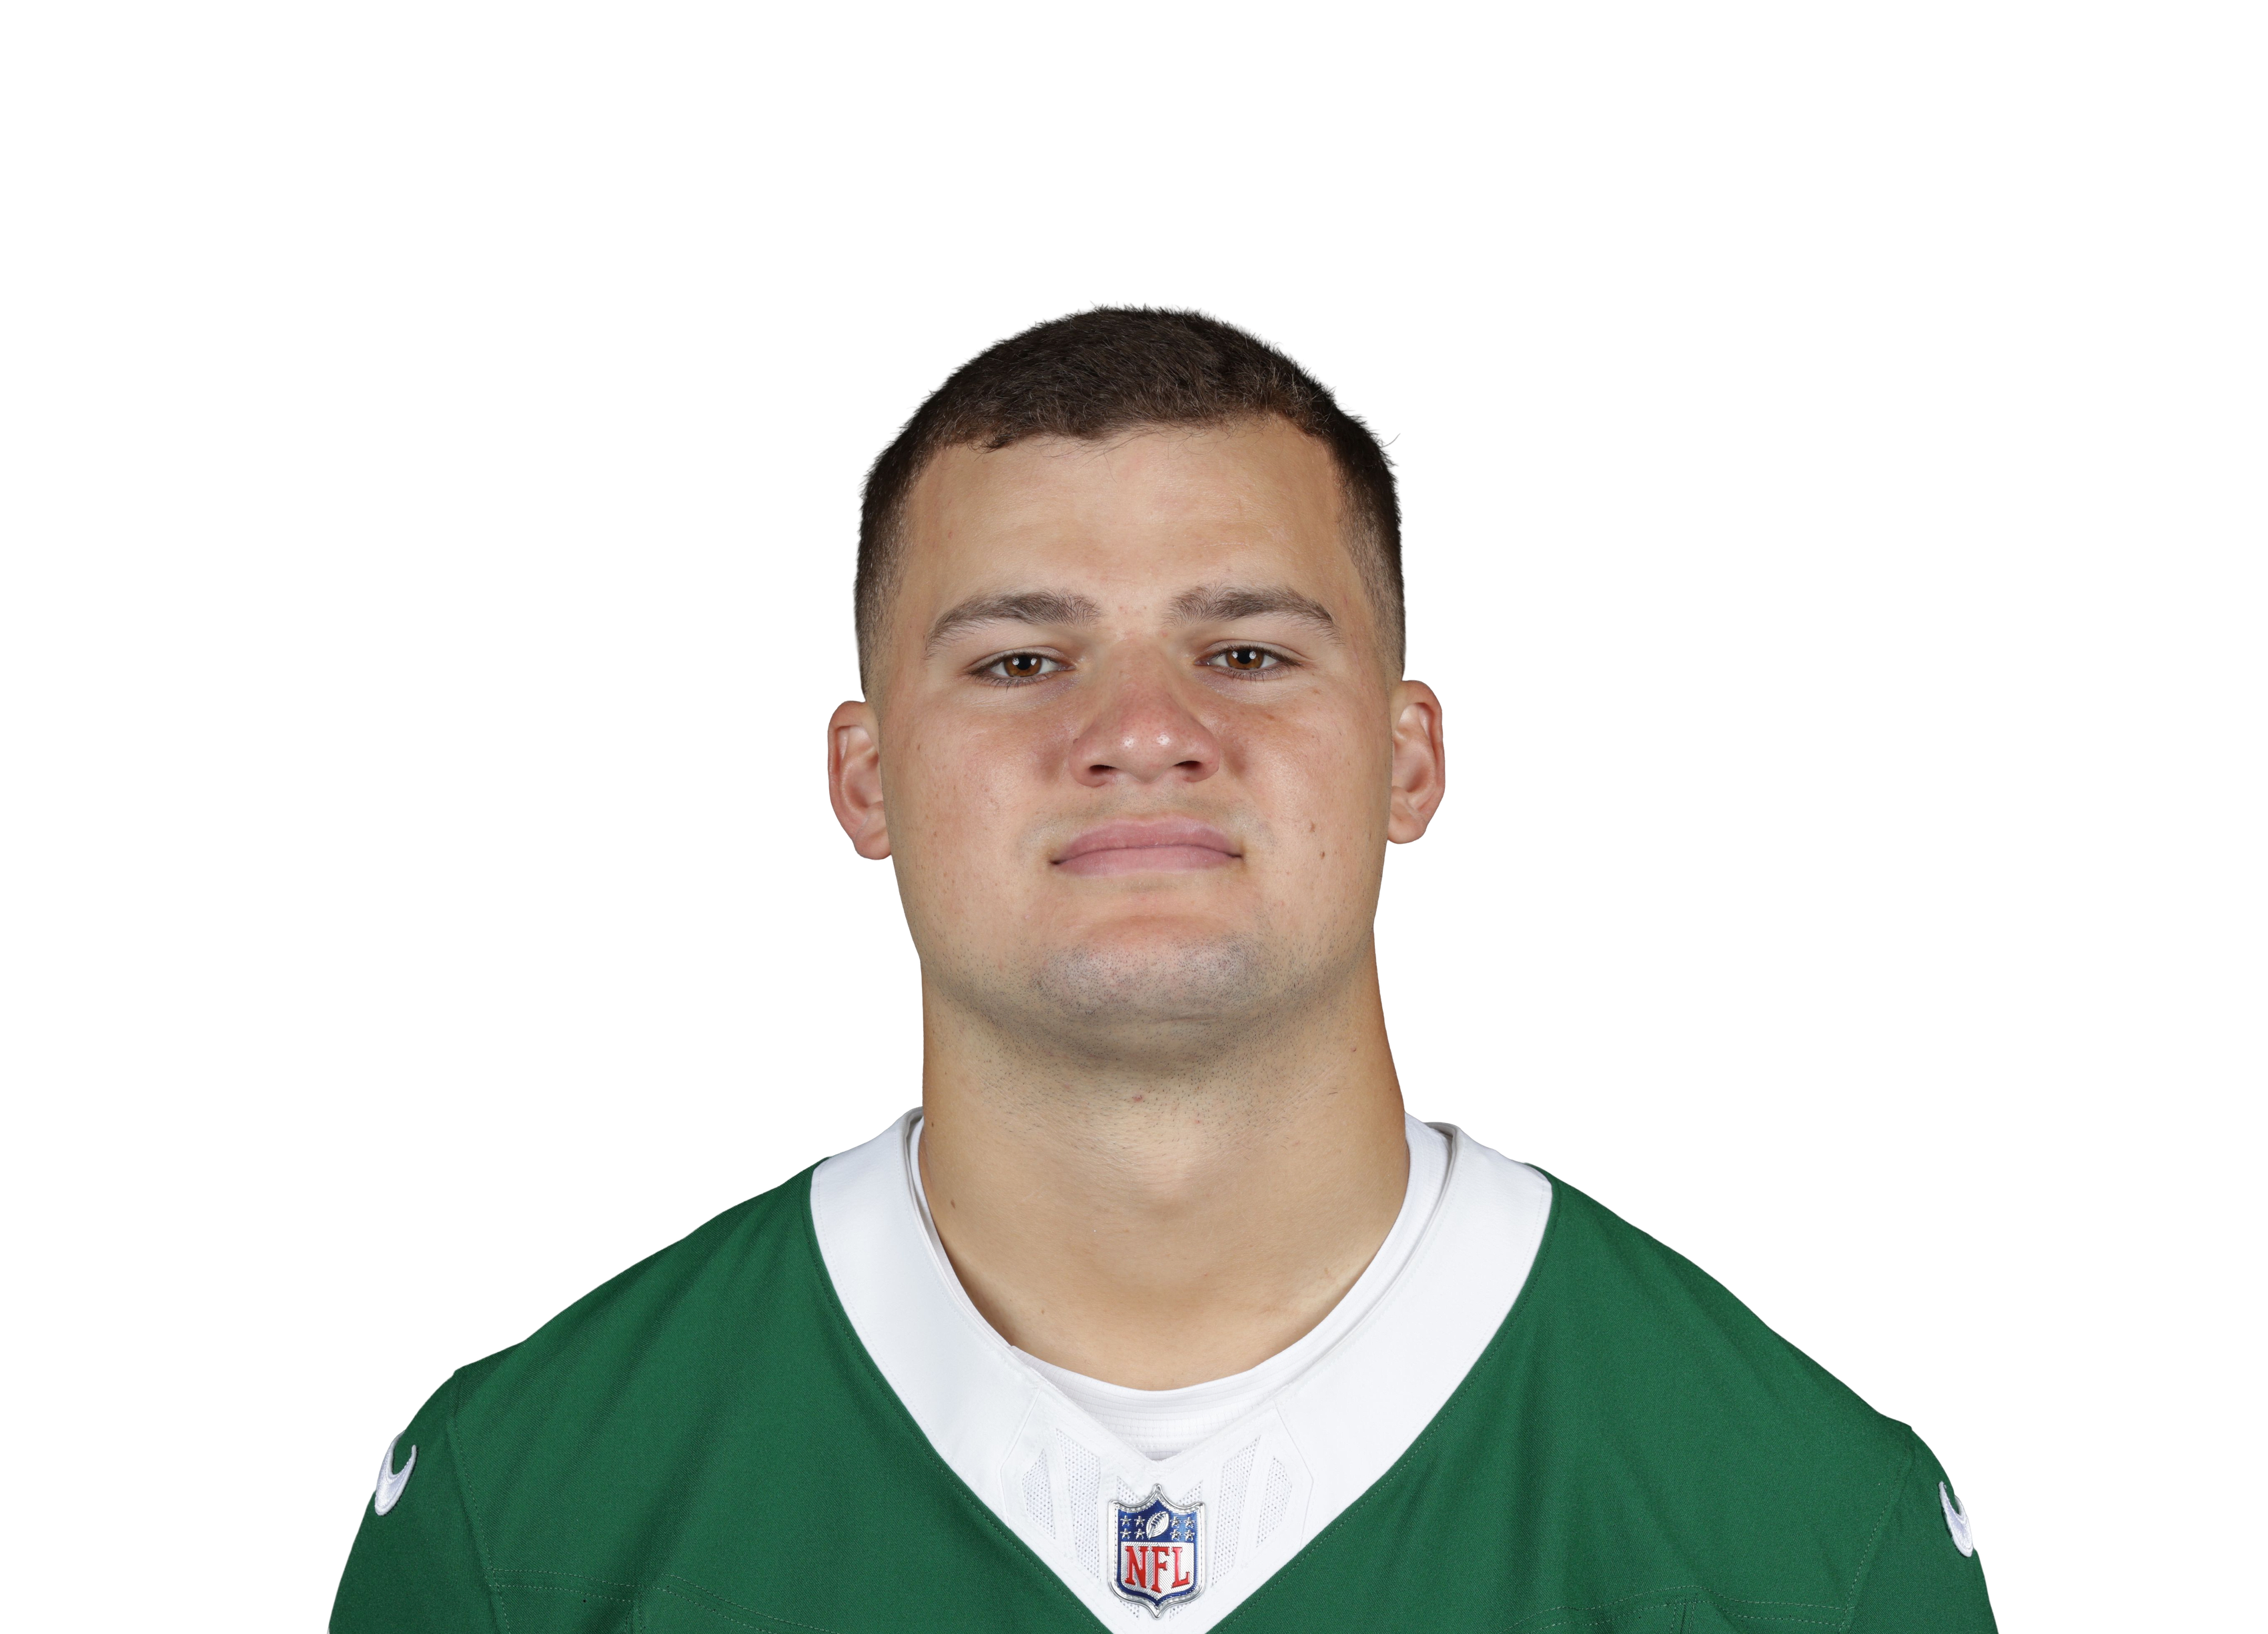 Mason Taylorvs NYJ • Wk 1 | 1.8 | 3 | 2 | -2 | 0 | 0 |
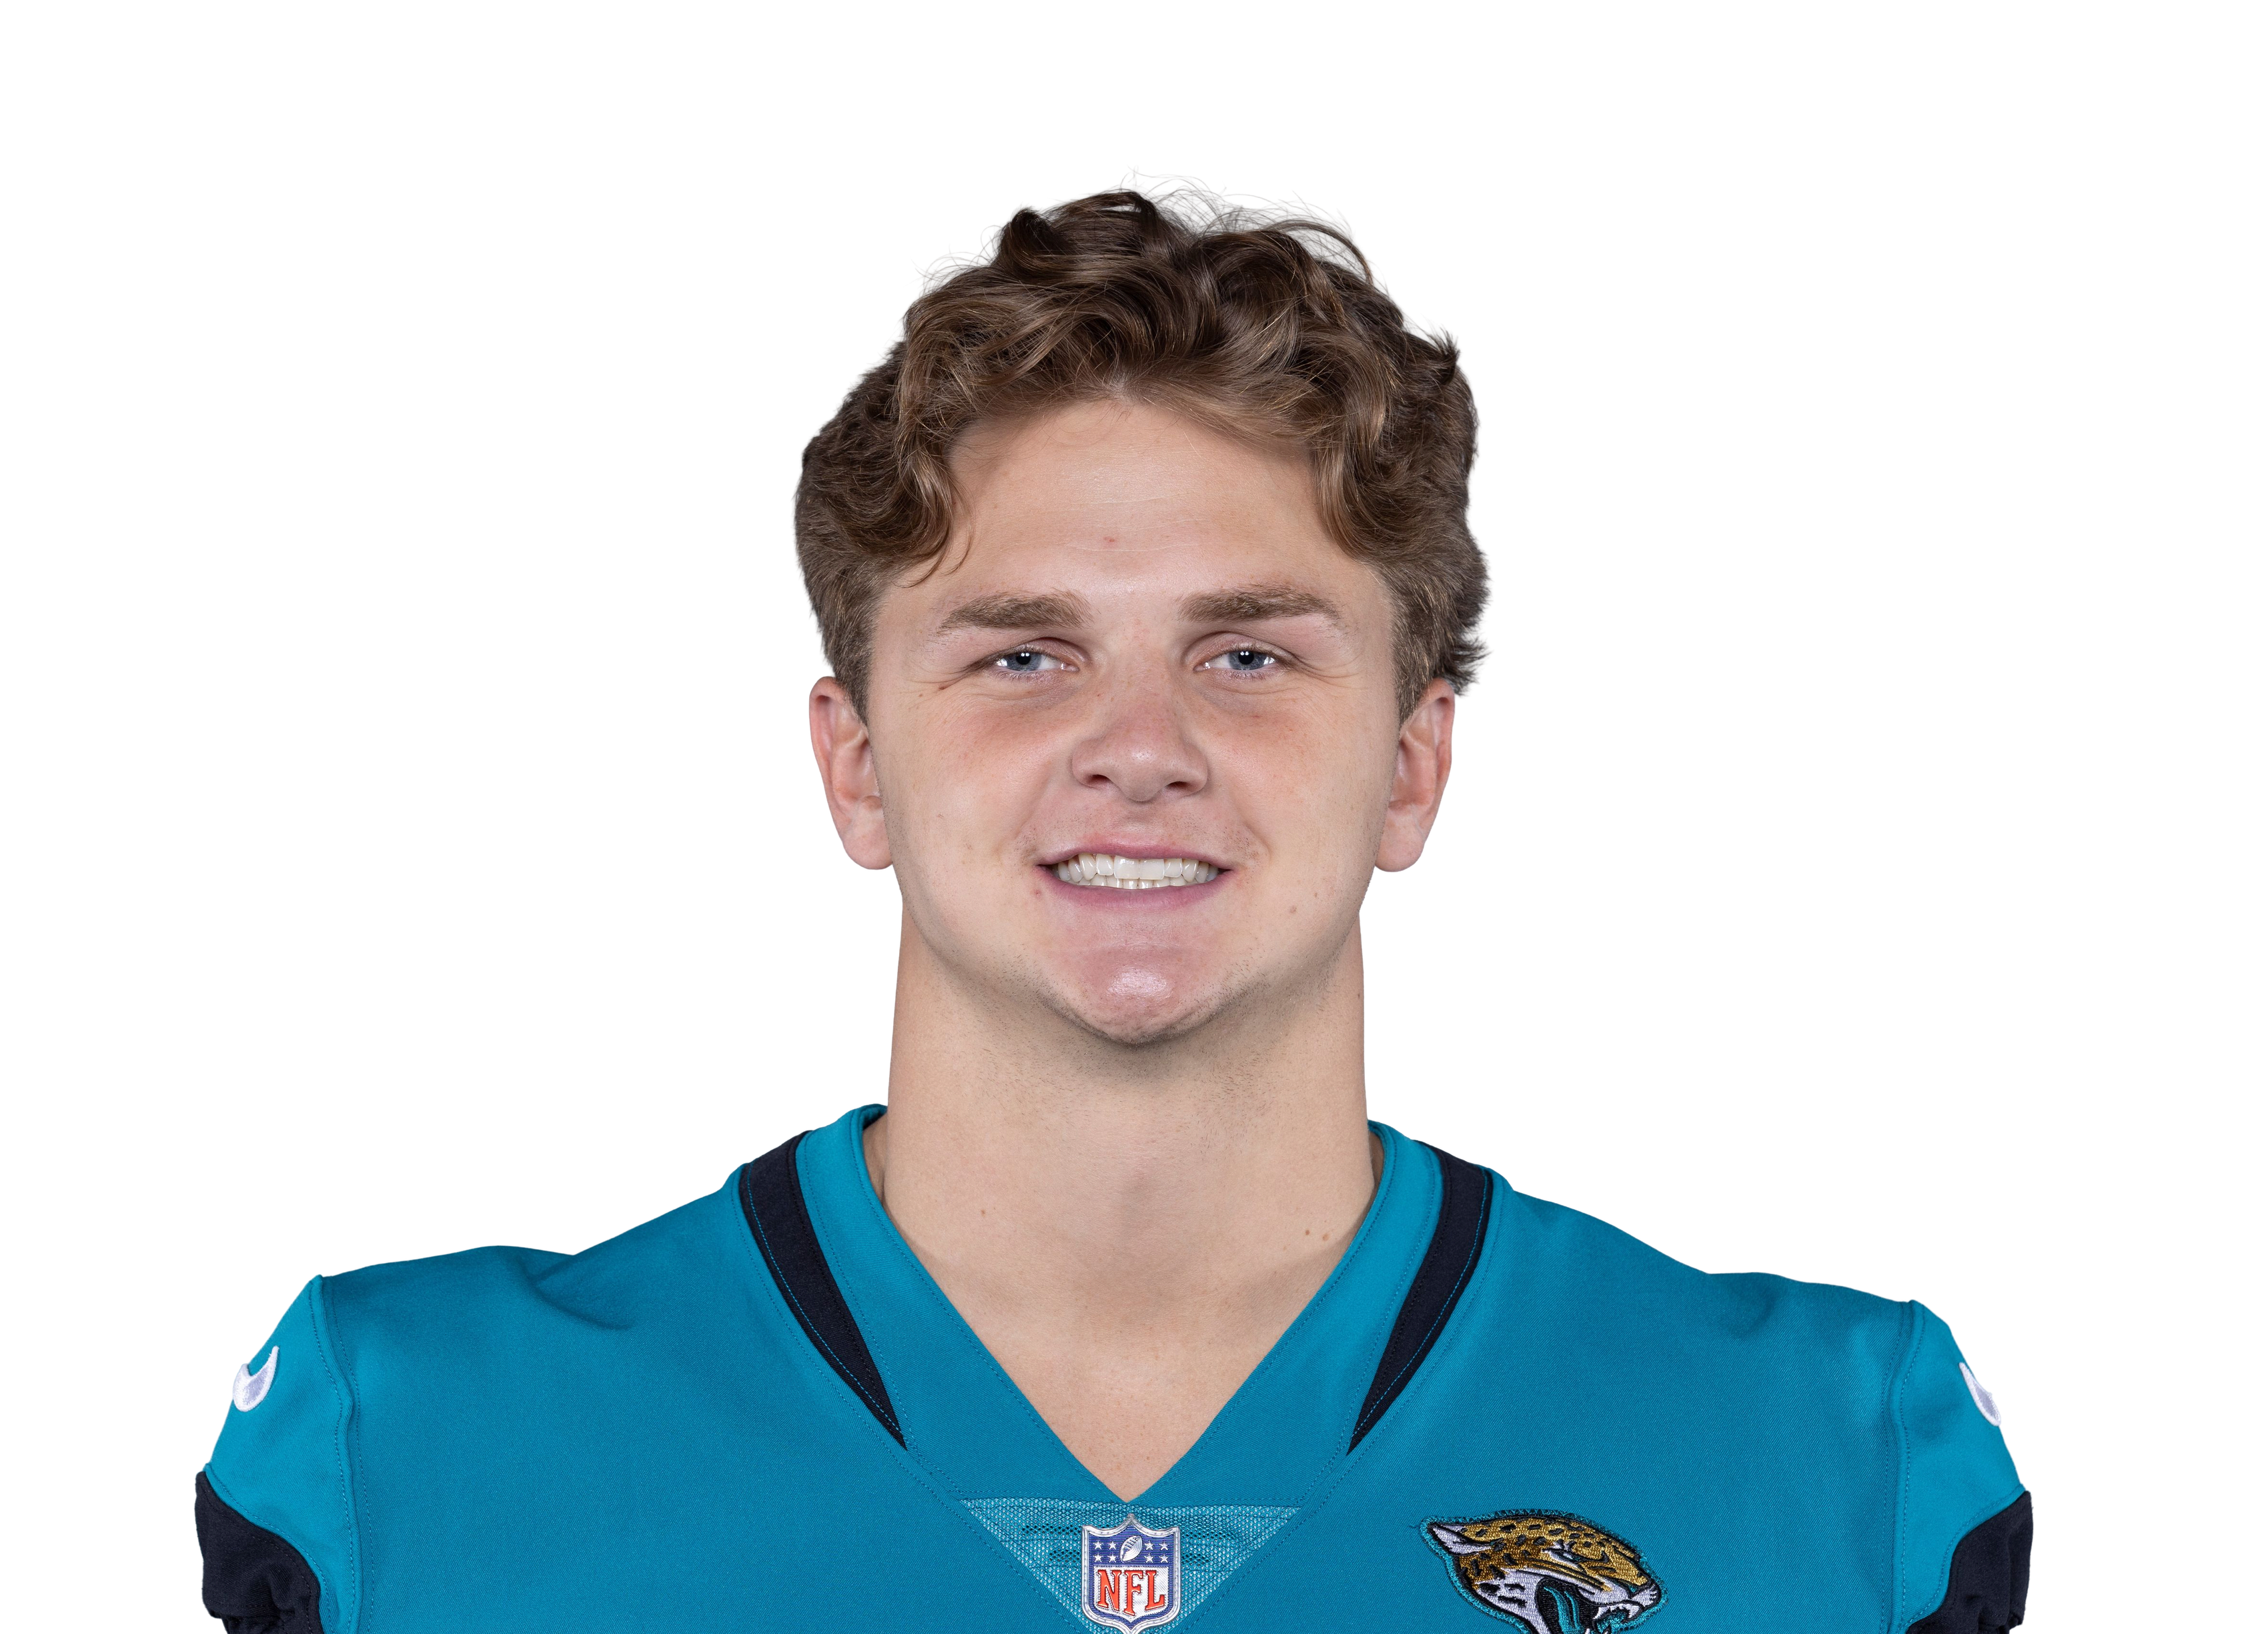 Tanner Koziolvs JAX • Wk 10 | 1.8 | 1 | 1 | 8 | 0 | 0 |
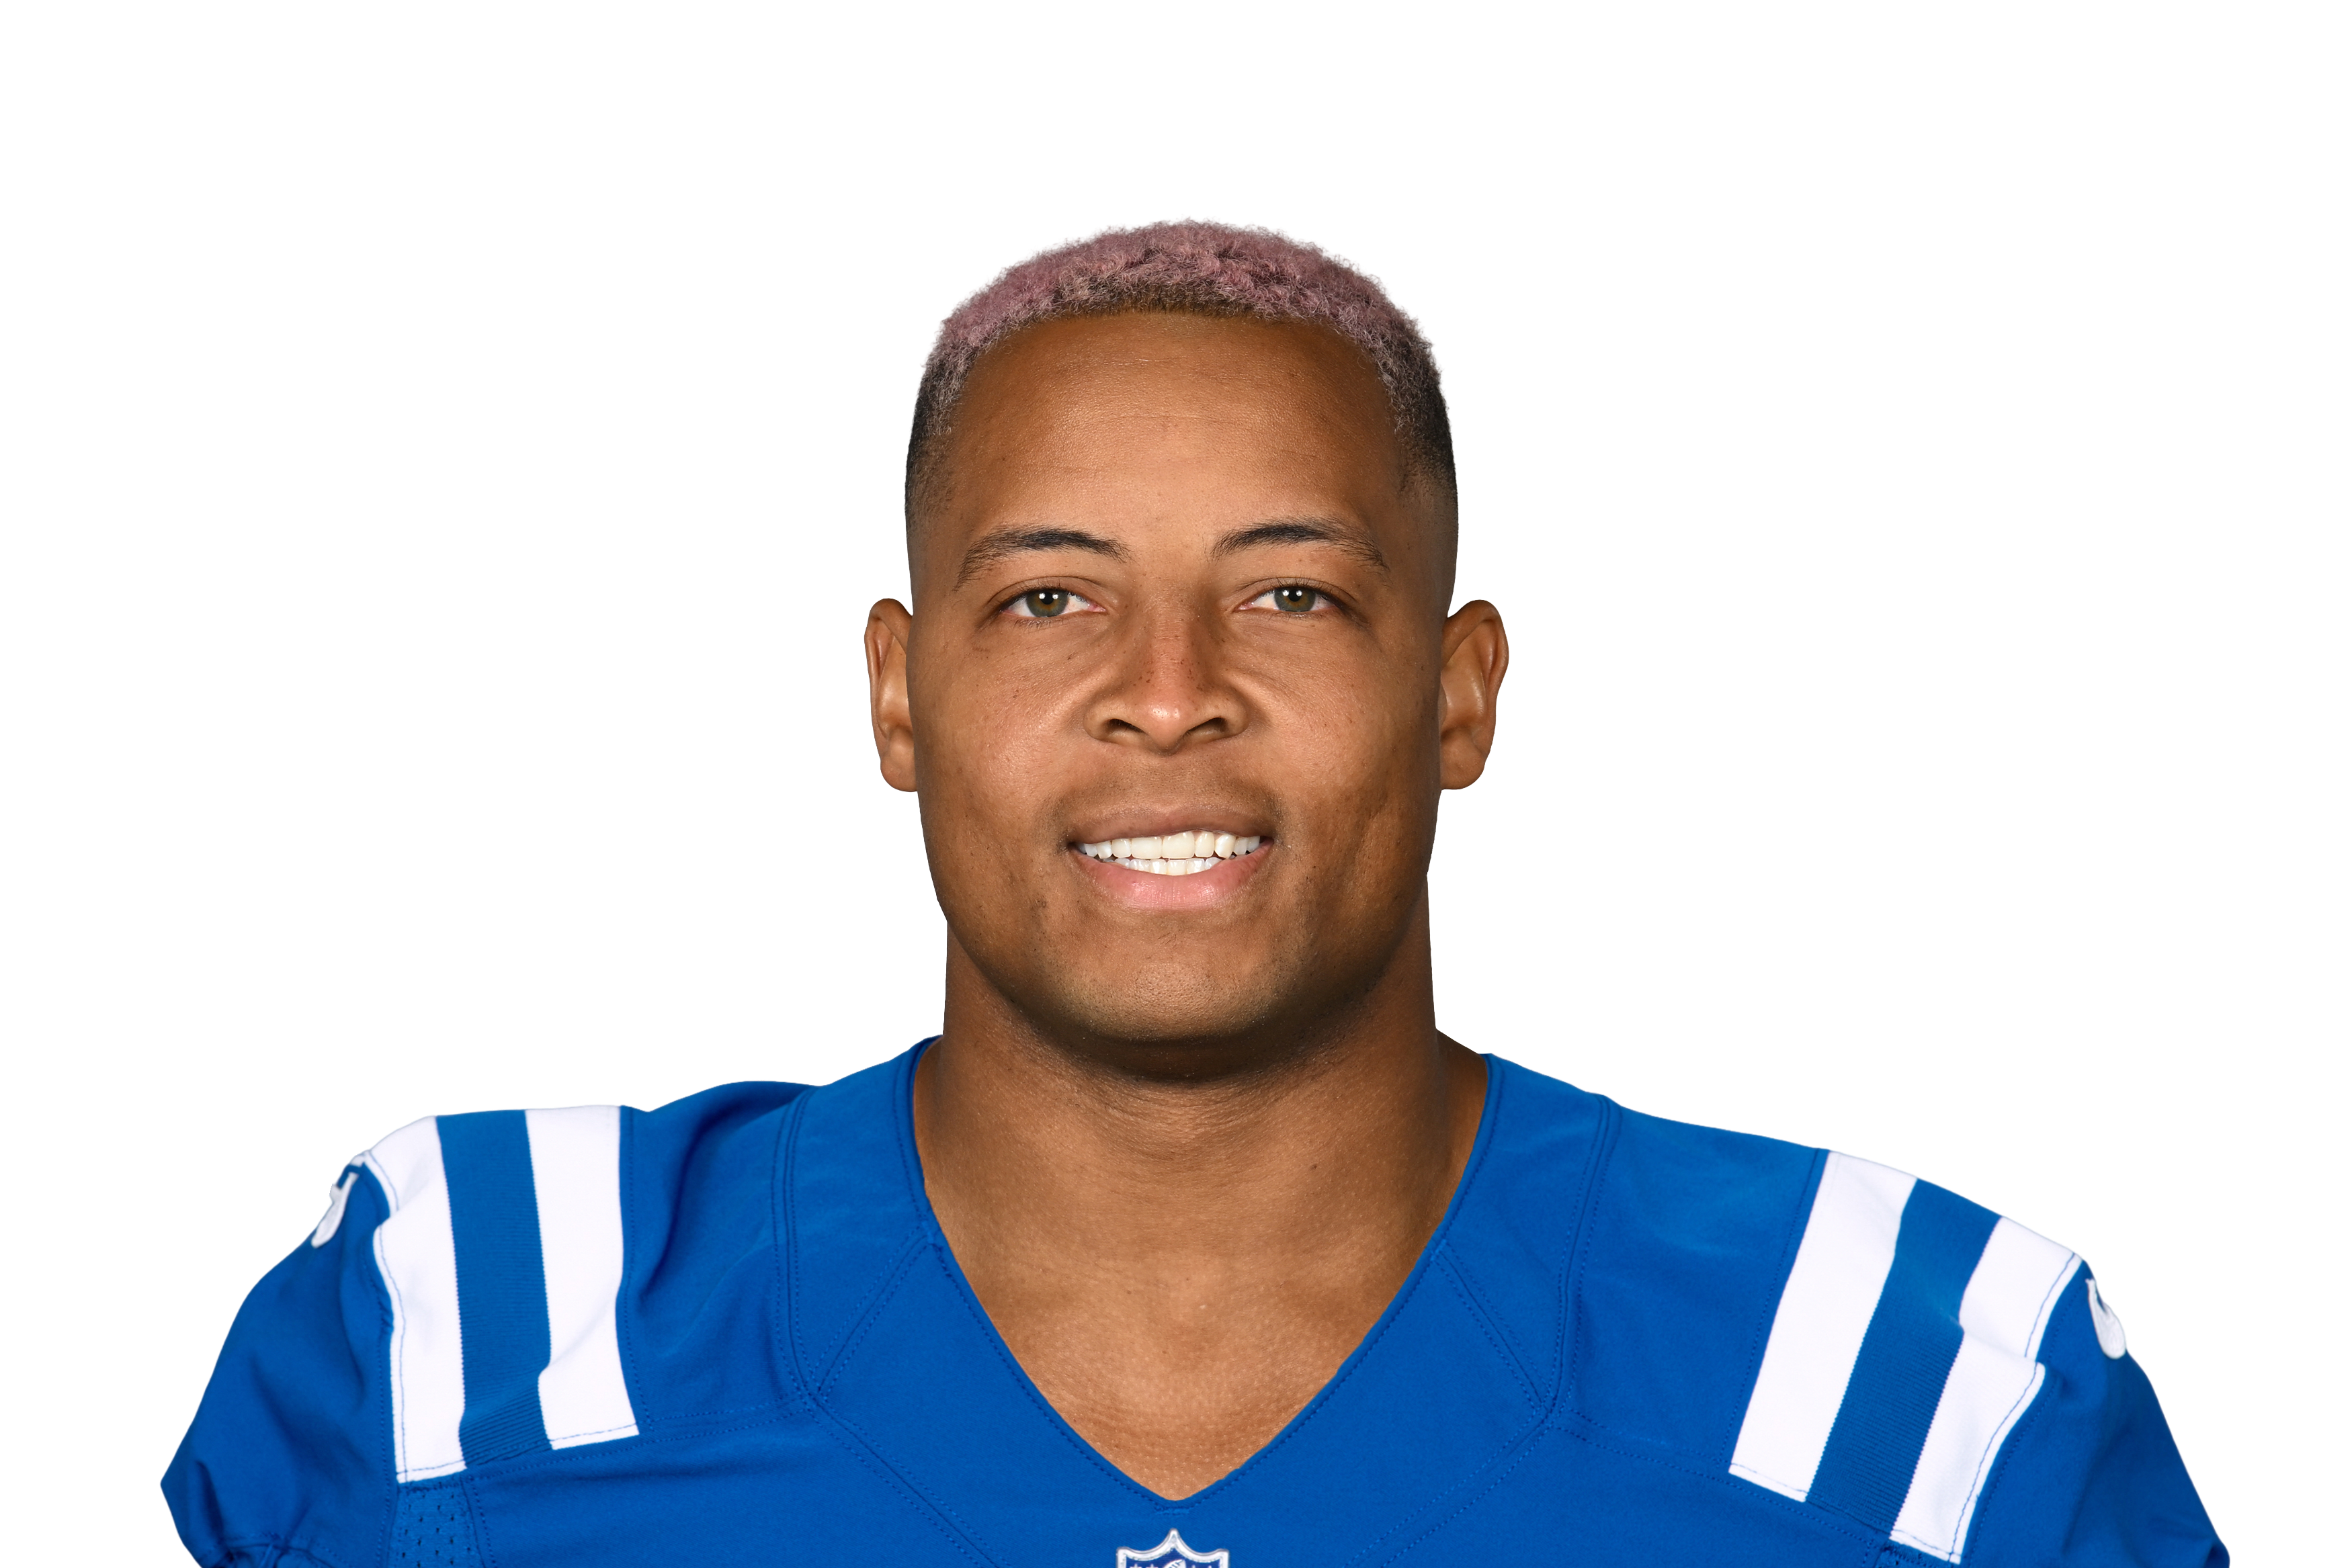 Pharaoh Brown@ IND • Wk 6 | 1.7 | 1 | 1 | 7 | 0 | 0 |
 Jeremy Ruckertvs NYJ • Wk 1 | 1.4 | 1 | 1 | 4 | 0 | 0 |
 Dallas Goedertvs PHI • Wk 2 | 1.4 | 2 | 1 | 4 | 0 | 0 |
Fantasy points first, then the stats that matter for his position. Ring around each photo is that player's Mania Rating. Tap a name to open his profile.
| Player | W1 | W2 | W3 | W4 | W5 | W6 | W7 | W8 | W9 | W10 | Per game |
|---|---|---|---|---|---|---|---|---|---|---|---|
| Jake Ferguson | 26 yds7% targets76% snaps | 443 yds13% targets60% snaps | 523 yds13% targets69% snaps | 411 yds9% targets71% snaps | 619 yds14% targets83% snaps | 313 yds6% targets54% snaps | 10 yds4% targets56% snaps | — | 221 yds6% targets34% snaps | — | 3.417 yds a game • 5.0 per target9% targets63% snaps |
| Brevyn Spann-Ford | 214 yds7% targets22% snaps | 00 yds0% targets38% snaps | 119 yds3% targets38% snaps | 10 yds2% targets40% snaps | 20 yds5% targets33% snaps | 535 yds9% targets46% snaps | 211 yds8% targets53% snaps | 531 yds18% targets88% snaps | 320 yds9% targets70% snaps | 326 yds6% targets66% snaps | 2.416 yds a game • 6.5 per target7% targets49% snaps |
| Luke Schoonmaker | 112 yds3% targets22% snaps | — | 19 yds3% targets22% snaps | — | 19 yds2% targets8% snaps | — | — | — | — | 212 yds4% targets34% snaps | 1.311 yds a game • 8.4 per target3% targets22% snaps |
| James Mitchell | — | — | — | — | — | — | — | 00 yds0% targets42% snaps | — | — | 0.00 yds a game0% targets42% snaps |
| Use | Game | Proj | PPR | Tgt | Rec | Rec Yd | Car | Rush Yd | TD | Snap |
|---|---|---|---|---|---|---|---|---|---|---|
W1 vs NYG | 9.5 | 2.6 | 2 | 2 | 6 | 0 | 0 | 0 | 76% | |
W2 vs WAS | 9.7 | 20.3 | 4 | 4 | 43 | 0 | 0 | 2 | 60% | |
W3 vs BAL | 9.0 | 9.3 | 5 | 3 | 23 | 0 | 0 | 1 | 69% | |
W4 vs HOU | 8.0 | 4.1 | 4 | 3 | 11 | 0 | 0 | 0 | 71% | |
W5 vs TB | 8.7 | 4.9 | 6 | 3 | 19 | 0 | 0 | 0 | 83% | |
W6 vs GB | 8.7 | 3.3 | 3 | 2 | 13 | 0 | 0 | 0 | 54% | |
W7 vs PHI | 7.5 | 0 | 1 | 0 | 0 | 0 | 0 | 0 | 56% | |
W9 vs IND HURT, LEFT OUT | 6.0 | 10.1 | 2 | 2 | 21 | 0 | 0 | 1 | 34% |
Not ranked yet. Needs 35 targets and he has 27.
Jake Ferguson
DAL • TE • 8 gamesPick a teammate with or without. Pick more than one to combine them, like a game without the QB and without the other back.
| Player | W1 | W2 | W3 | W4 | W5 | W6 | W7 | W8 | W9 | W10 | Per game |
|---|---|---|---|---|---|---|---|---|---|---|---|
| Jake Ferguson | 26 yds7% targets76% snaps | 443 yds13% targets60% snaps | 523 yds13% targets69% snaps | 411 yds9% targets71% snaps | 619 yds14% targets83% snaps | 313 yds6% targets54% snaps | 10 yds4% targets56% snaps | — | 221 yds6% targets34% snaps | — | 3.417 yds a game • 5.0 per target9% targets63% snaps |
| Brevyn Spann-Ford | 214 yds7% targets22% snaps | 00 yds0% targets38% snaps | 119 yds3% targets38% snaps | 10 yds2% targets40% snaps | 20 yds5% targets33% snaps | 535 yds9% targets46% snaps | 211 yds8% targets53% snaps | 531 yds18% targets88% snaps | 320 yds9% targets70% snaps | 326 yds6% targets66% snaps | 2.416 yds a game • 6.5 per target7% targets49% snaps |
| Luke Schoonmaker | 112 yds3% targets22% snaps | — | 19 yds3% targets22% snaps | — | 19 yds2% targets8% snaps | — | — | — | — | 212 yds4% targets34% snaps | 1.311 yds a game • 8.4 per target3% targets22% snaps |
| James Mitchell | — | — | — | — | — | — | — | 00 yds0% targets42% snaps | — | — | 0.00 yds a game0% targets42% snaps |
| Use | Game | Proj | PPR | Tgt | Rec | Rec Yd | Car | Rush Yd | TD | Snap |
|---|---|---|---|---|---|---|---|---|---|---|
| W1vs NYG | 9.5 | 2.6 | 2 | 2 | 6 | 0 | 0 | 0 | 76% | |
| W2vs WAS | 9.7 | 20.3 | 4 | 4 | 43 | 0 | 0 | 2 | 60% | |
| W3vs BAL | 9.0 | 9.3 | 5 | 3 | 23 | 0 | 0 | 1 | 69% | |
| W4vs HOU | 8.0 | 4.1 | 4 | 3 | 11 | 0 | 0 | 0 | 71% | |
| W5vs TB | 8.7 | 4.9 | 6 | 3 | 19 | 0 | 0 | 0 | 83% | |
| W6vs GB | 8.7 | 3.3 | 3 | 2 | 13 | 0 | 0 | 0 | 54% | |
| W7vs PHI | 7.5 | 0 | 1 | 0 | 0 | 0 | 0 | 0 | 56% | |
| W9vs IND HURT, LEFT OUT | 6.0 | 10.1 | 2 | 2 | 21 | 0 | 0 | 1 | 34% |
Not ranked yet. Needs 35 targets and he has 27.
12.6 PPR points a game allowed to tight ends, 20th most of 32 defenses.
| Player | PPR | Tgt | Rec | Rec Yd | Rec TD | Rush Yd |
|---|---|---|---|---|---|---|
| Mike Gesicki@ CIN • Wk 8 | 17.6 | 6 | 4 | 76 | 1 | 0 |
| Mark Andrews@ BAL • Wk 4 | 13.7 | 6 | 5 | 27 | 1 | 0 |
| Harold Fannin Jr.vs CLE • Wk 7 | 13.1 | 9 | 6 | 91 | 0 | 0 |
| Kenyon Sadiqvs NYJ • Wk 1 | 11.4 | 3 | 3 | 21 | 0 | 3 |
| Brenton Strangevs JAX • Wk 10 | 8.9 | 3 | 2 | 9 | 1 | 0 |
| Mo Alie-Cox@ IND • Wk 6 | 7.1 | 1 | 1 | 1 | 1 | 0 |
| Jack Endries@ CIN • Wk 8 | 7.1 | 1 | 1 | 1 | 1 | 0 |
| Dalton Schultzvs HOU • Wk 5 | 6.0 | 4 | 3 | 30 | 0 | 0 |
| Matthew Hibner@ BAL • Wk 4 | 5.4 | 2 | 2 | 34 | 0 | 0 |
| Will Mallory@ IND • Wk 6 | 4.0 | 6 | 2 | 20 | 0 | 0 |
| Isaiah Likely@ NYG • Wk 3 | 3.3 | 5 | 2 | 13 | 0 | 0 |
| Johnny Mundtvs PHI • Wk 2 | 2.8 | 3 | 2 | 8 | 0 | 0 |
| Foster Moreauvs HOU • Wk 5 | 2.8 | 3 | 2 | 8 | 0 | 0 |
| Nate Boerkirchervs JAX • Wk 10 | 2.2 | 2 | 1 | 12 | 0 | 0 |
| Mason Taylorvs NYJ • Wk 1 | 1.8 | 3 | 2 | -2 | 0 | 0 |
| Tanner Koziolvs JAX • Wk 10 | 1.8 | 1 | 1 | 8 | 0 | 0 |
| Pharaoh Brown@ IND • Wk 6 | 1.7 | 1 | 1 | 7 | 0 | 0 |
| Jeremy Ruckertvs NYJ • Wk 1 | 1.4 | 1 | 1 | 4 | 0 | 0 |
| Dallas Goedertvs PHI • Wk 2 | 1.4 | 2 | 1 | 4 | 0 | 0 |
Fantasy points first, then the stats that matter for his position. Ring around each photo is that player's Mania Rating. Tap a name to open his profile.