
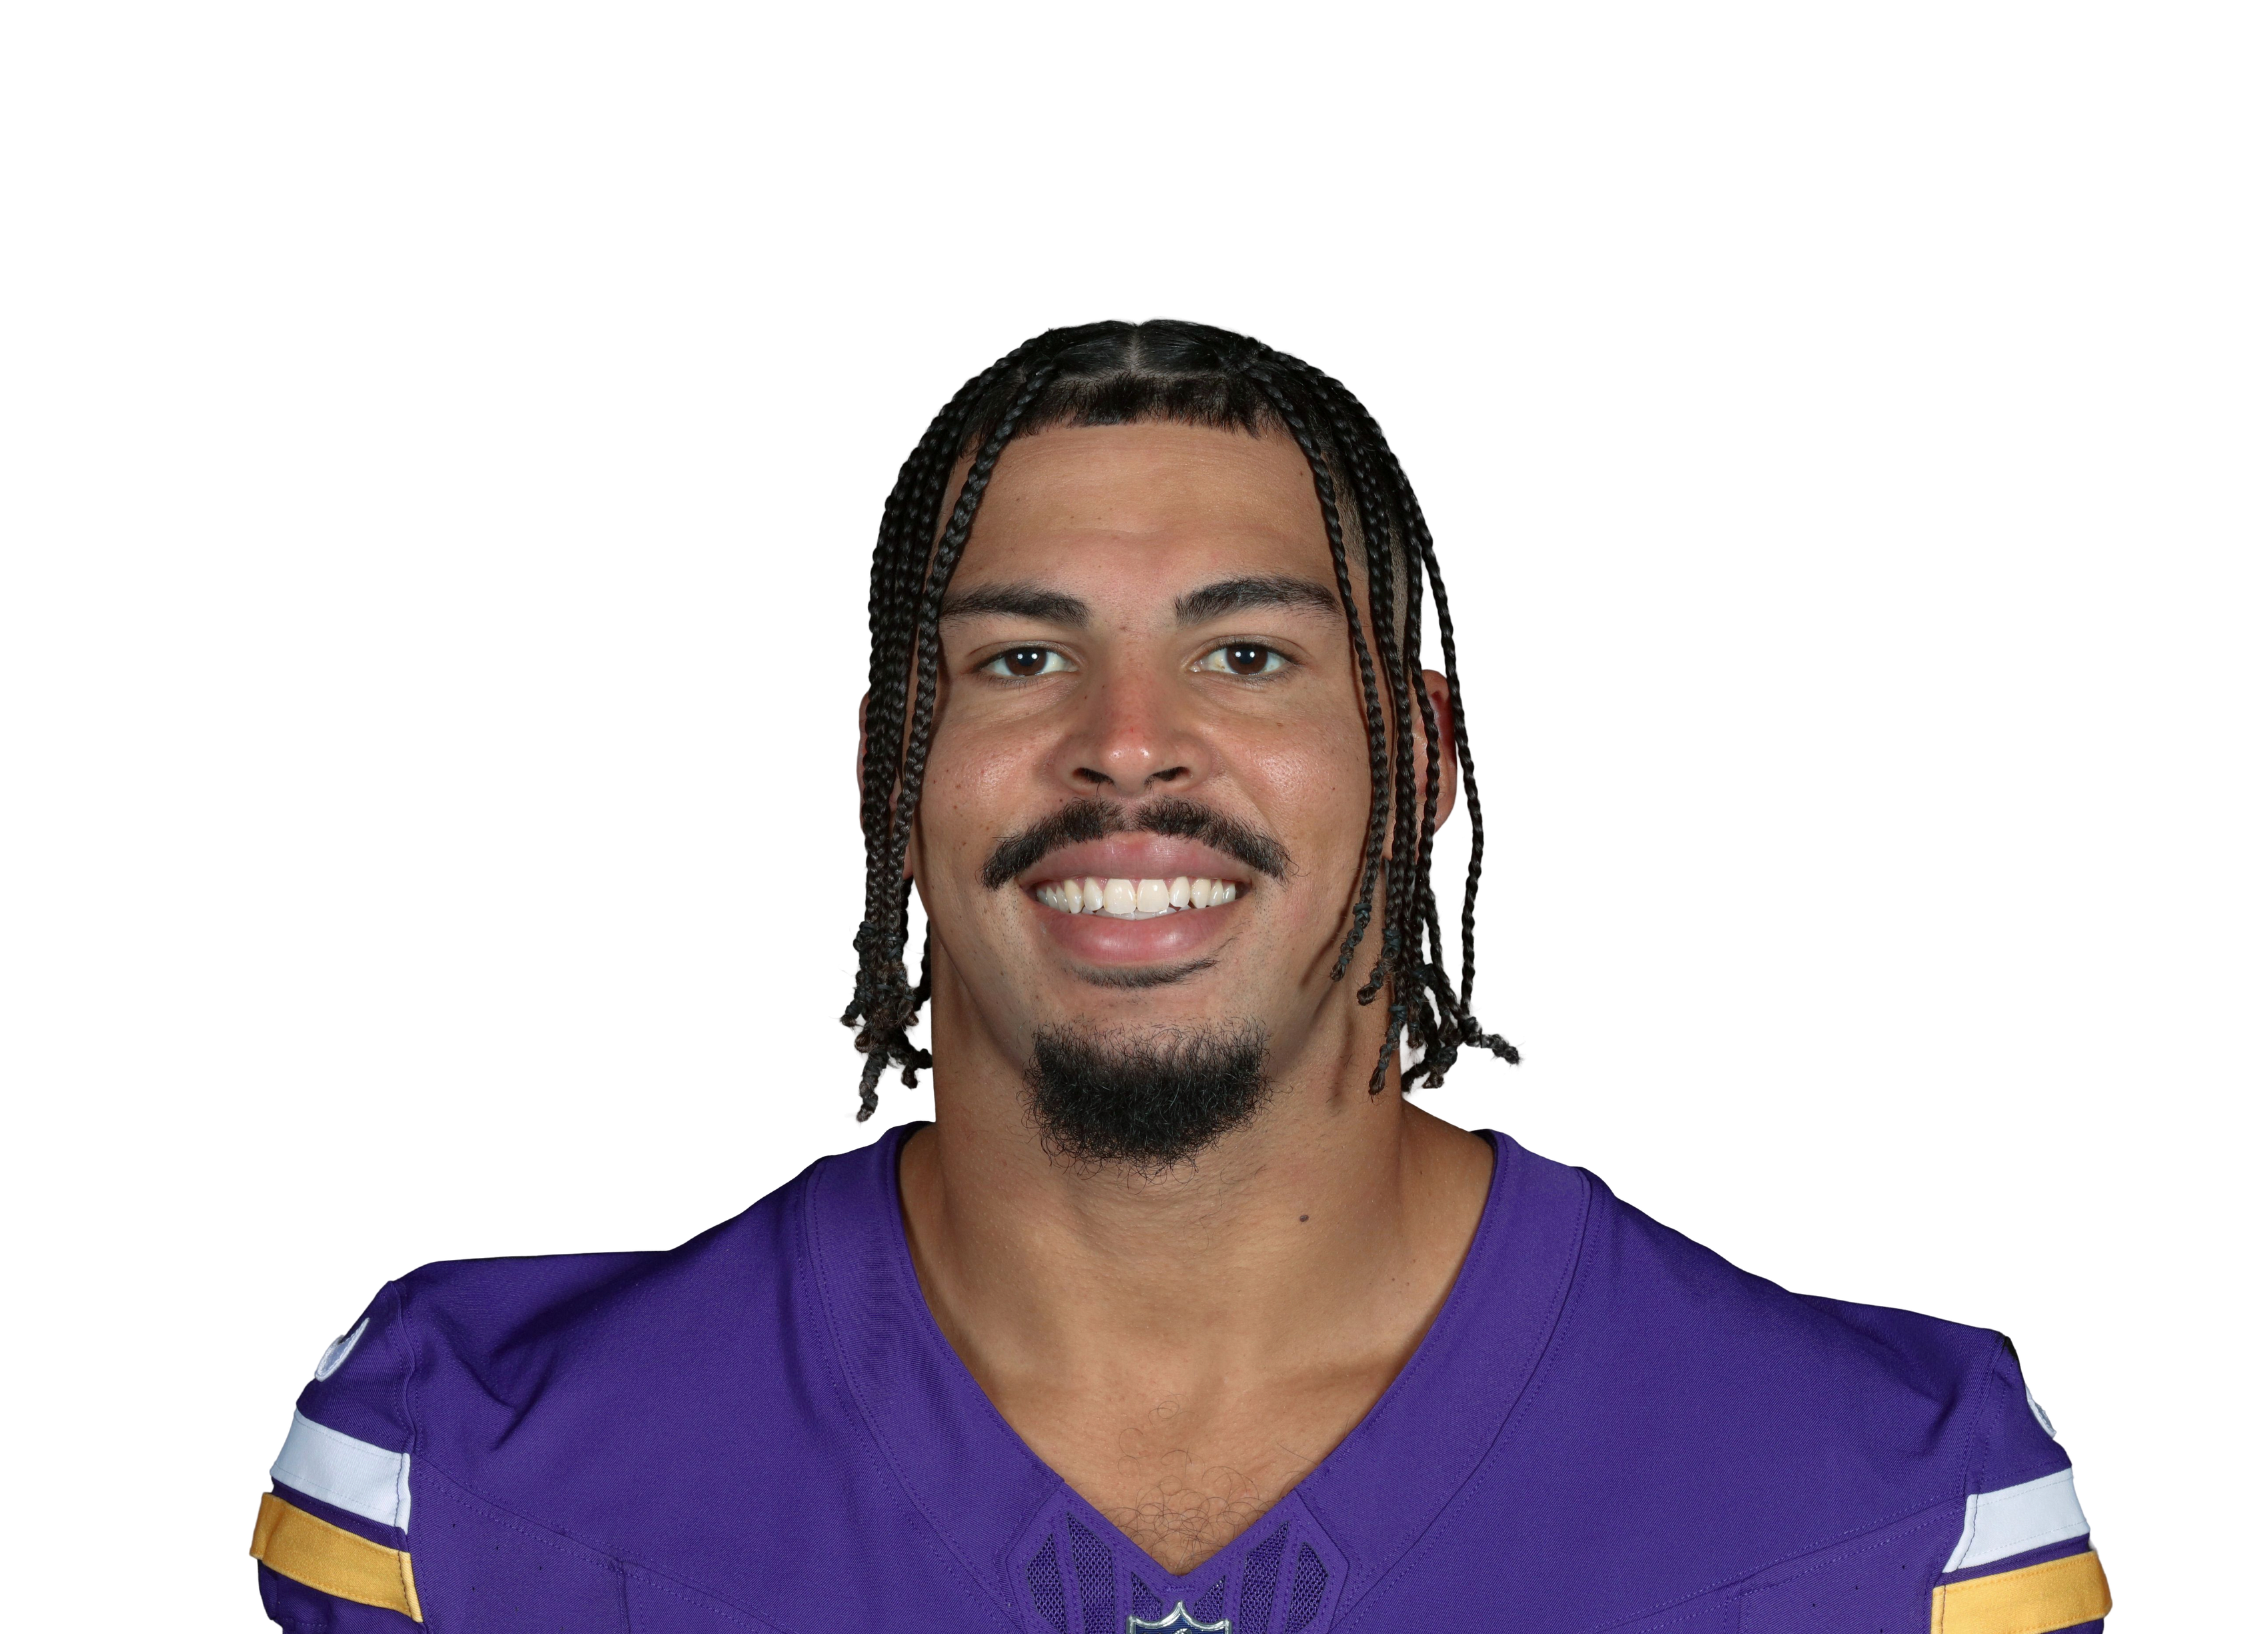
Josh Oliver
Pick a teammate with or without. Pick more than one to combine them, like a game without the QB and without the other back.
Injured reserve • no Week 11 Rating1 teammate note ▾

12.8 PPR points a game allowed to tight ends, 18th most of 32 defenses.
| Player | PPR | Tgt | Rec | Rec Yd | Rec TD | Rush Yd |
|---|---|---|---|---|---|---|
 Brock Bowersvs LV • Wk 9 | 22.3 | 8 | 7 | 111 | 1 | 2 |
 Trey McBridevs ARI • Wk 3 | 16.5 | 11 | 9 | 75 | 0 | 0 |
 Chig Okonkwovs WAS • Wk 6 | 13.9 | 7 | 7 | 69 | 0 | 0 |
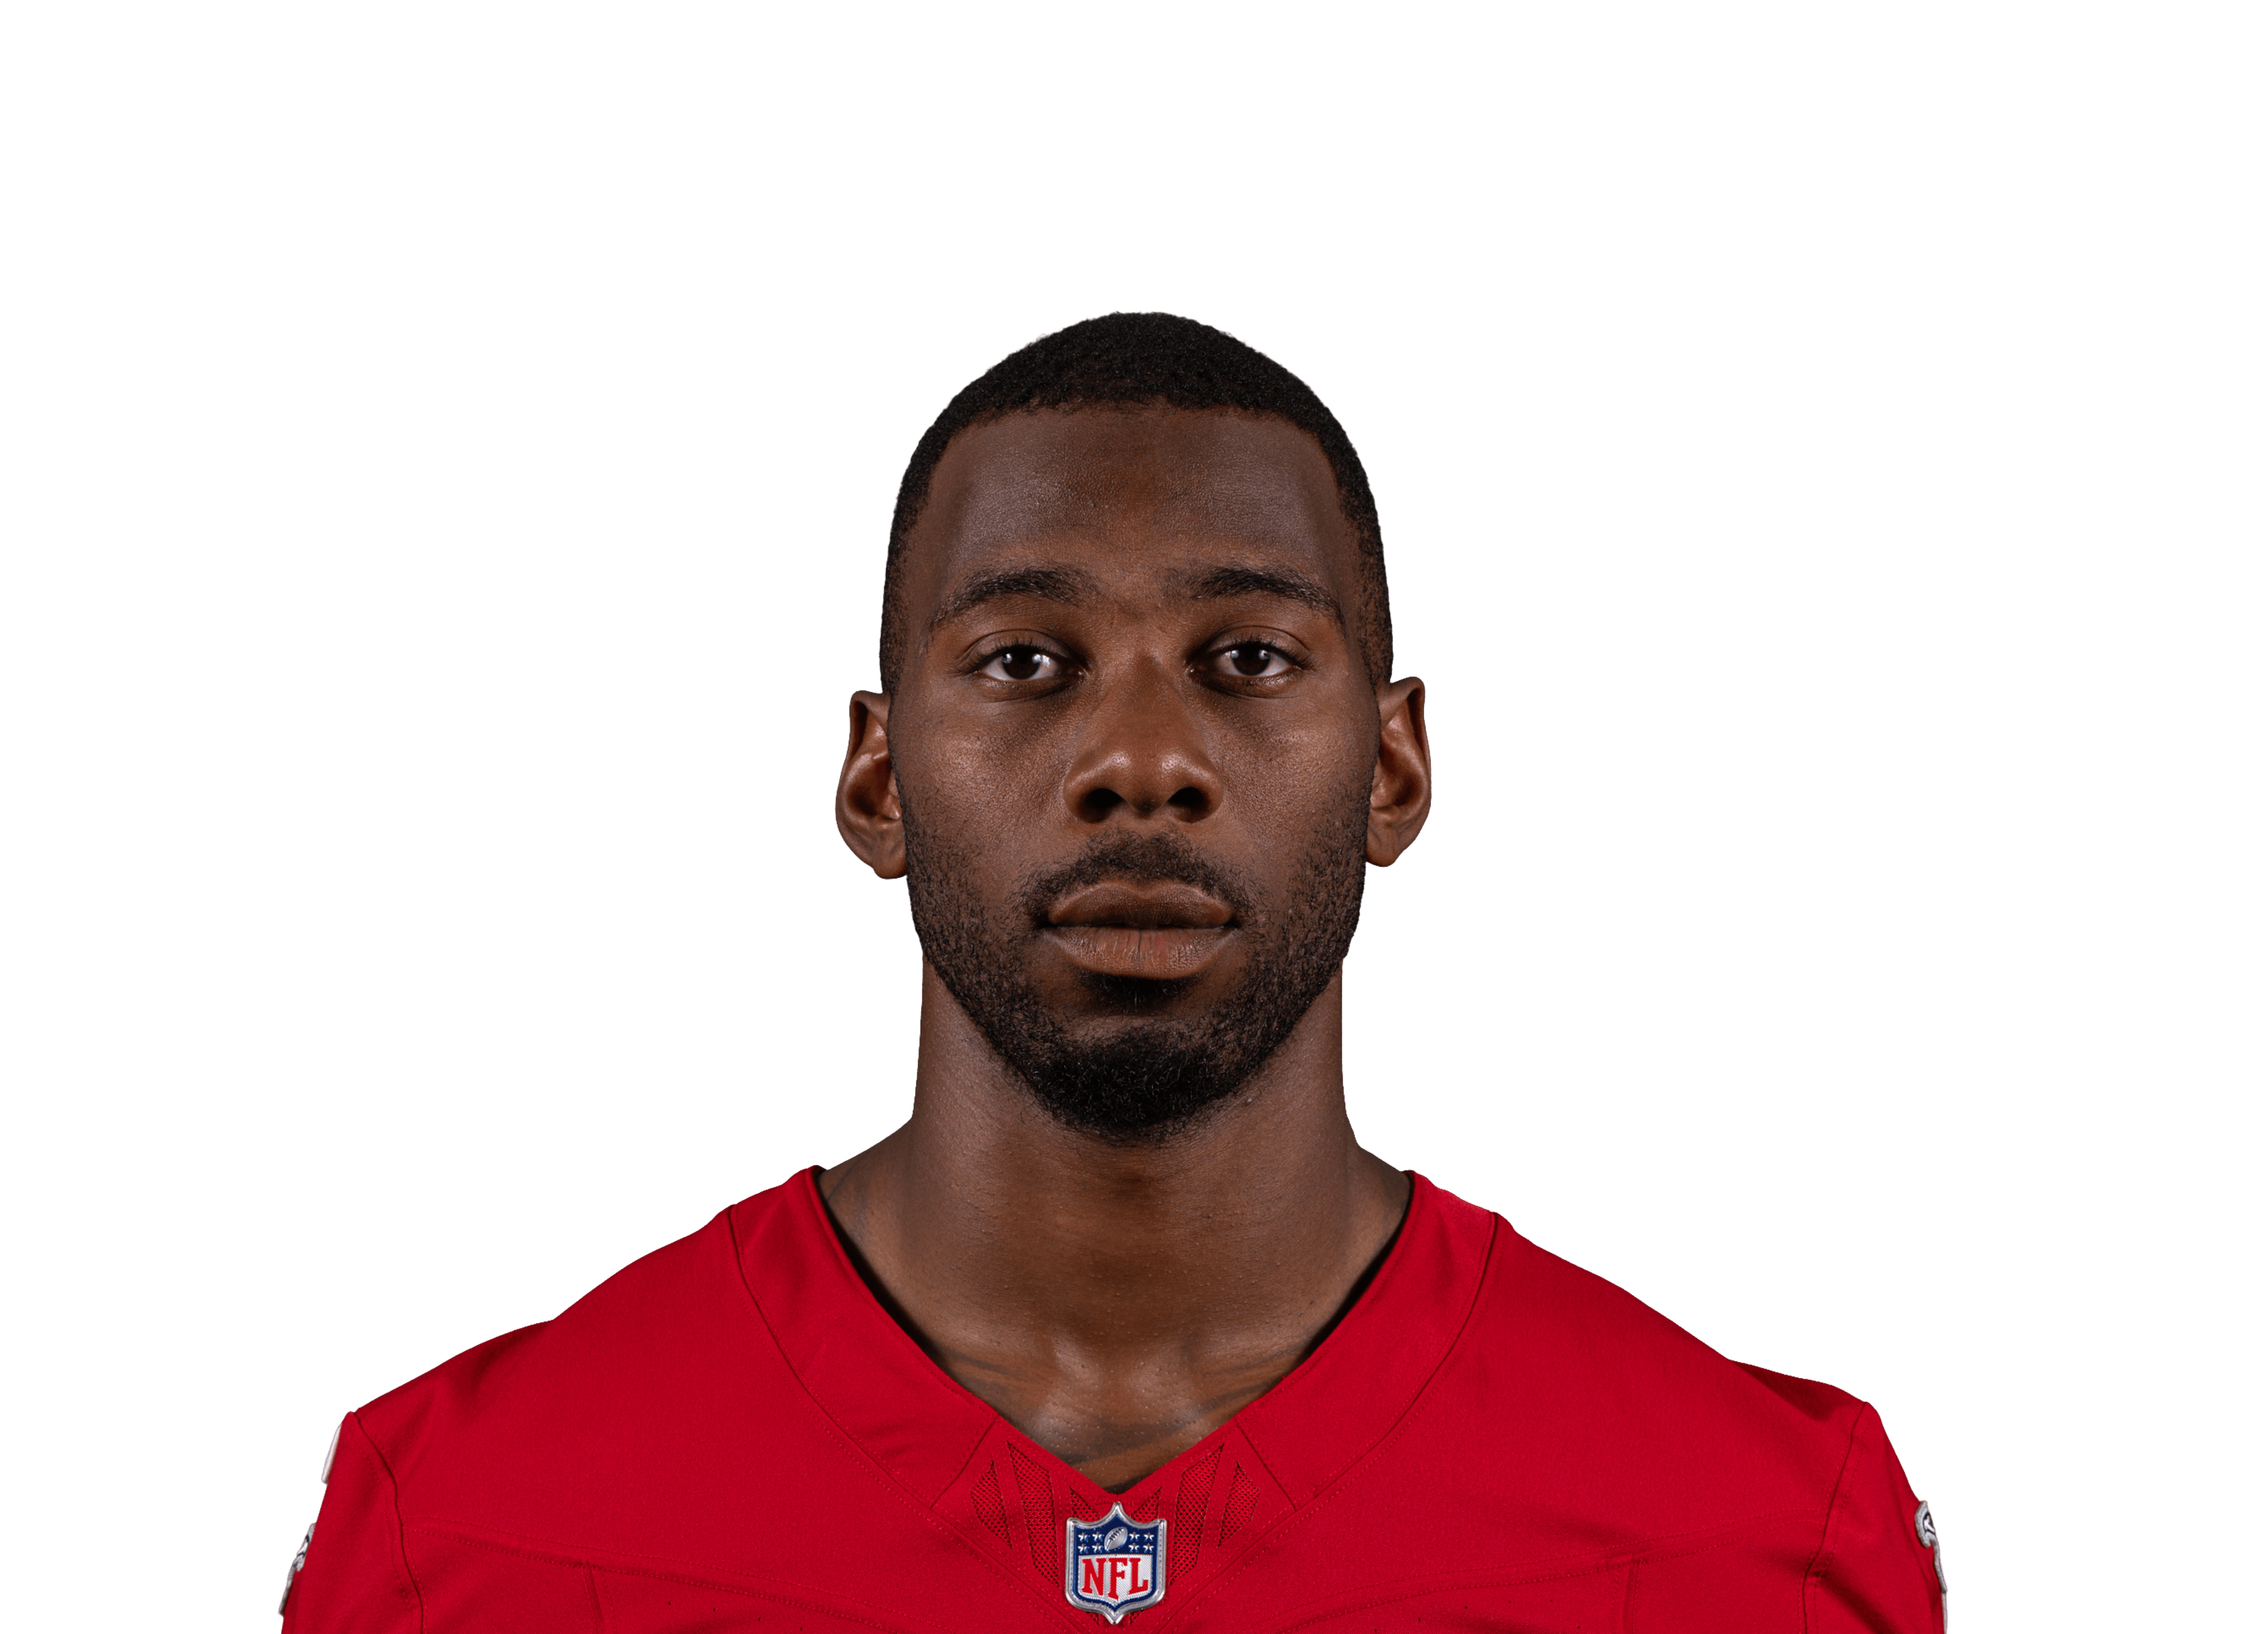 Kyle Pitts@ ATL • Wk 7 | 13.2 | 5 | 5 | 22 | 1 | 0 |
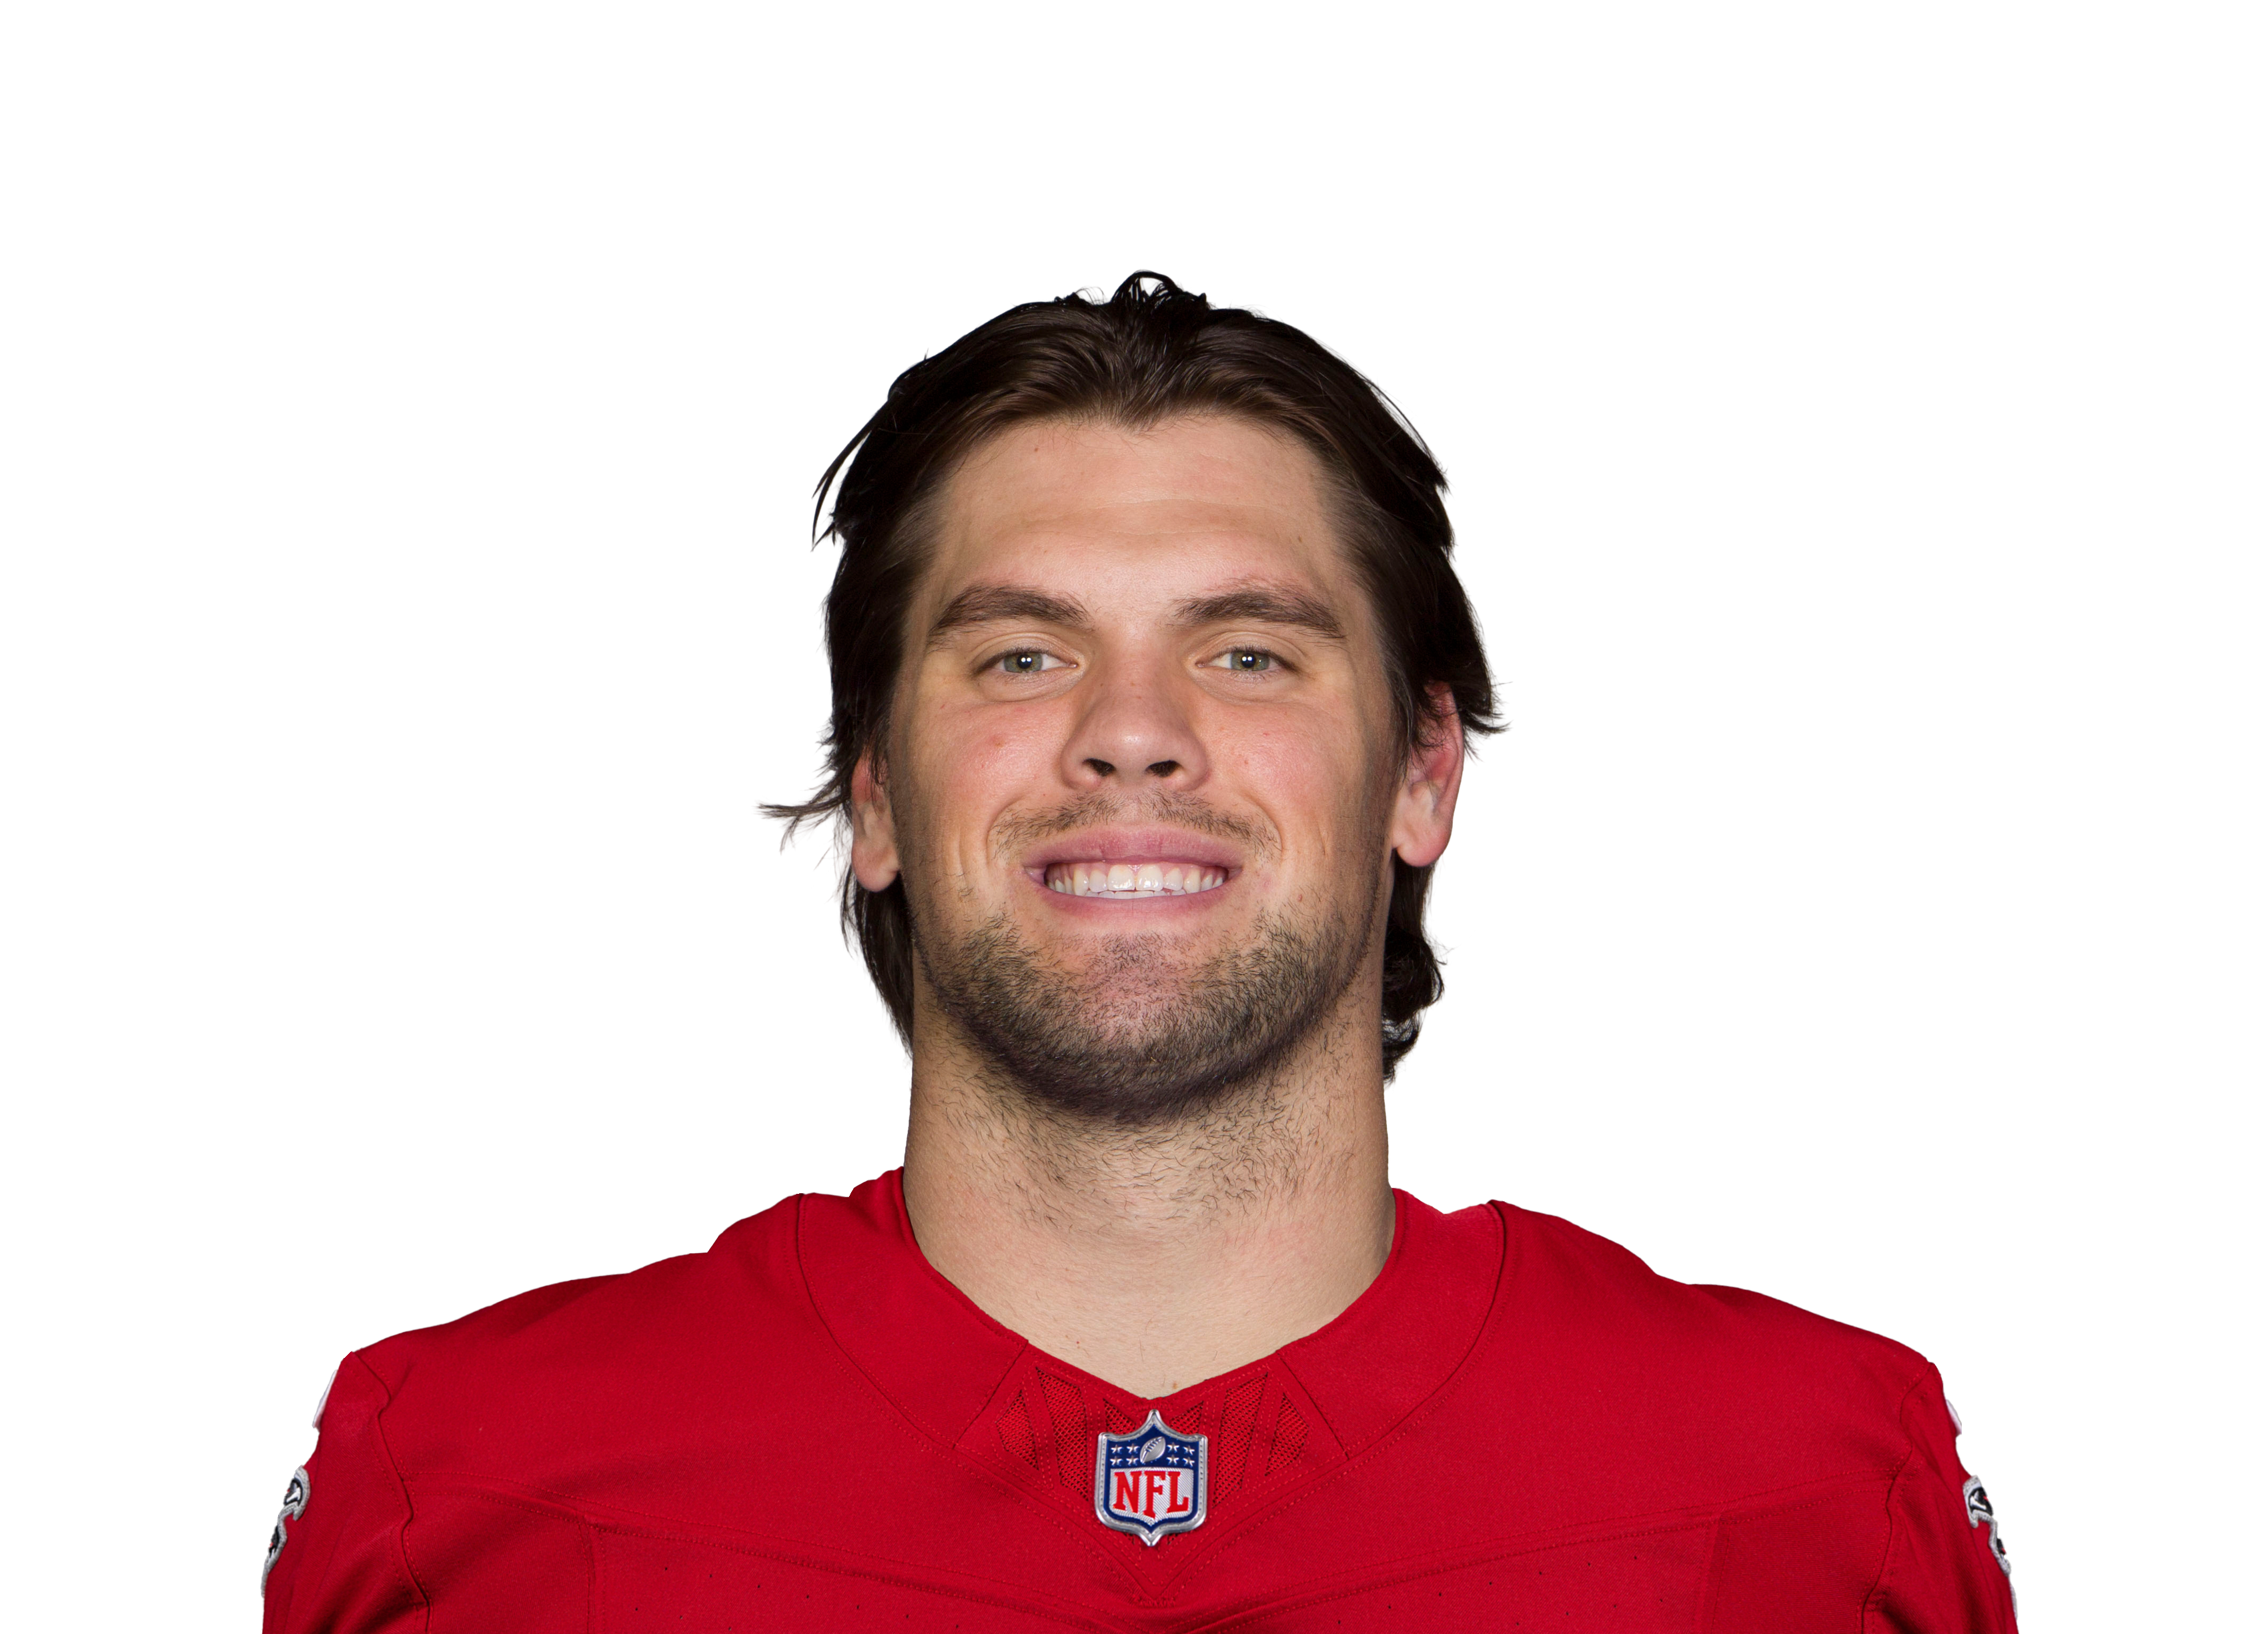 Nick Muse@ ATL • Wk 7 | 8.2 | 2 | 2 | 2 | 1 | 0 |
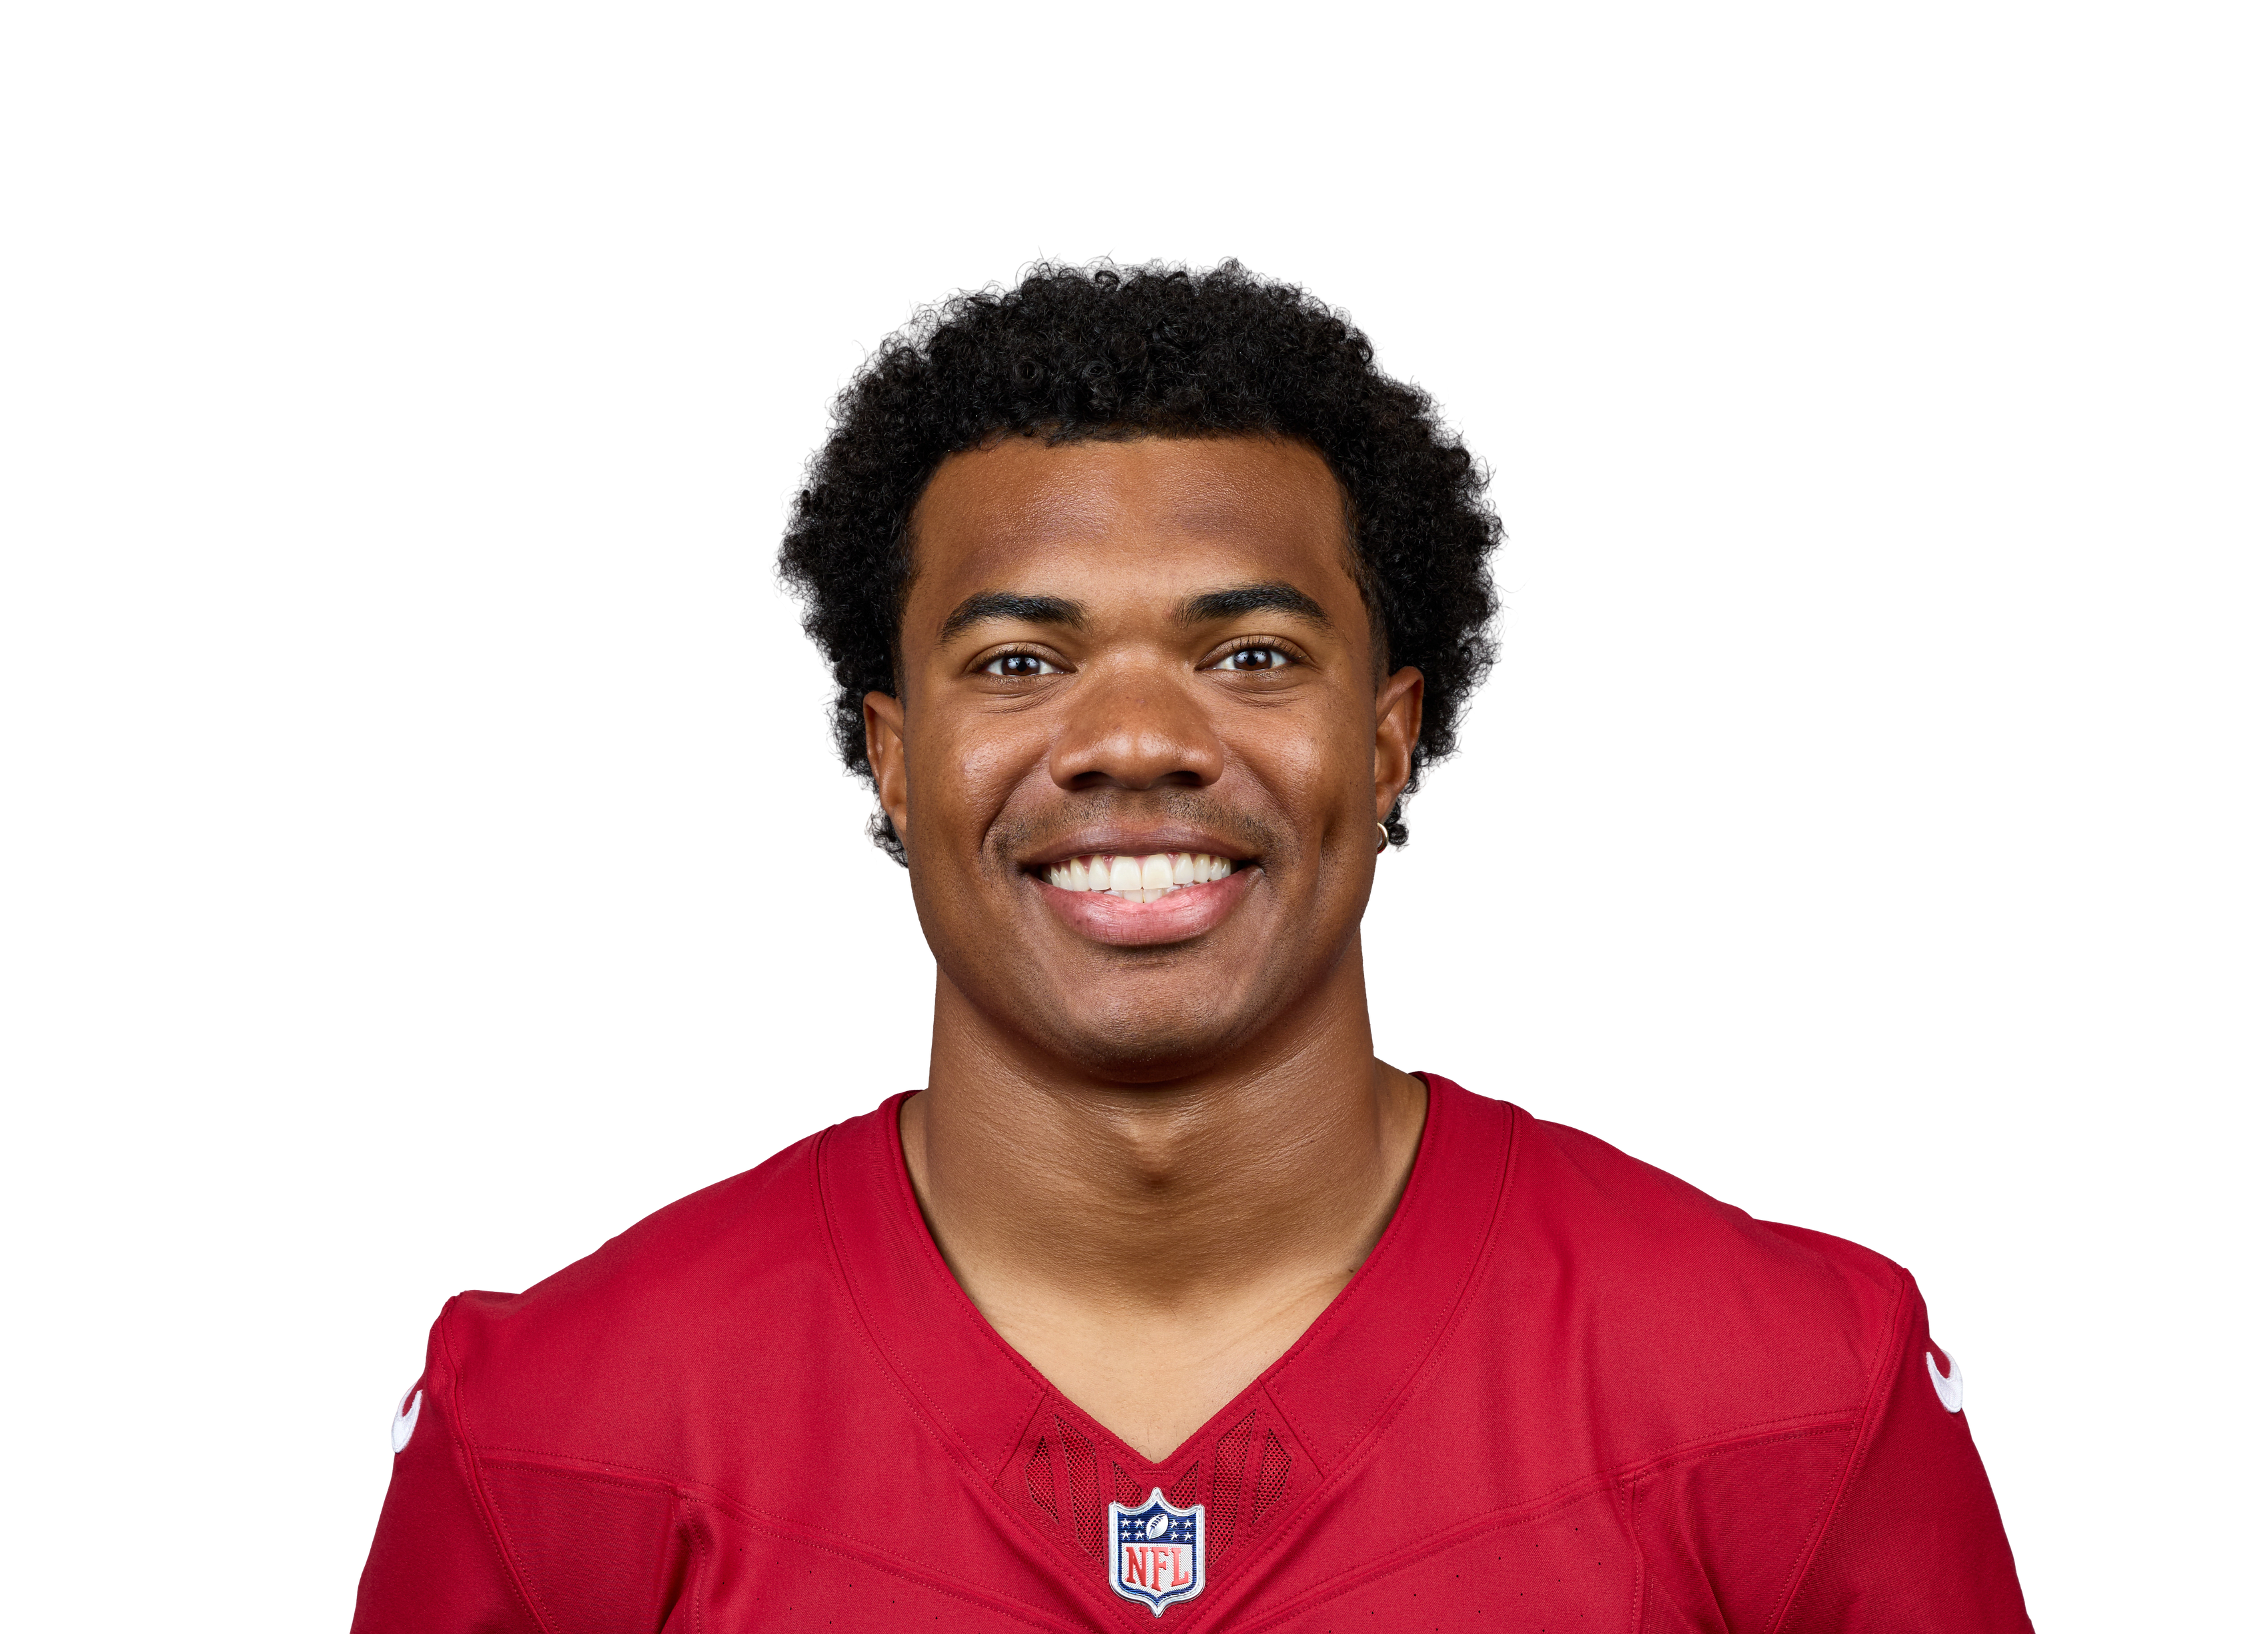 Elijah Higginsvs ARI • Wk 3 | 5.0 | 3 | 3 | 20 | 0 | 0 |
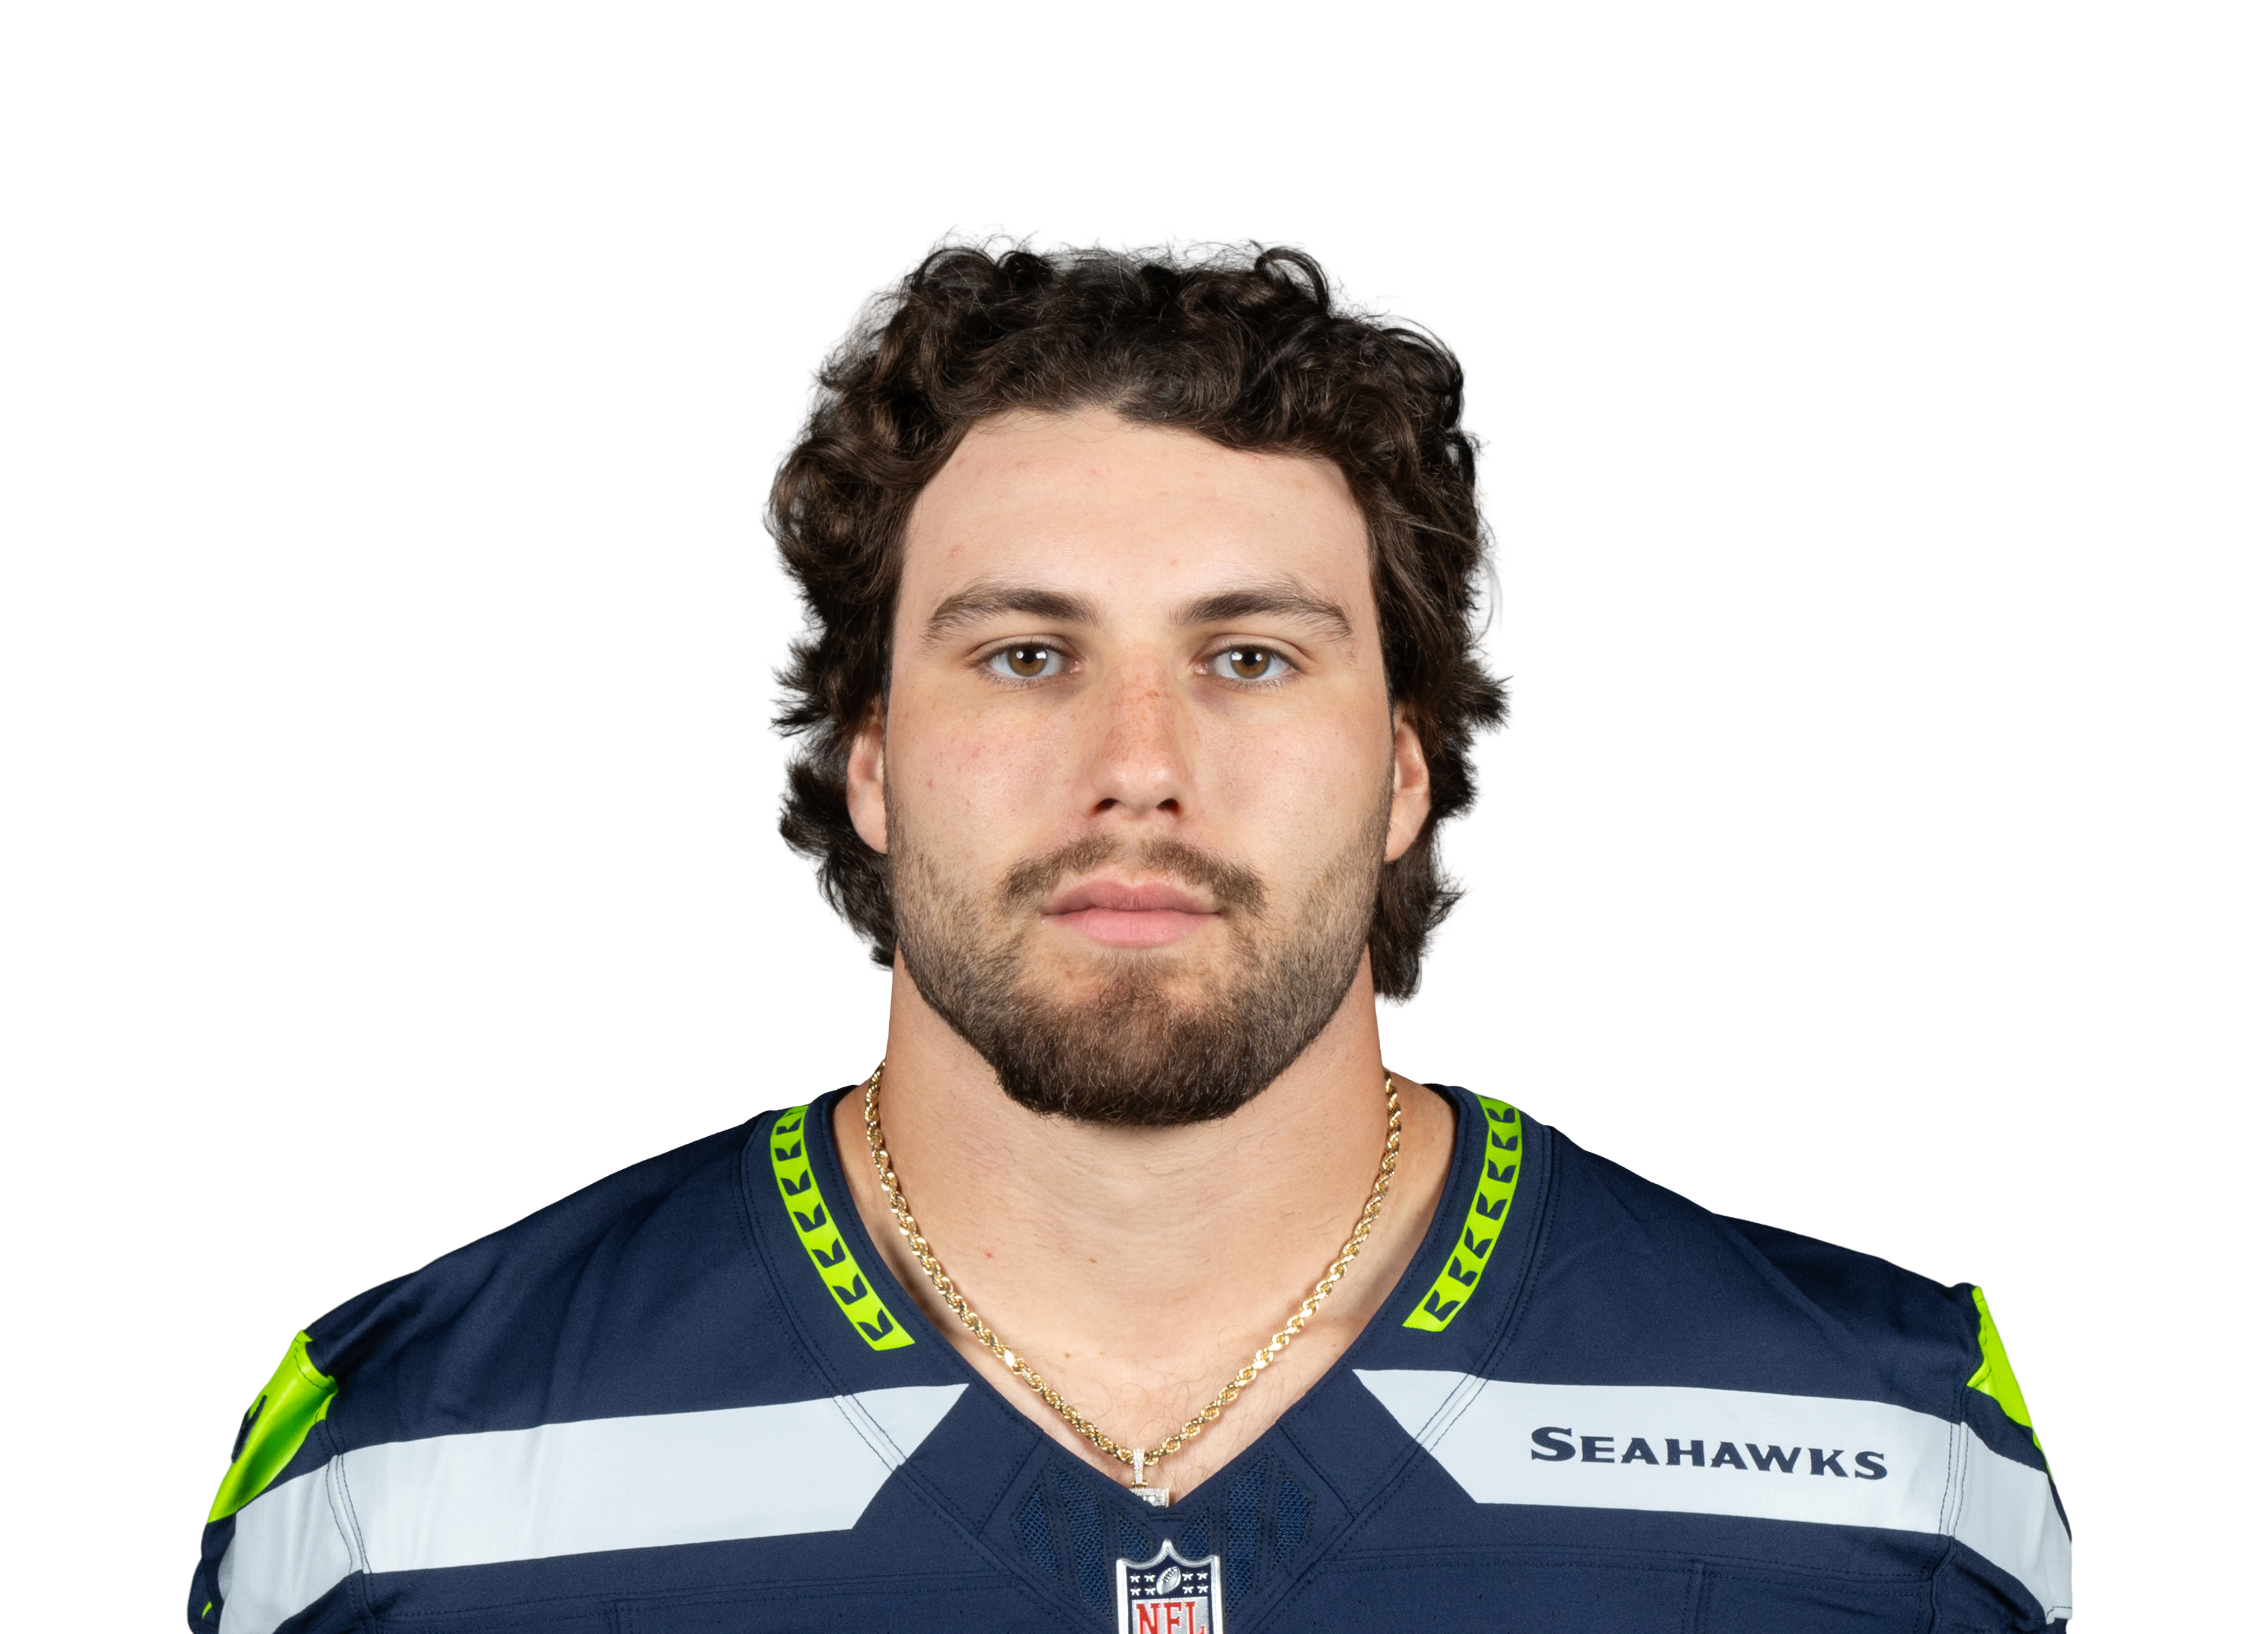 AJ Barner@ SEA • Wk 5 | 5.0 | 5 | 3 | 20 | 0 | 0 |
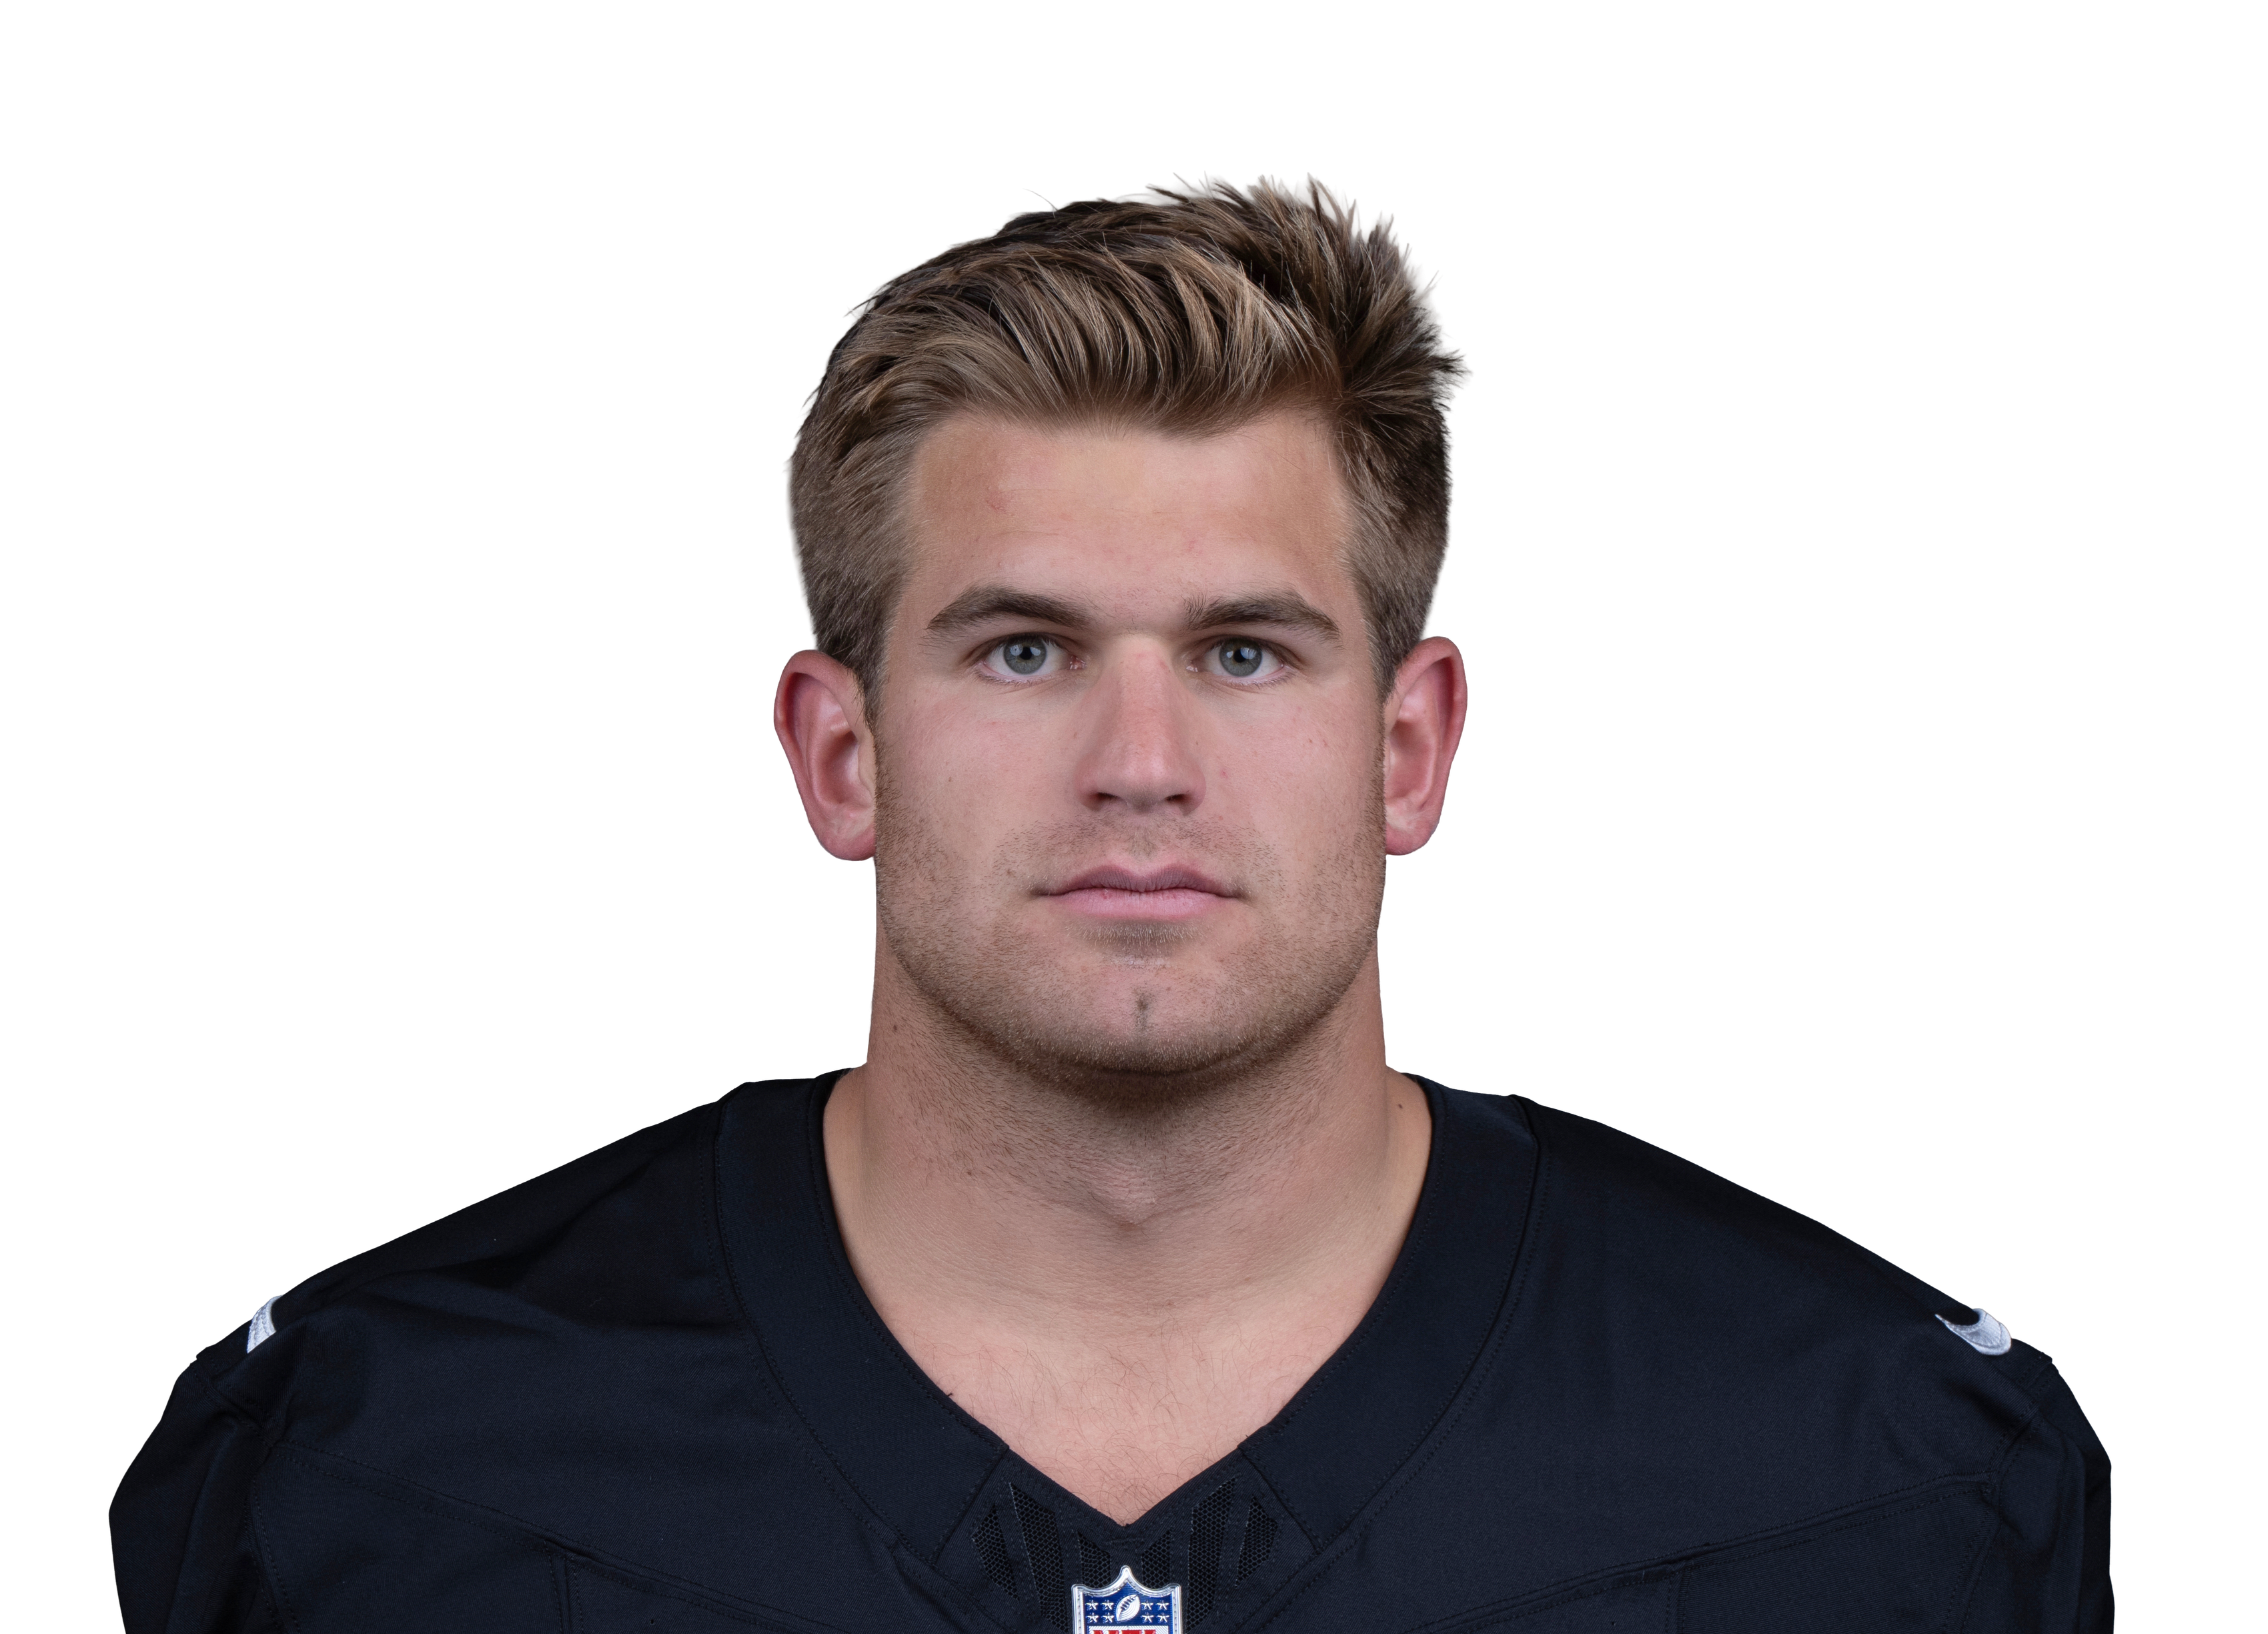 Michael Mayervs LV • Wk 9 | 4.7 | 3 | 3 | 37 | 0 | 0 |
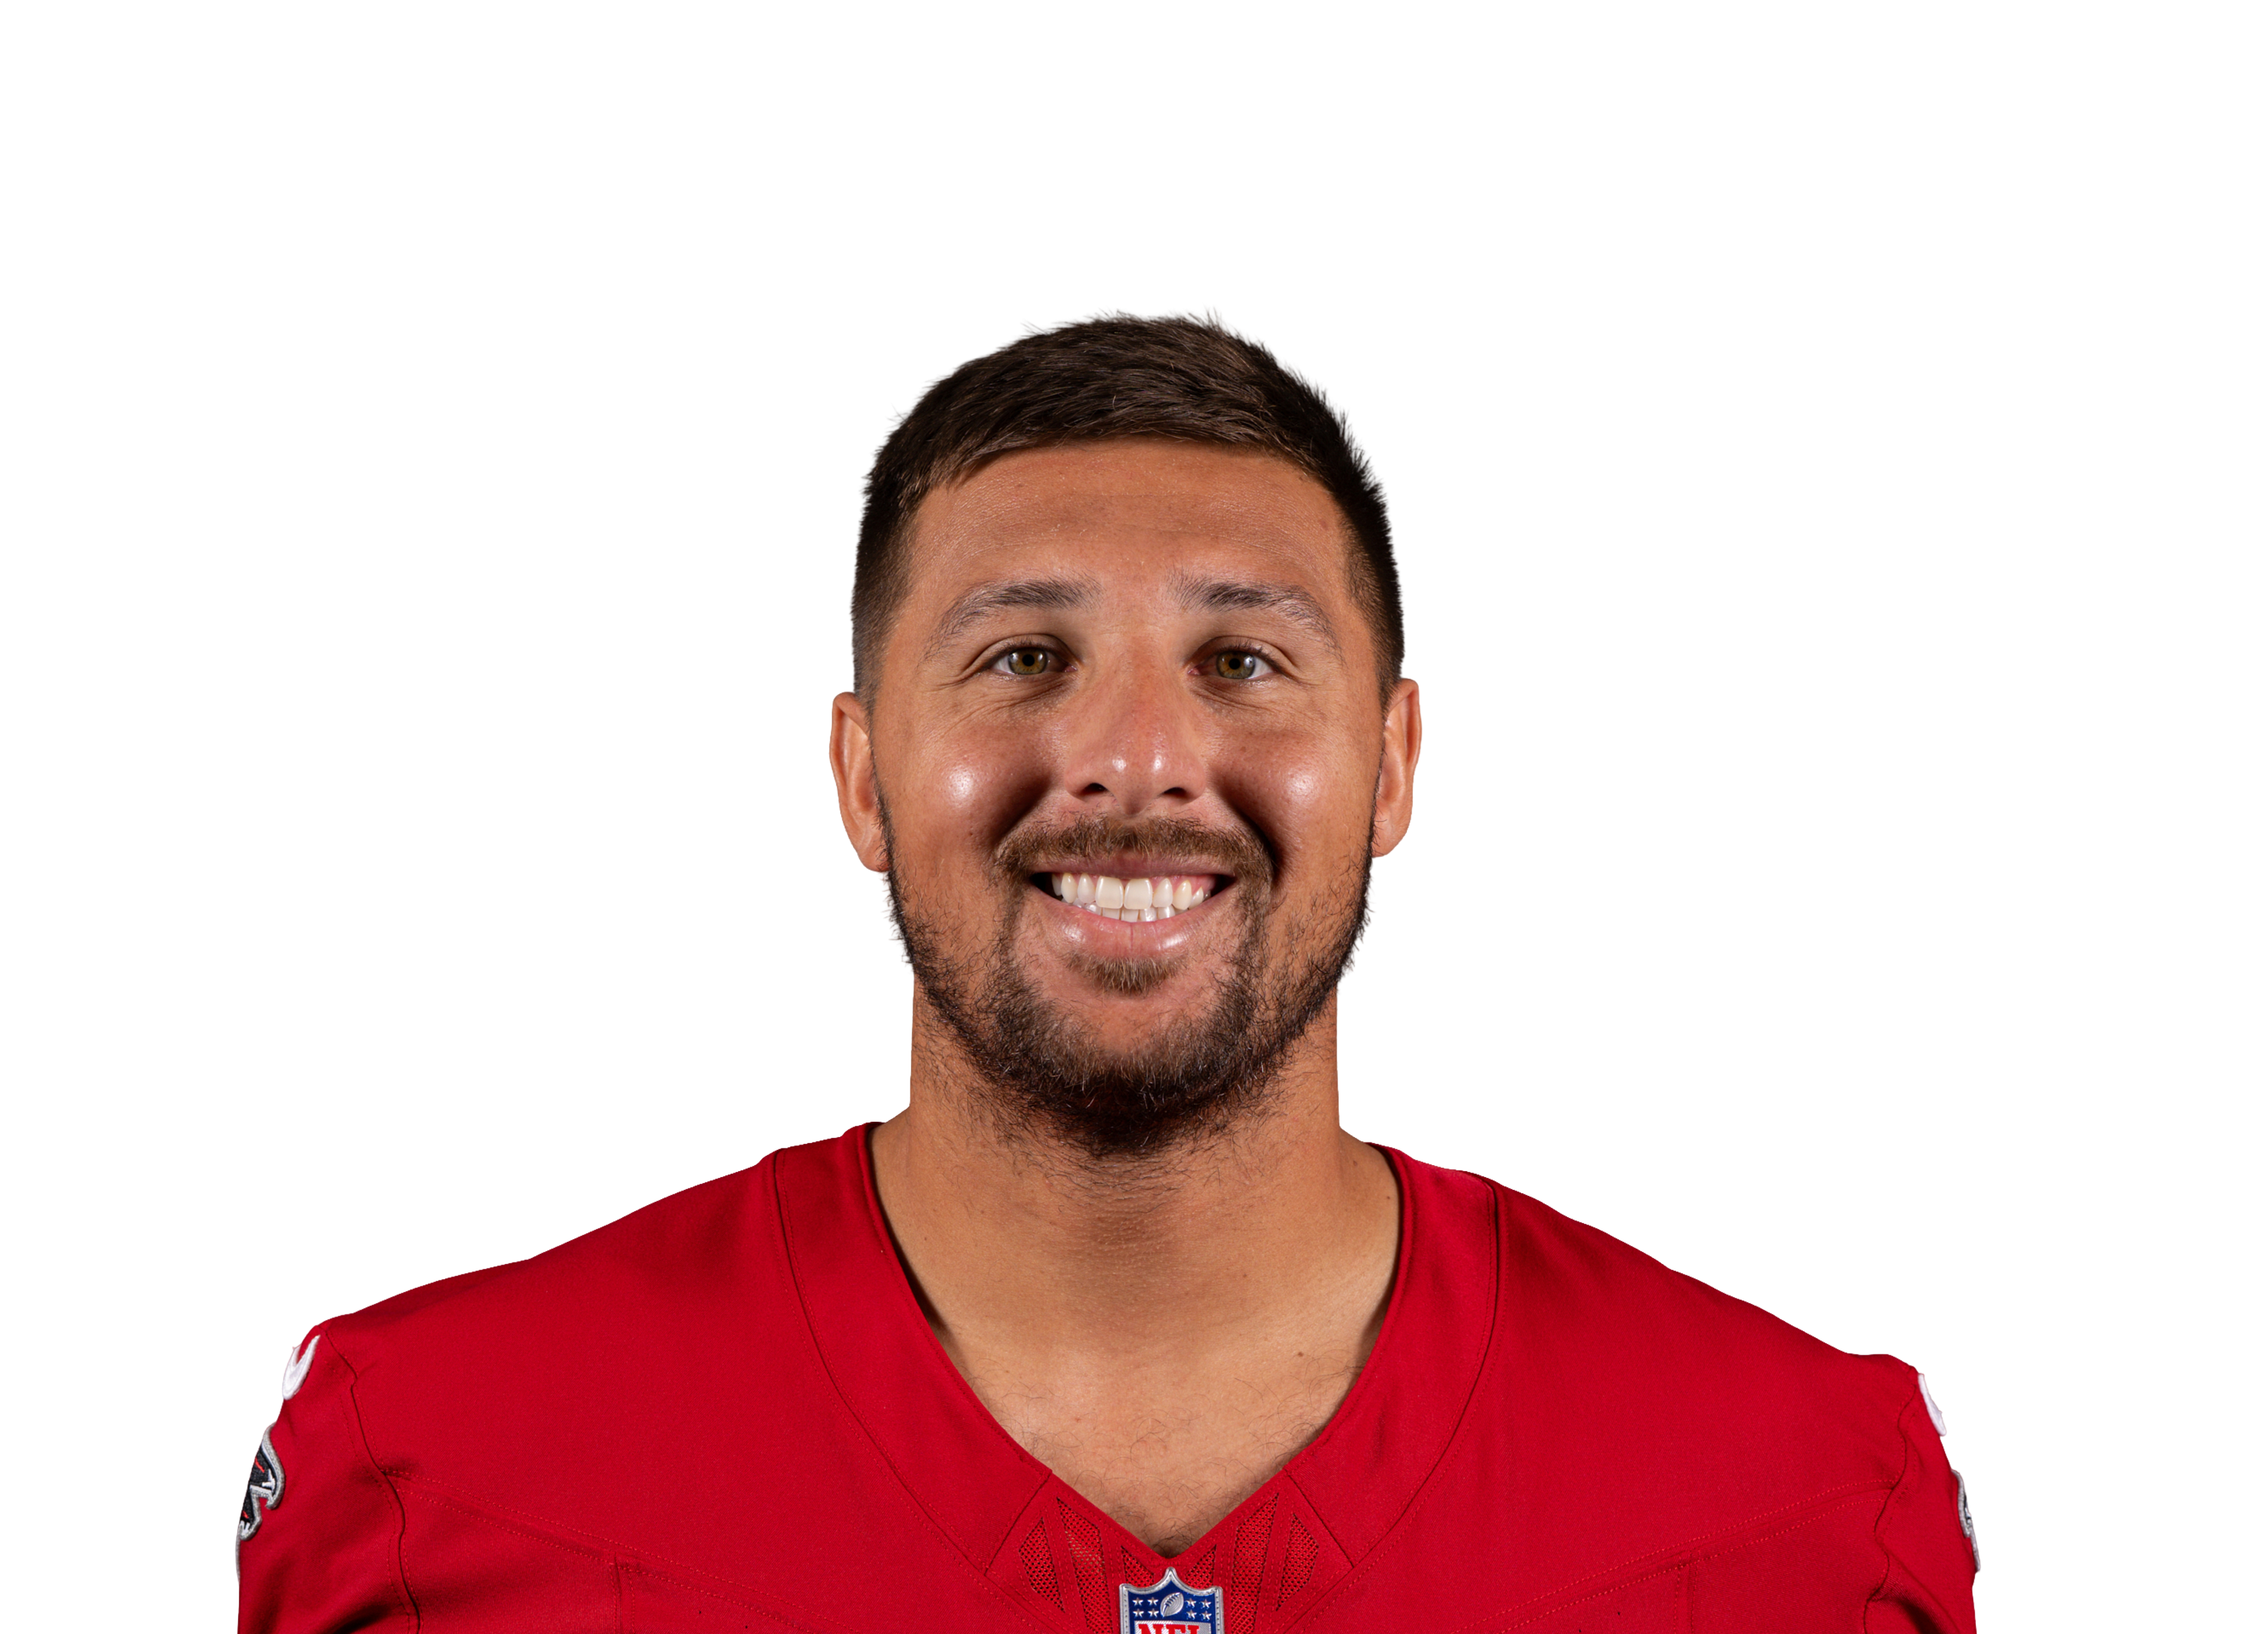 Austin Hooper@ ATL • Wk 7 | 4.1 | 2 | 2 | 21 | 0 | 0 |
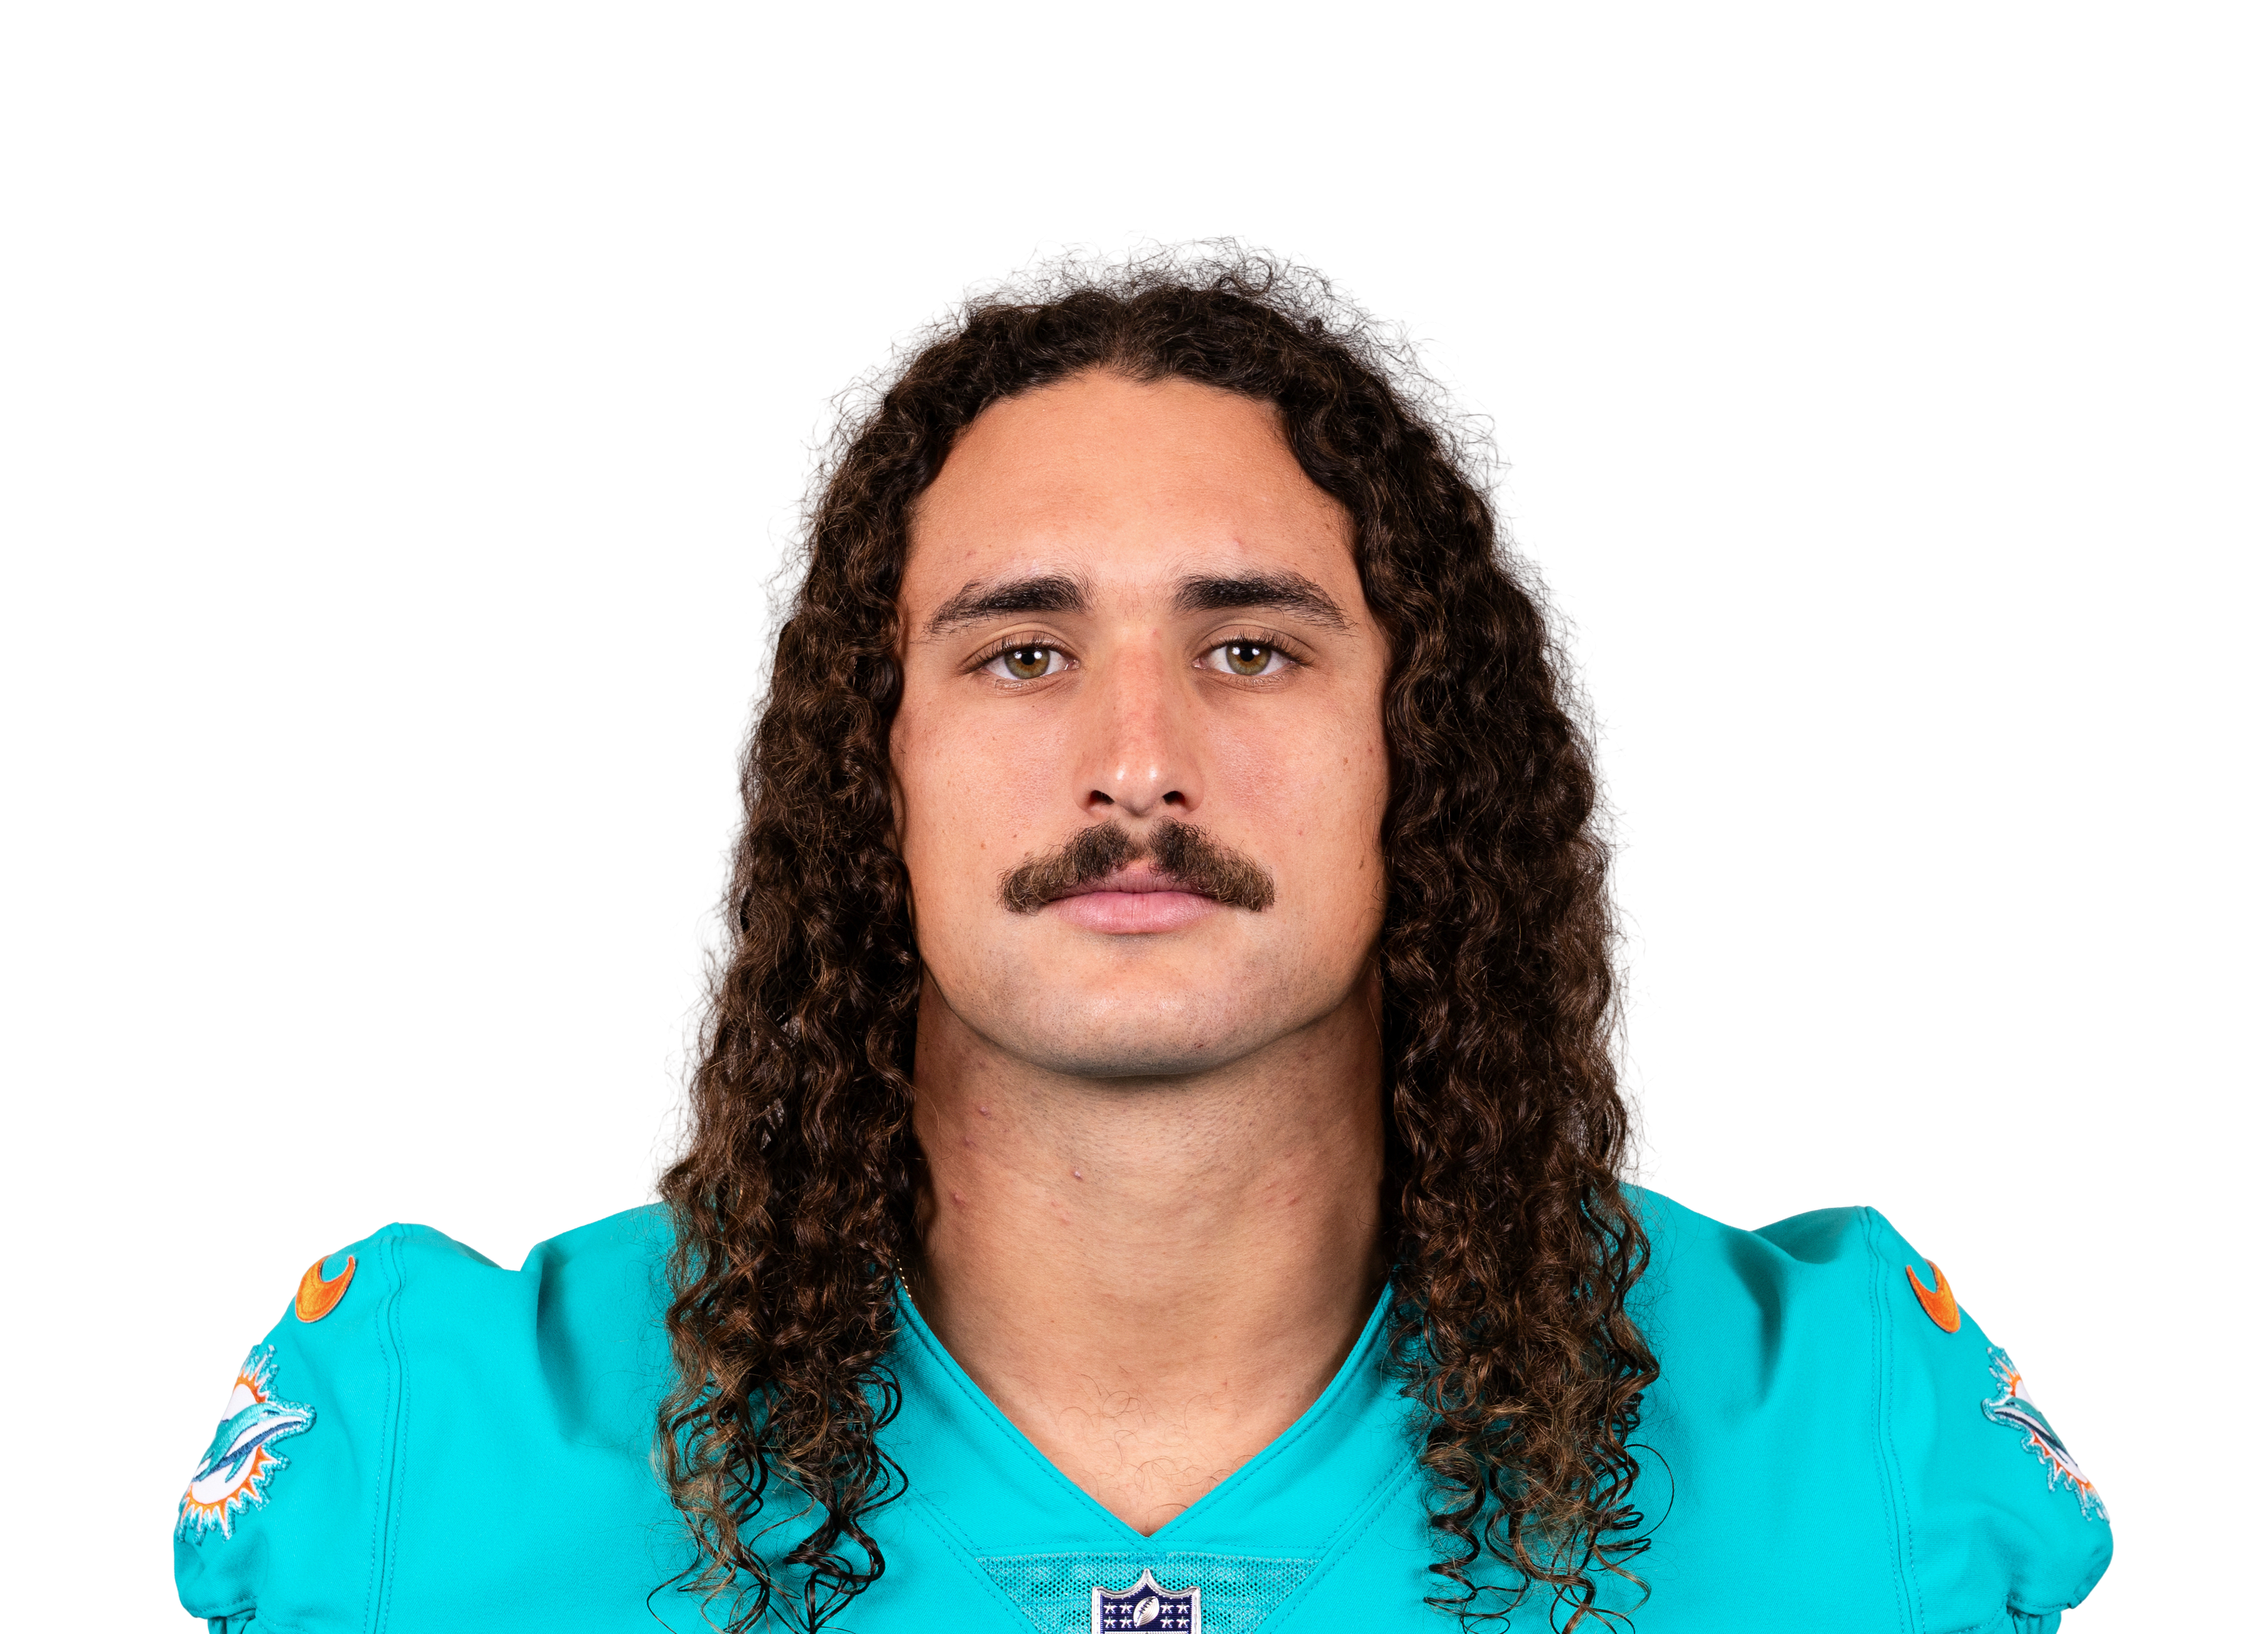 Greg Dulcichvs MIA • Wk 2 | 3.7 | 3 | 2 | 17 | 0 | 0 |
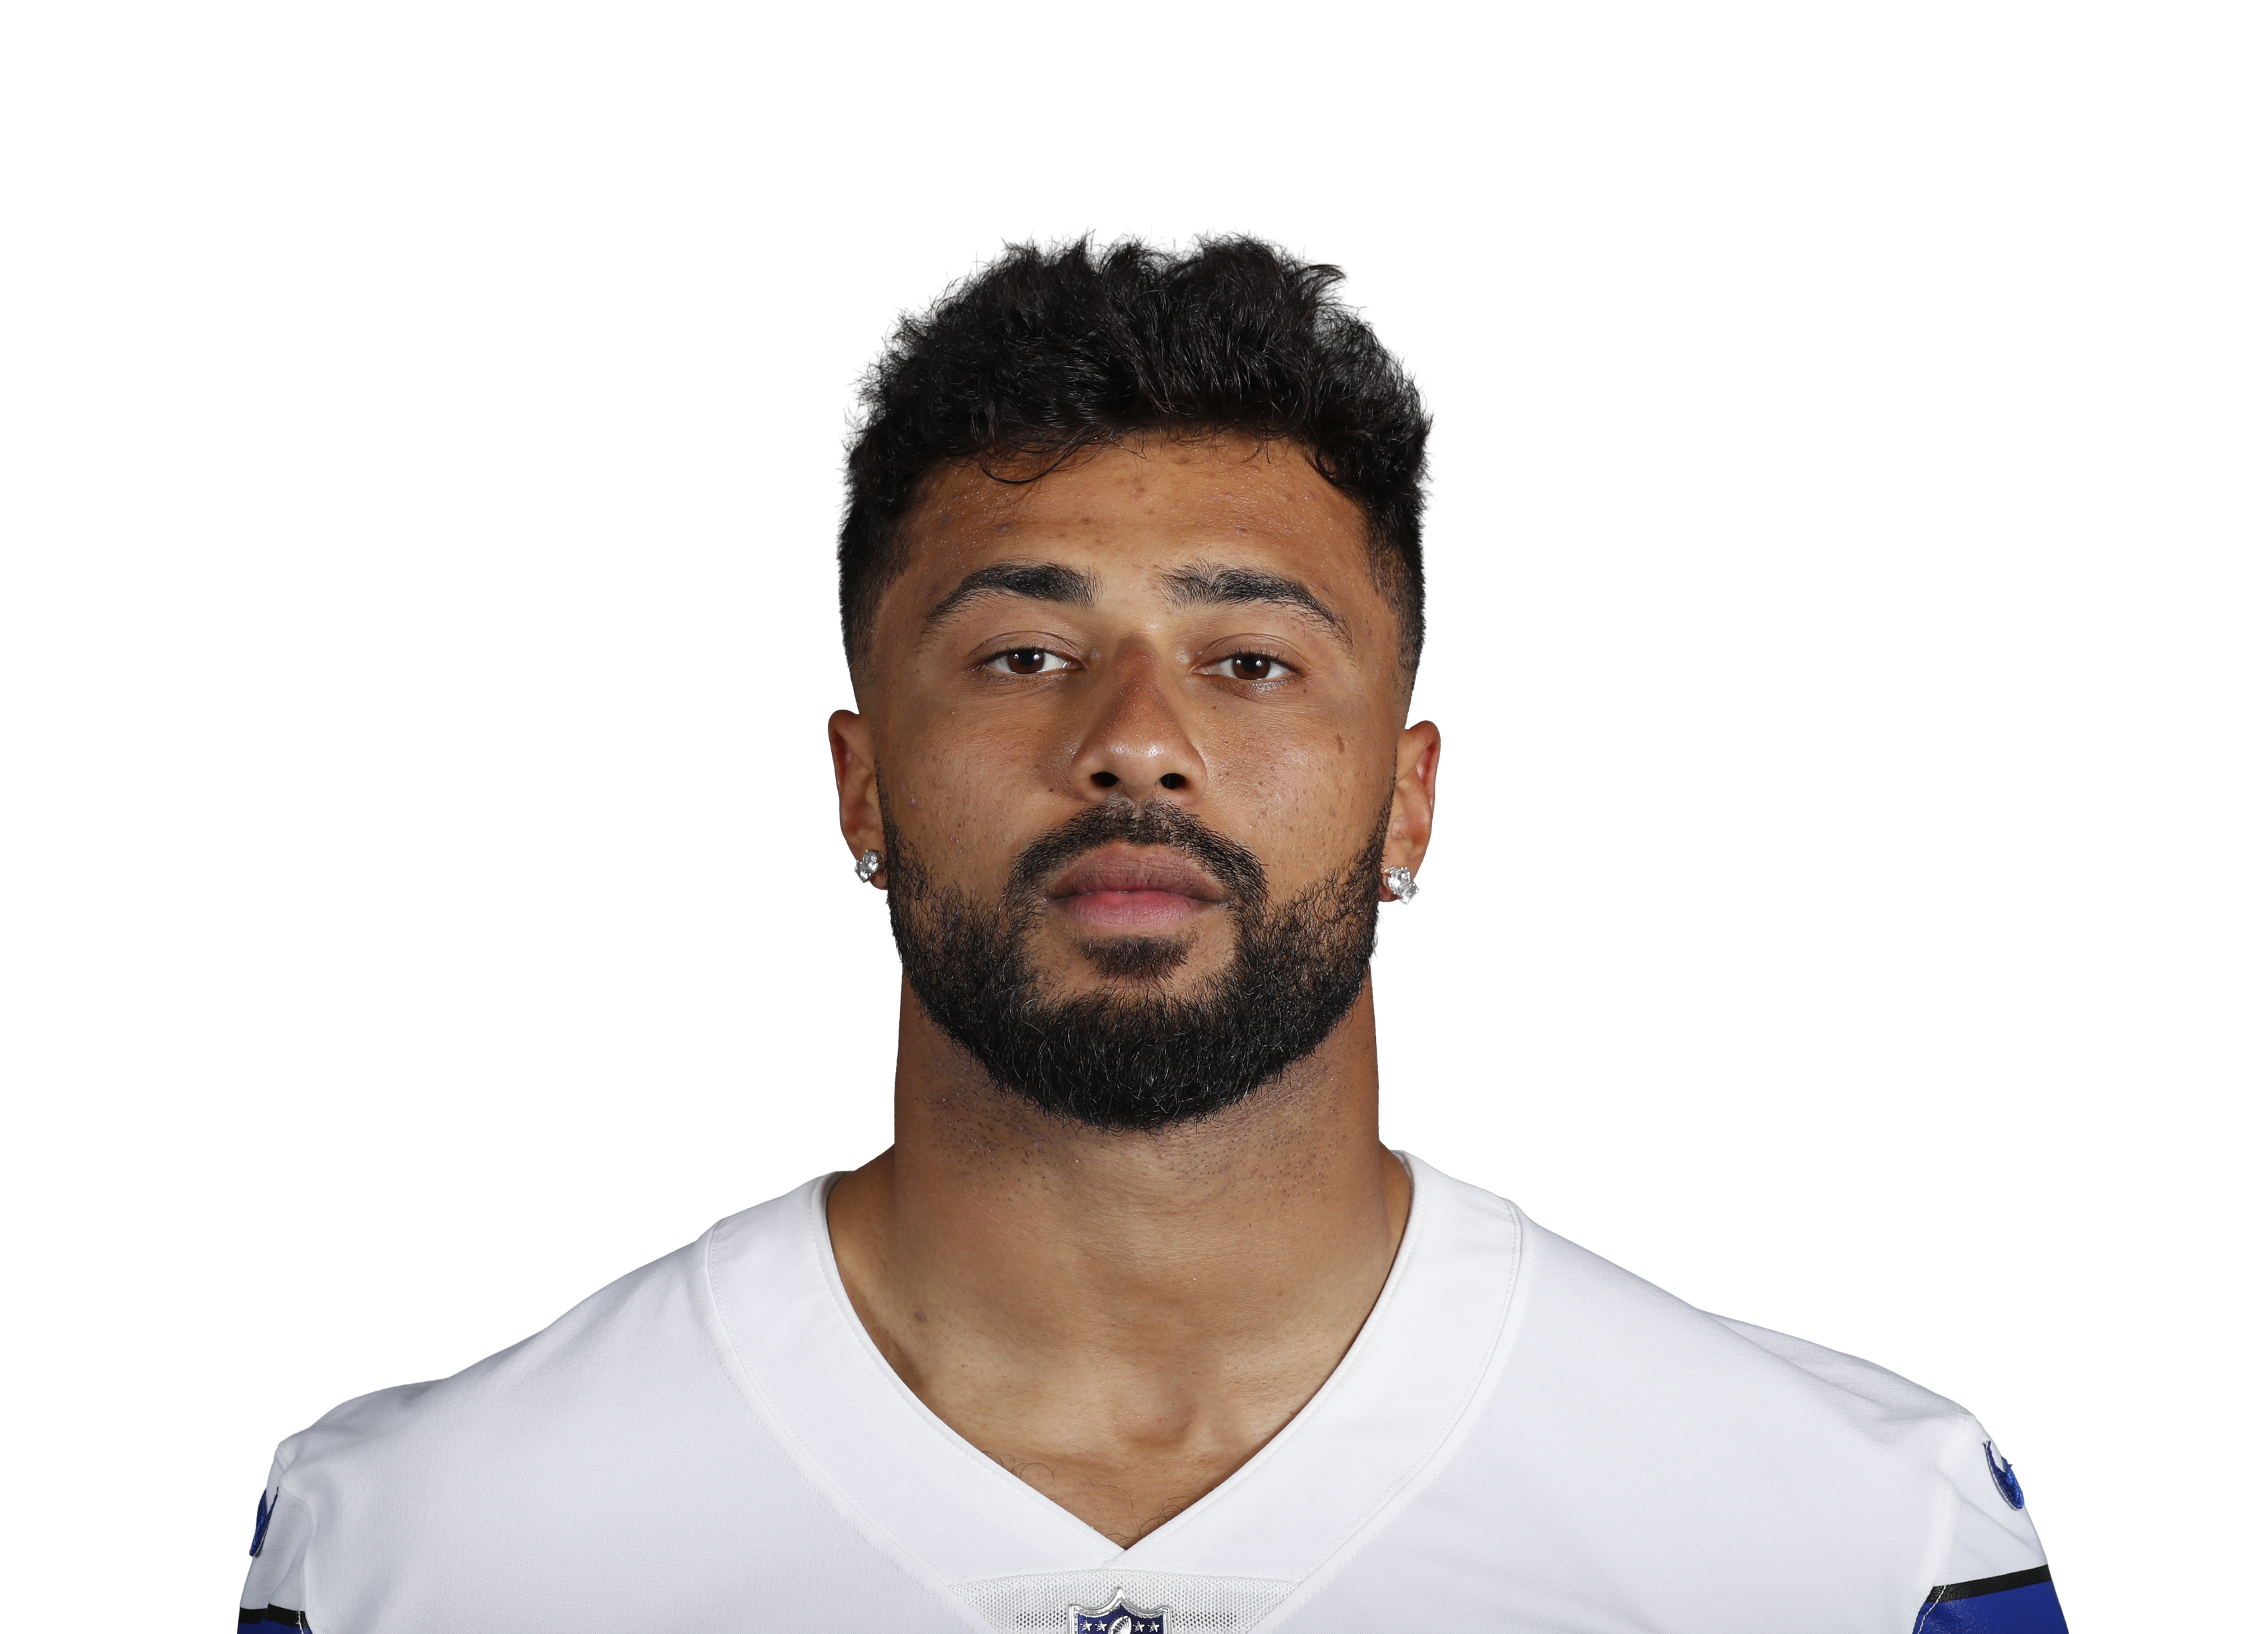 Brevyn Spann-Ford@ DAL • Wk 10 | 3.6 | 3 | 1 | 26 | 0 | 0 |
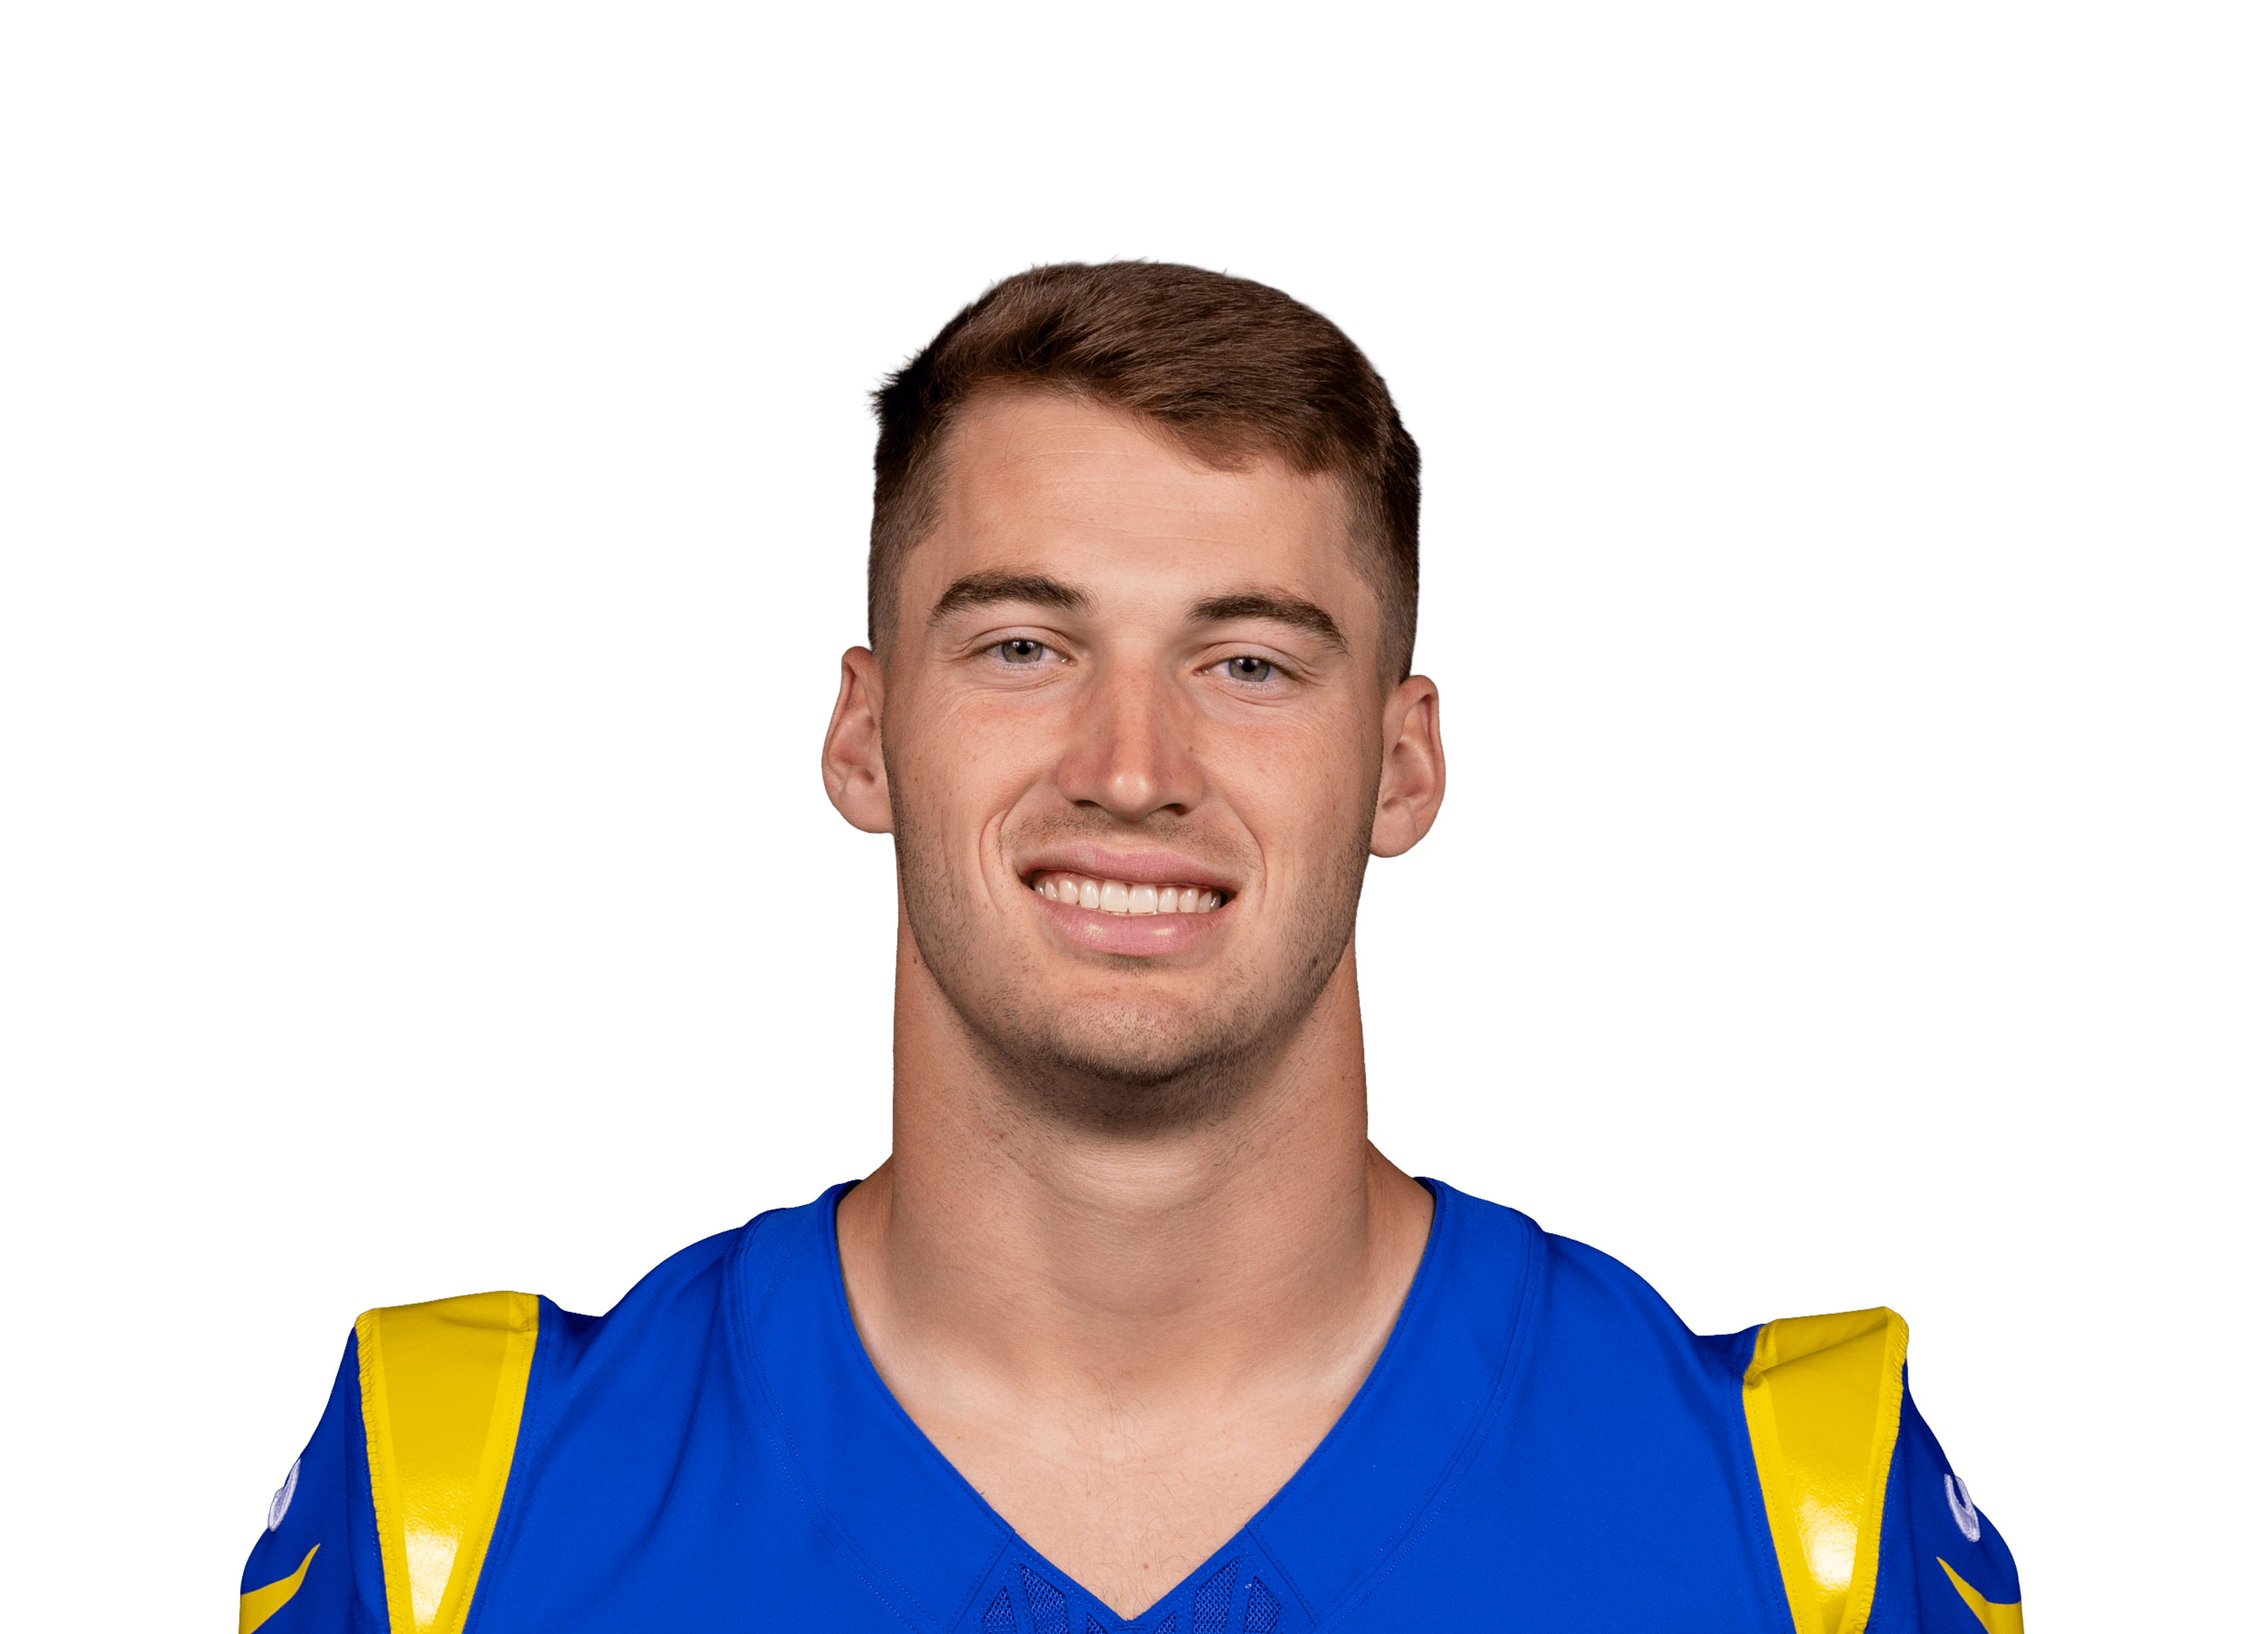 Davis Allen@ LA • Wk 1 | 2.3 | 1 | 1 | 13 | 0 | 0 |
 Charlie Woerner@ ATL • Wk 7 | 2.2 | 1 | 1 | 9 | 0 | 3 |
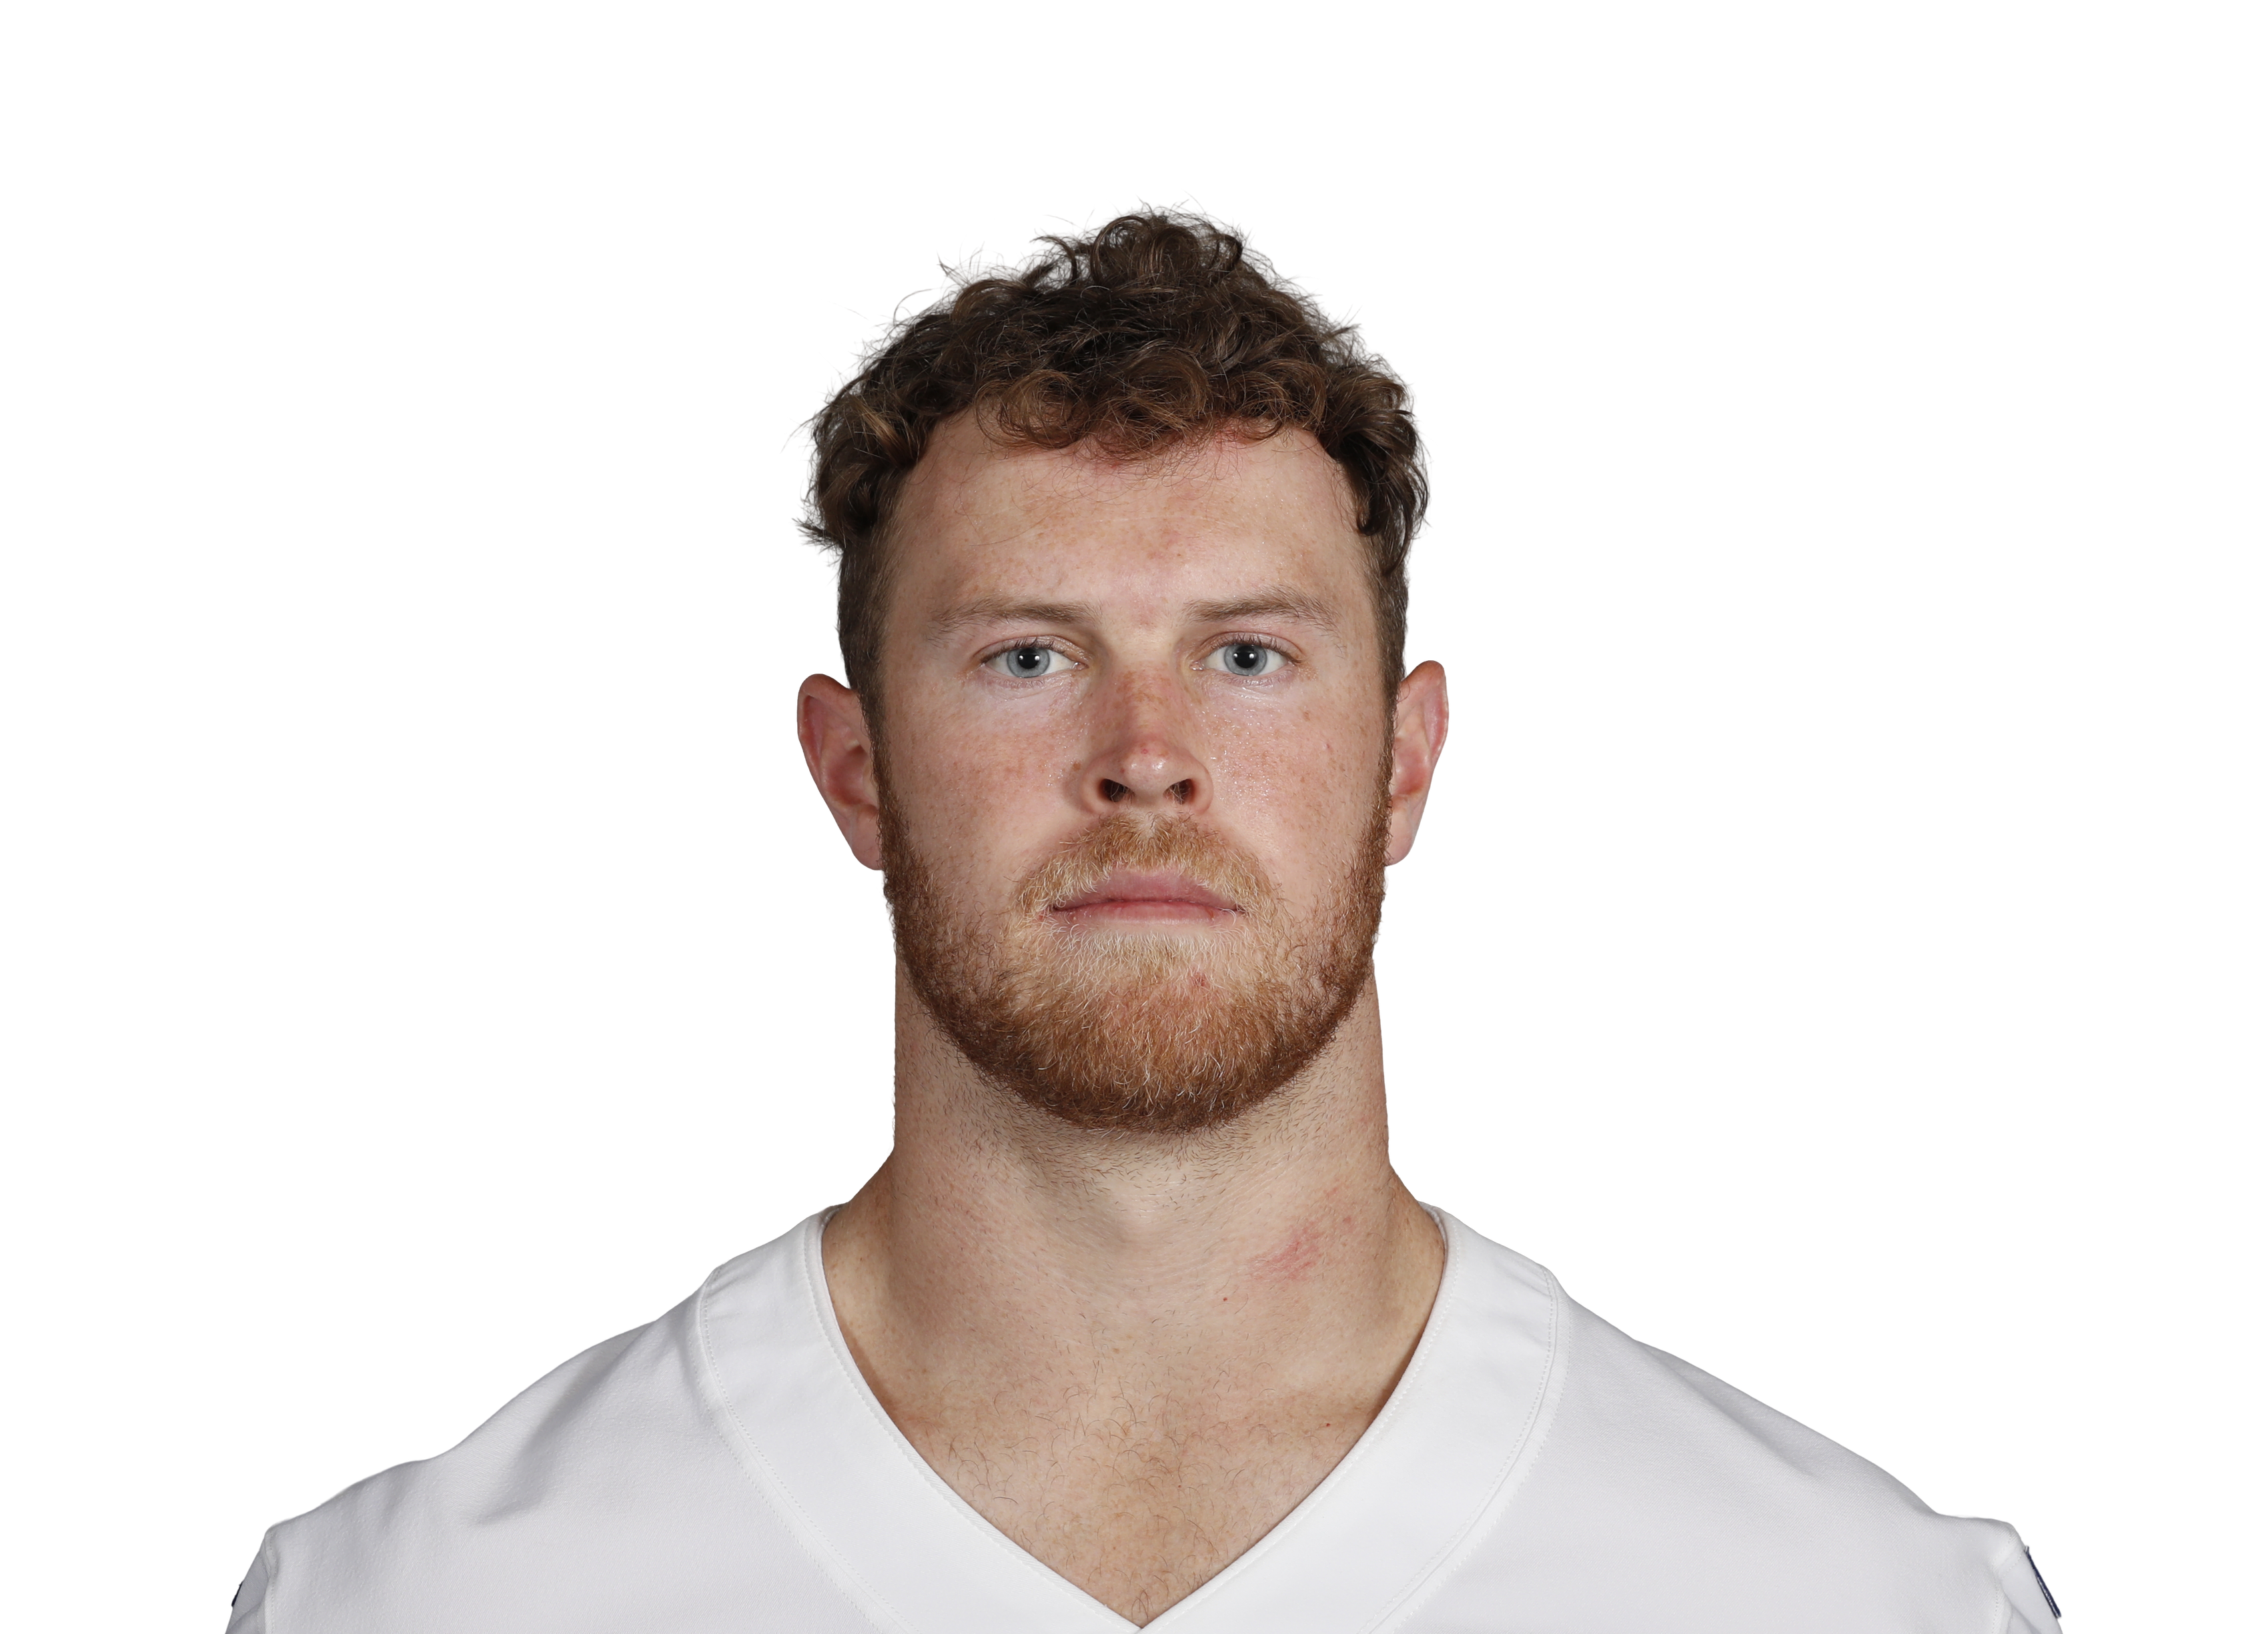 Luke Schoonmaker@ DAL • Wk 10 | 2.2 | 2 | 1 | 12 | 0 | 0 |
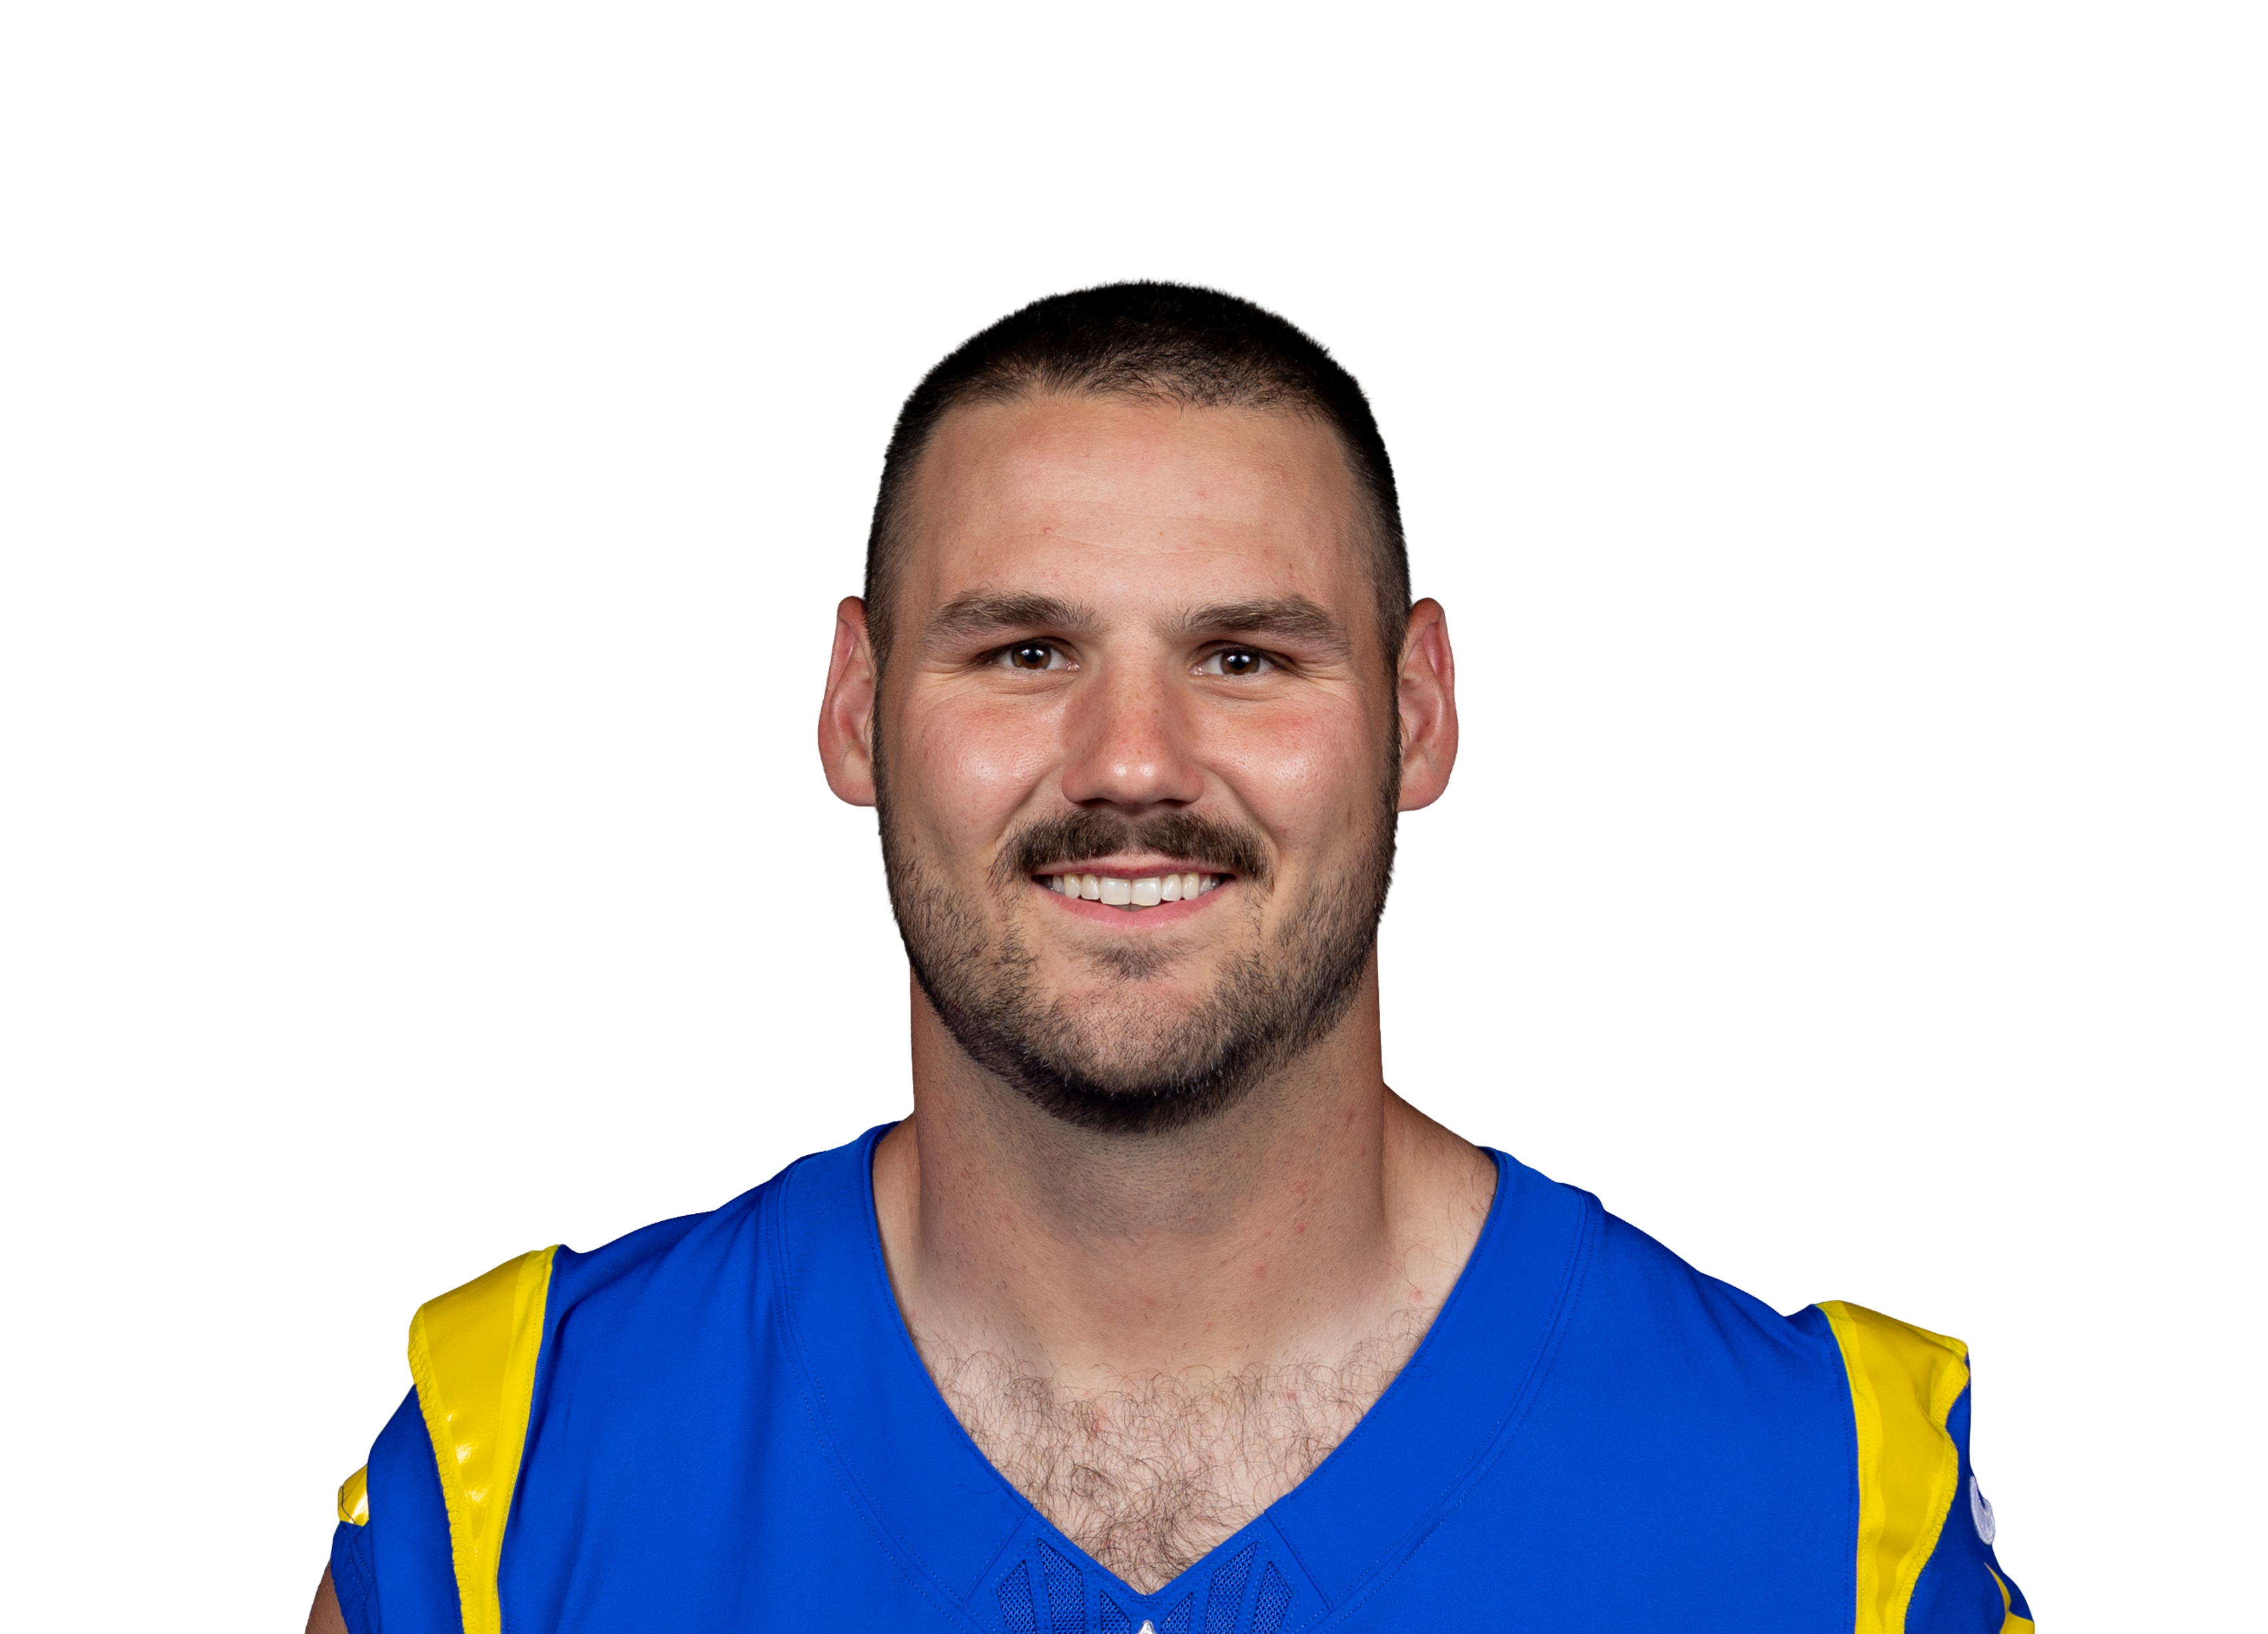 Colby Parkinson@ LA • Wk 1 | 1.6 | 2 | 1 | 6 | 0 | 0 |
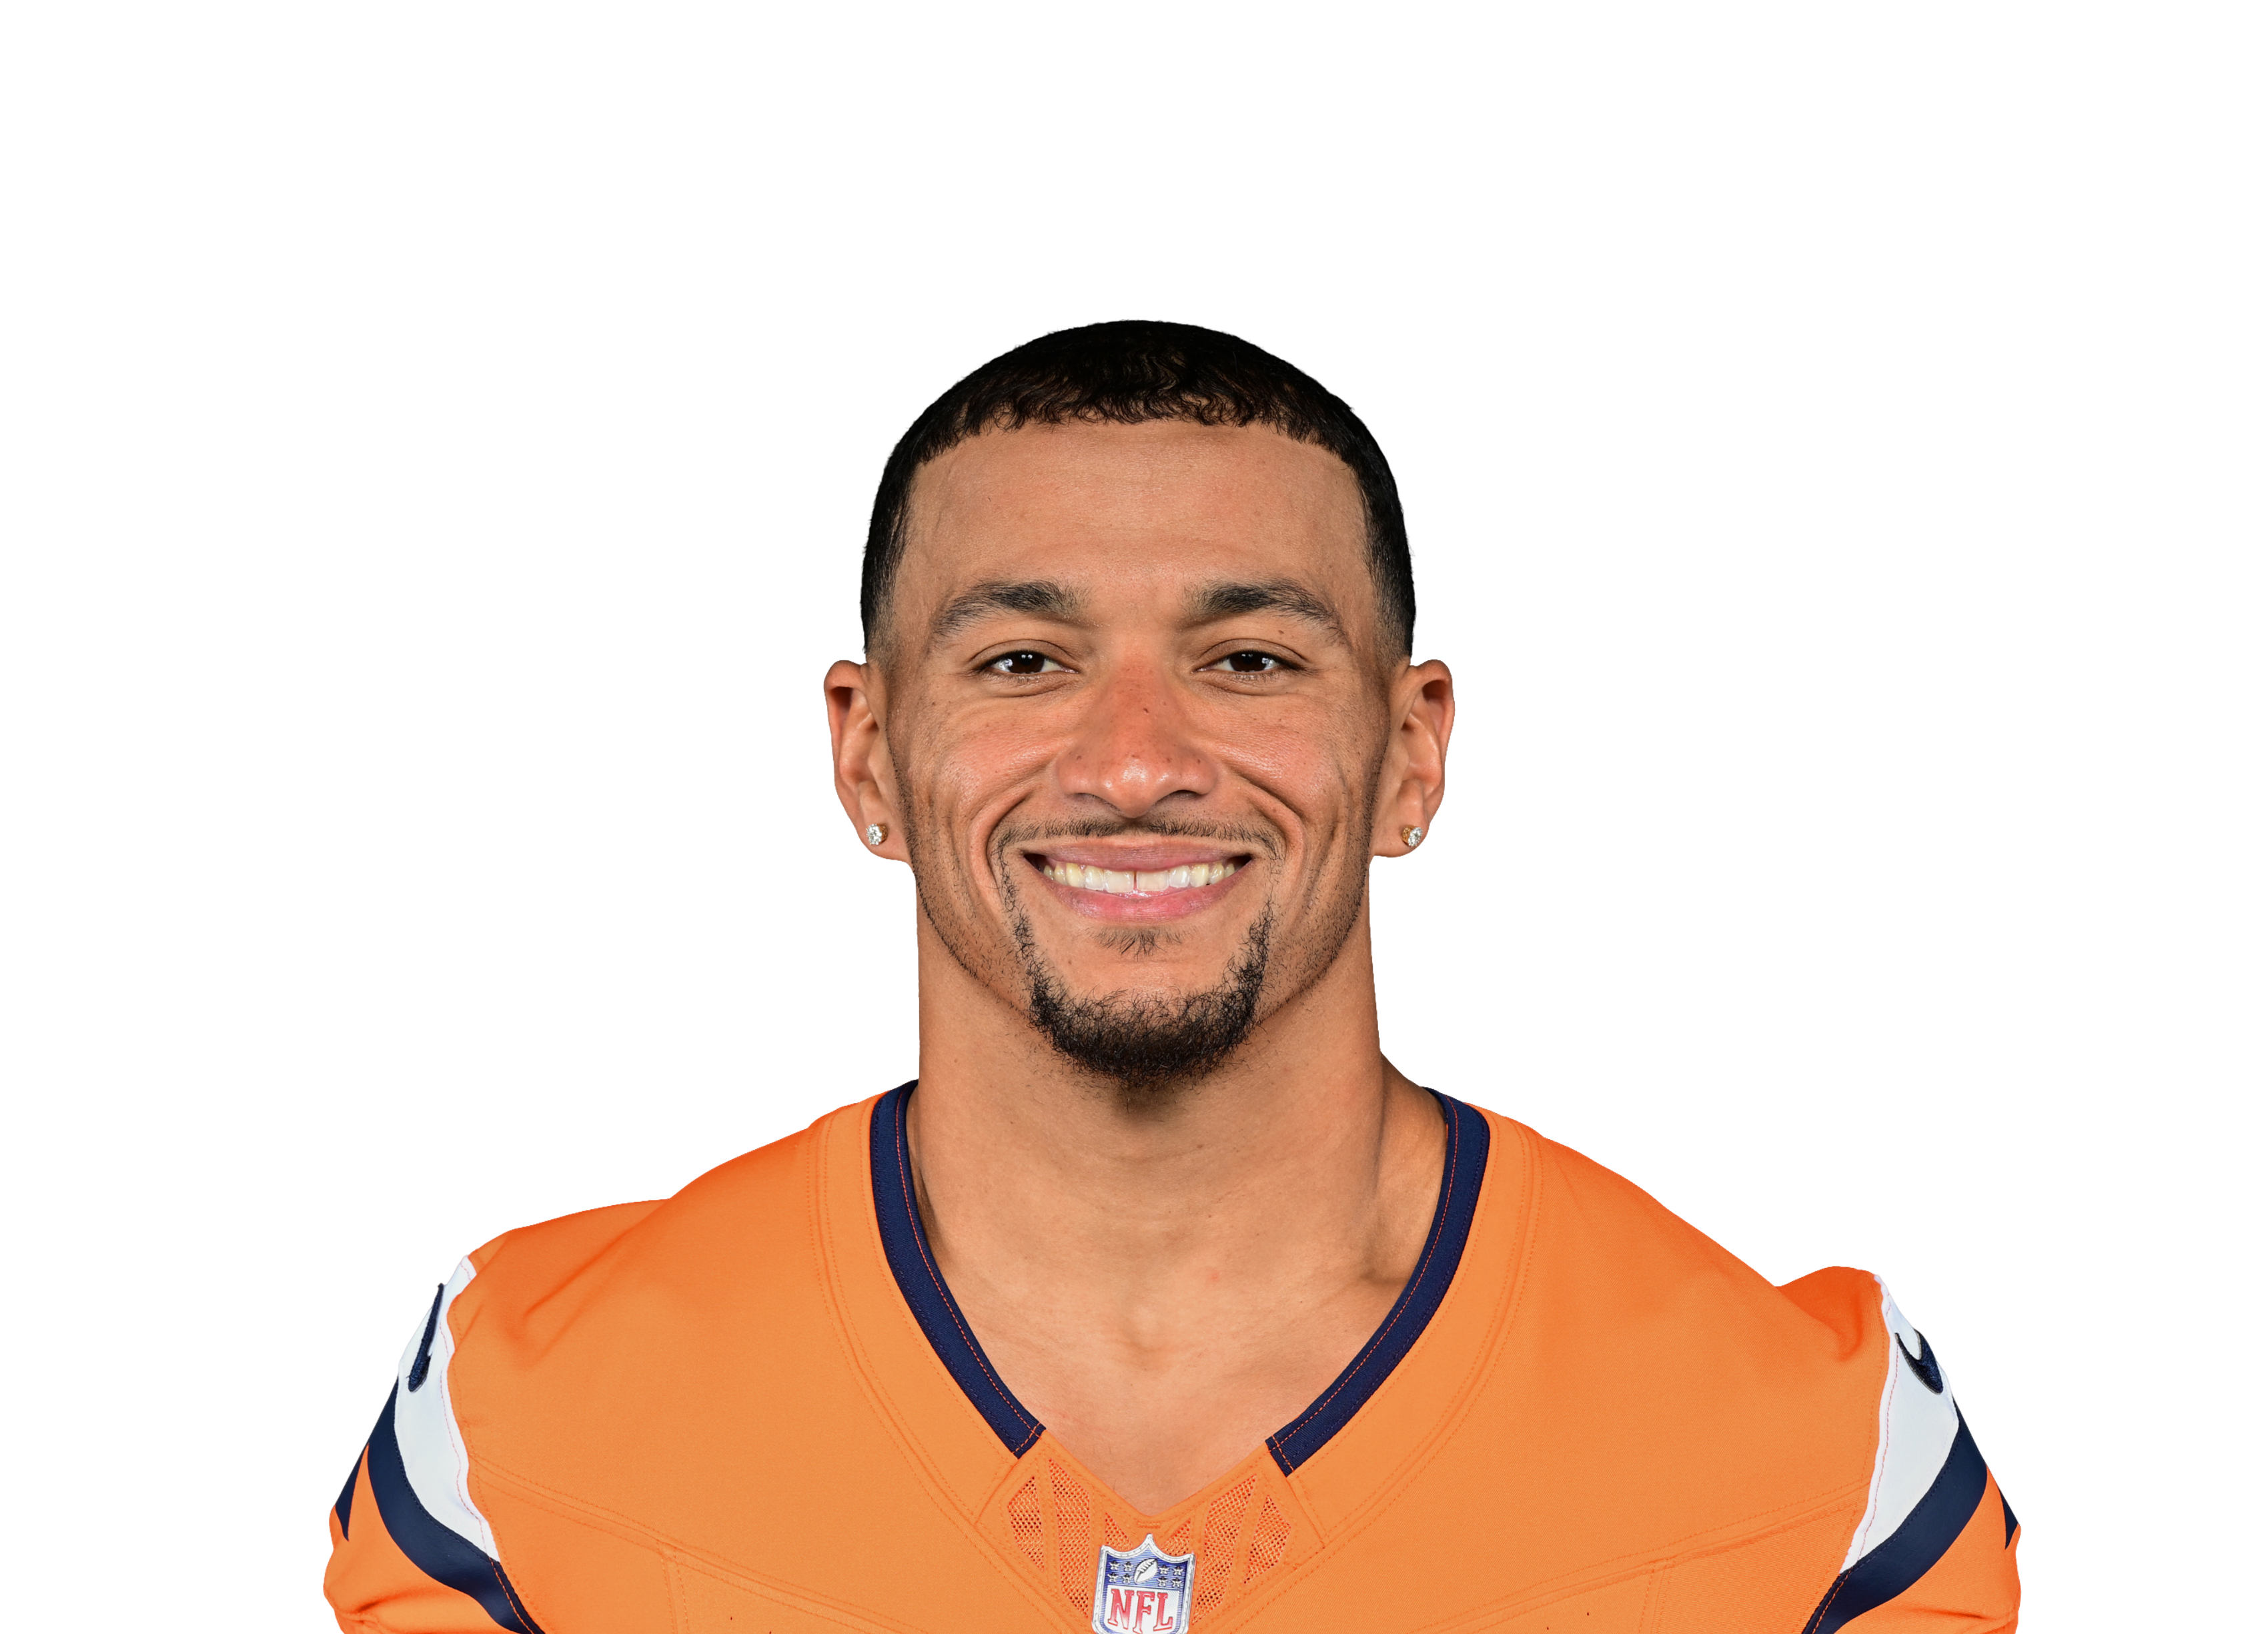 Evan Engramvs DEN • Wk 4 | 1.6 | 5 | 1 | 6 | 0 | 0 |
 Hunter Longvs ARI • Wk 3 | 1.5 | 1 | 1 | 5 | 0 | 0 |
 Will Kacmarekvs MIA • Wk 2 | 1.4 | 1 | 1 | 4 | 0 | 0 |
 John Batesvs WAS • Wk 6 | 1.4 | 1 | 1 | 4 | 0 | 0 |
 Tyler Higbee@ LA • Wk 1 | 1.2 | 2 | 2 | 12 | 0 | 0 |
 Terrance Ferguson@ LA • Wk 1 | 0.0 | 1 | 0 | 0 | 0 | 0 |
 Adam Trautmanvs DEN • Wk 4 | 0.0 | 1 | 0 | 0 | 0 | 0 |
 Elijah Arroyo@ SEA • Wk 5 | 0.0 | 1 | 0 | 0 | 0 | 0 |
Fantasy points first, then the stats that matter for his position. Ring around each photo is that player's Mania Rating. Tap a name to open his profile.
| Player | W1 | W2 | W3 | W4 | W5 | W7 | W8 | W9 | W10 | Per game |
|---|---|---|---|---|---|---|---|---|---|---|
| T.J. Hockenson | 536 yds22% targets66% snaps | 429 yds21% targets69% snaps | 411 yds16% targets85% snaps | 13119 yds39% targets83% snaps | 17 yds3% targets3% snaps | 535 yds21% targets76% snaps | 558 yds18% targets83% snaps | 733 yds23% targets81% snaps | — | 5.541 yds a game • 7.5 per target20% targets68% snaps |
| Gavin Bartholomew | — | — | — | 14 yds3% targets22% snaps | 633 yds21% targets62% snaps | 117 yds4% targets12% snaps | — | — | 436 yds13% targets77% snaps | 3.023 yds a game • 7.5 per target10% targets43% snaps |
| Josh Oliver | 422 yds17% targets65% snaps | 124 yds5% targets60% snaps | 00 yds0% targets41% snaps | — | — | — | — | — | — | 1.715 yds a game • 9.2 per target8% targets55% snaps |
| Ben Yurosek | — | — | — | — | 110 yds3% targets55% snaps | — | 224 yds7% targets43% snaps | 00 yds0% targets21% snaps | 17 yds3% targets58% snaps | 1.010 yds a game • 10.3 per target3% targets44% snaps |
| Use | Game | Proj | PPR | Tgt | Rec | Rec Yd | Car | Rush Yd | TD | Snap |
|---|---|---|---|---|---|---|---|---|---|---|
W1 vs GB | 3.9 | 4.2 | 4 | 2 | 22 | 0 | 0 | 0 | 65% | |
W2 vs CHI | 5.4 | 3.4 | 1 | 1 | 24 | 0 | 0 | 0 | 60% | |
W3 vs TB | 4.7 | 0 | 0 | 0 | 0 | 0 | 0 | 0 | 41% |
Too few plays to rank yet (needs 35 targets, he has 5). Here are his raw numbers so far.

Josh Oliver
Pick a teammate with or without. Pick more than one to combine them, like a game without the QB and without the other back.
Injured reserve • no Week 11 Rating1 teammate note ▾
| Player | W1 | W2 | W3 | W4 | W5 | W7 | W8 | W9 | W10 | Per game |
|---|---|---|---|---|---|---|---|---|---|---|
| T.J. Hockenson | 536 yds22% targets66% snaps | 429 yds21% targets69% snaps | 411 yds16% targets85% snaps | 13119 yds39% targets83% snaps | 17 yds3% targets3% snaps | 535 yds21% targets76% snaps | 558 yds18% targets83% snaps | 733 yds23% targets81% snaps | — | 5.541 yds a game • 7.5 per target20% targets68% snaps |
| Gavin Bartholomew | — | — | — | 14 yds3% targets22% snaps | 633 yds21% targets62% snaps | 117 yds4% targets12% snaps | — | — | 436 yds13% targets77% snaps | 3.023 yds a game • 7.5 per target10% targets43% snaps |
| Josh Oliver | 422 yds17% targets65% snaps | 124 yds5% targets60% snaps | 00 yds0% targets41% snaps | — | — | — | — | — | — | 1.715 yds a game • 9.2 per target8% targets55% snaps |
| Ben Yurosek | — | — | — | — | 110 yds3% targets55% snaps | — | 224 yds7% targets43% snaps | 00 yds0% targets21% snaps | 17 yds3% targets58% snaps | 1.010 yds a game • 10.3 per target3% targets44% snaps |
| Use | Game | Proj | PPR | Tgt | Rec | Rec Yd | Car | Rush Yd | TD | Snap |
|---|---|---|---|---|---|---|---|---|---|---|
| W1vs GB | 3.9 | 4.2 | 4 | 2 | 22 | 0 | 0 | 0 | 65% | |
| W2vs CHI | 5.4 | 3.4 | 1 | 1 | 24 | 0 | 0 | 0 | 60% | |
| W3vs TB | 4.7 | 0 | 0 | 0 | 0 | 0 | 0 | 0 | 41% |
Too few plays to rank yet (needs 35 targets, he has 5). Here are his raw numbers so far.
12.8 PPR points a game allowed to tight ends, 18th most of 32 defenses.
| Player | PPR | Tgt | Rec | Rec Yd | Rec TD | Rush Yd |
|---|---|---|---|---|---|---|
| Brock Bowersvs LV • Wk 9 | 22.3 | 8 | 7 | 111 | 1 | 2 |
| Trey McBridevs ARI • Wk 3 | 16.5 | 11 | 9 | 75 | 0 | 0 |
| Chig Okonkwovs WAS • Wk 6 | 13.9 | 7 | 7 | 69 | 0 | 0 |
| Kyle Pitts@ ATL • Wk 7 | 13.2 | 5 | 5 | 22 | 1 | 0 |
| Nick Muse@ ATL • Wk 7 | 8.2 | 2 | 2 | 2 | 1 | 0 |
| Elijah Higginsvs ARI • Wk 3 | 5.0 | 3 | 3 | 20 | 0 | 0 |
| AJ Barner@ SEA • Wk 5 | 5.0 | 5 | 3 | 20 | 0 | 0 |
| Michael Mayervs LV • Wk 9 | 4.7 | 3 | 3 | 37 | 0 | 0 |
| Austin Hooper@ ATL • Wk 7 | 4.1 | 2 | 2 | 21 | 0 | 0 |
| Greg Dulcichvs MIA • Wk 2 | 3.7 | 3 | 2 | 17 | 0 | 0 |
| Brevyn Spann-Ford@ DAL • Wk 10 | 3.6 | 3 | 1 | 26 | 0 | 0 |
| Davis Allen@ LA • Wk 1 | 2.3 | 1 | 1 | 13 | 0 | 0 |
| Charlie Woerner@ ATL • Wk 7 | 2.2 | 1 | 1 | 9 | 0 | 3 |
| Luke Schoonmaker@ DAL • Wk 10 | 2.2 | 2 | 1 | 12 | 0 | 0 |
| Colby Parkinson@ LA • Wk 1 | 1.6 | 2 | 1 | 6 | 0 | 0 |
| Evan Engramvs DEN • Wk 4 | 1.6 | 5 | 1 | 6 | 0 | 0 |
| Hunter Longvs ARI • Wk 3 | 1.5 | 1 | 1 | 5 | 0 | 0 |
| Will Kacmarekvs MIA • Wk 2 | 1.4 | 1 | 1 | 4 | 0 | 0 |
| John Batesvs WAS • Wk 6 | 1.4 | 1 | 1 | 4 | 0 | 0 |
| Tyler Higbee@ LA • Wk 1 | 1.2 | 2 | 2 | 12 | 0 | 0 |
| Terrance Ferguson@ LA • Wk 1 | 0.0 | 1 | 0 | 0 | 0 | 0 |
| Adam Trautmanvs DEN • Wk 4 | 0.0 | 1 | 0 | 0 | 0 | 0 |
| Elijah Arroyo@ SEA • Wk 5 | 0.0 | 1 | 0 | 0 | 0 | 0 |
Fantasy points first, then the stats that matter for his position. Ring around each photo is that player's Mania Rating. Tap a name to open his profile.