
38.2MANIA OVERALL
MANIA RATING • DEPTH
Payne Durham
 TB • TE • 3 games
#478 OverallTE100#2 TE on TBDepth TE2 ›Age 26
38.1WEEK 11 RATINGStart value vs DET
0.8WEEK 11 PROJECTIONPPR
3%TARGET SHARE5th percentile
39.7%SNAP SHARE17th percentile
Games counted
Untick or tick any game and Mania Rating, matchup and Week 11 Rating all recalculate. Official Mania Rating 38.2.
Mix and match games
Pick a teammate with or without. Pick more than one to combine them, like a game without the QB and without the other back.
Mayfield QB ✓ current
Daniels QB
Hurst WR
Teammate injuries shift his Week 11 Rating1 teammate note ▾
Baker Mayfield (QB, Questionable) -0.6 • passing game takes a hit
Injury report updated Sat Nov 21, 6:30 AM ET
Week 11 Rating = recent role + opponent + the latest injury report (updated Sat Nov 21, 6:30 AM ET). Check final inactives before you set your lineup.
Mania breakdown
Fantasy Production0
Target Volume3
Team Target Role3
Red-Zone Threat0
Per-Target Efficiency6
Mania breakdown
Percentile among TEs. 100 is the best, 50 is average.
How many fantasy points and total yards he is actually producing, compared with players at his position. Ranks better than 0% of TEs.
How often he is targeted: targets per game, receptions and his share of the team targets. Ranks better than 3% of TEs.
How big a slice of his team passing game belongs to him: target share, air-yard share and snaps. Ranks better than 3% of TEs.
How often the offense uses him near the goal line: red-zone targets and end-zone targets. Ranks better than 0% of TEs.
What he produces with each chance instead of just rewarding volume: yards per target, catch rate and fantasy points per opportunity. Ranks better than 6% of TEs.
Top 30%MiddleBottom 40%Tap a category to see what it means.
Week 11 projection
0.8
projected points
Floor 0.1 · Ceiling 4.3
-0.5Game script
+0.2Matchup
-0.1Injuries
Week 11 projection
TBVSPPR
 DET
Easy matchup • DET is #1 in points allowed to TEs
0.8
projected pointsReceiving 0.6 targets, 0.4 catches, 4 yds • 0.04 TD
Floor 0.14 of 5 games land hereCeiling 4.3
Vegas lines included. From usage alone: 0.7. Sportsbook lines imply 0.9. Blended: 0.8. Right now he is in line with the sportsbooks.
-0.5Game script
+0.2Matchup
-0.1Injuries
How this is built
Recent and last-season usage, the Vegas spread and total, how this defense treats his position, and the injury report (teammates out, QB out). The three boxes show how many points each moved it. When sportsbook player lines are posted (Wednesday to Sunday) they are blended in, leaning on them most for new starters and players with few games. PPR scoring only. Tested on past seasons it is about 5% closer than a plain season average.
Week 11 matchup
vs DET
Good matchup
Adjustment+6.0 pts
Allows to TEs1st most
Week11
Week 11 matchup
vs DET
+2.1Rating boost
Good matchup1st easiest of 32 defenses for TEs
ToughEasy
22.9PPR a game DET allows to TEs
5.3Similar players, usual PPR a game
11.4Same players against DET
Players with a role like his scored 11.4 PPR a game against DET, versus 5.3 in their usual games (+114%). That moves his Week 11 Rating by +2.1.
How tight ends did against DET
22.9 PPR points a game allowed to tight ends, 1st most of 32 defenses.
| Player | PPR | Tgt | Rec | Rec Yd | Rec TD | Rush Yd |
|---|---|---|---|---|---|---|
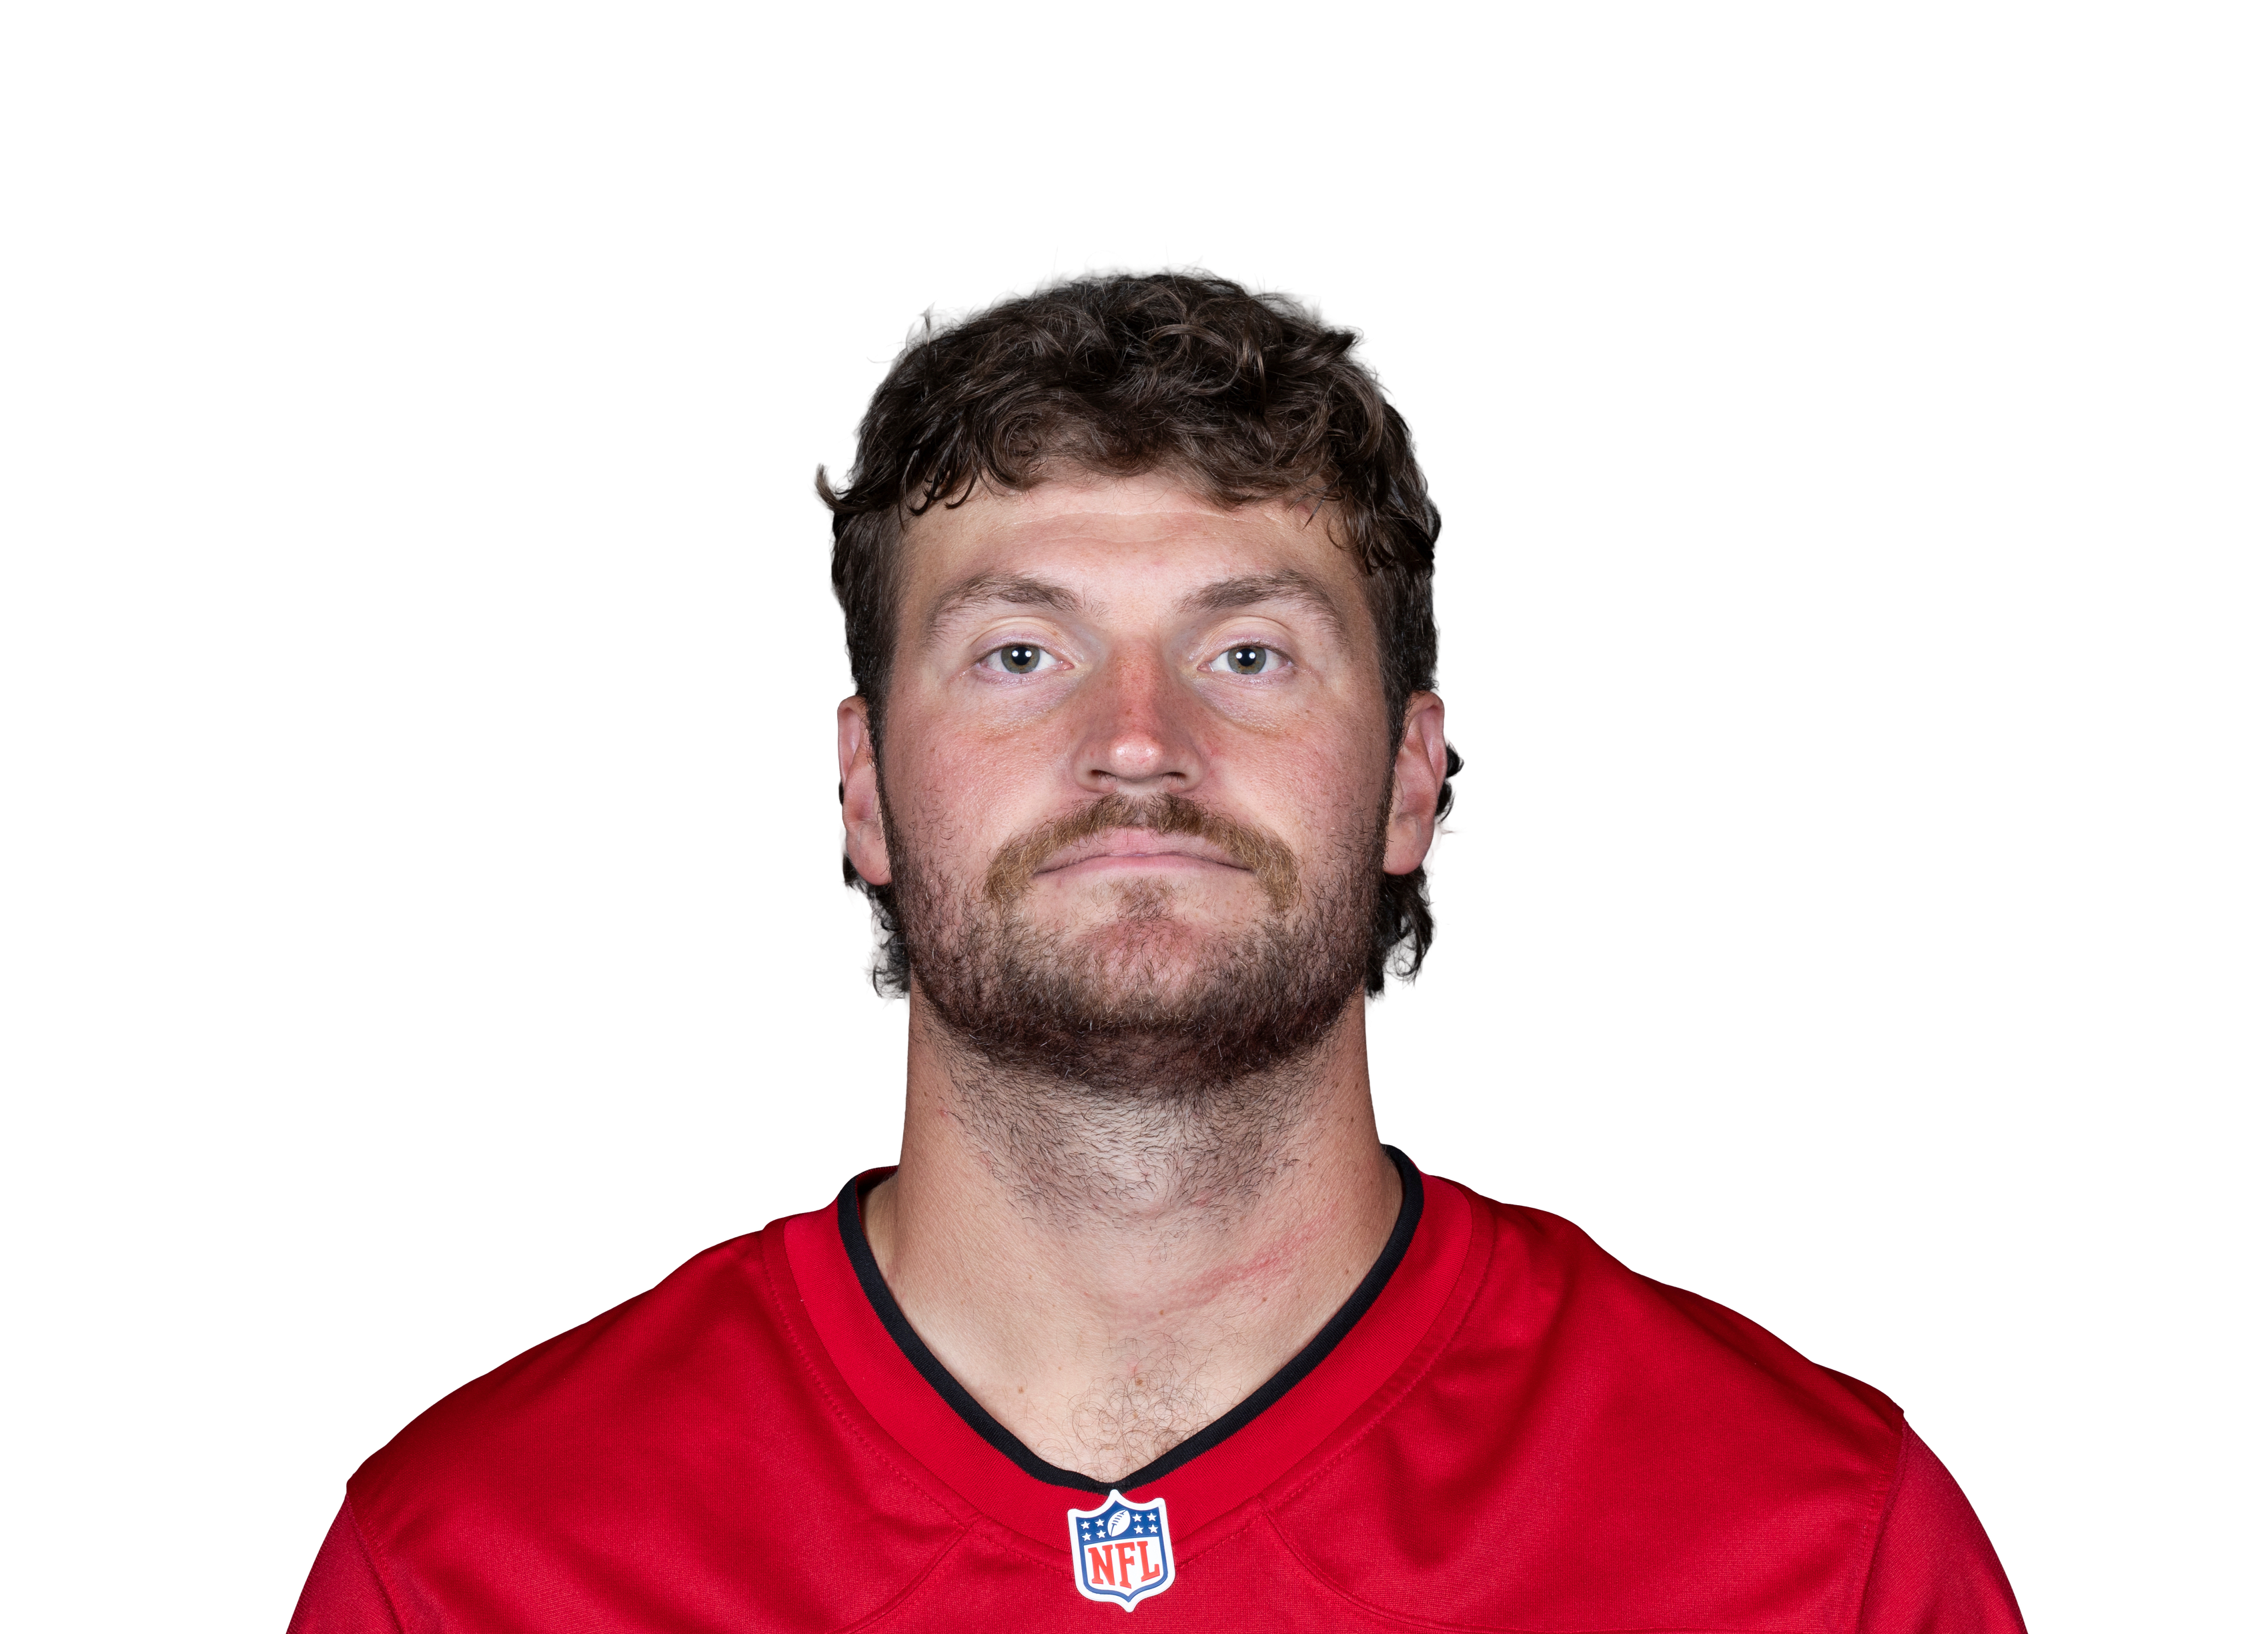
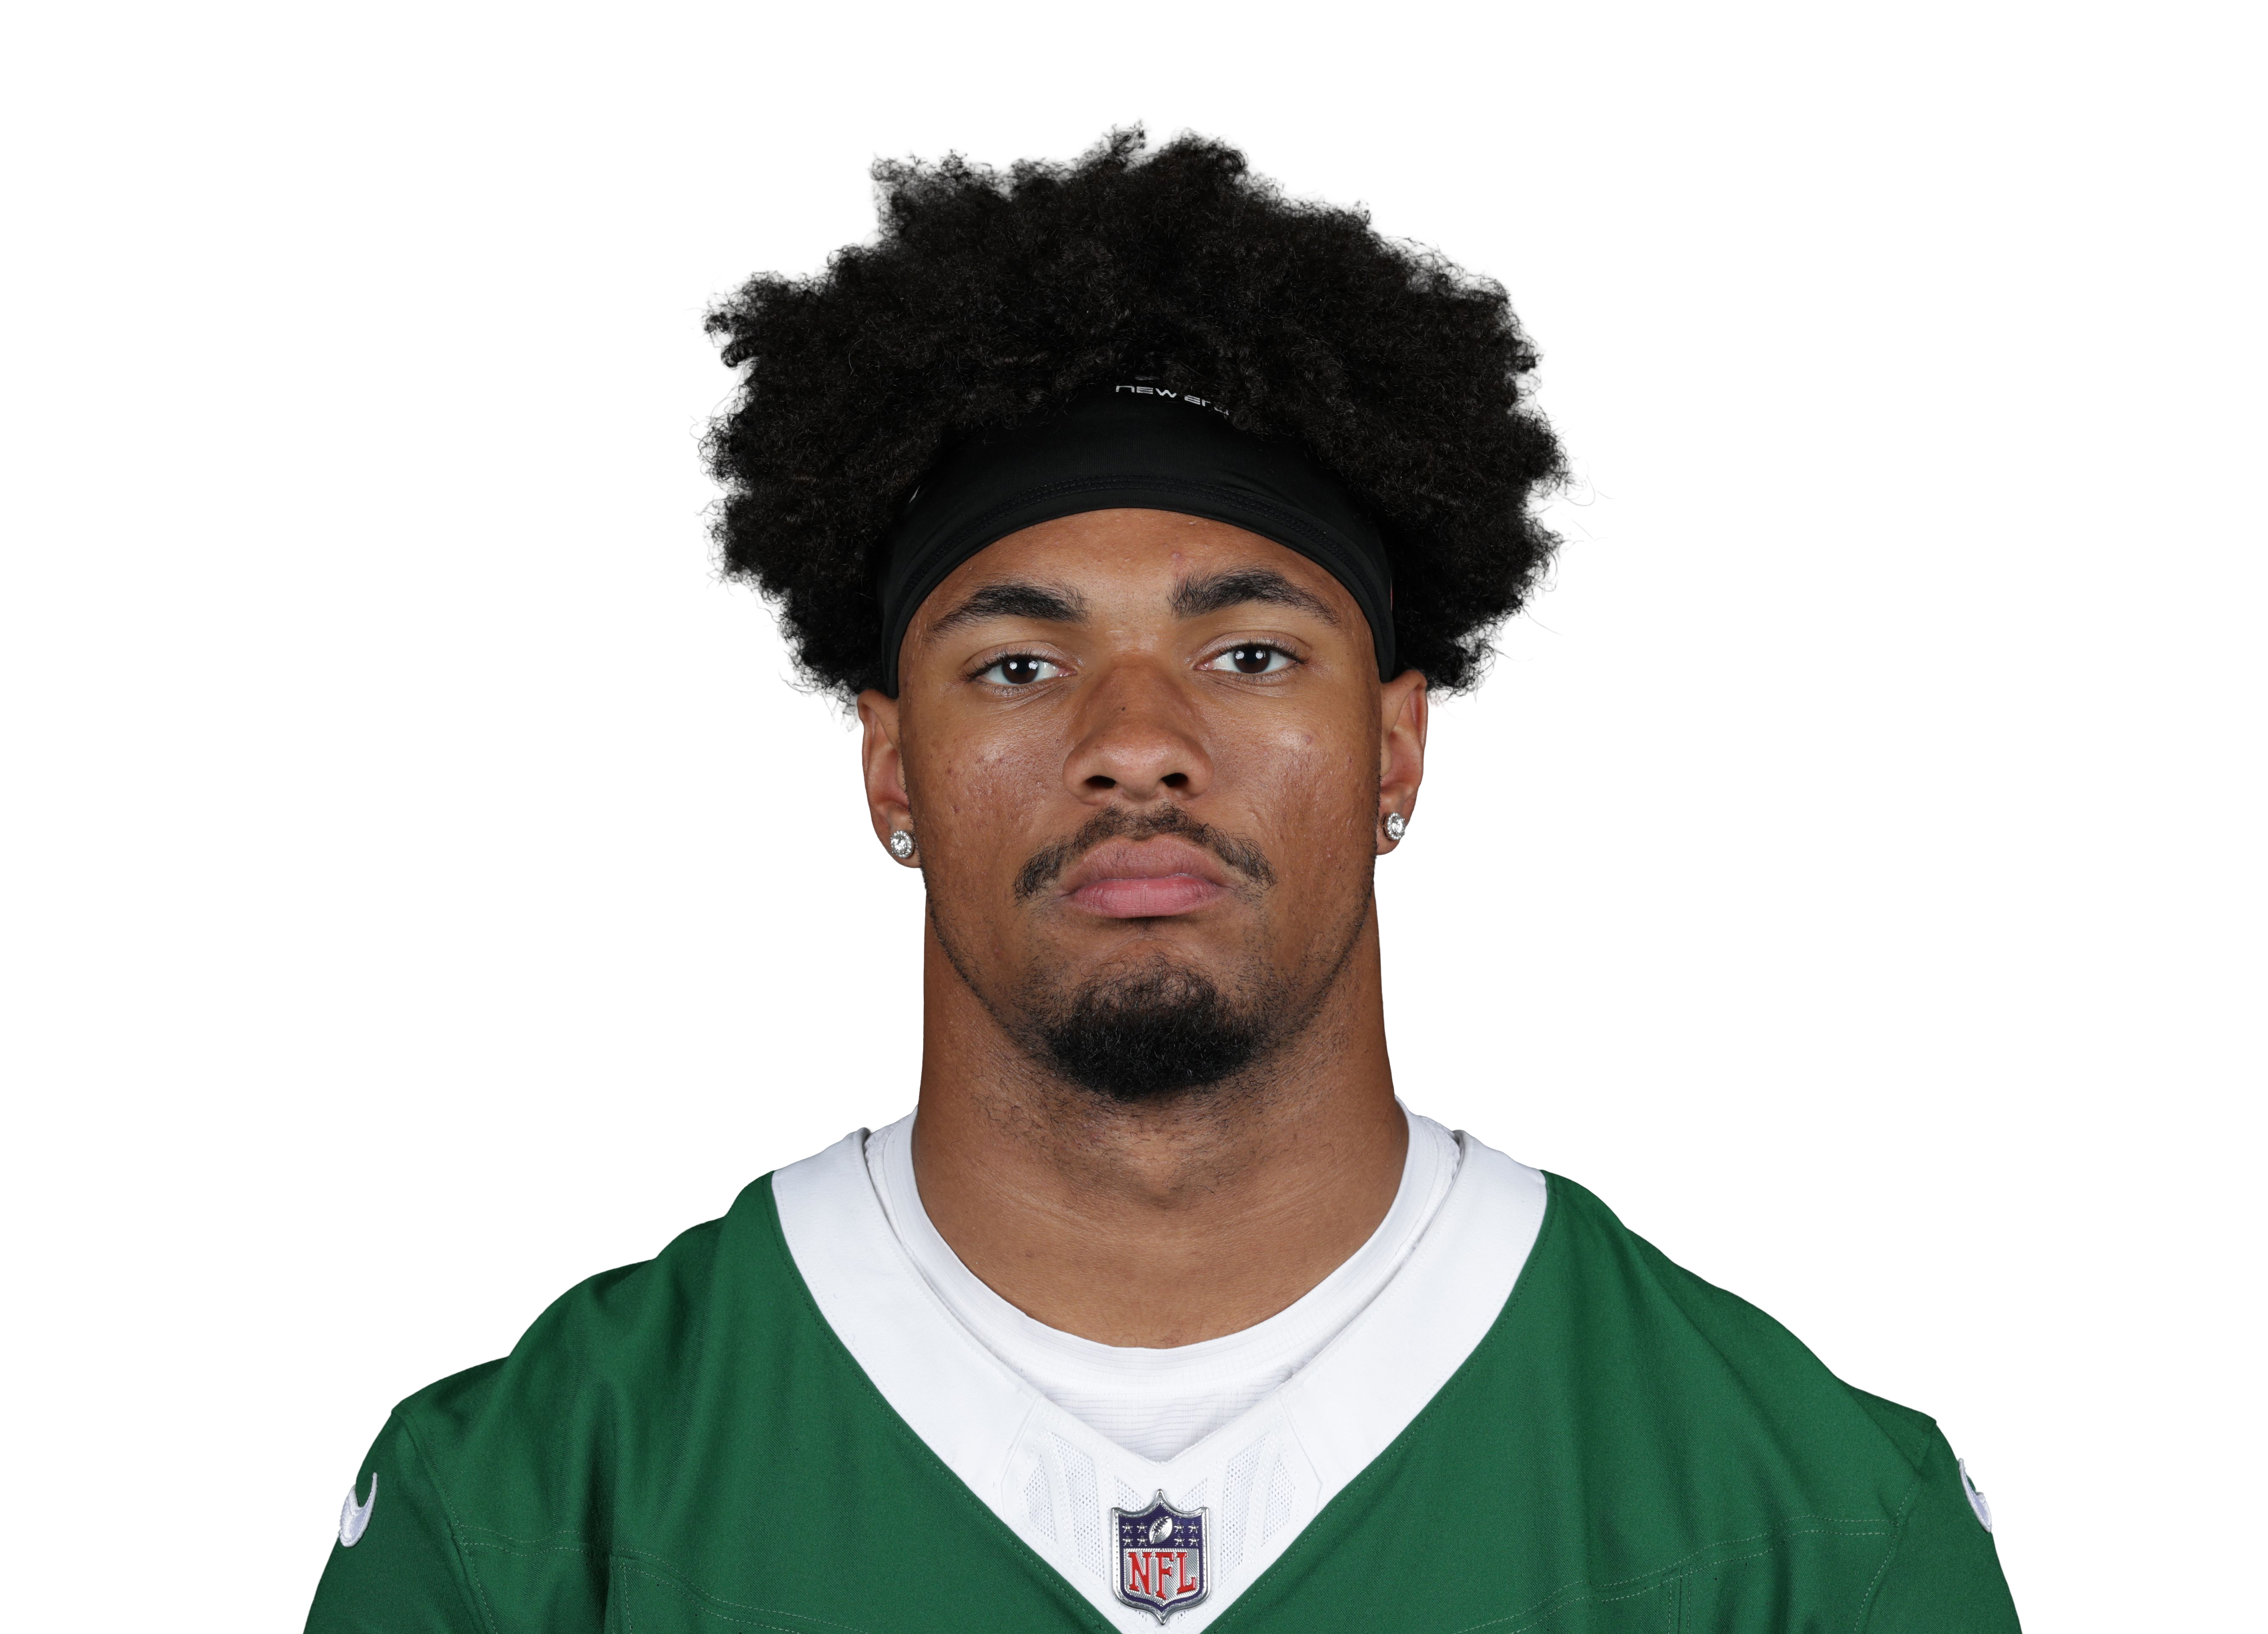 Kenyon Sadiqvs NYJ • Wk 3 | 23.5 | 8 | 7 | 105 | 1 | 0 |
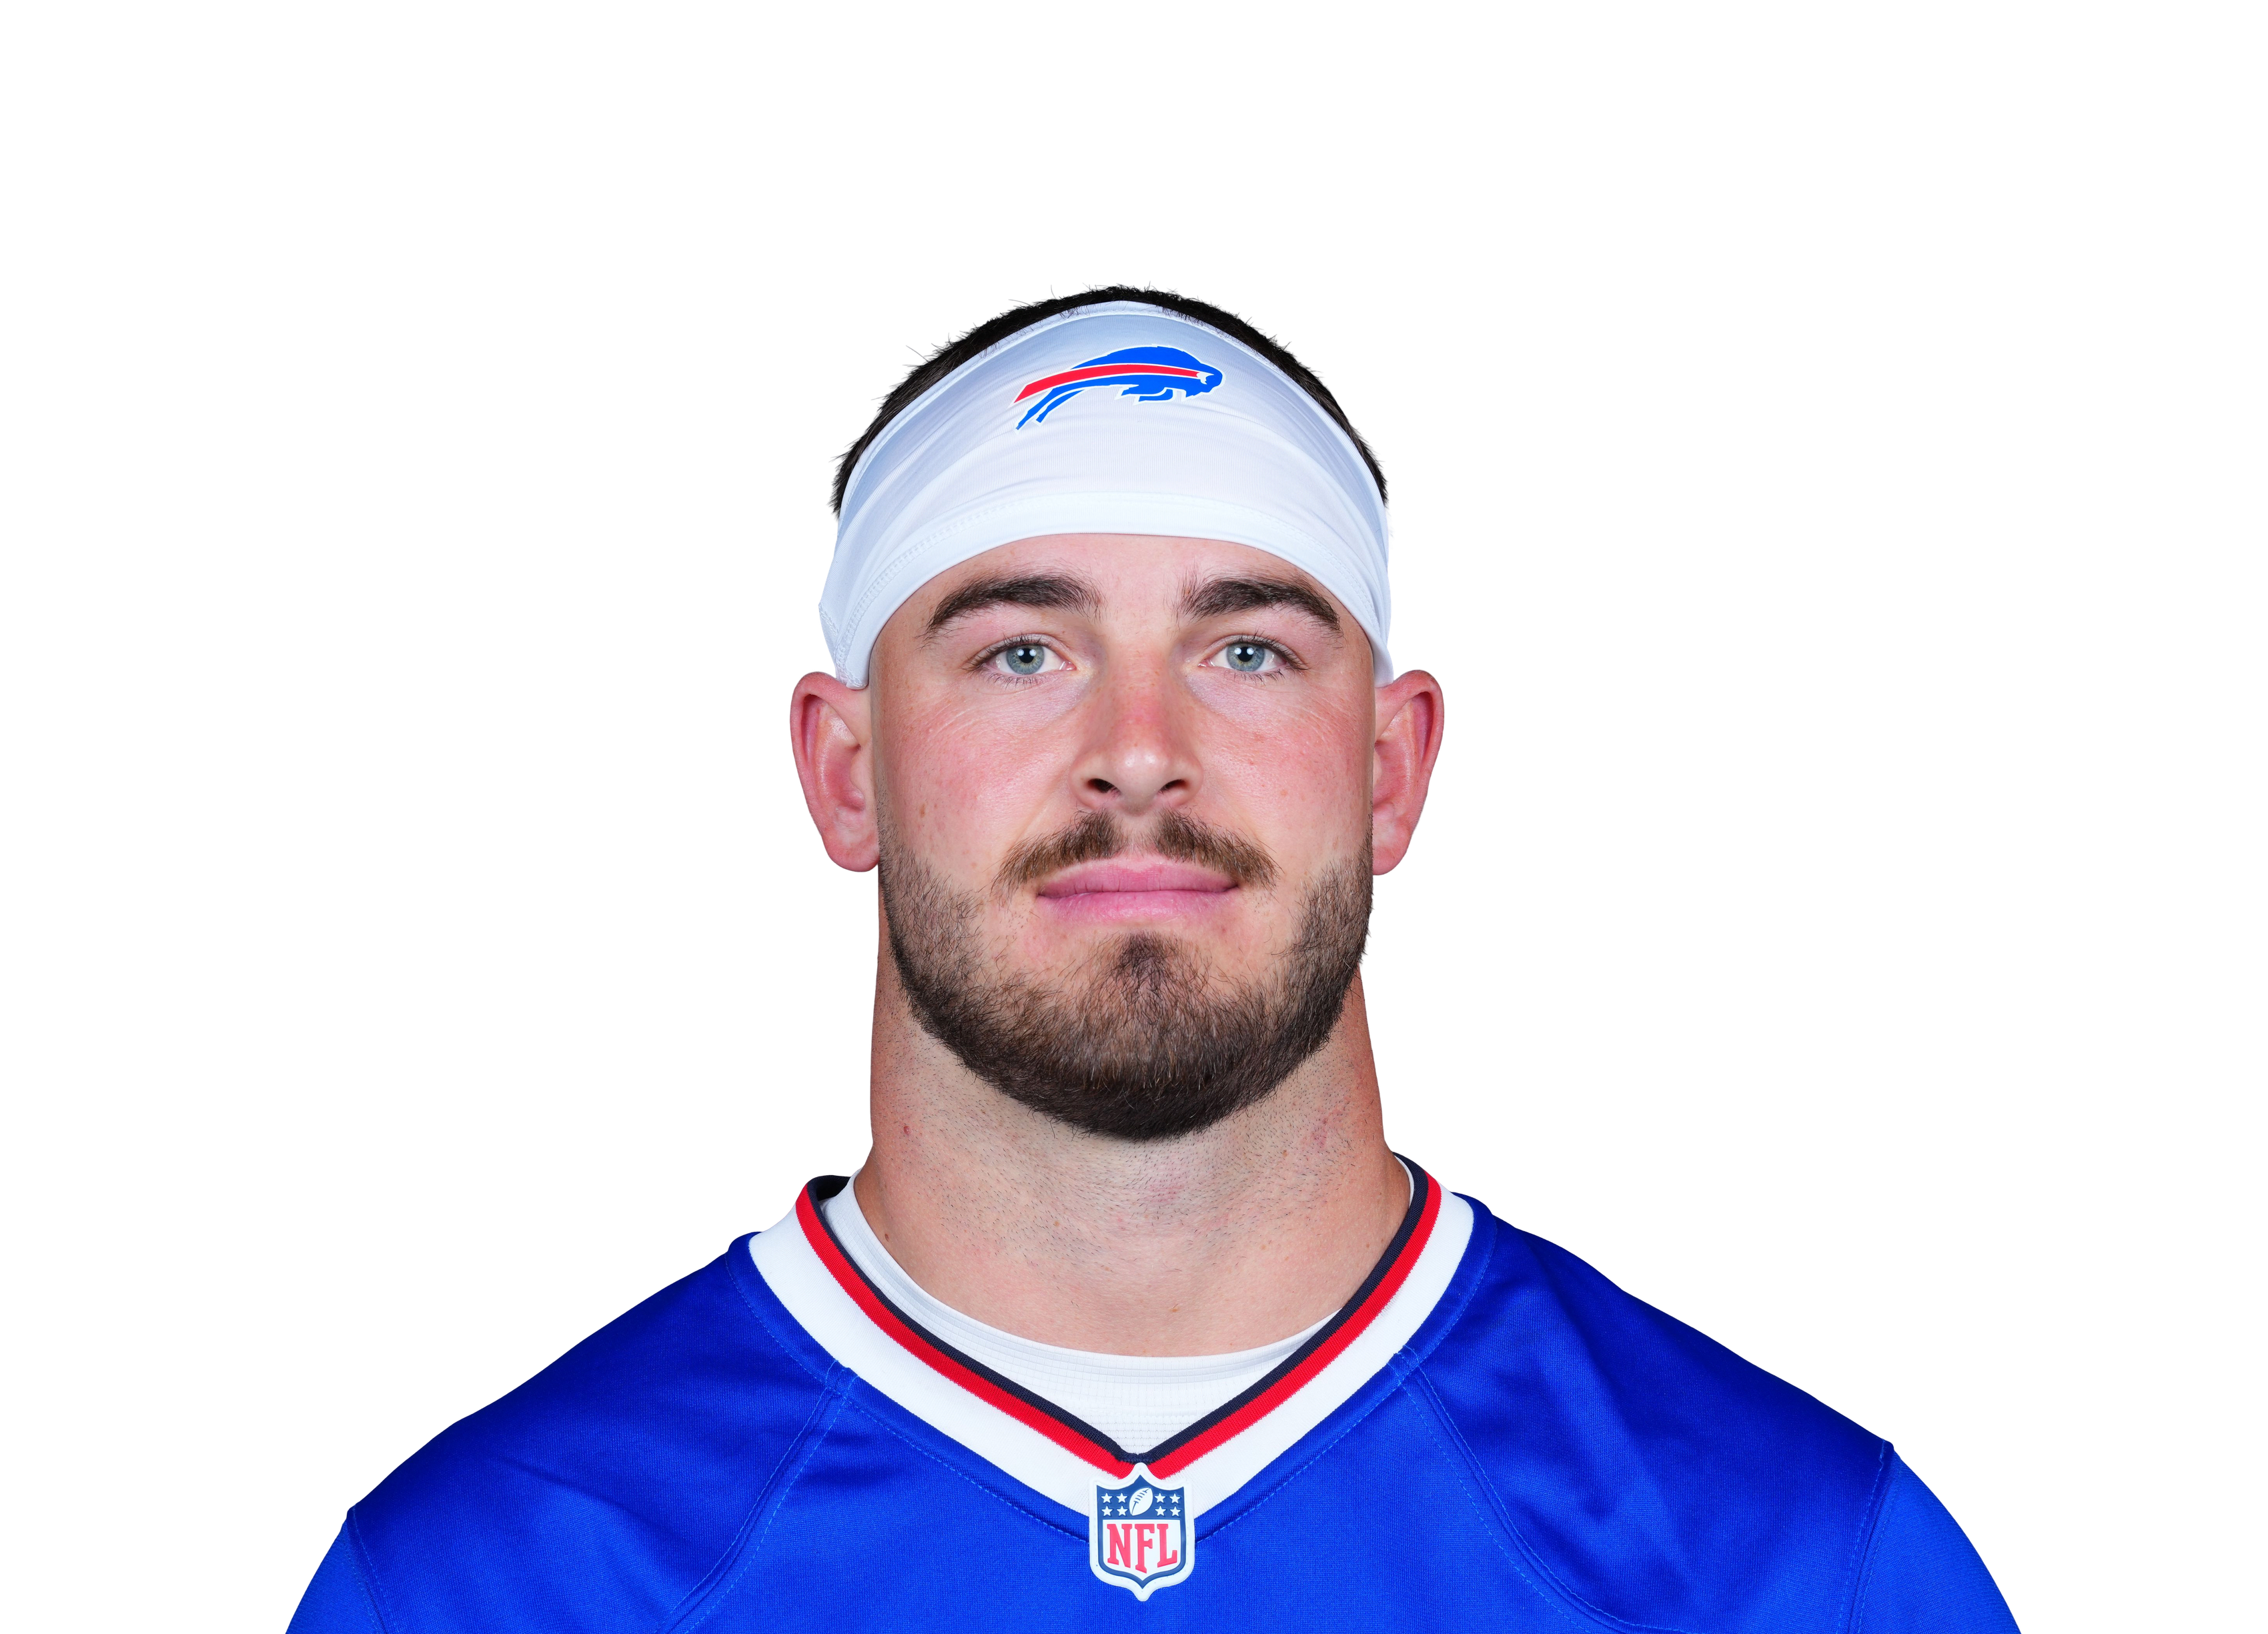 Dalton Kincaid@ BUF • Wk 2 | 22.5 | 8 | 7 | 95 | 1 | 0 |
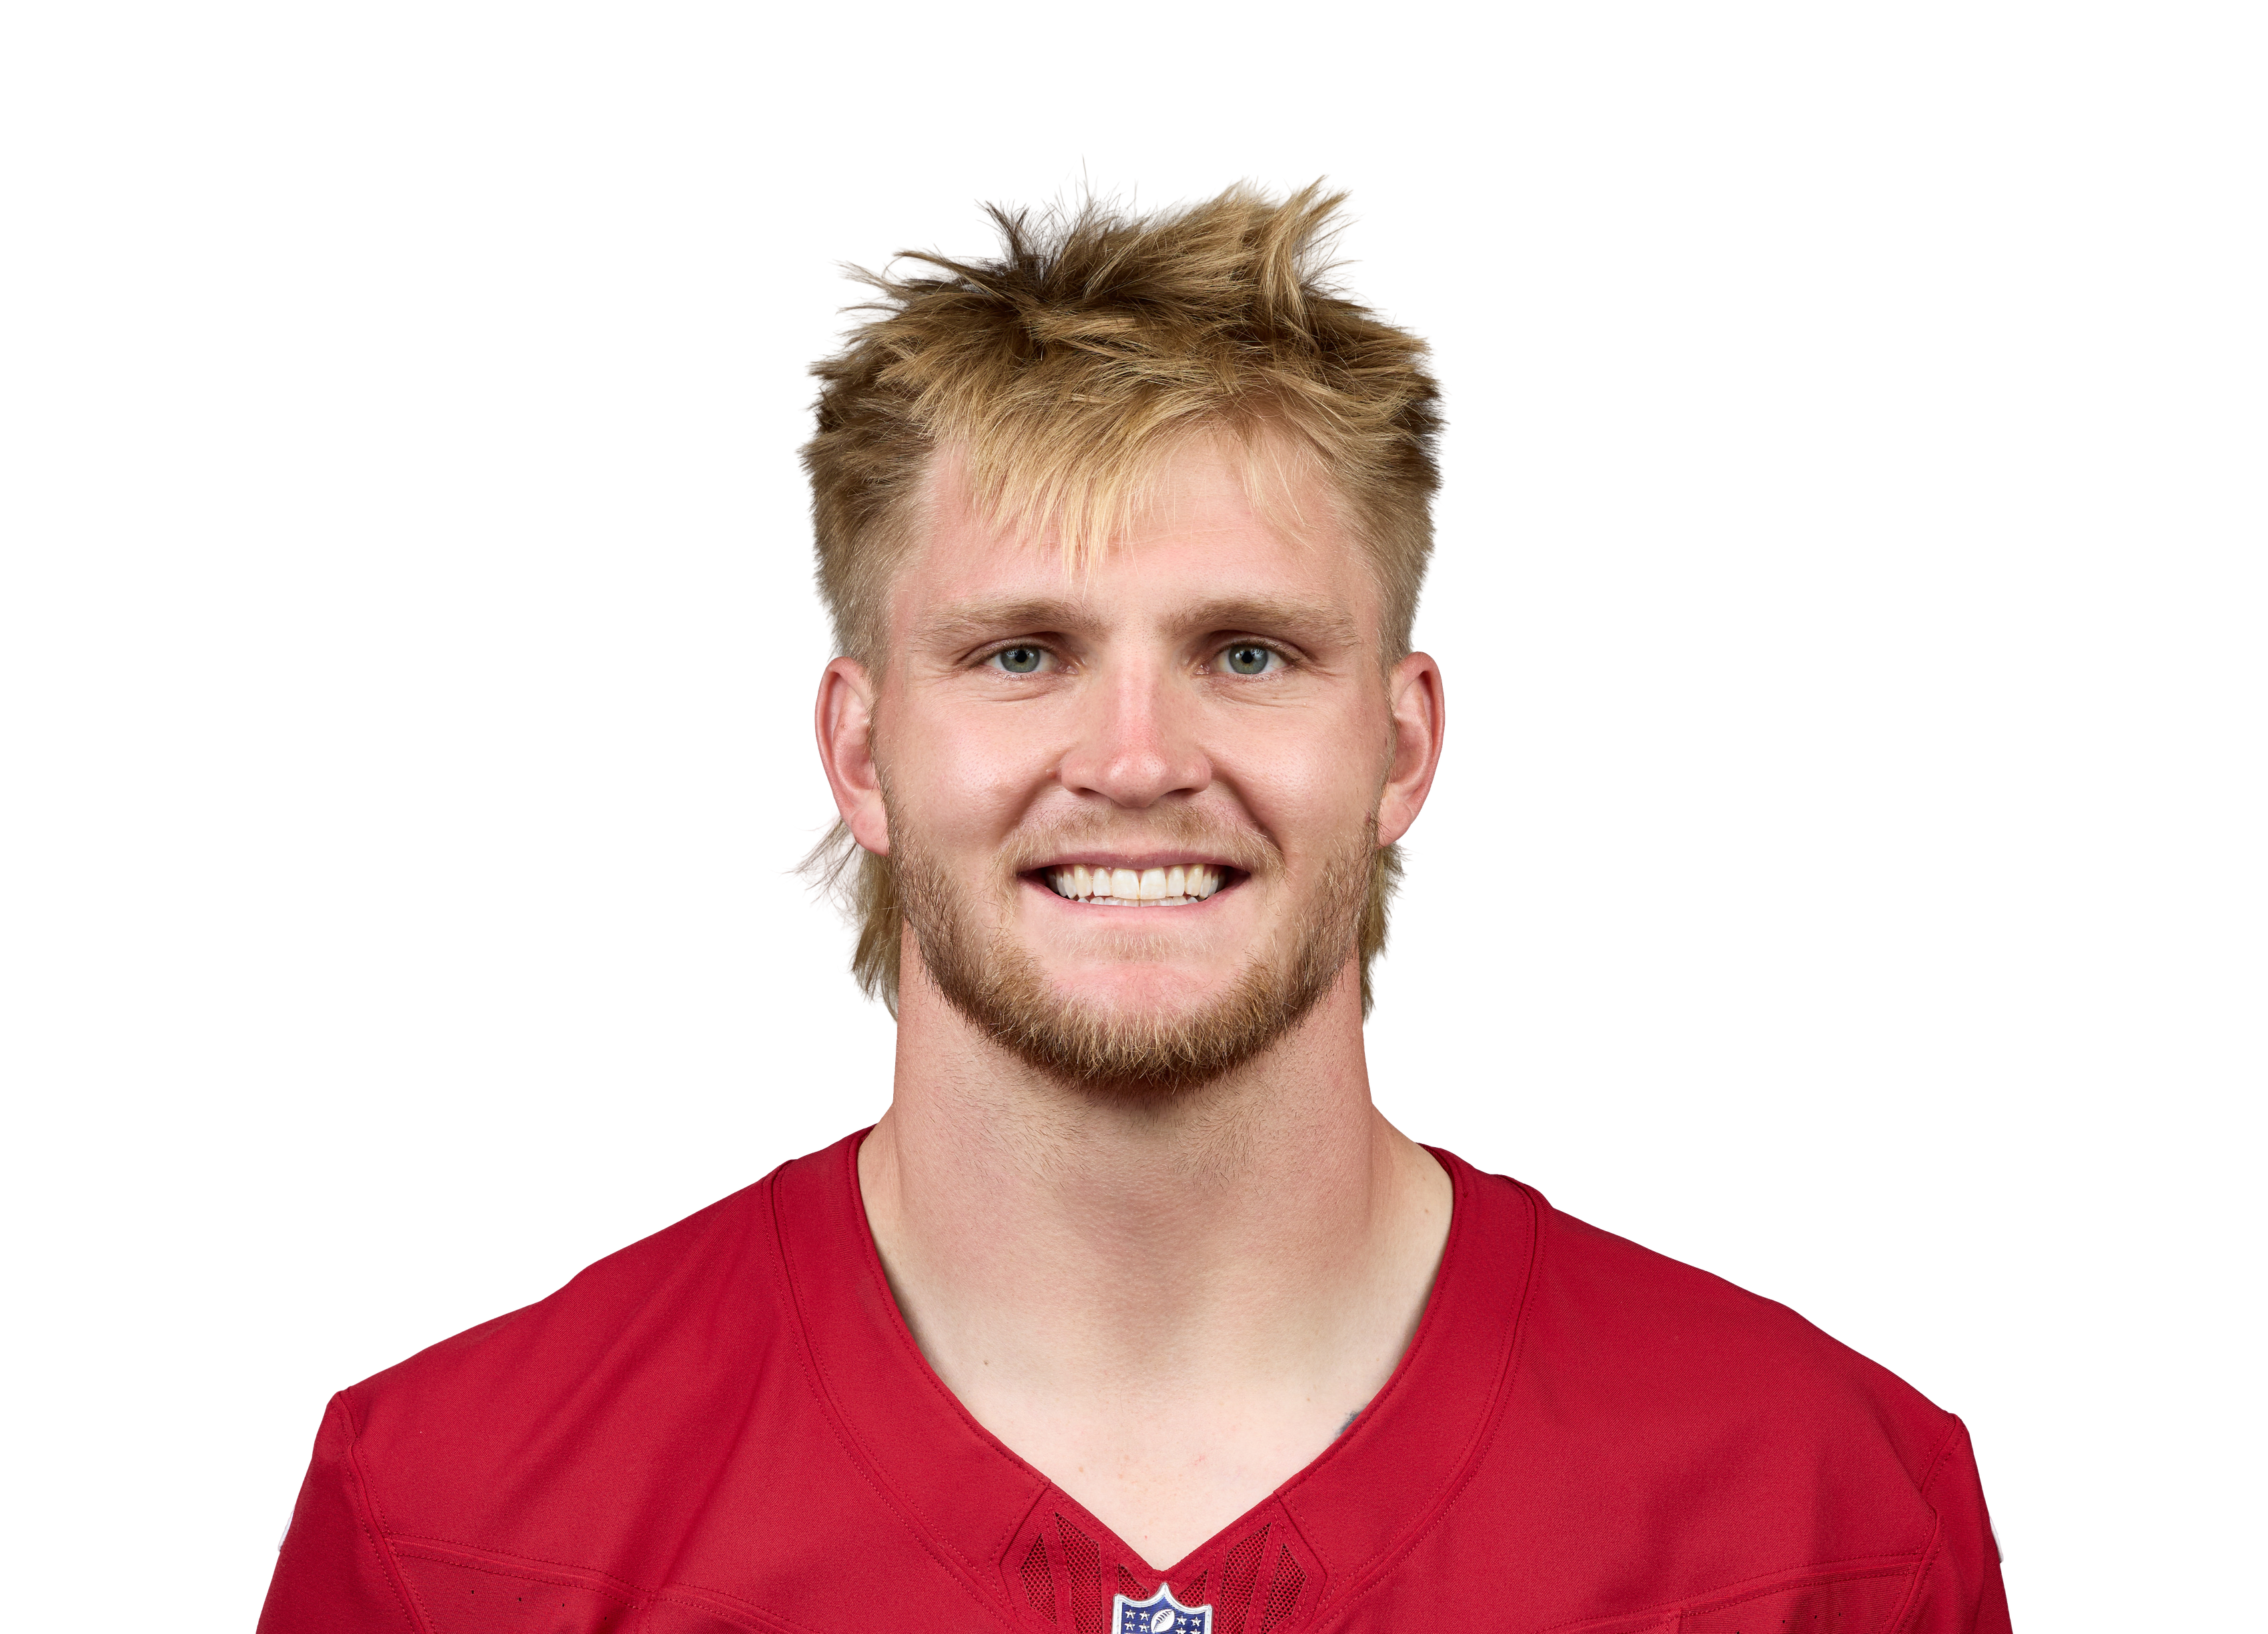 Trey McBride@ ARI • Wk 5 | 21.6 | 10 | 9 | 66 | 1 | 0 |
 T.J. Hockensonvs MIN • Wk 8 | 15.8 | 5 | 4 | 58 | 1 | 0 |
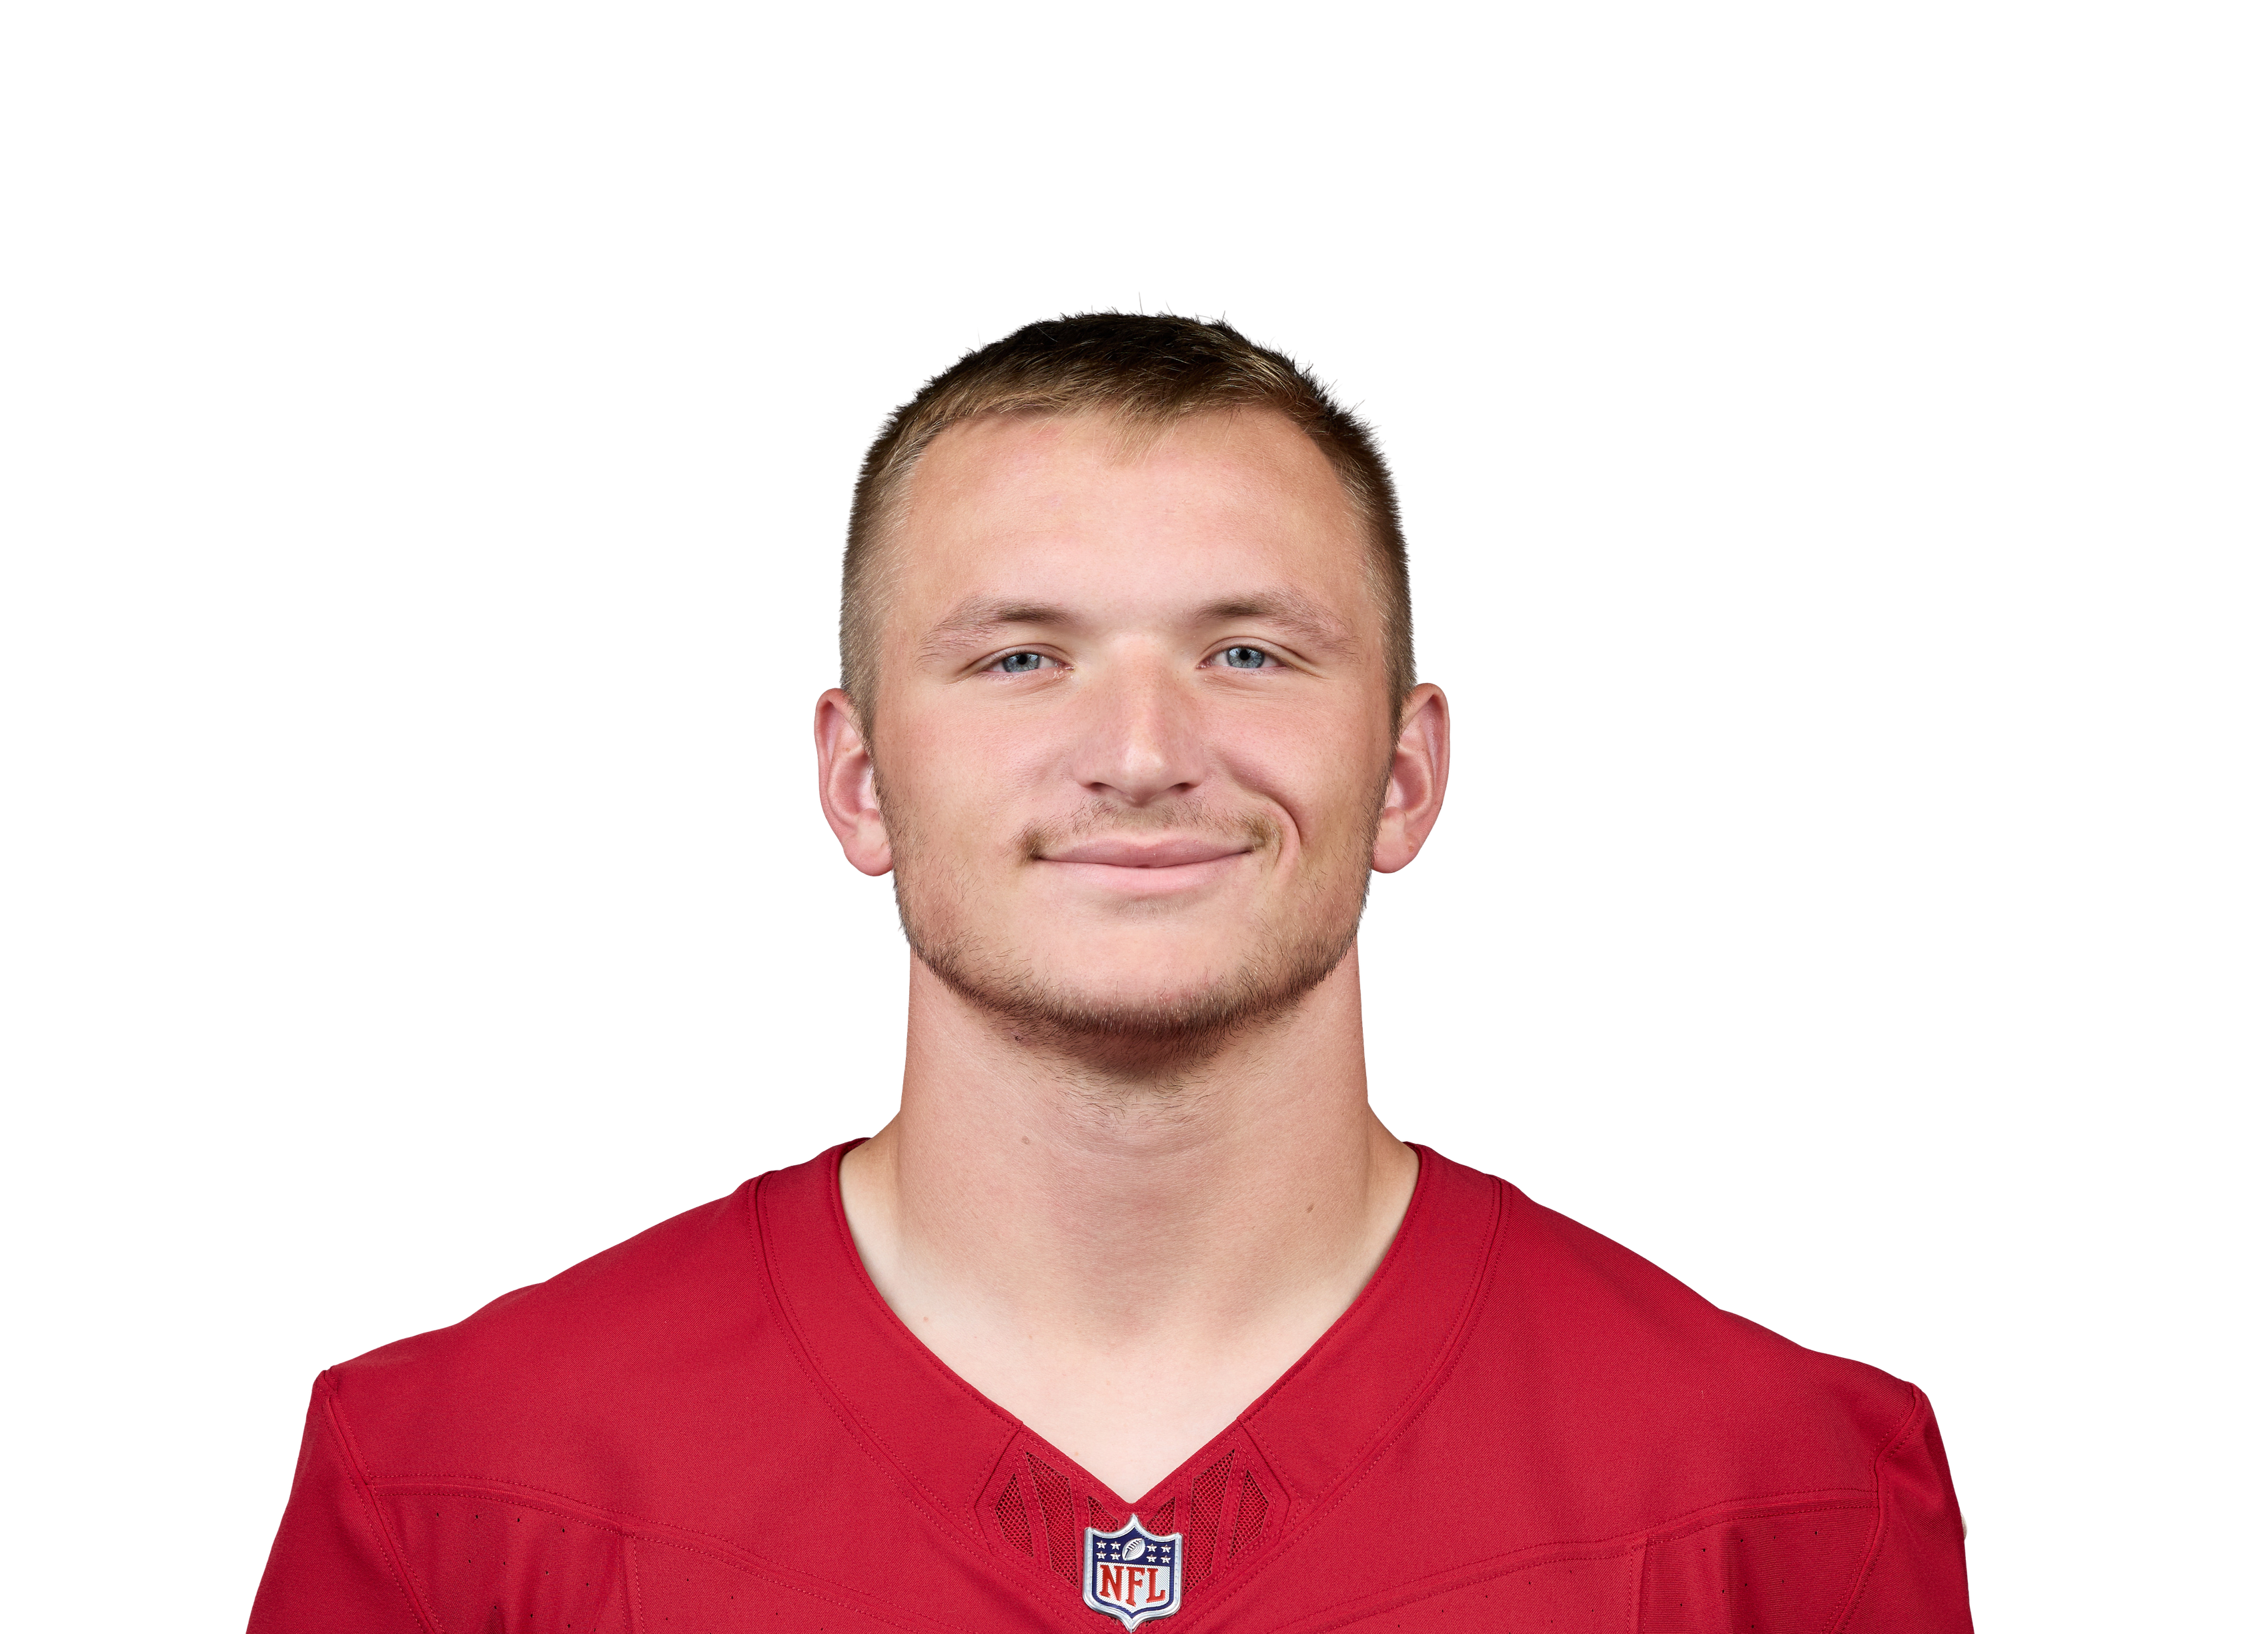 Teagan Quitoriano@ ARI • Wk 5 | 15.5 | 2 | 2 | 15 | 2 | 0 |
 Jeremy Ruckertvs NYJ • Wk 3 | 14.9 | 5 | 5 | 39 | 1 | 0 |
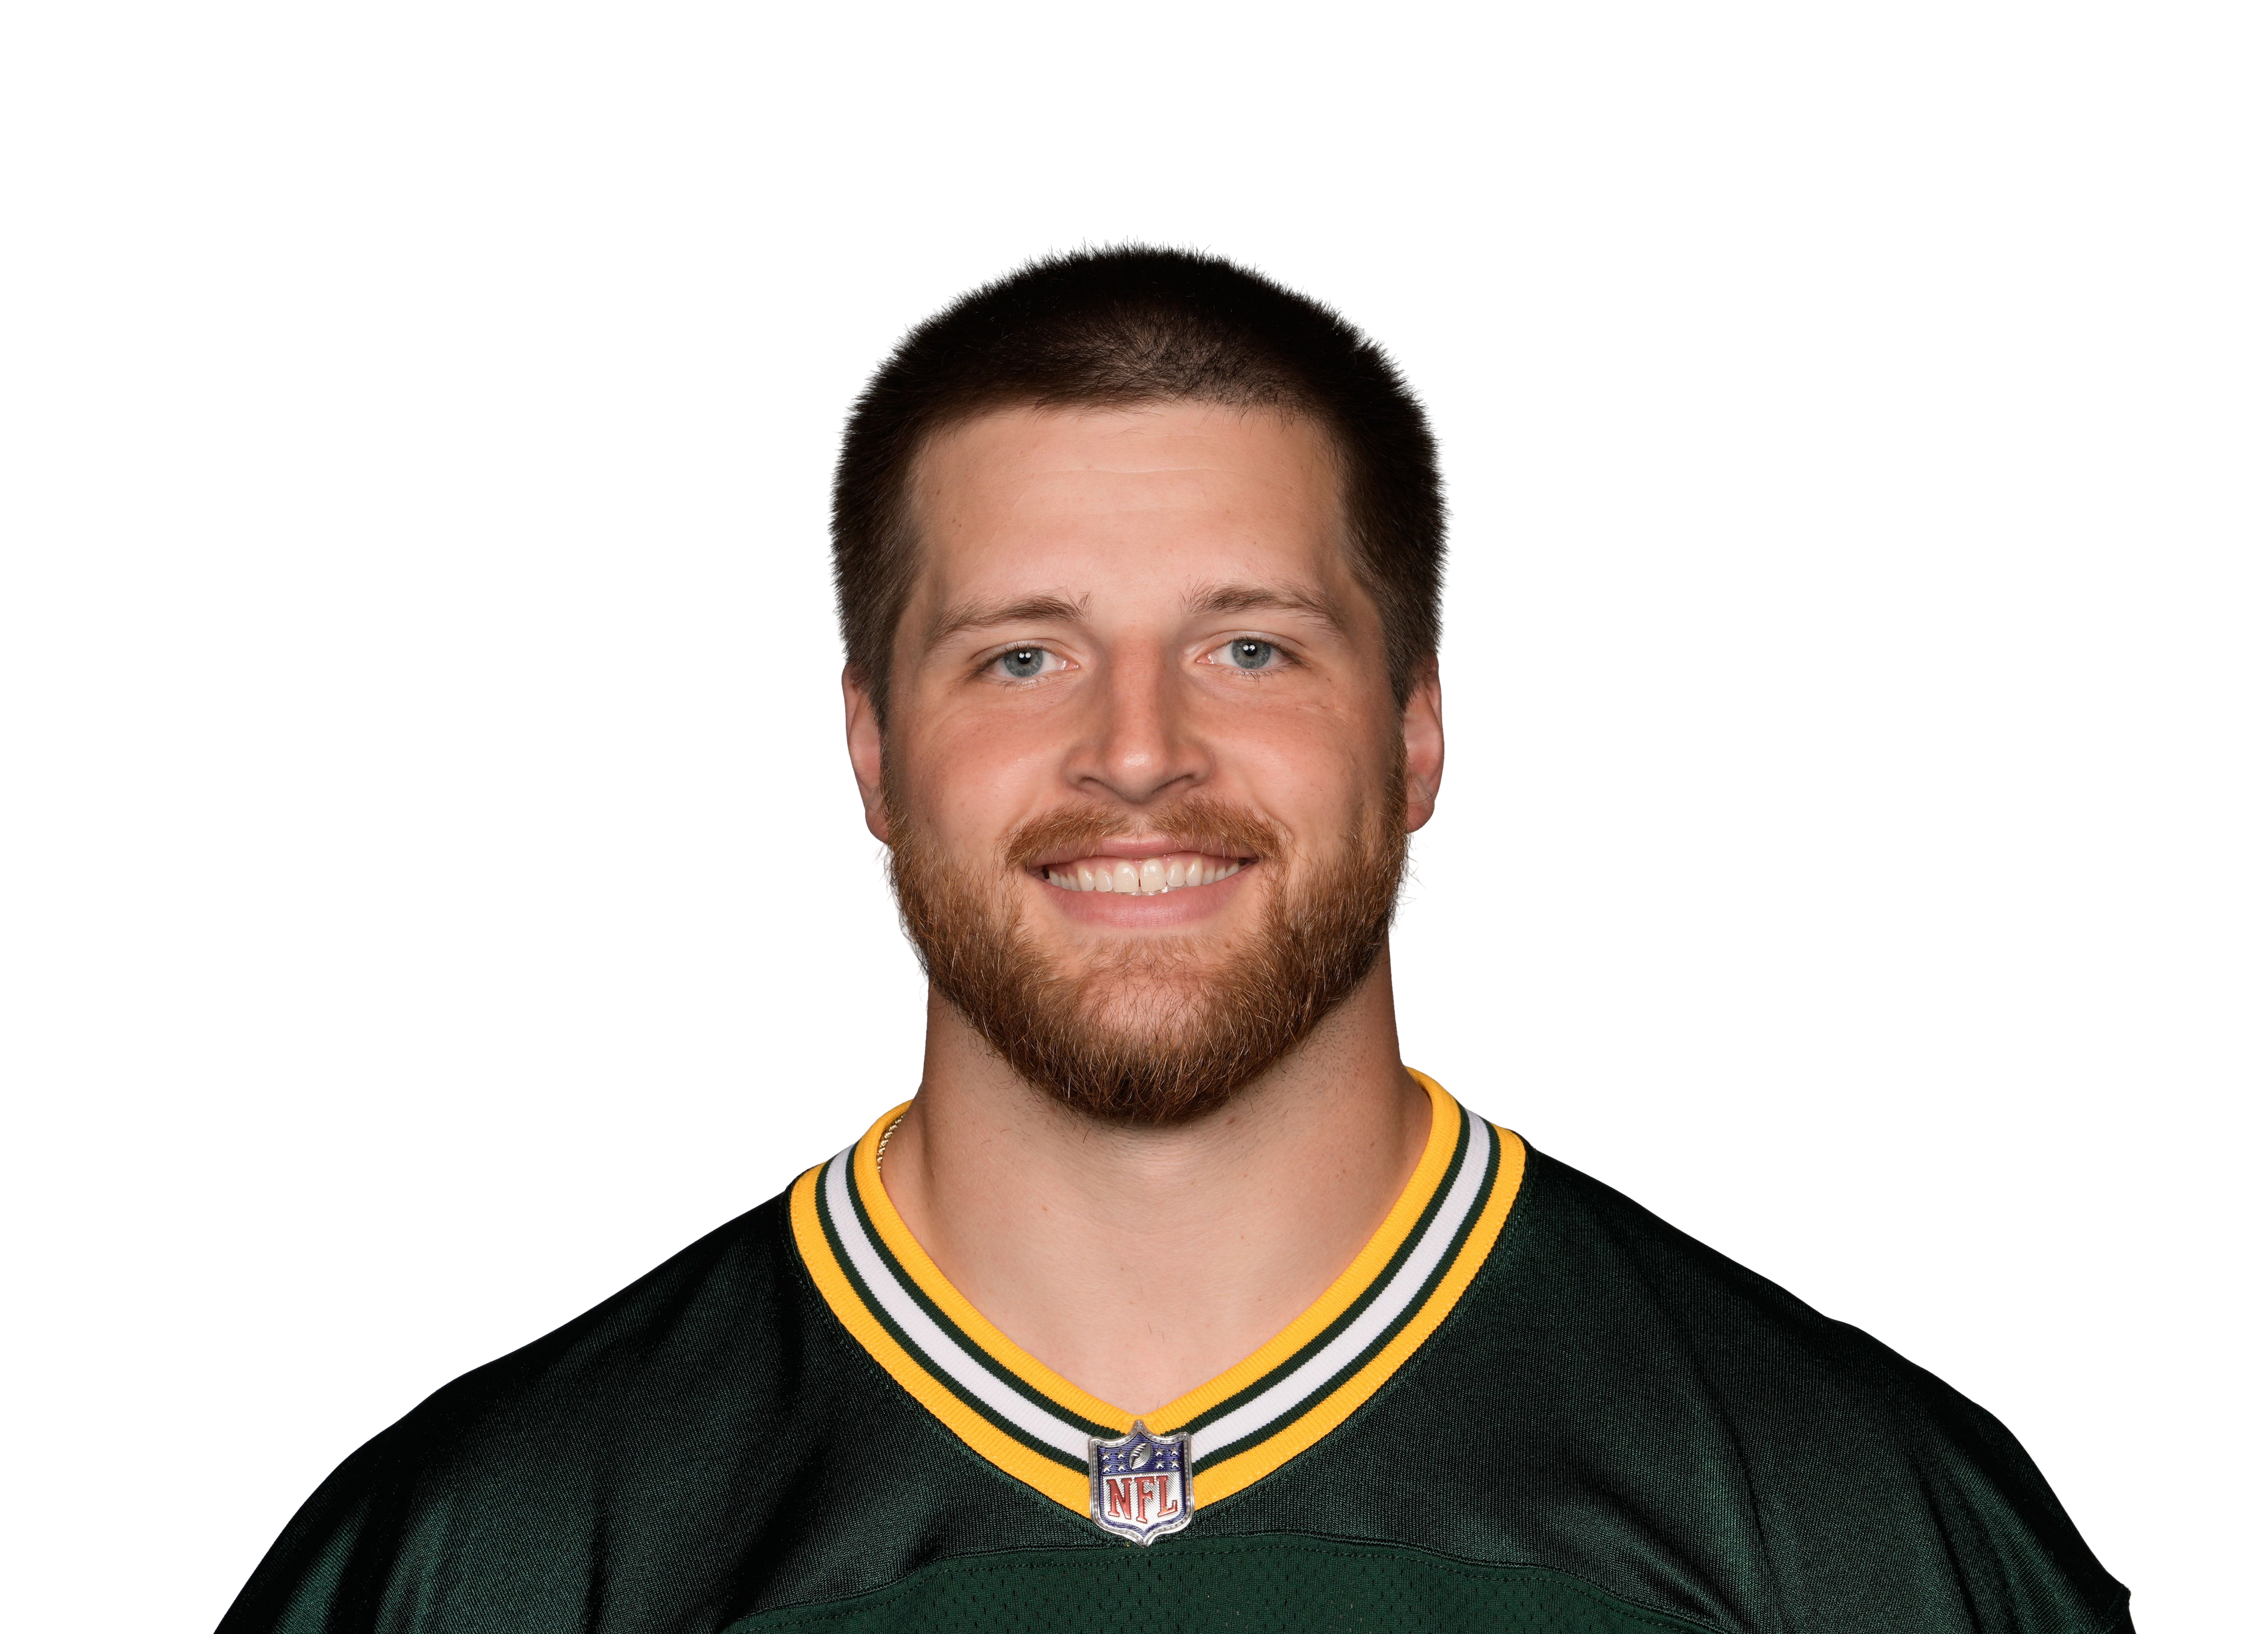 Tucker Kraftvs GB • Wk 7 | 14.8 | 6 | 4 | 48 | 1 | 0 |
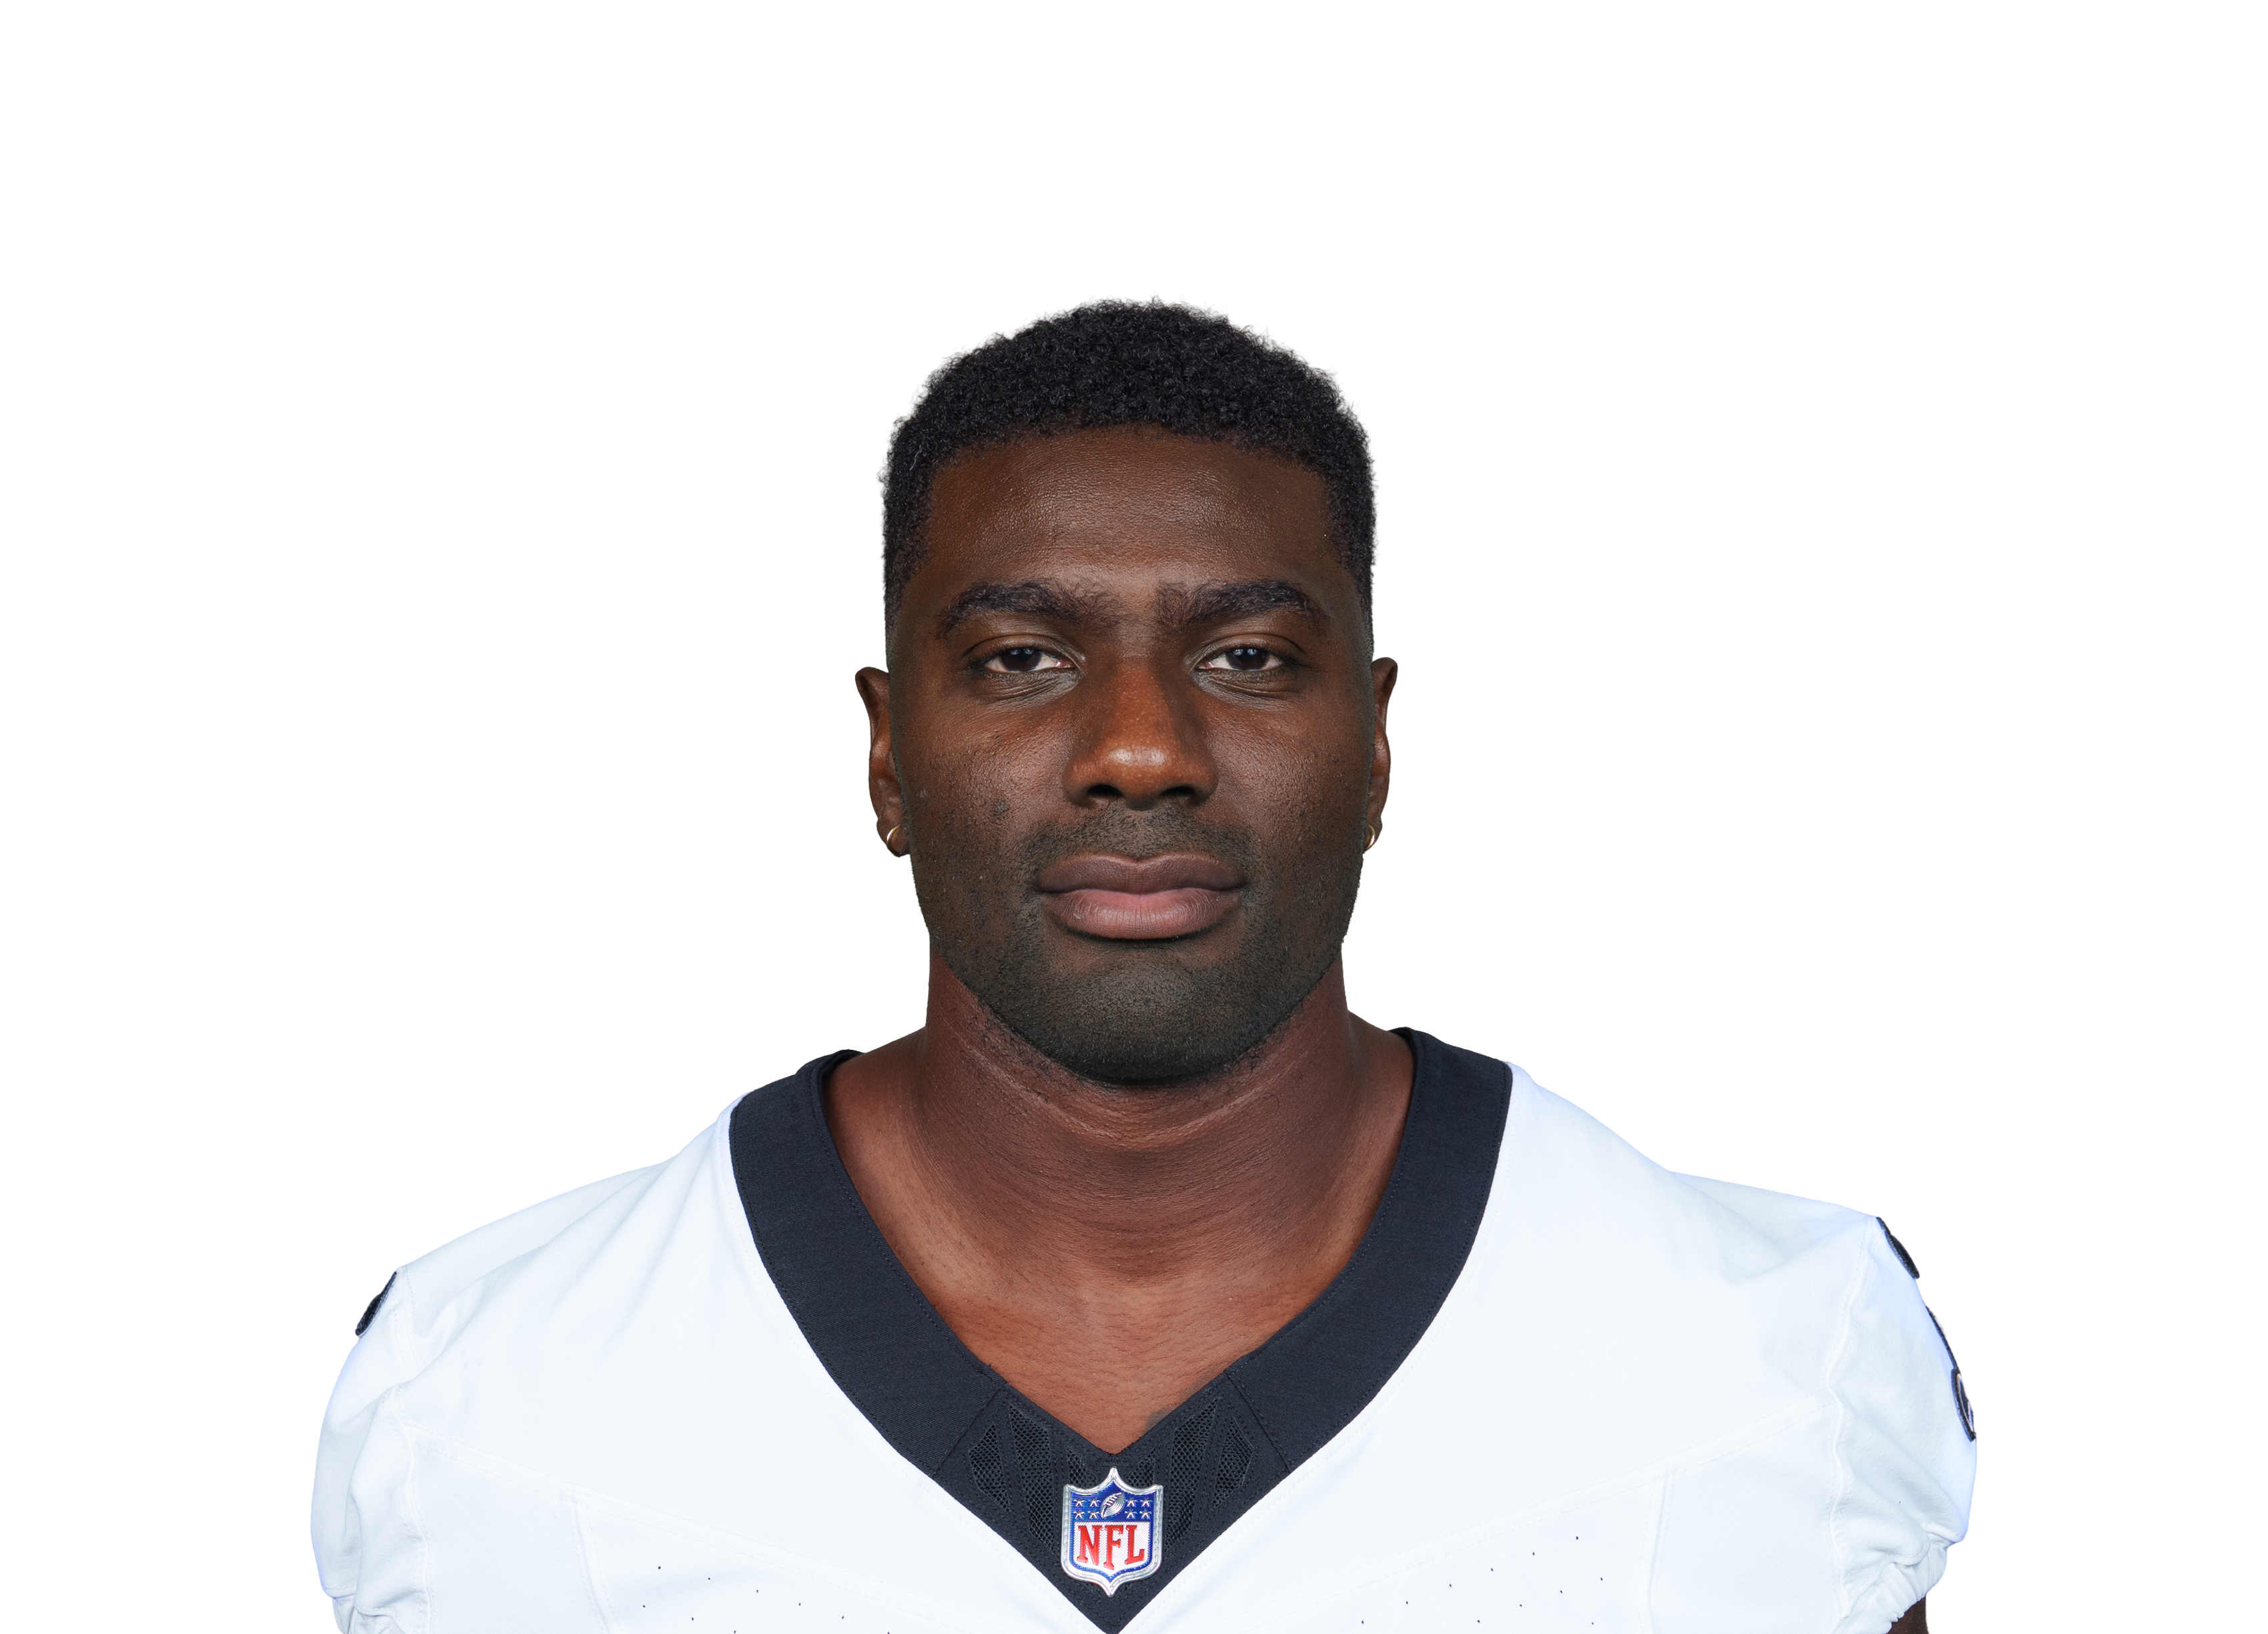 Juwan Johnsonvs NO • Wk 1 | 14.4 | 7 | 3 | 54 | 1 | 0 |
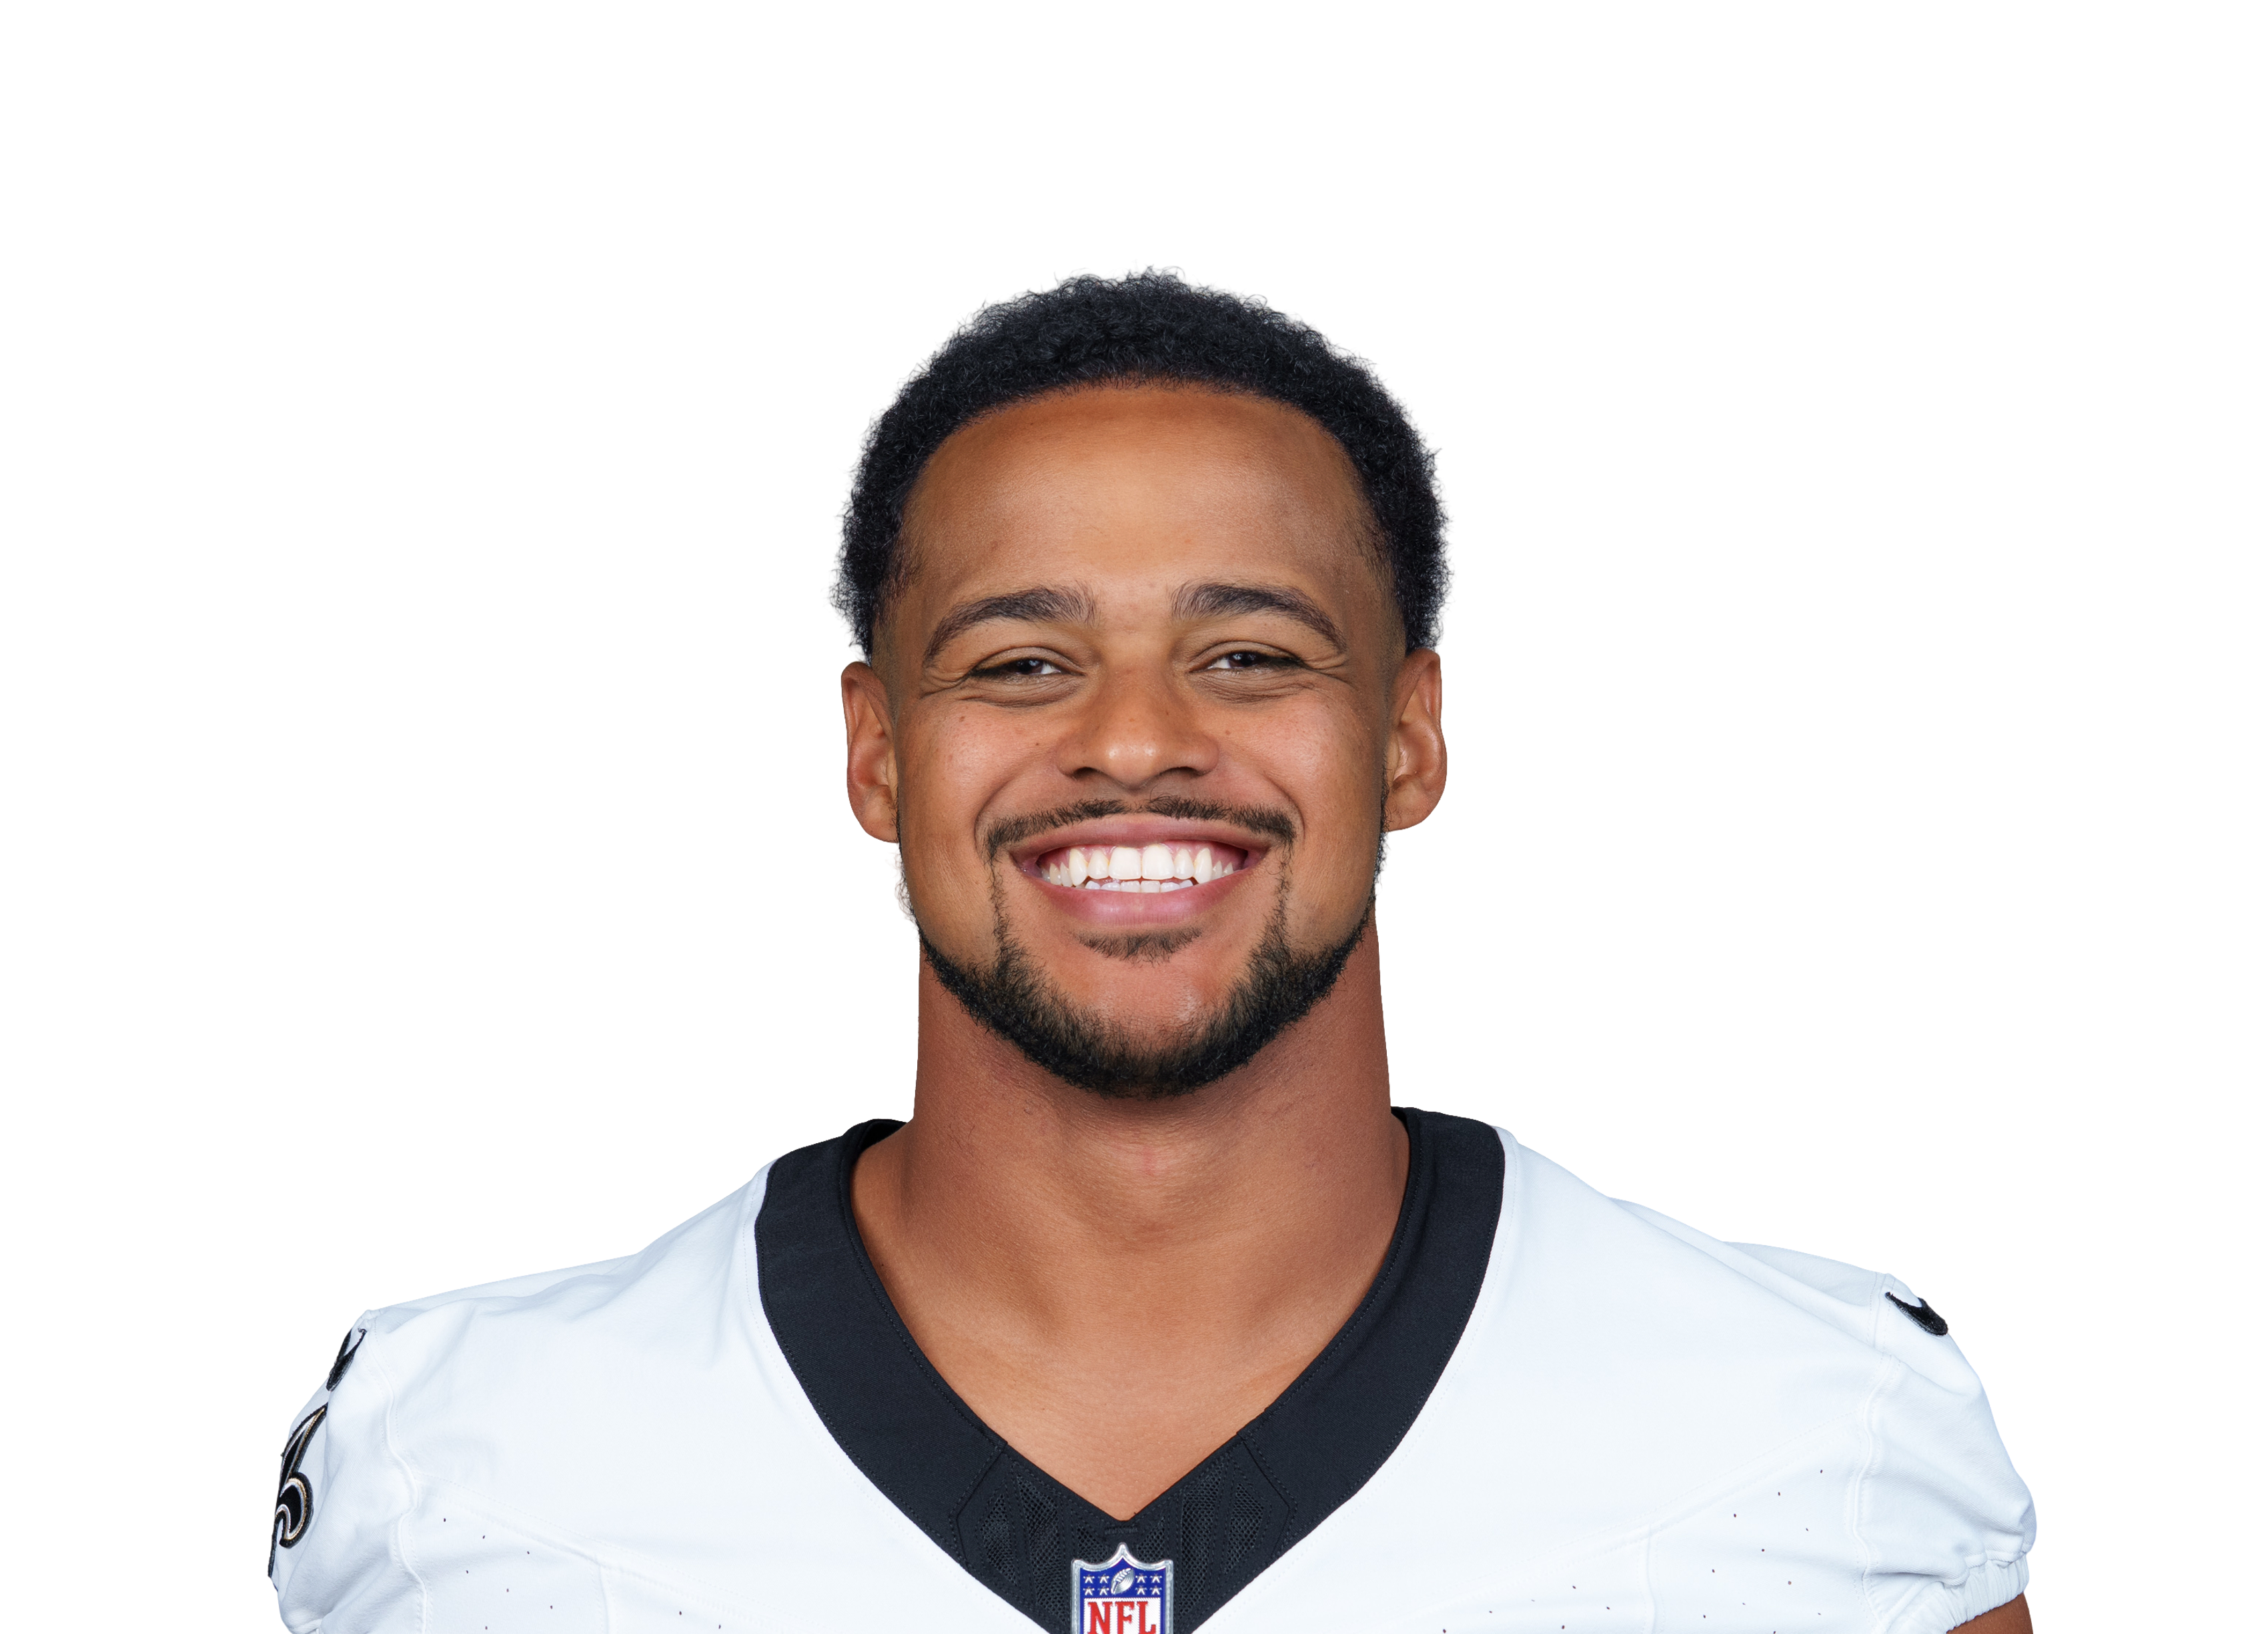 Noah Fantvs NO • Wk 1 | 13.3 | 8 | 4 | 33 | 1 | 0 |
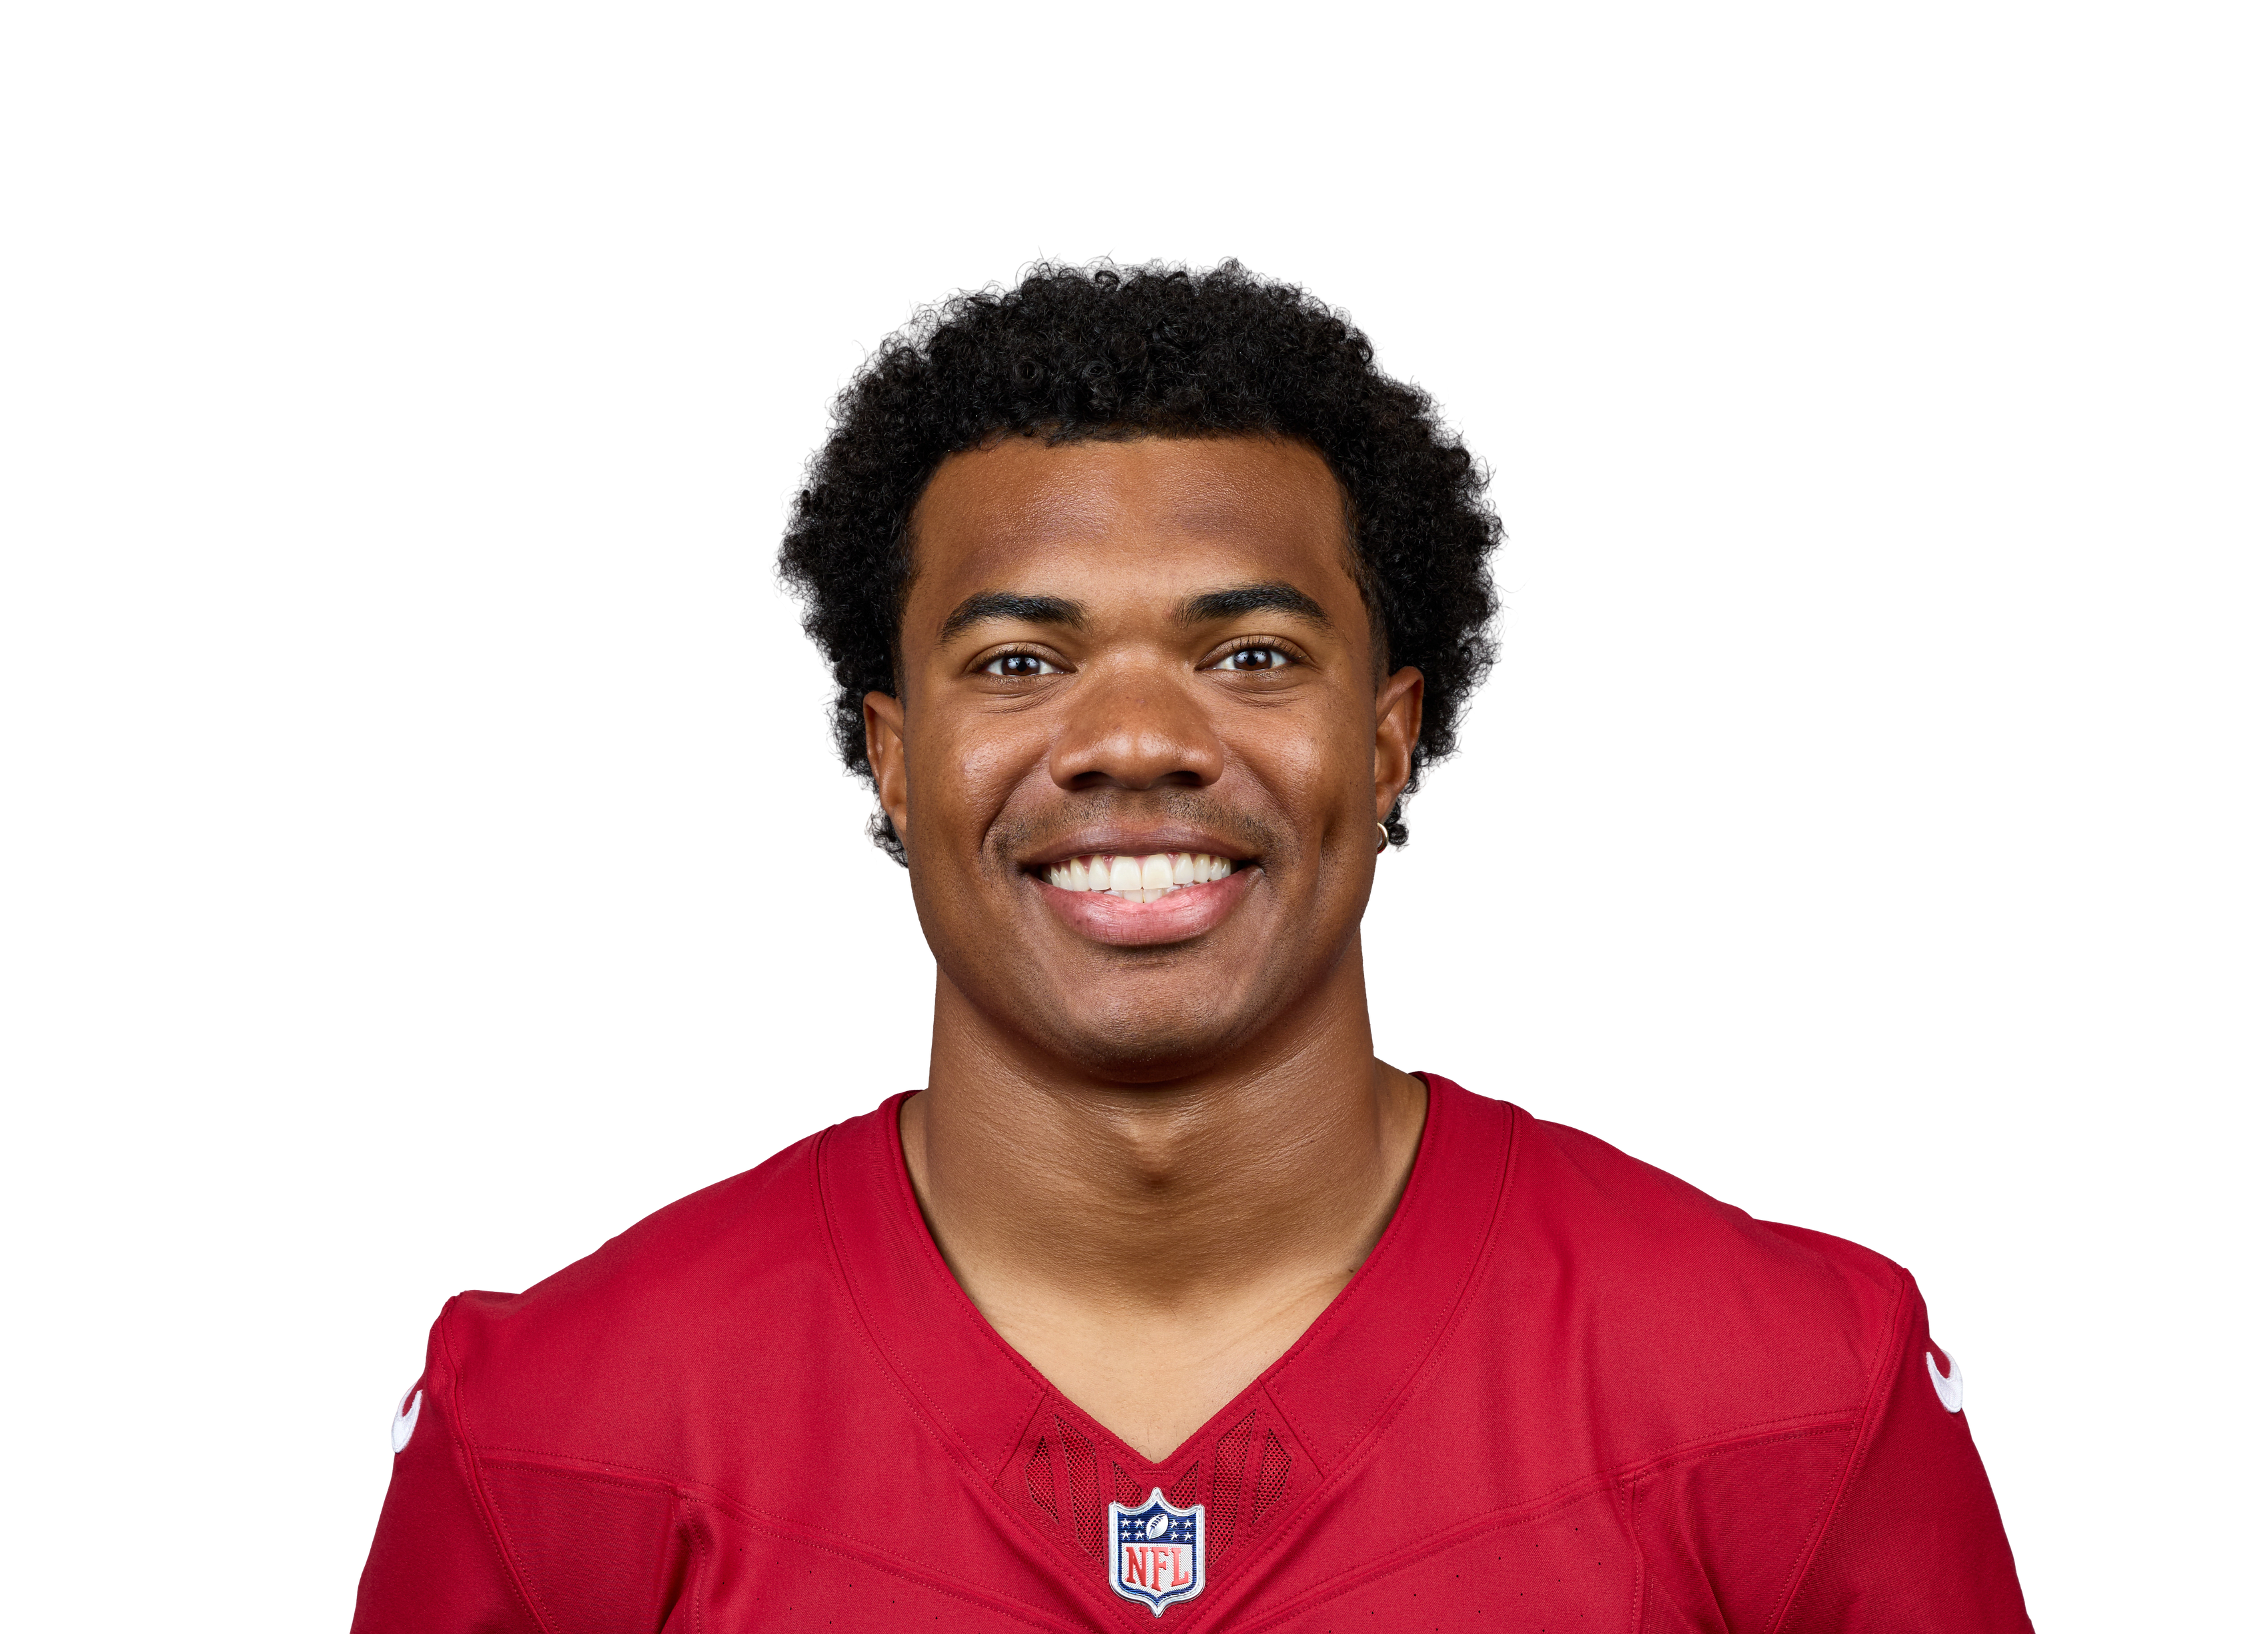 Elijah Higgins@ ARI • Wk 5 | 8.7 | 3 | 3 | 57 | 0 | 0 |
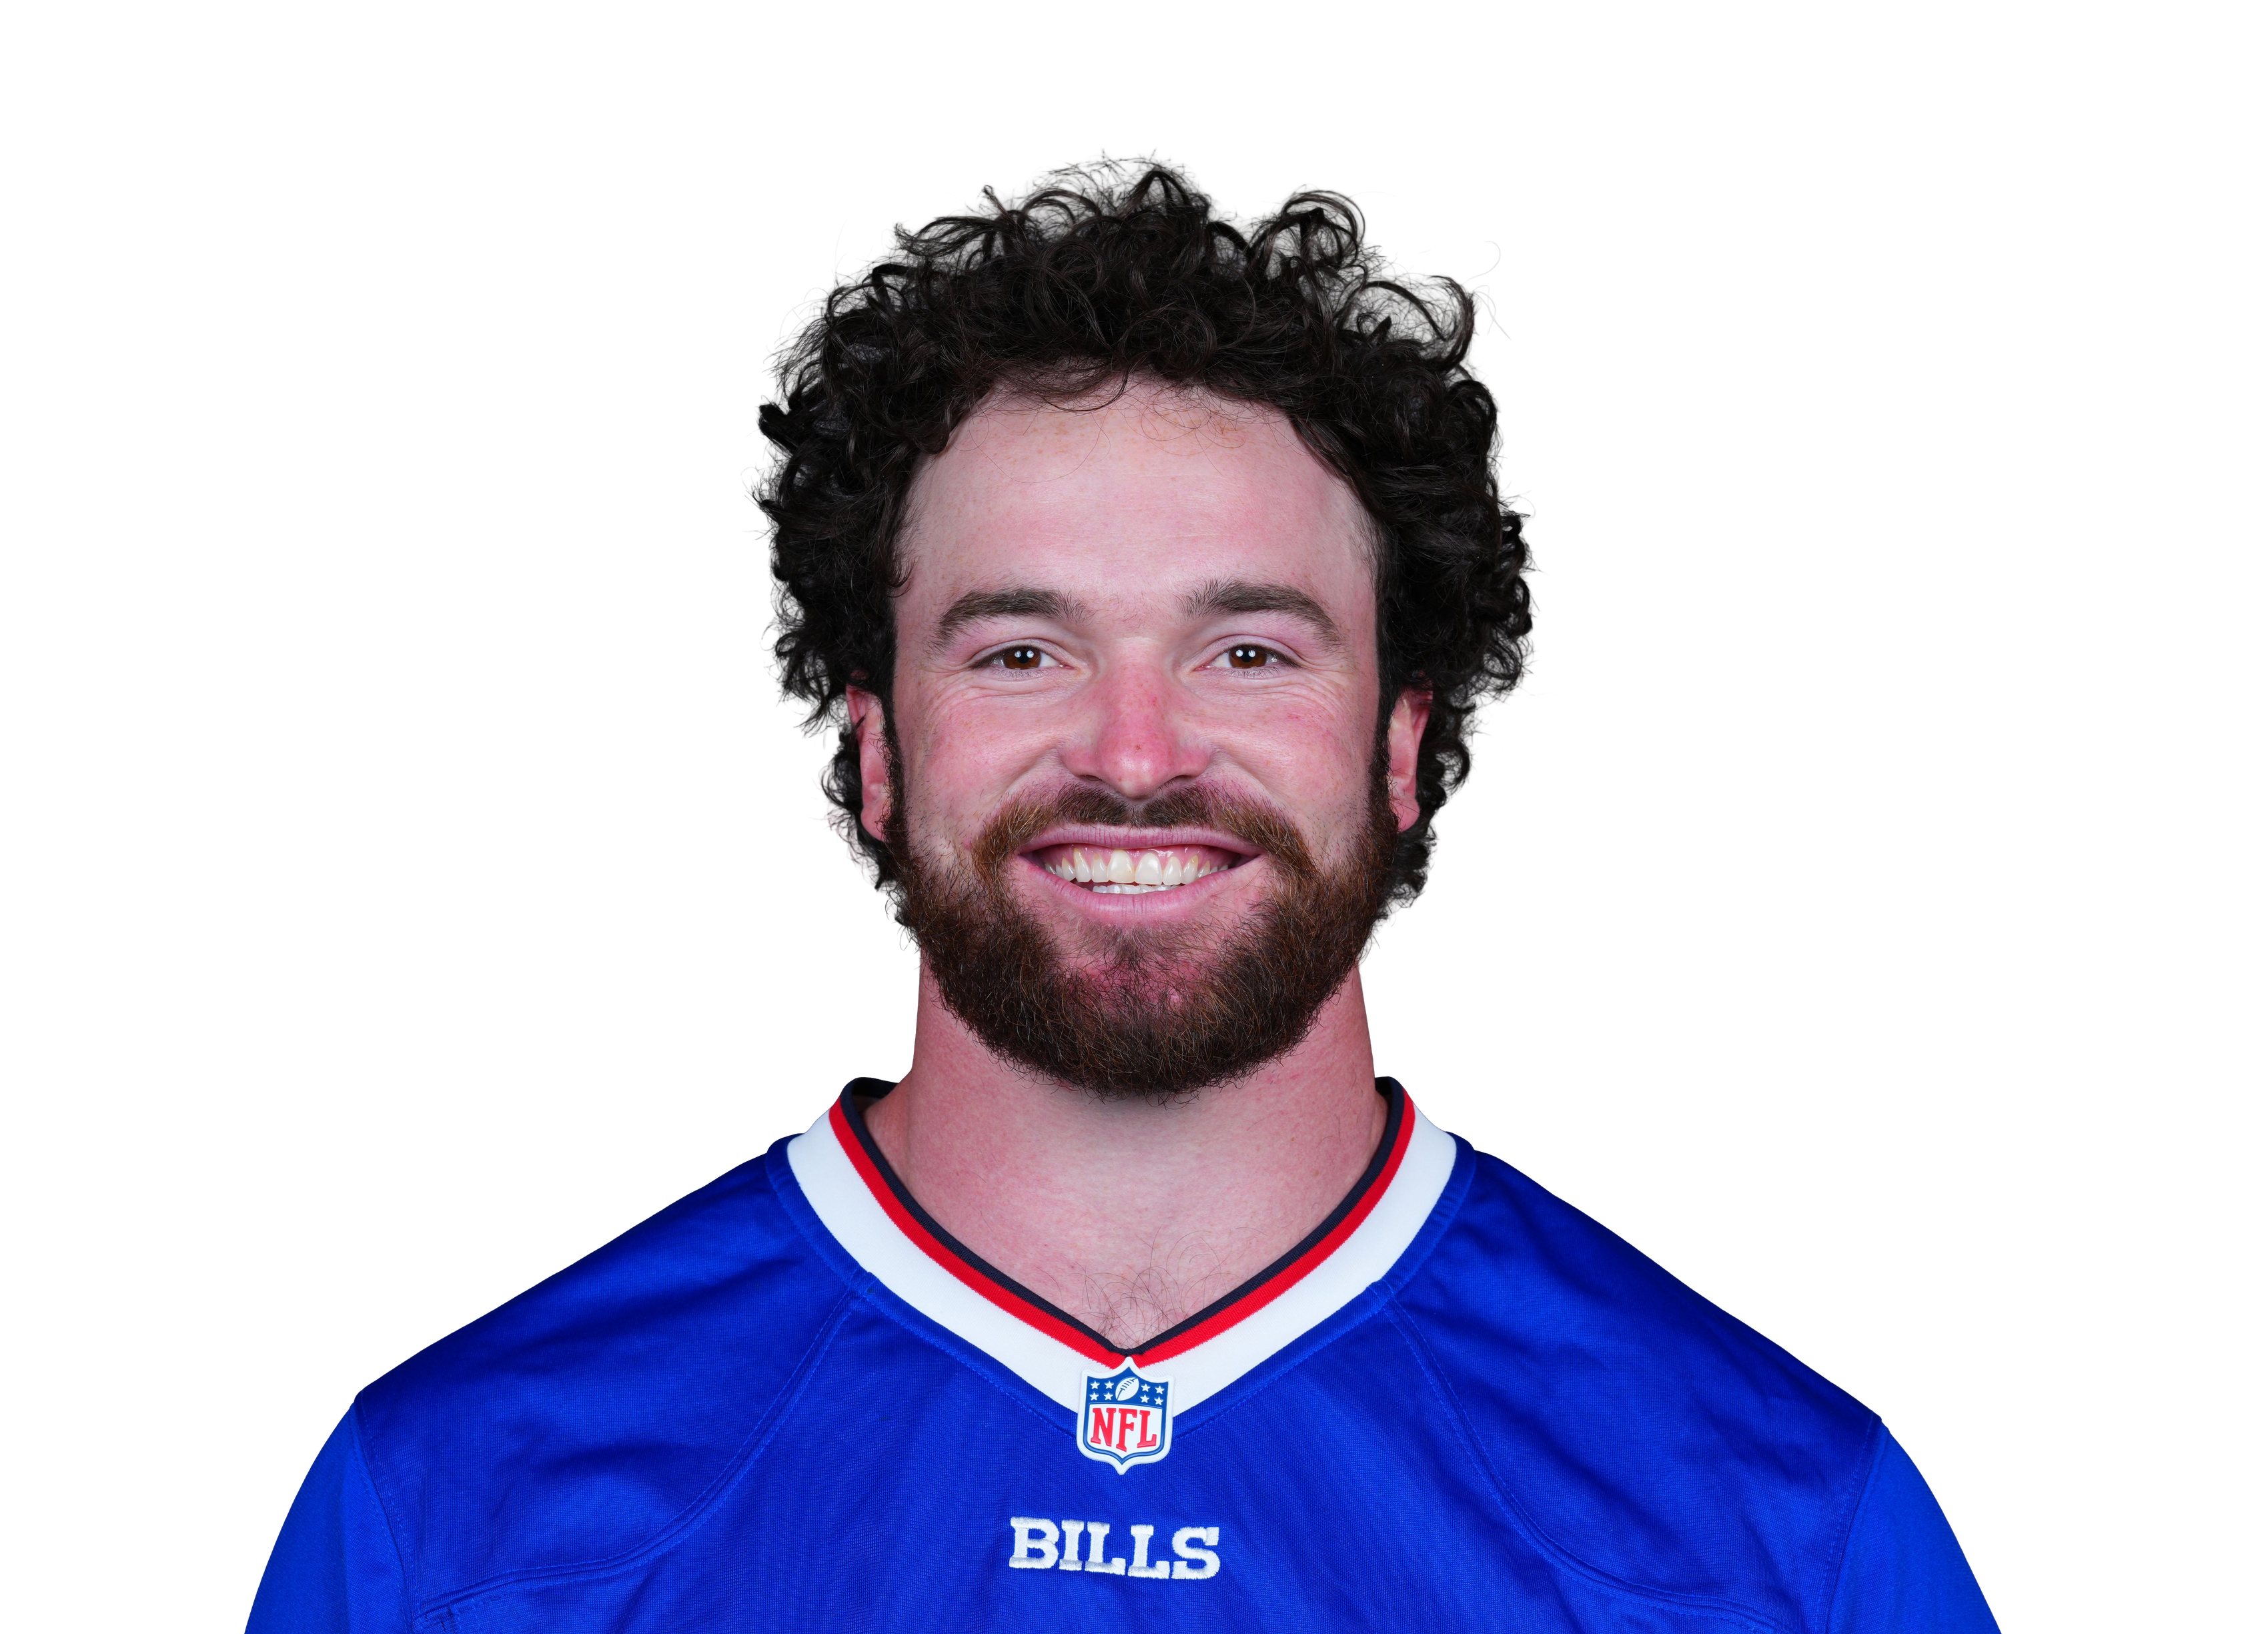 Dawson Knox@ BUF • Wk 2 | 8.5 | 2 | 2 | 5 | 1 | 0 |
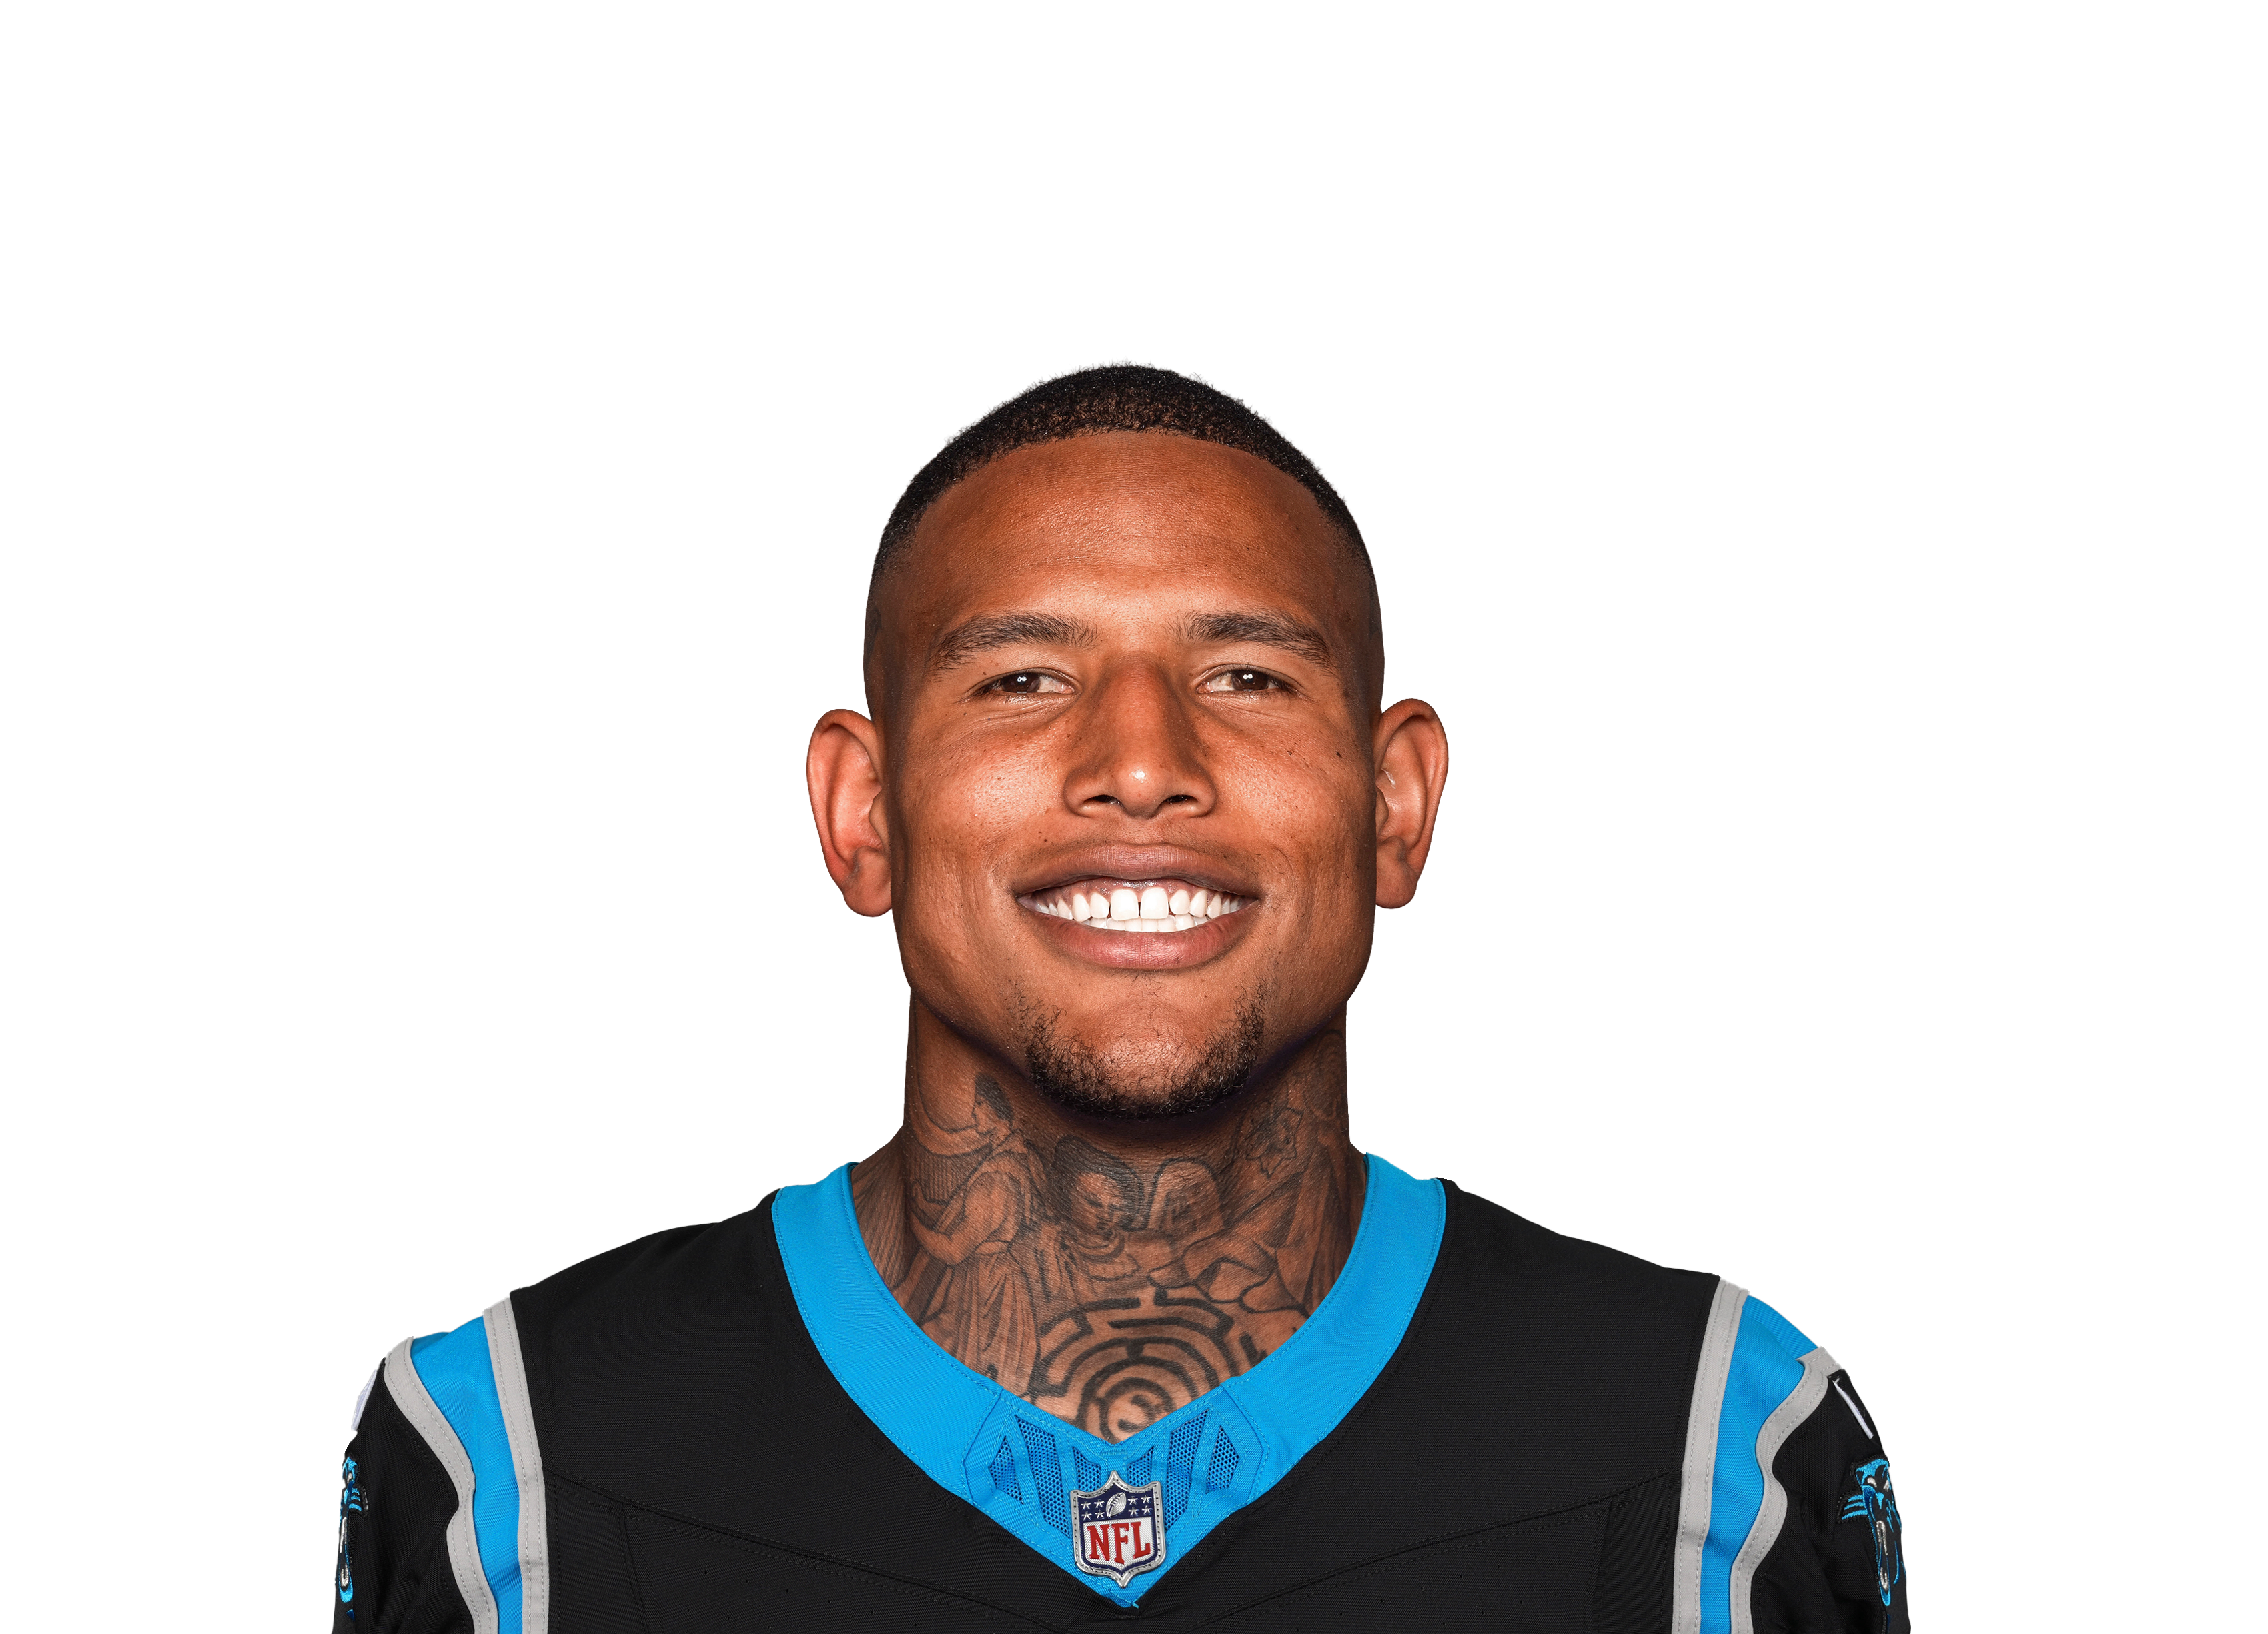 Darren Waller@ CAR • Wk 4 | 6.6 | 6 | 3 | 36 | 0 | 0 |
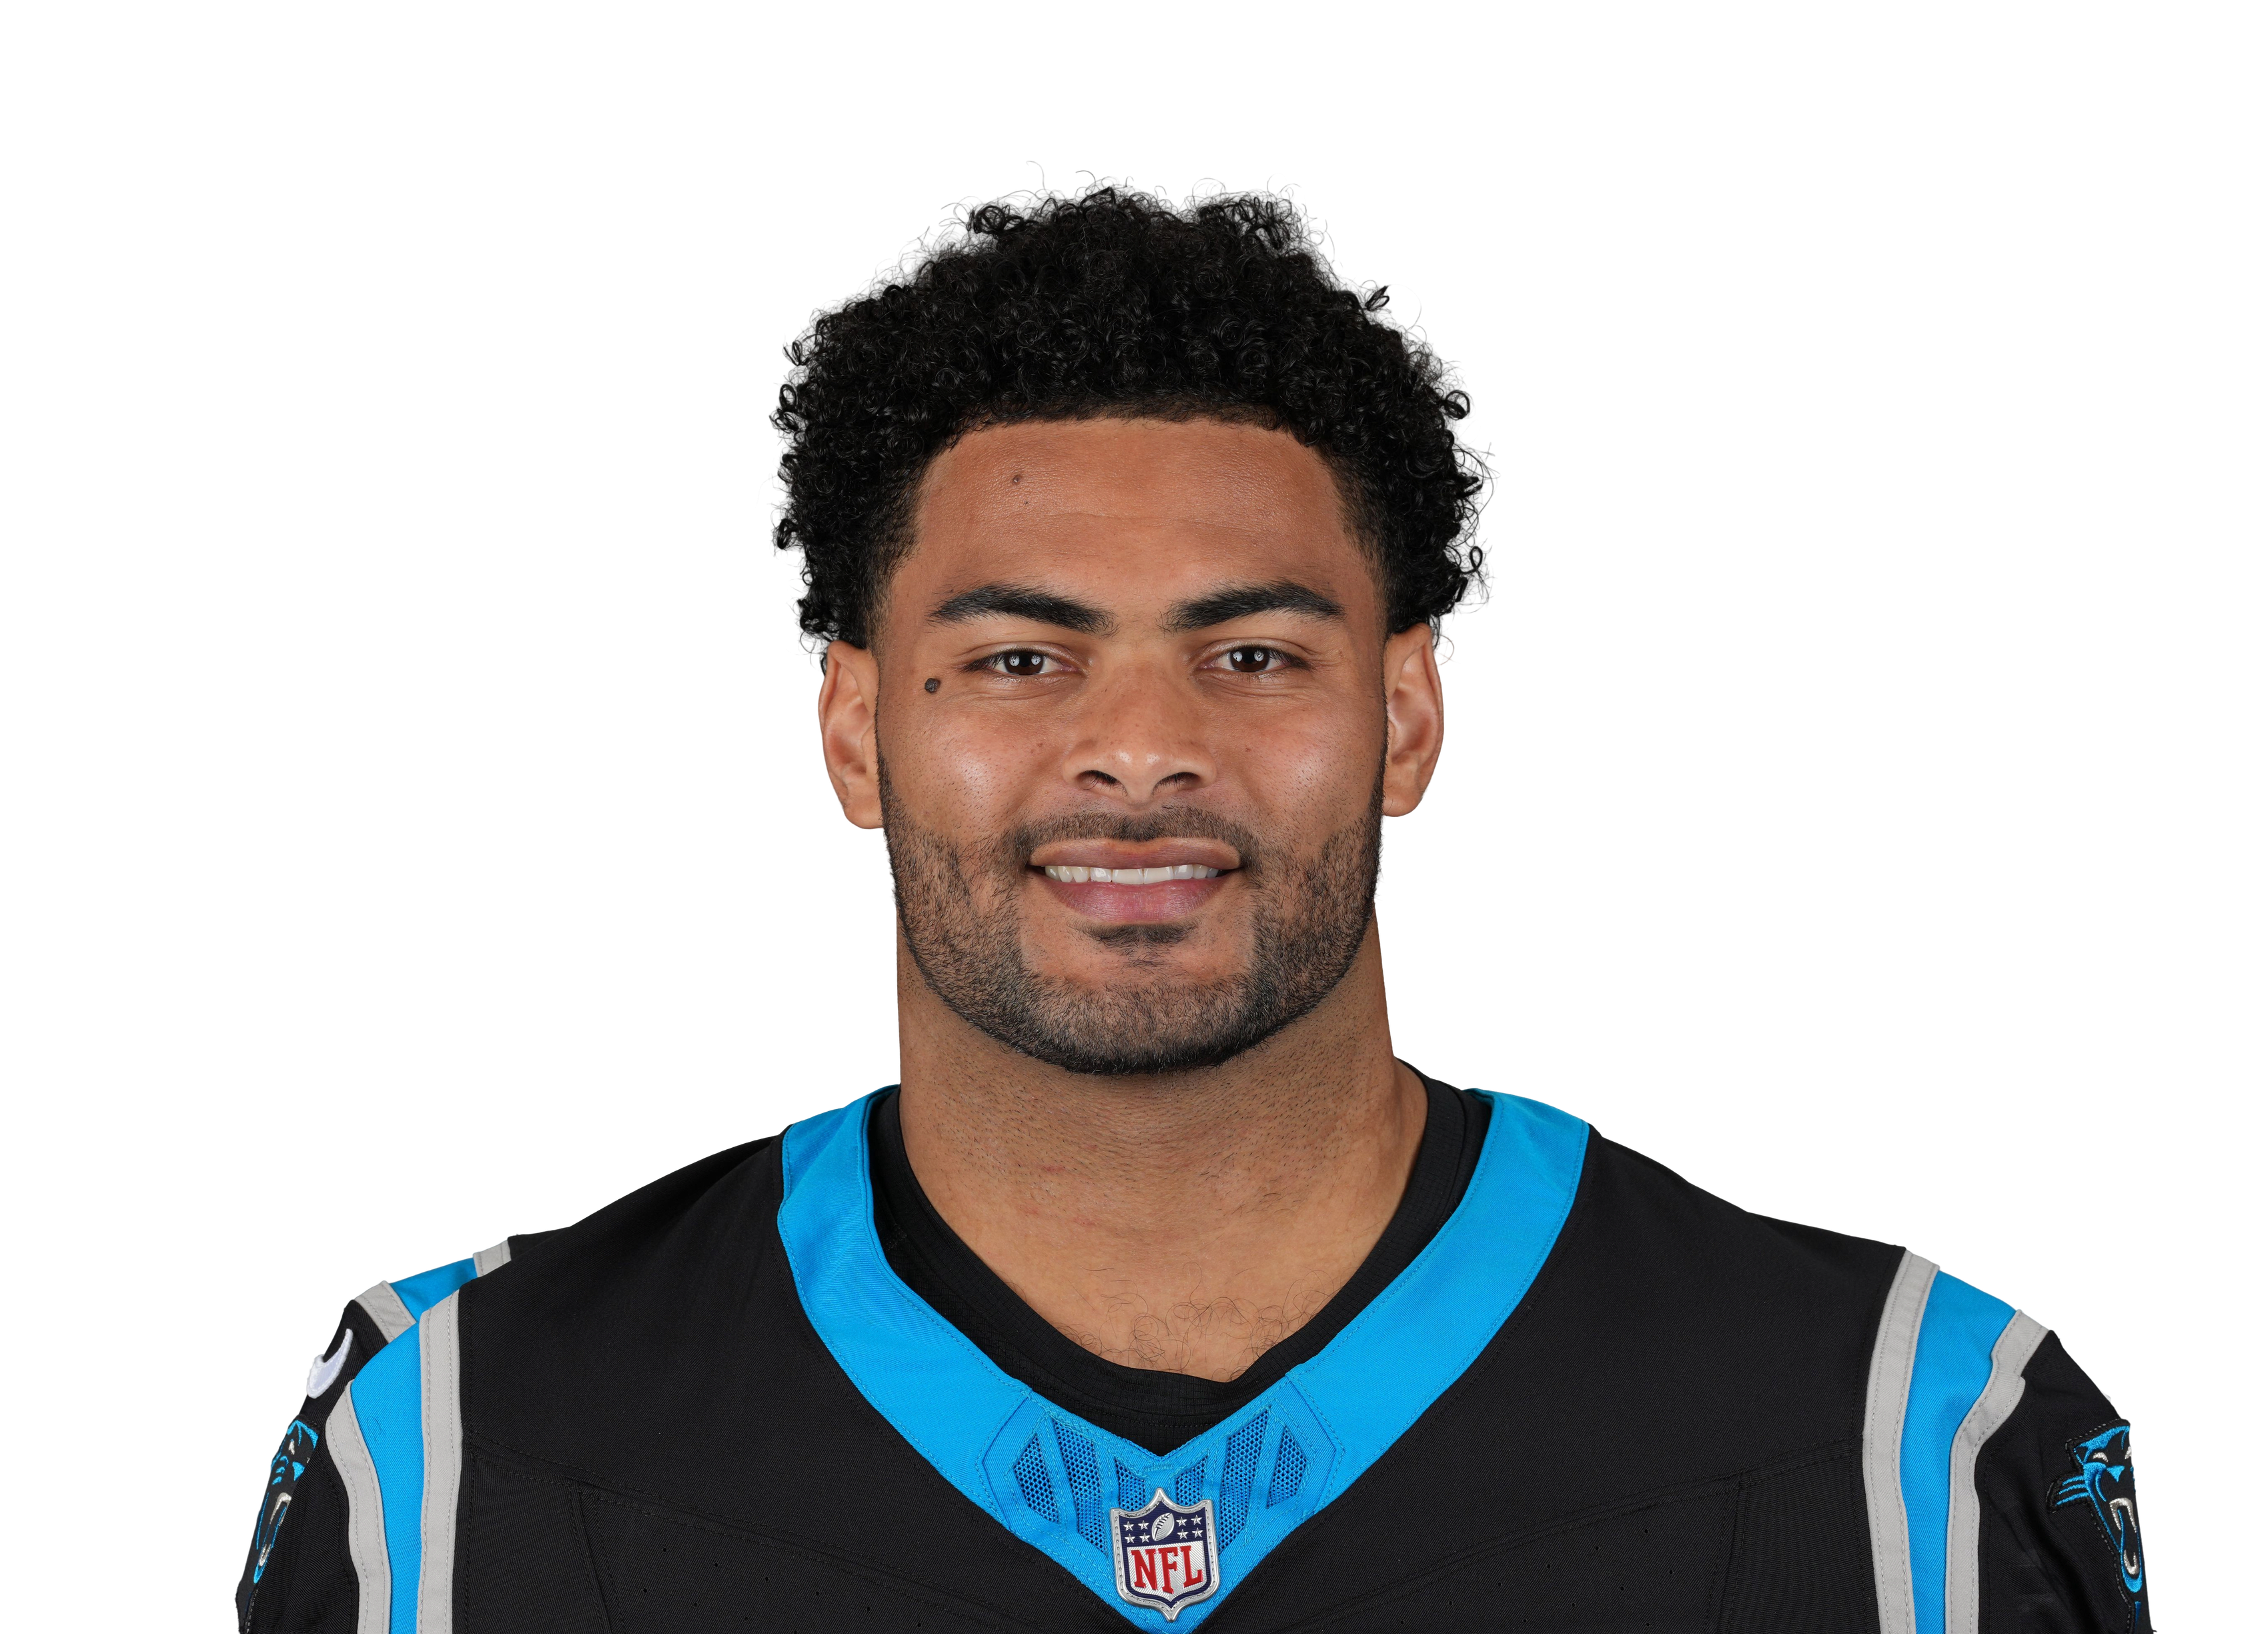 Tommy Tremble@ CAR • Wk 4 | 5.2 | 4 | 4 | 12 | 0 | 0 |
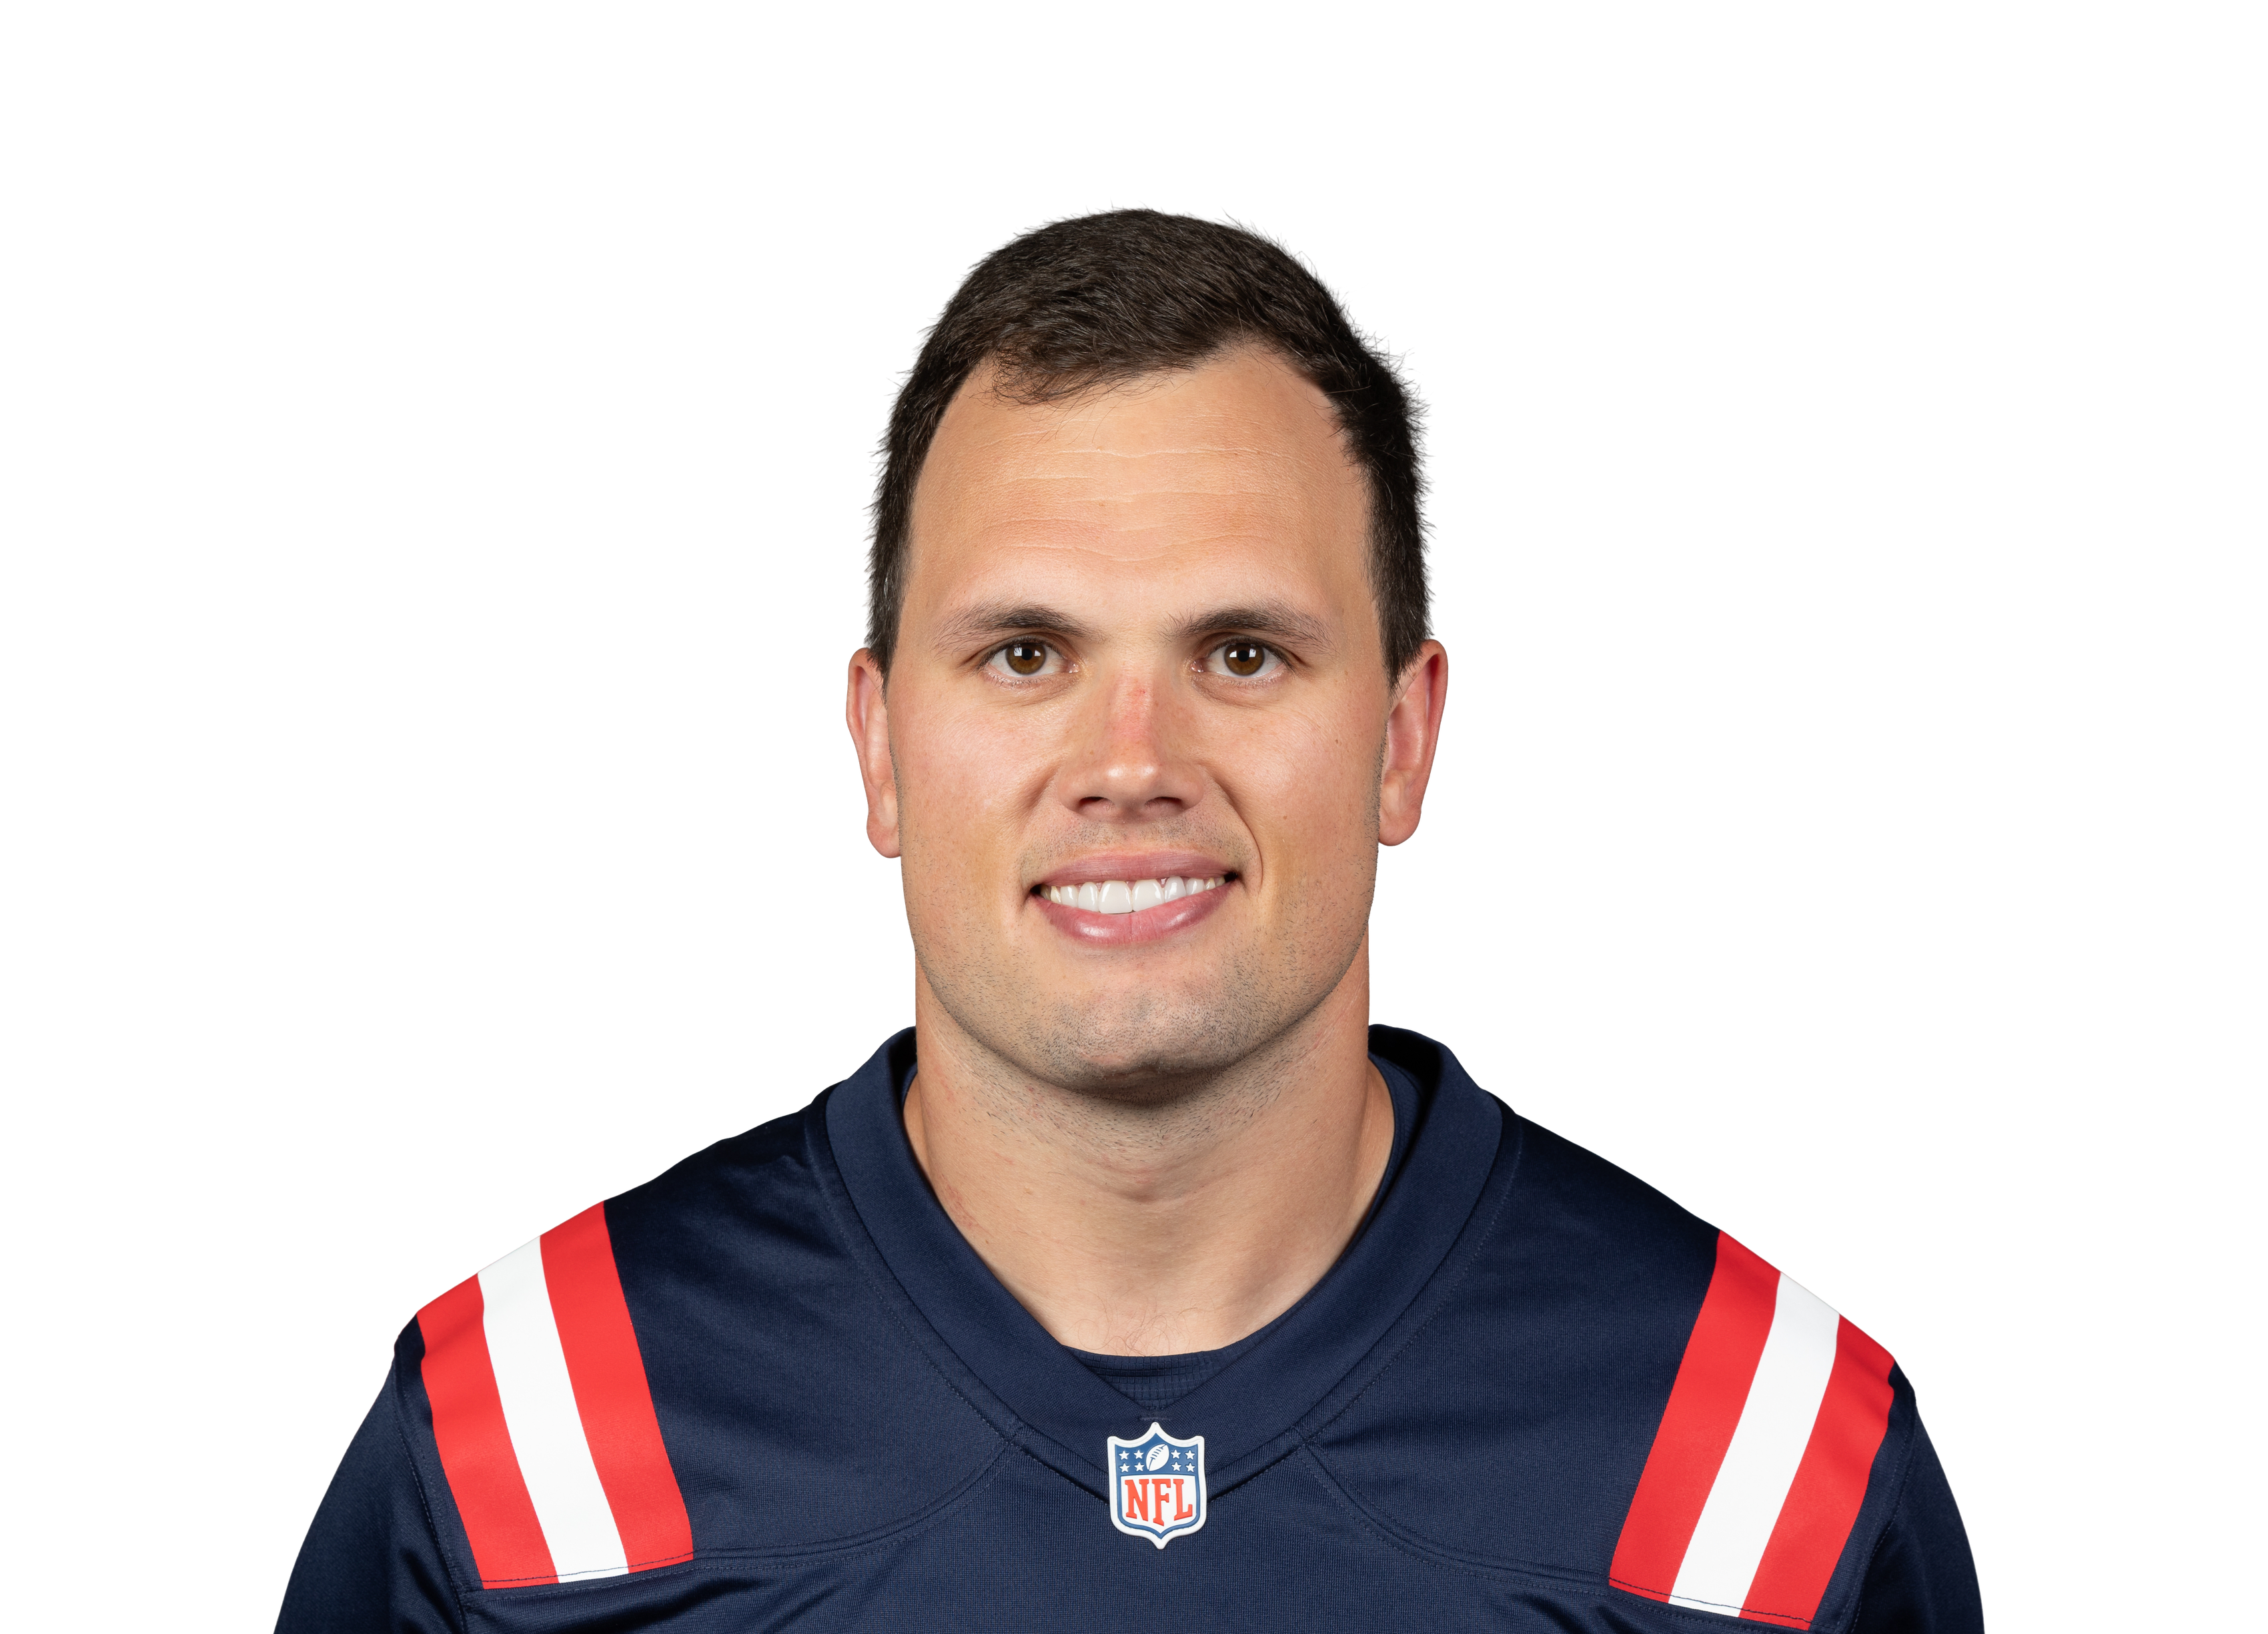 Hunter Henryvs NE • Wk 10 | 4.2 | 3 | 2 | 22 | 0 | 0 |
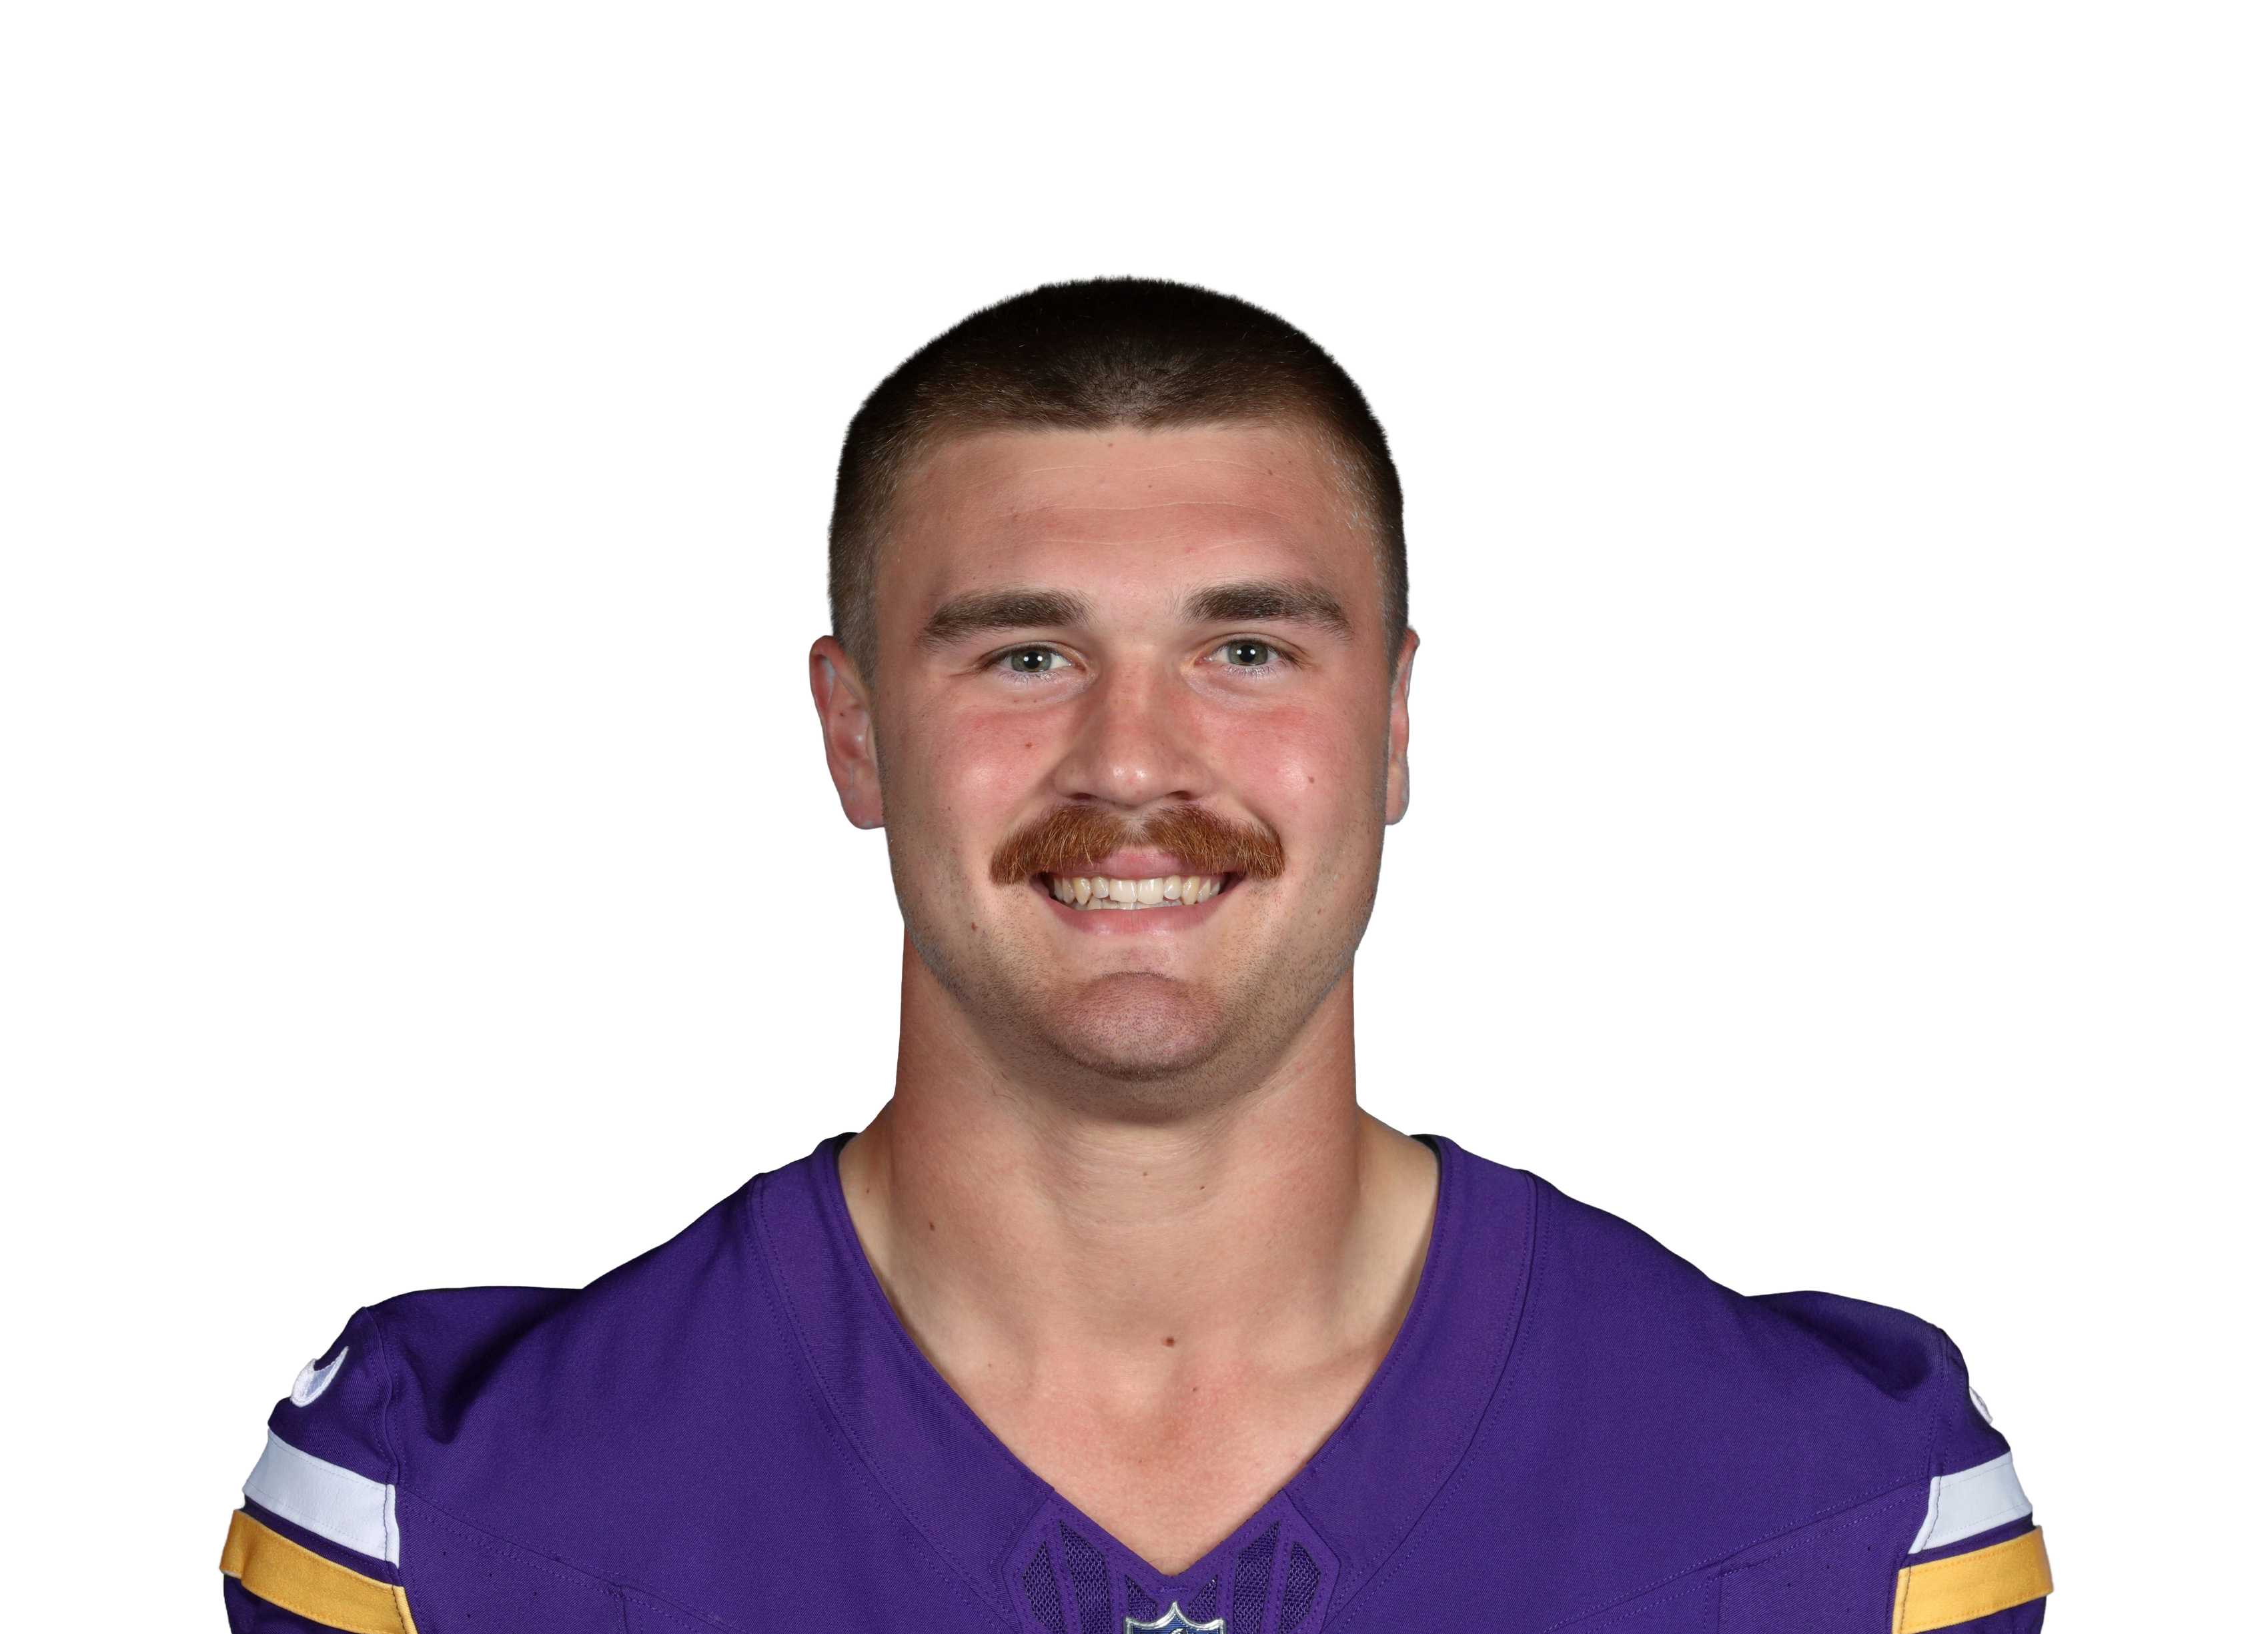 Ben Yurosekvs MIN • Wk 8 | 3.4 | 2 | 1 | 24 | 0 | 0 |
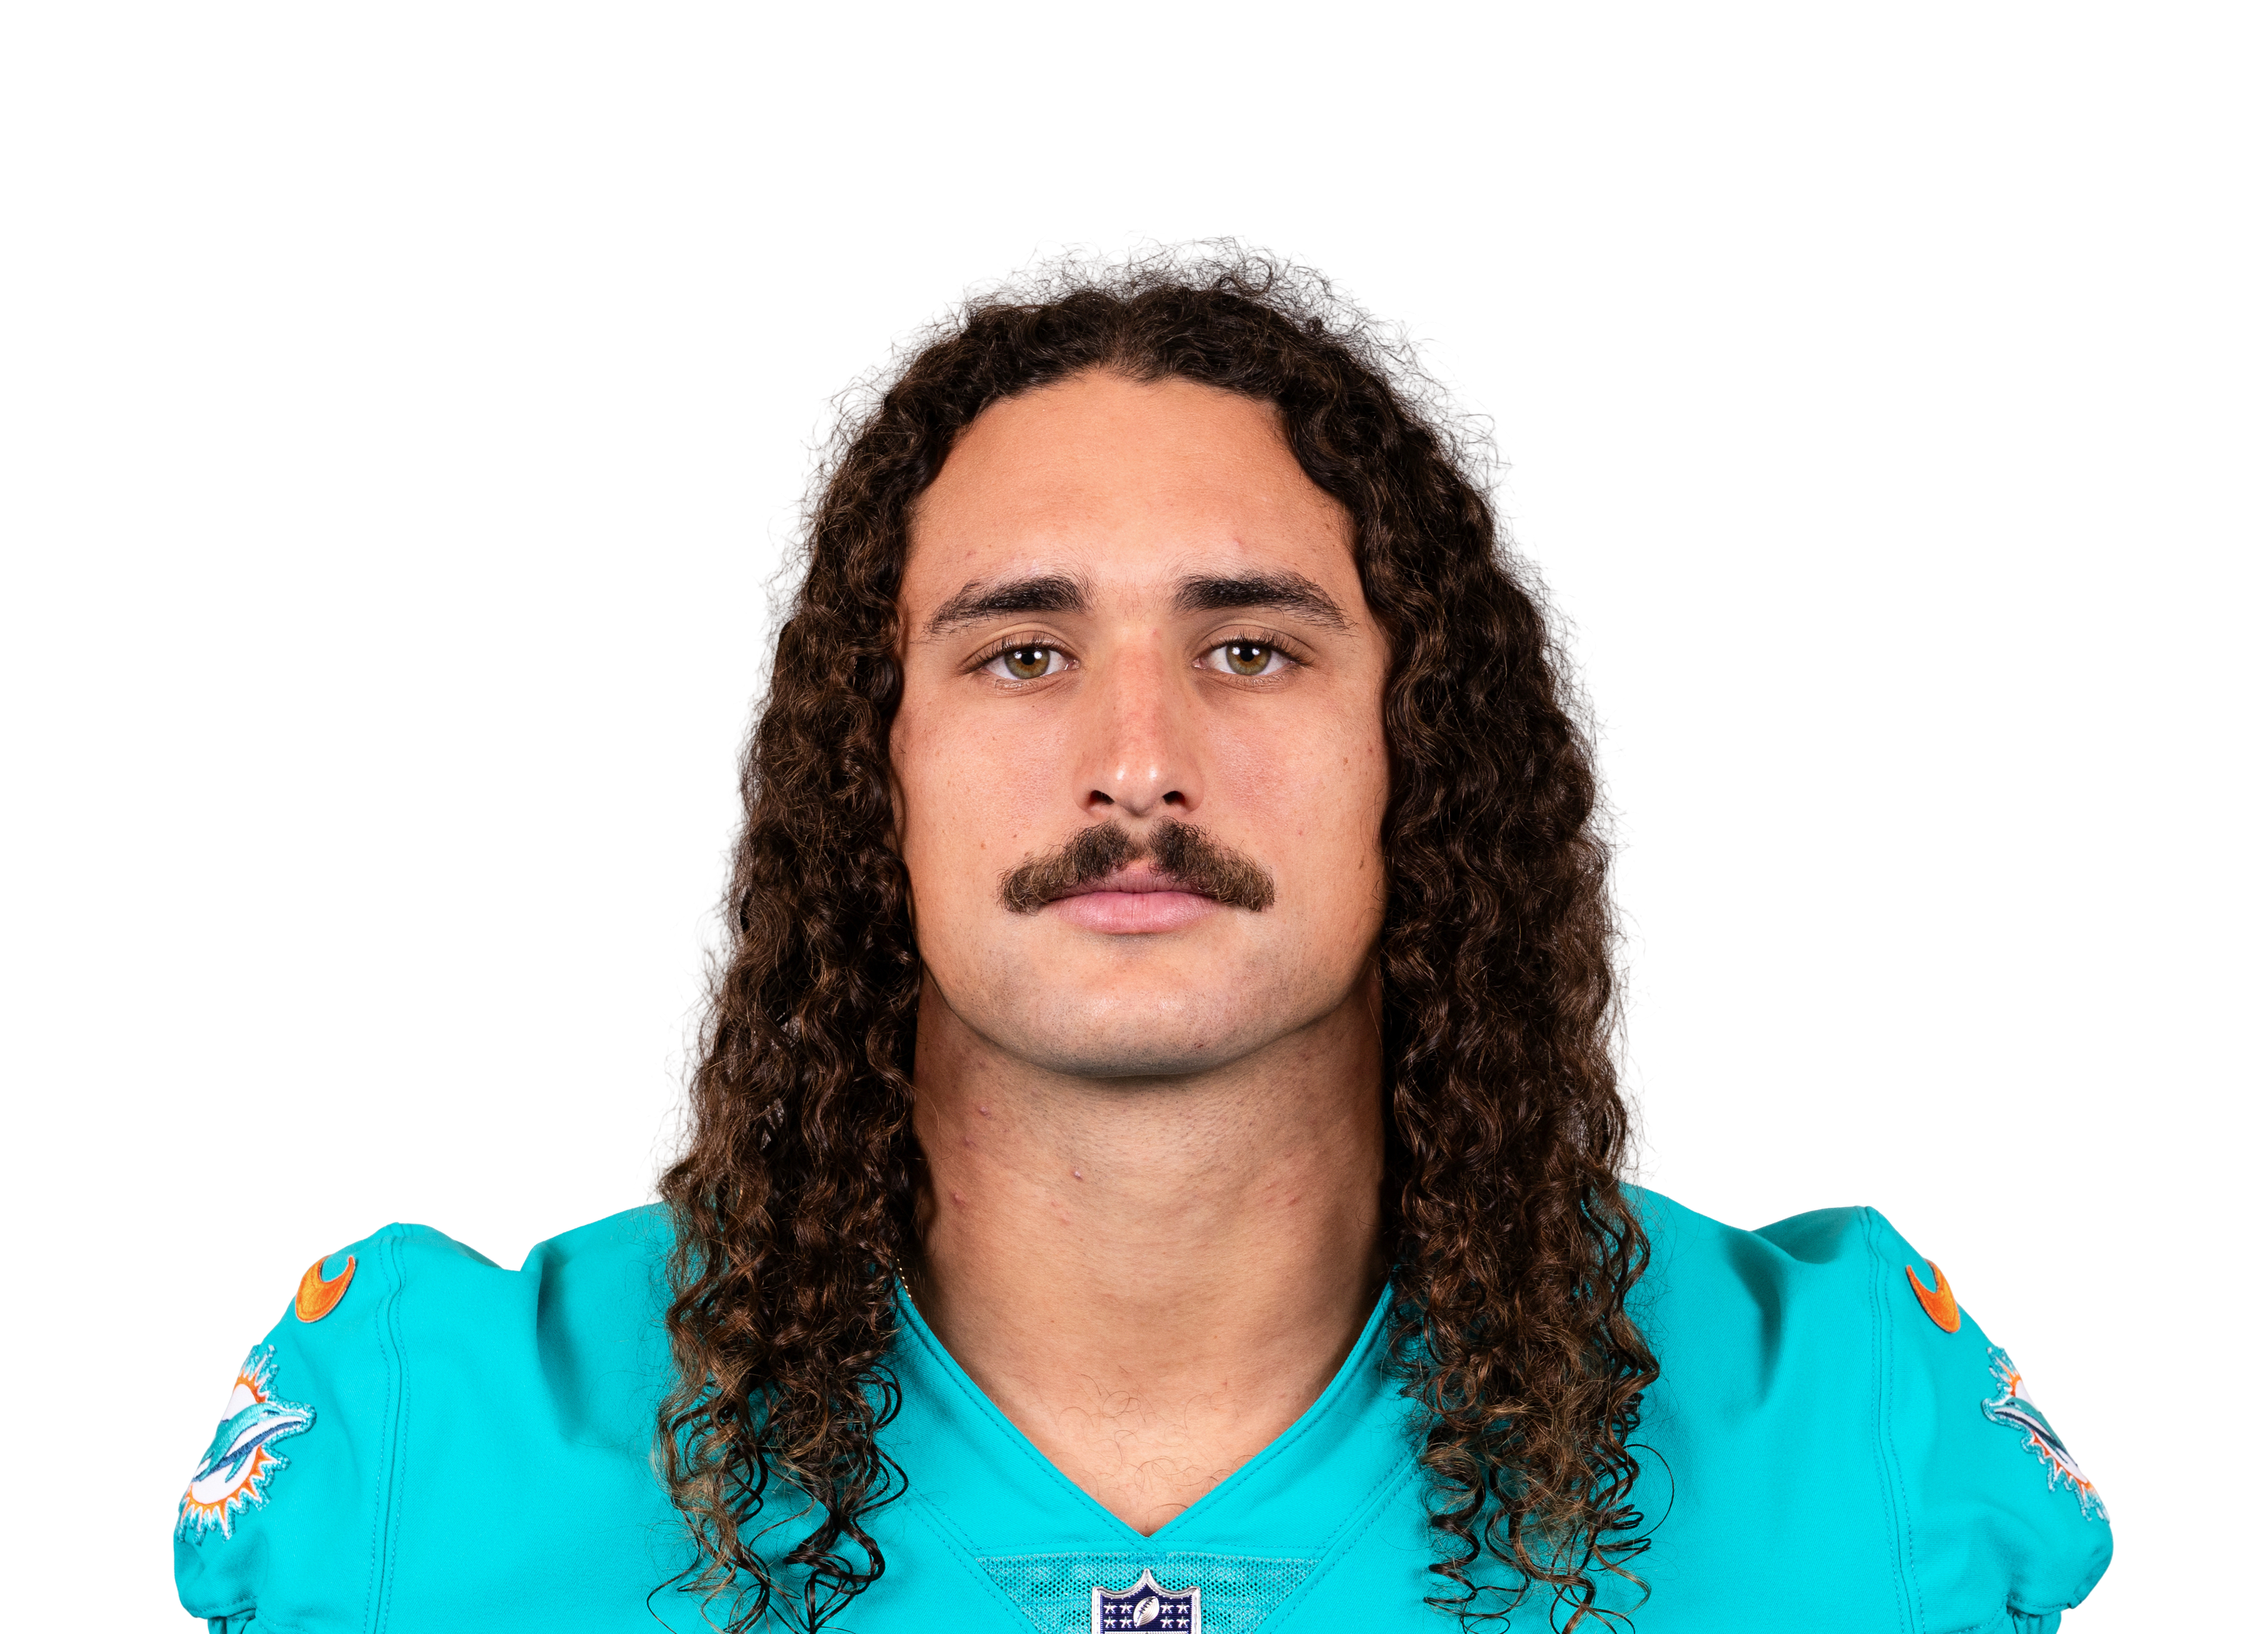 Greg Dulcich@ MIA • Wk 9 | 3.4 | 4 | 2 | 14 | 0 | 0 |
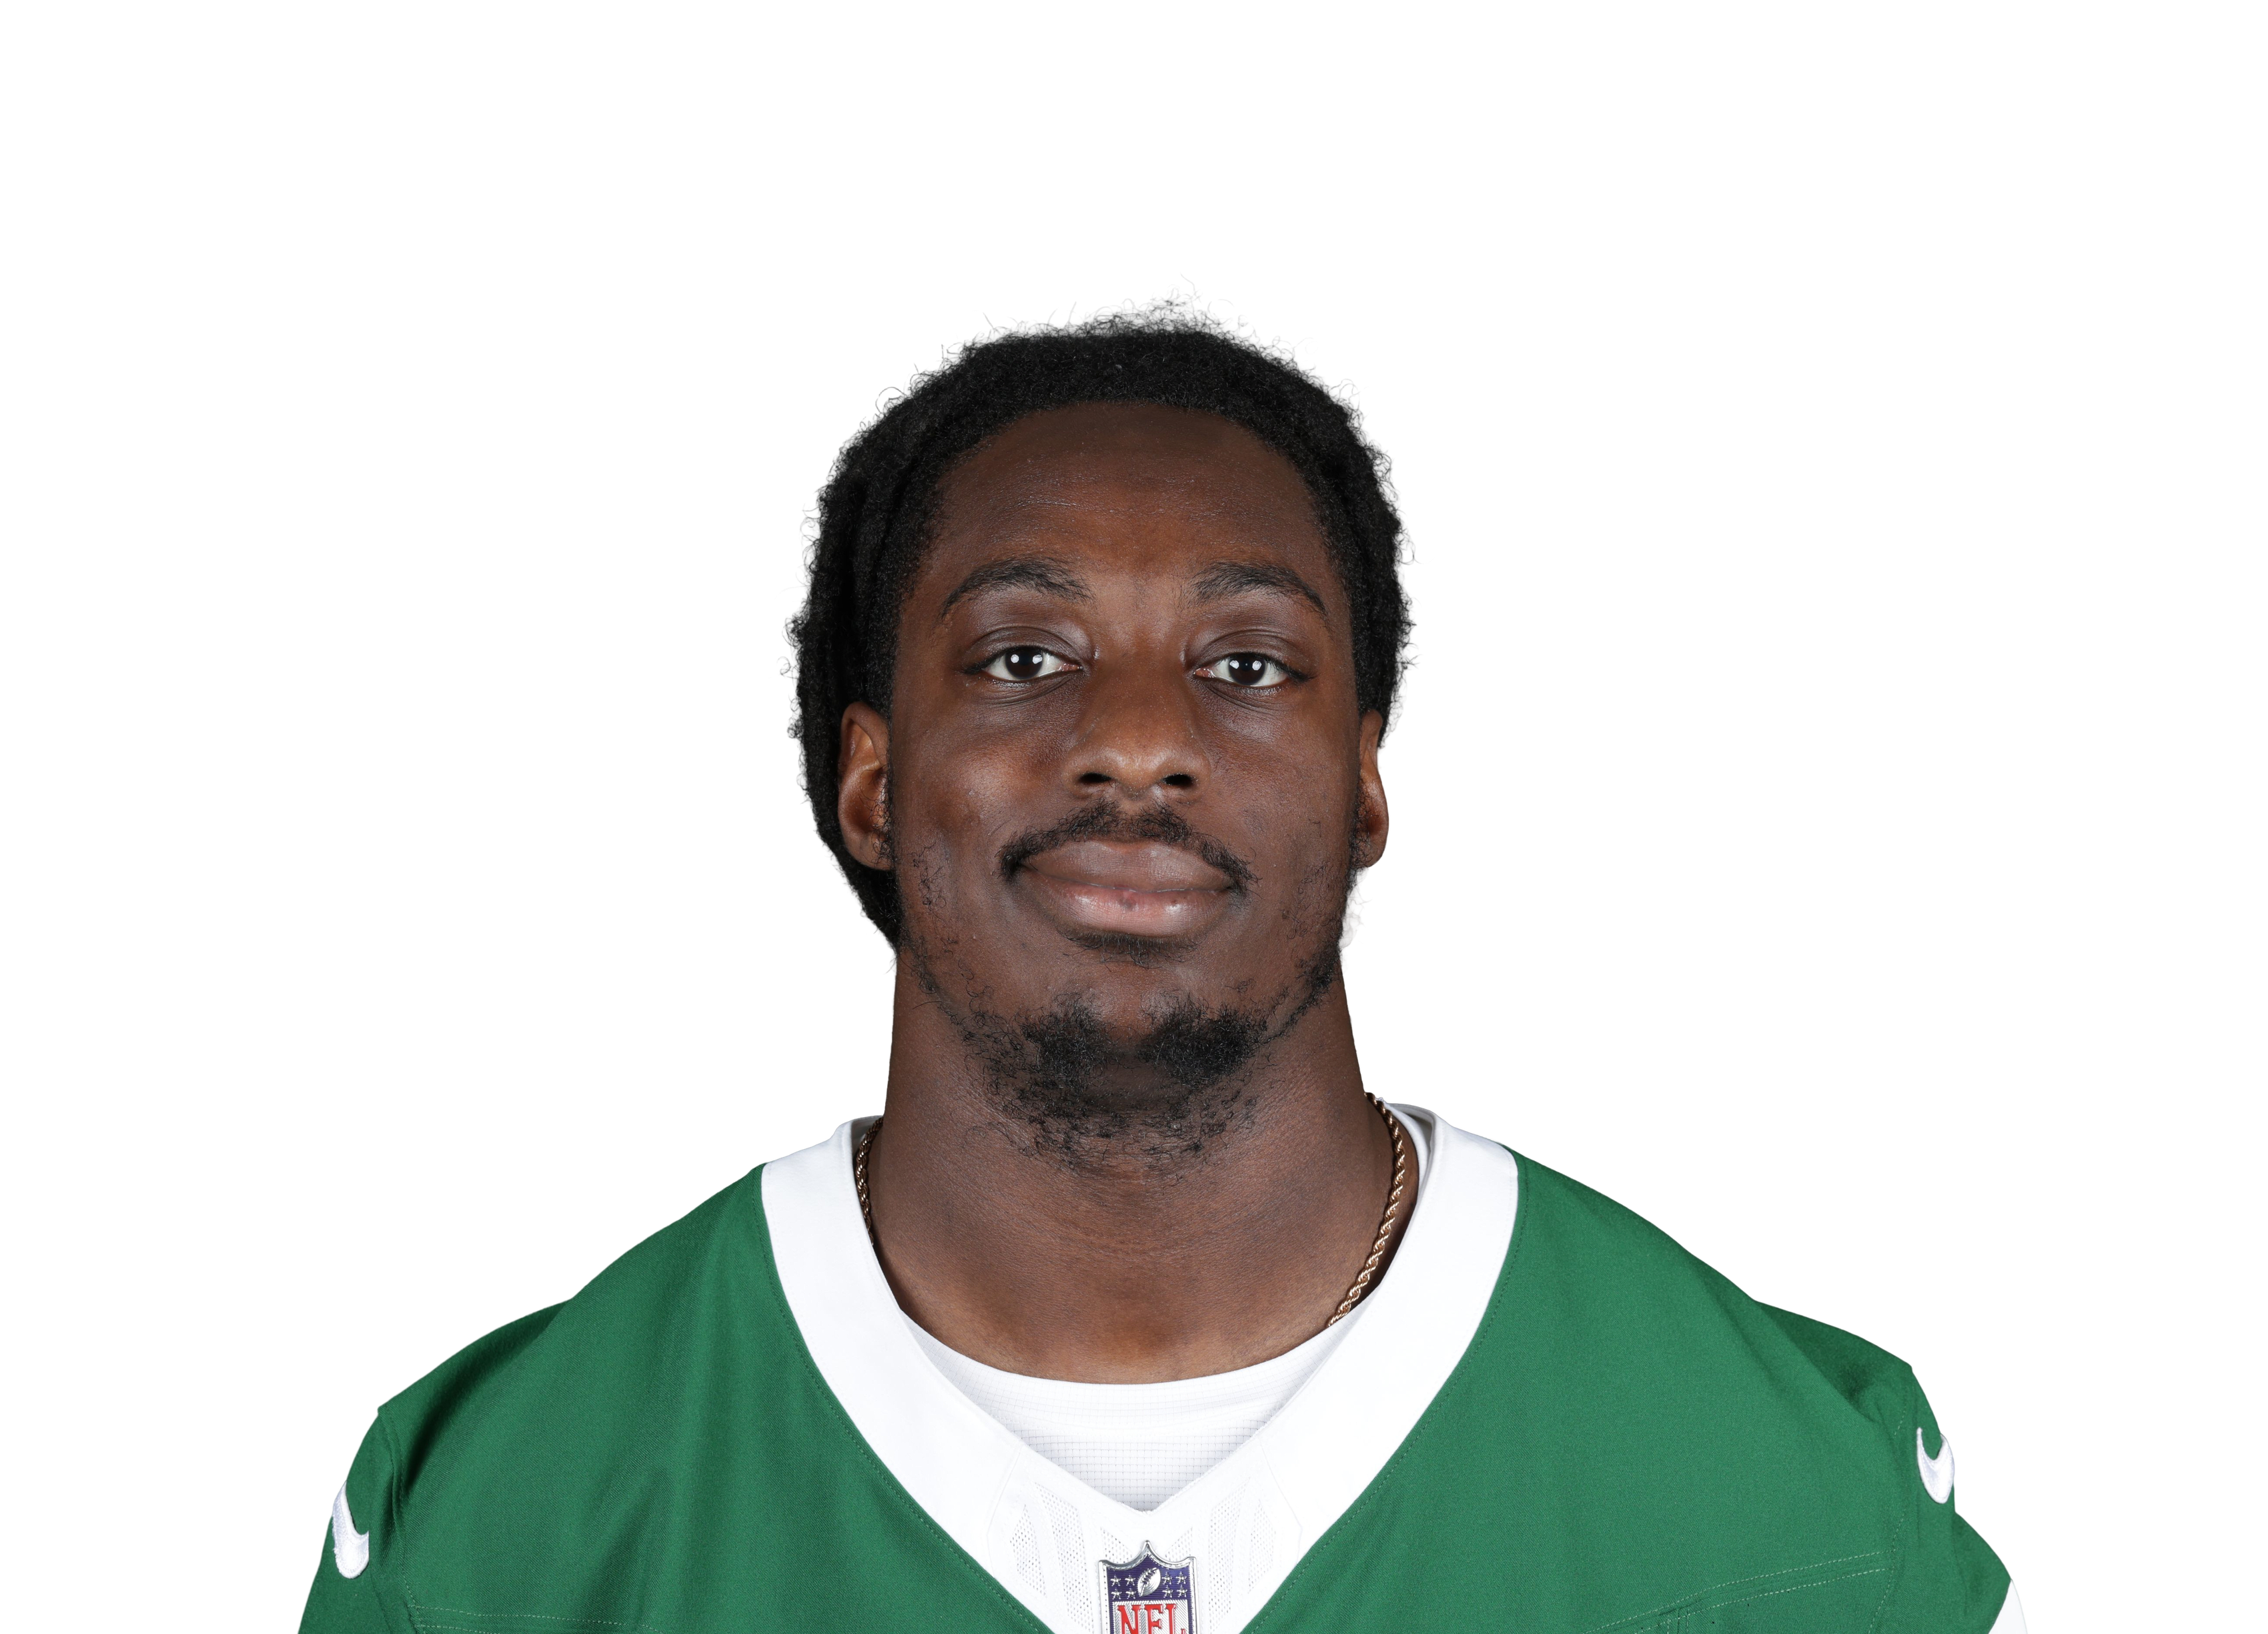 Jelani Woodsvs NYJ • Wk 3 | 3.0 | 1 | 1 | 20 | 0 | 0 |
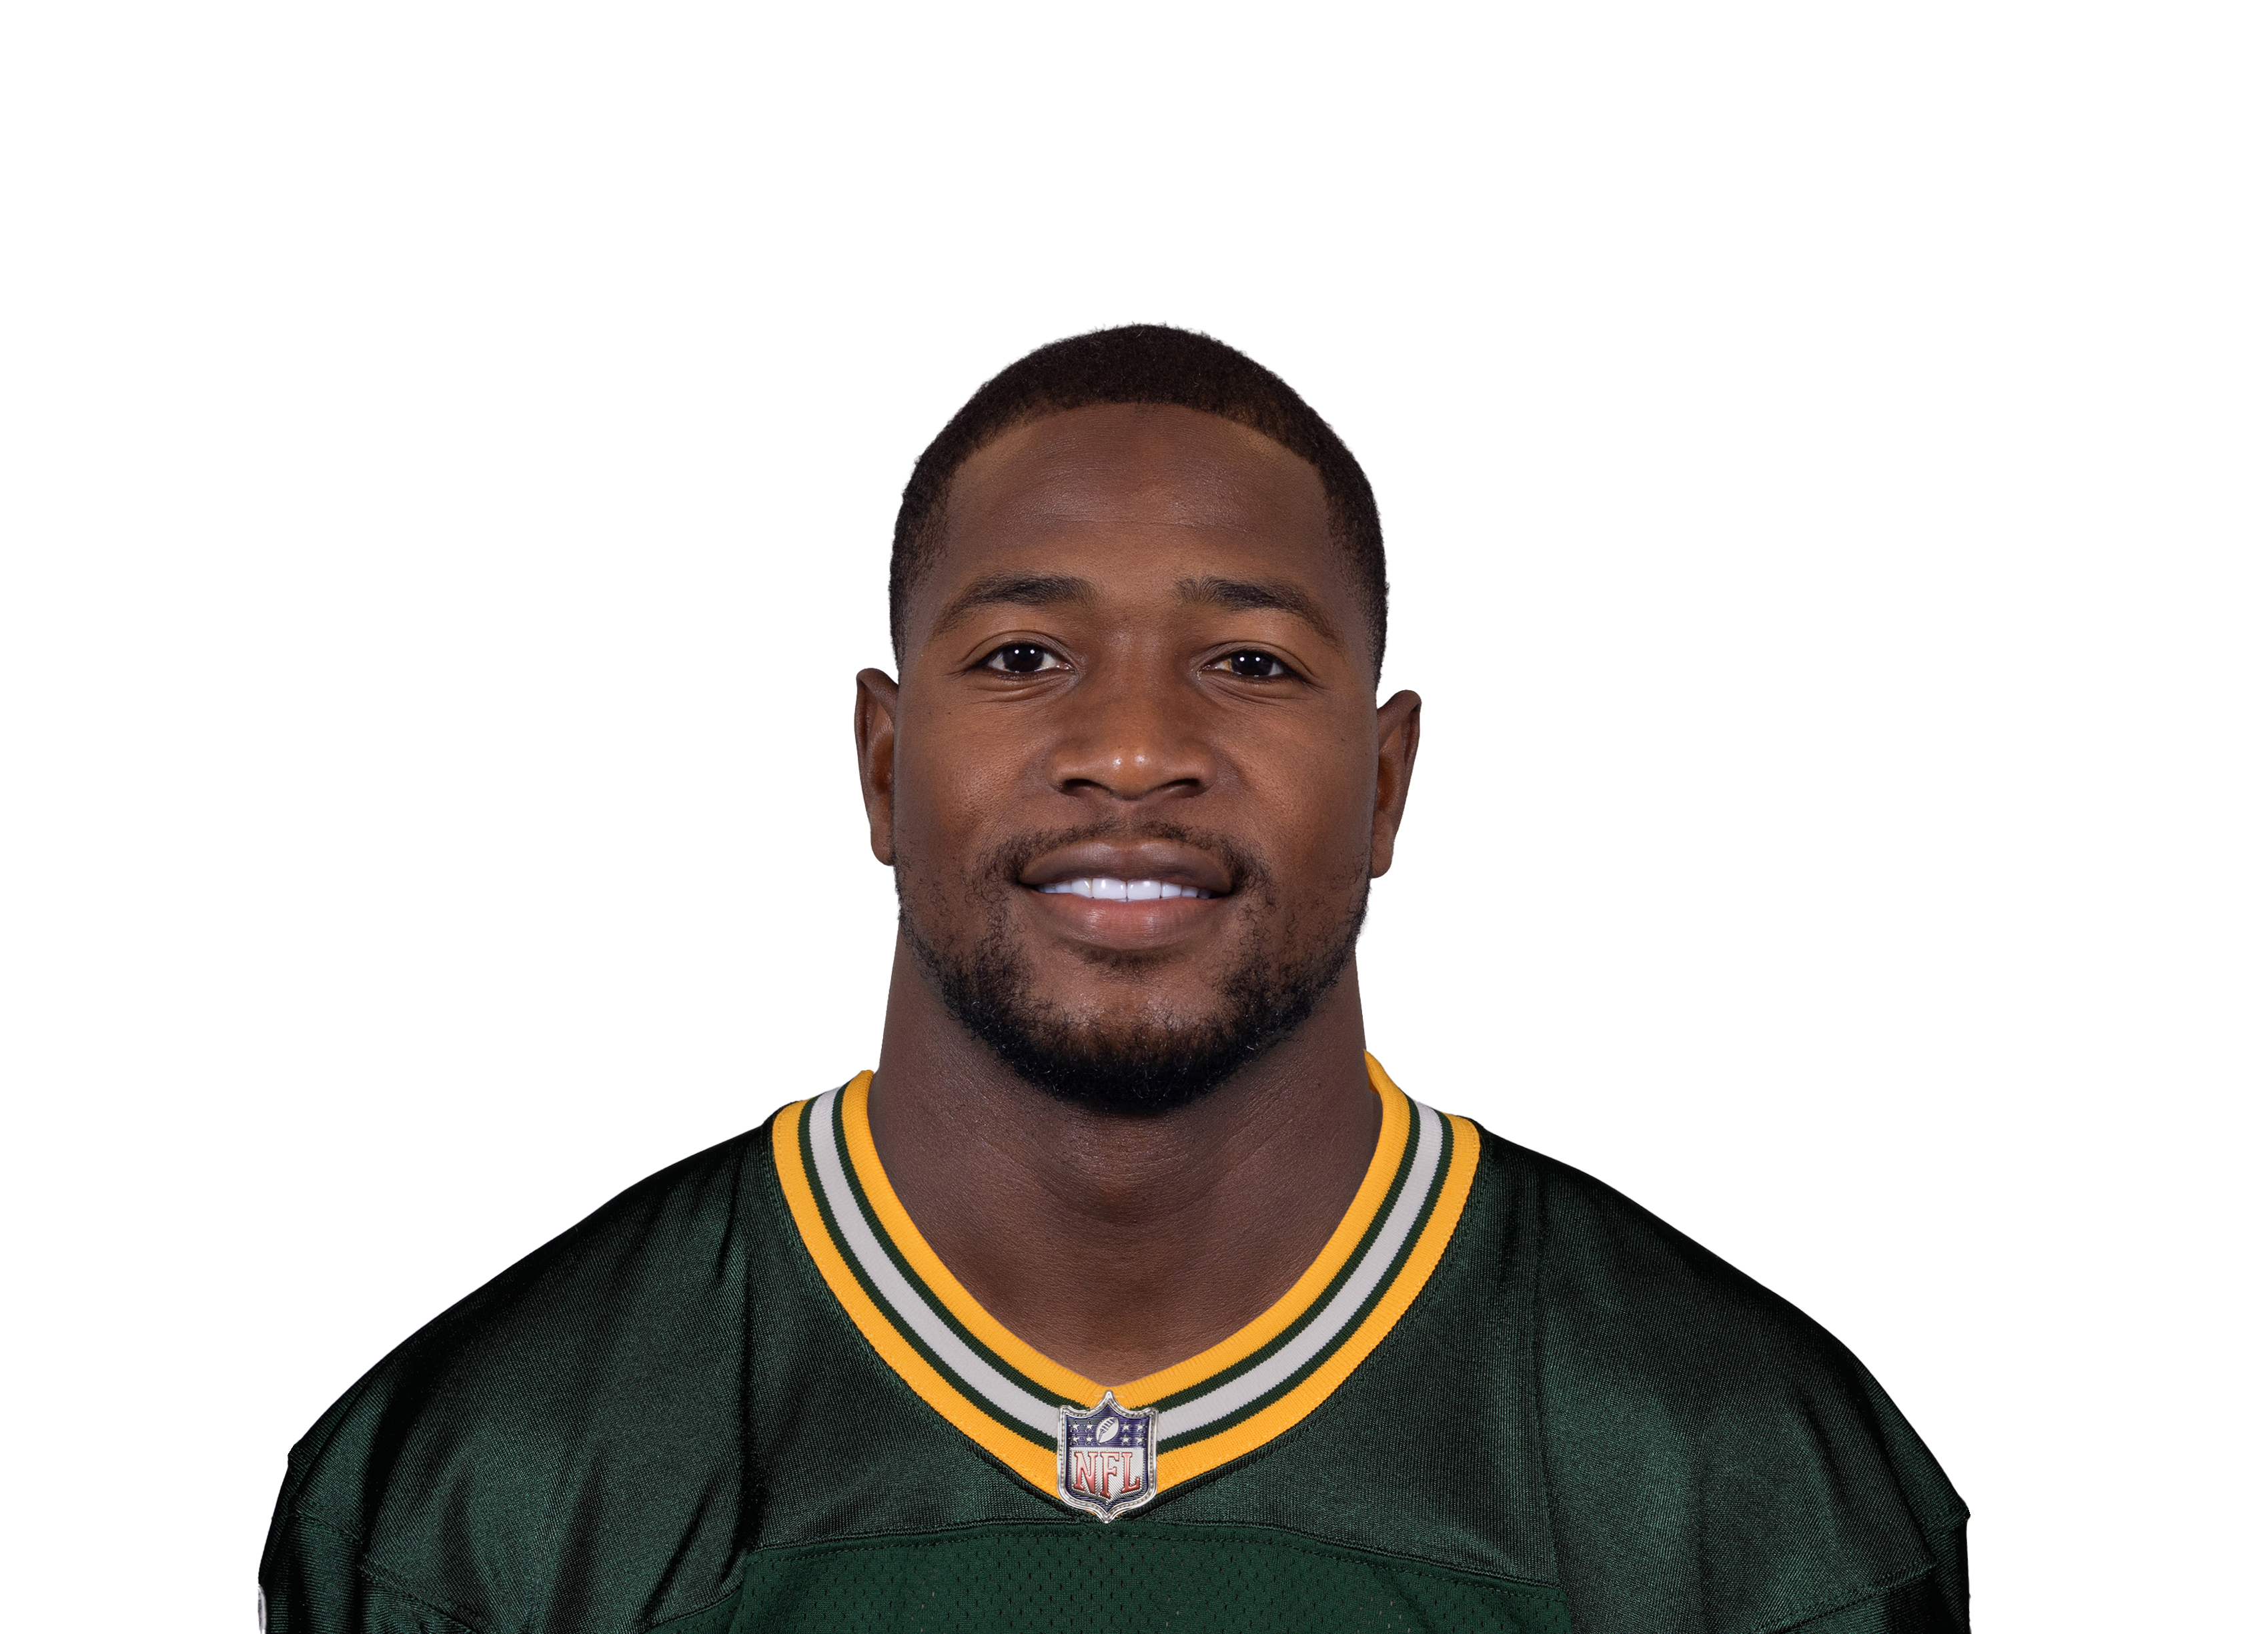 Jonnu Smithvs GB • Wk 7 | 1.9 | 1 | 1 | 9 | 0 | 0 |
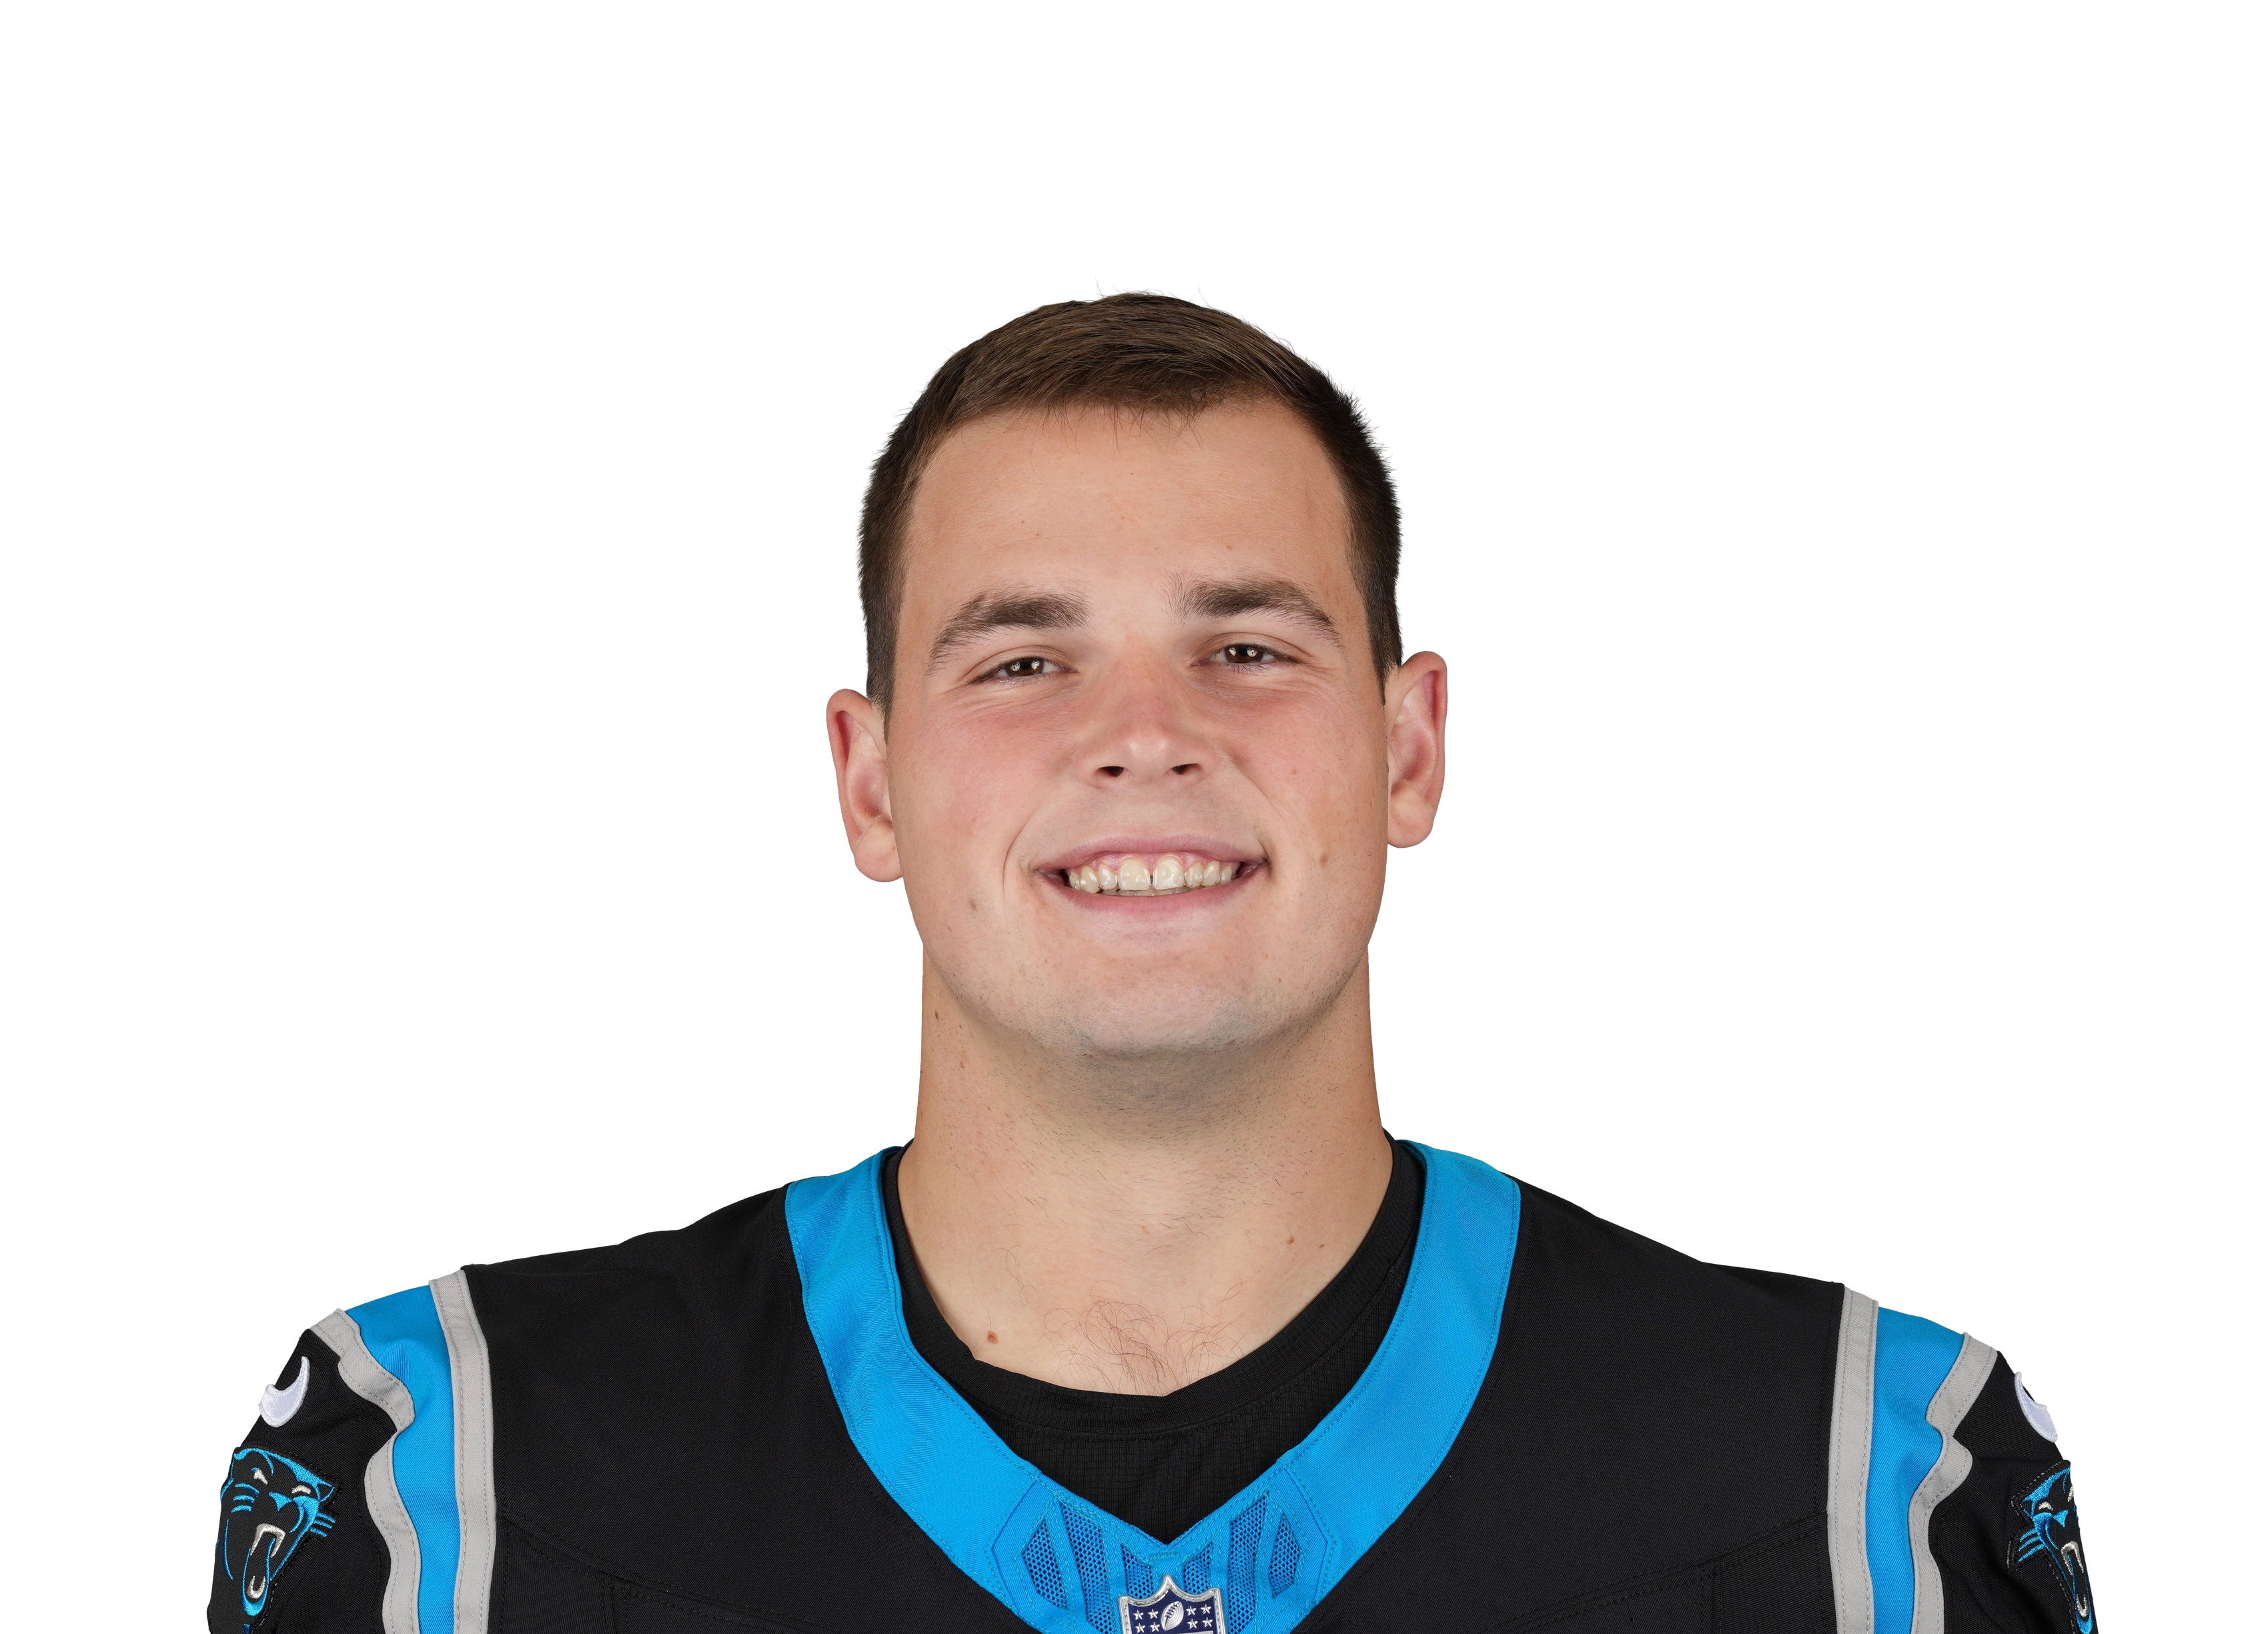 Mitchell Evans@ CAR • Wk 4 | 1.8 | 1 | 1 | 8 | 0 | 0 |
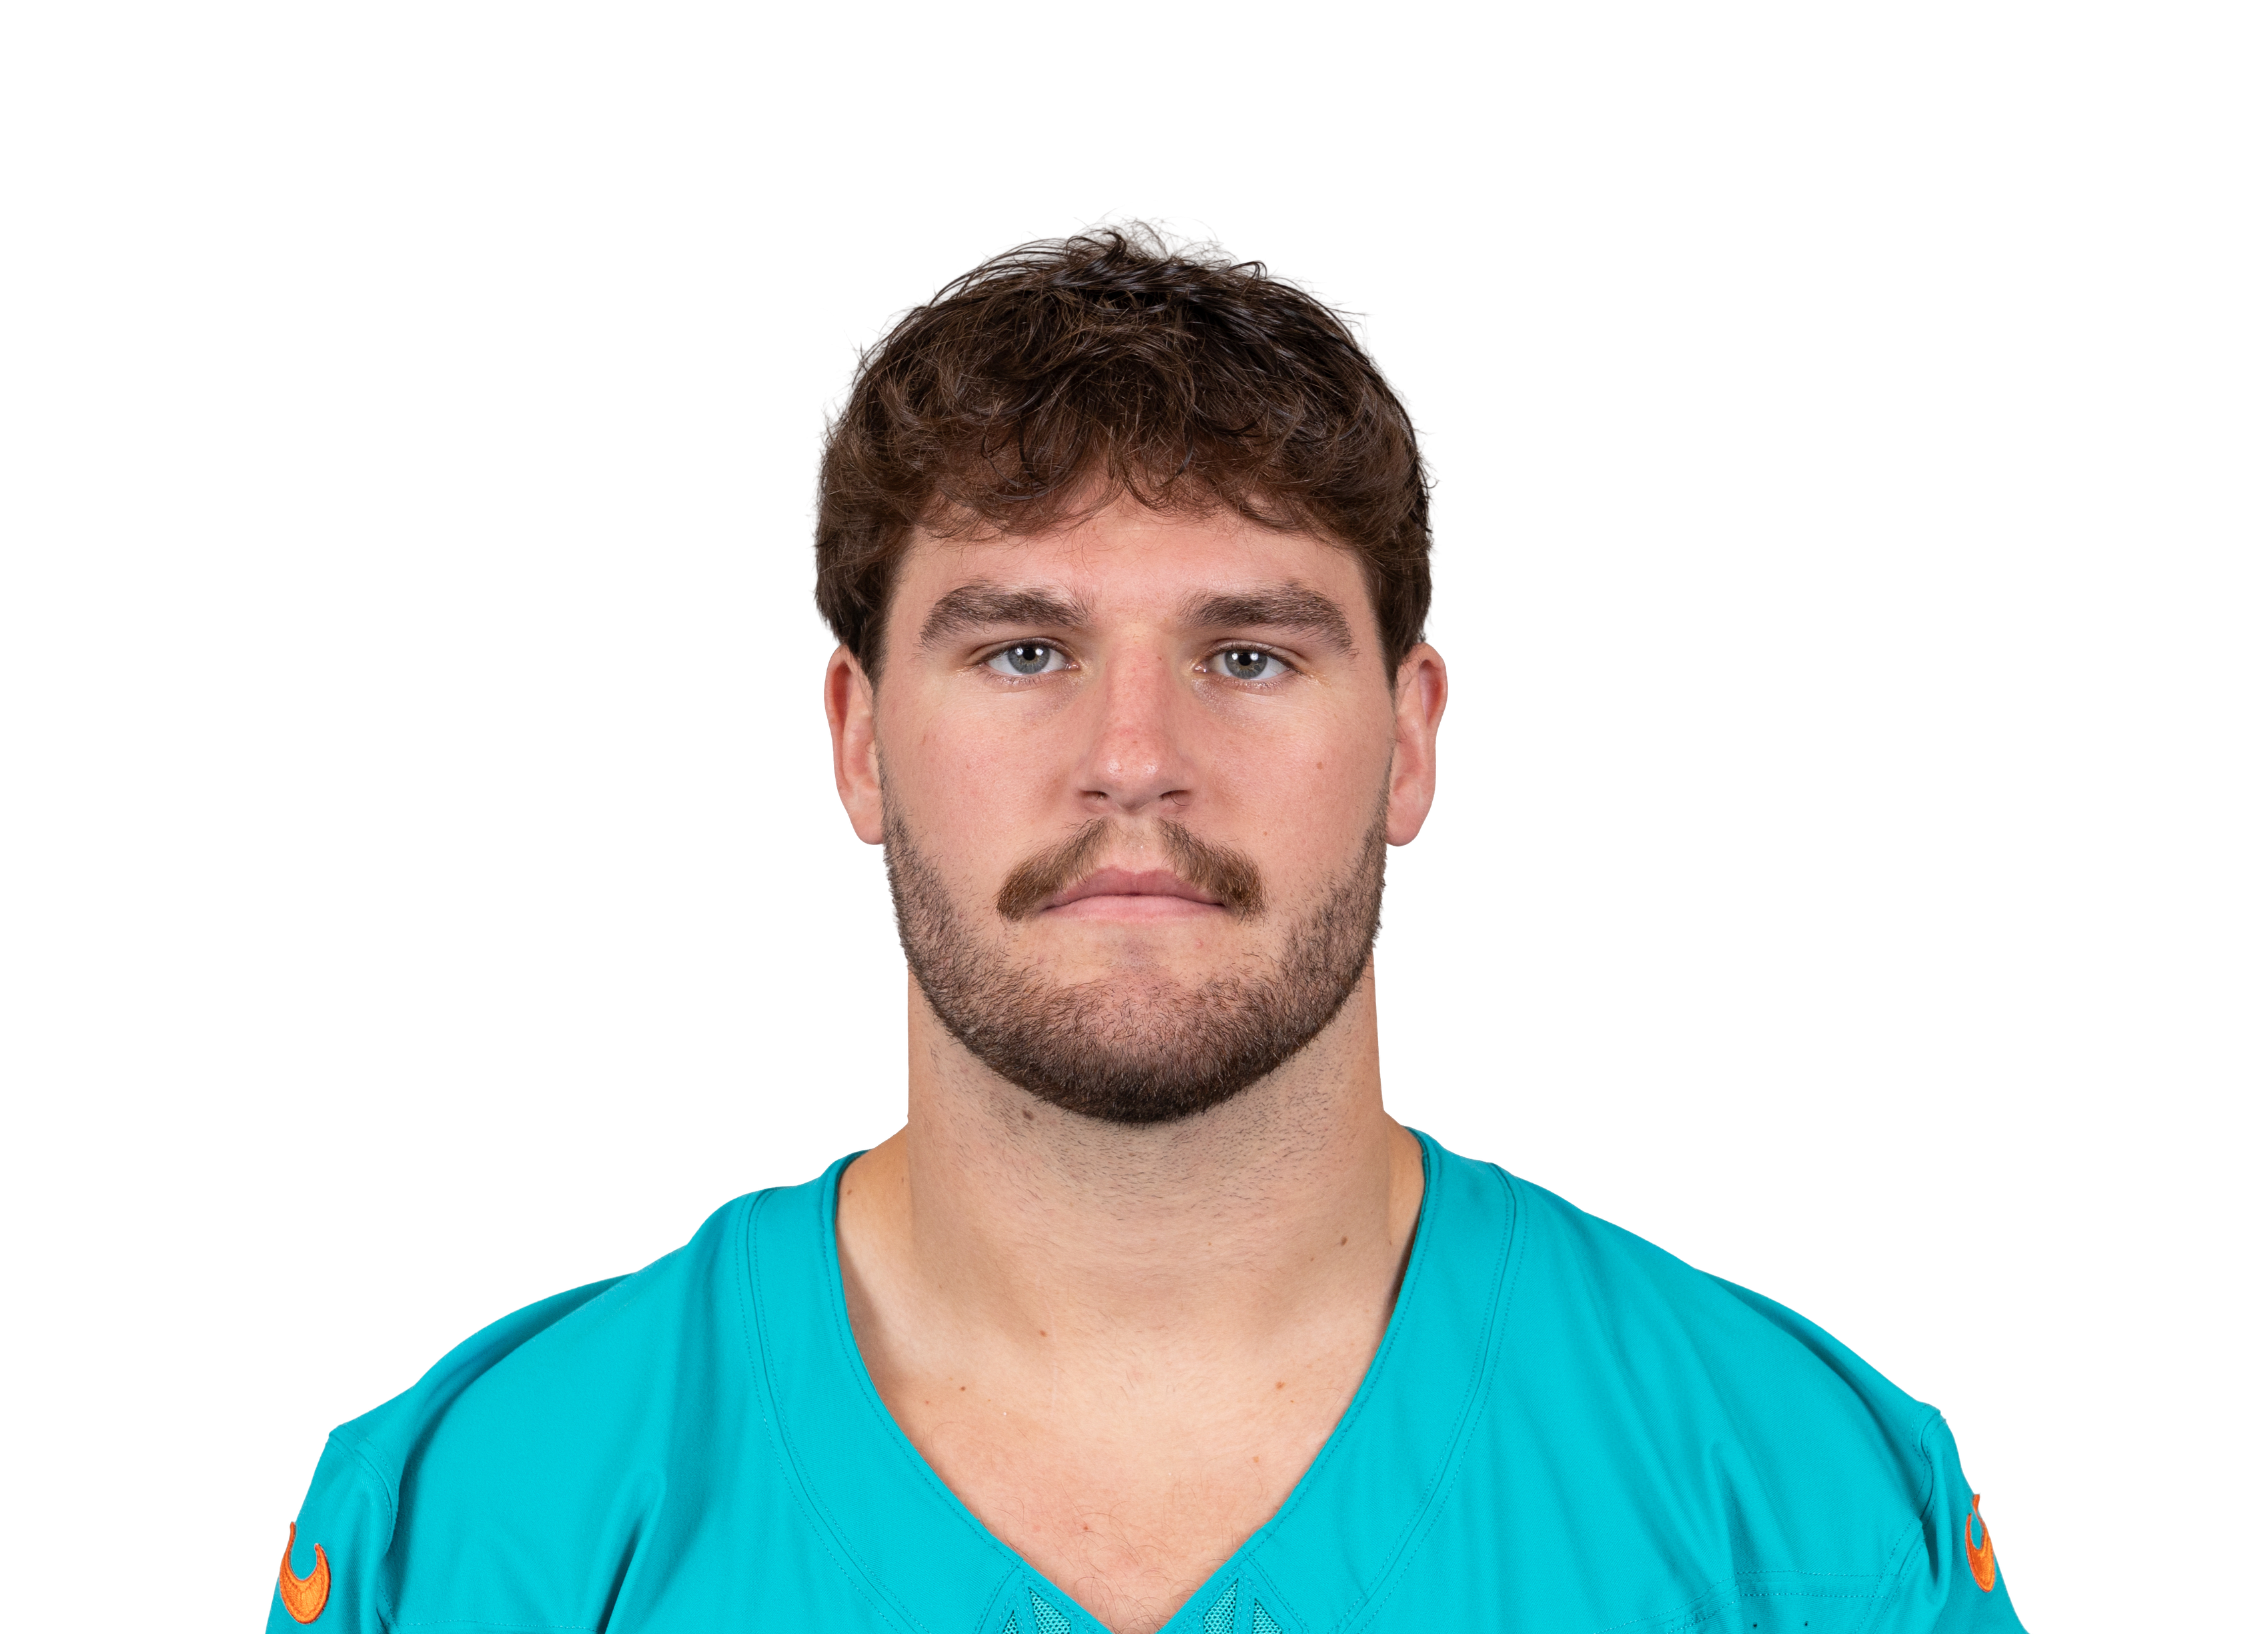 Will Kacmarek@ MIA • Wk 9 | 1.6 | 2 | 1 | 6 | 0 | 0 |
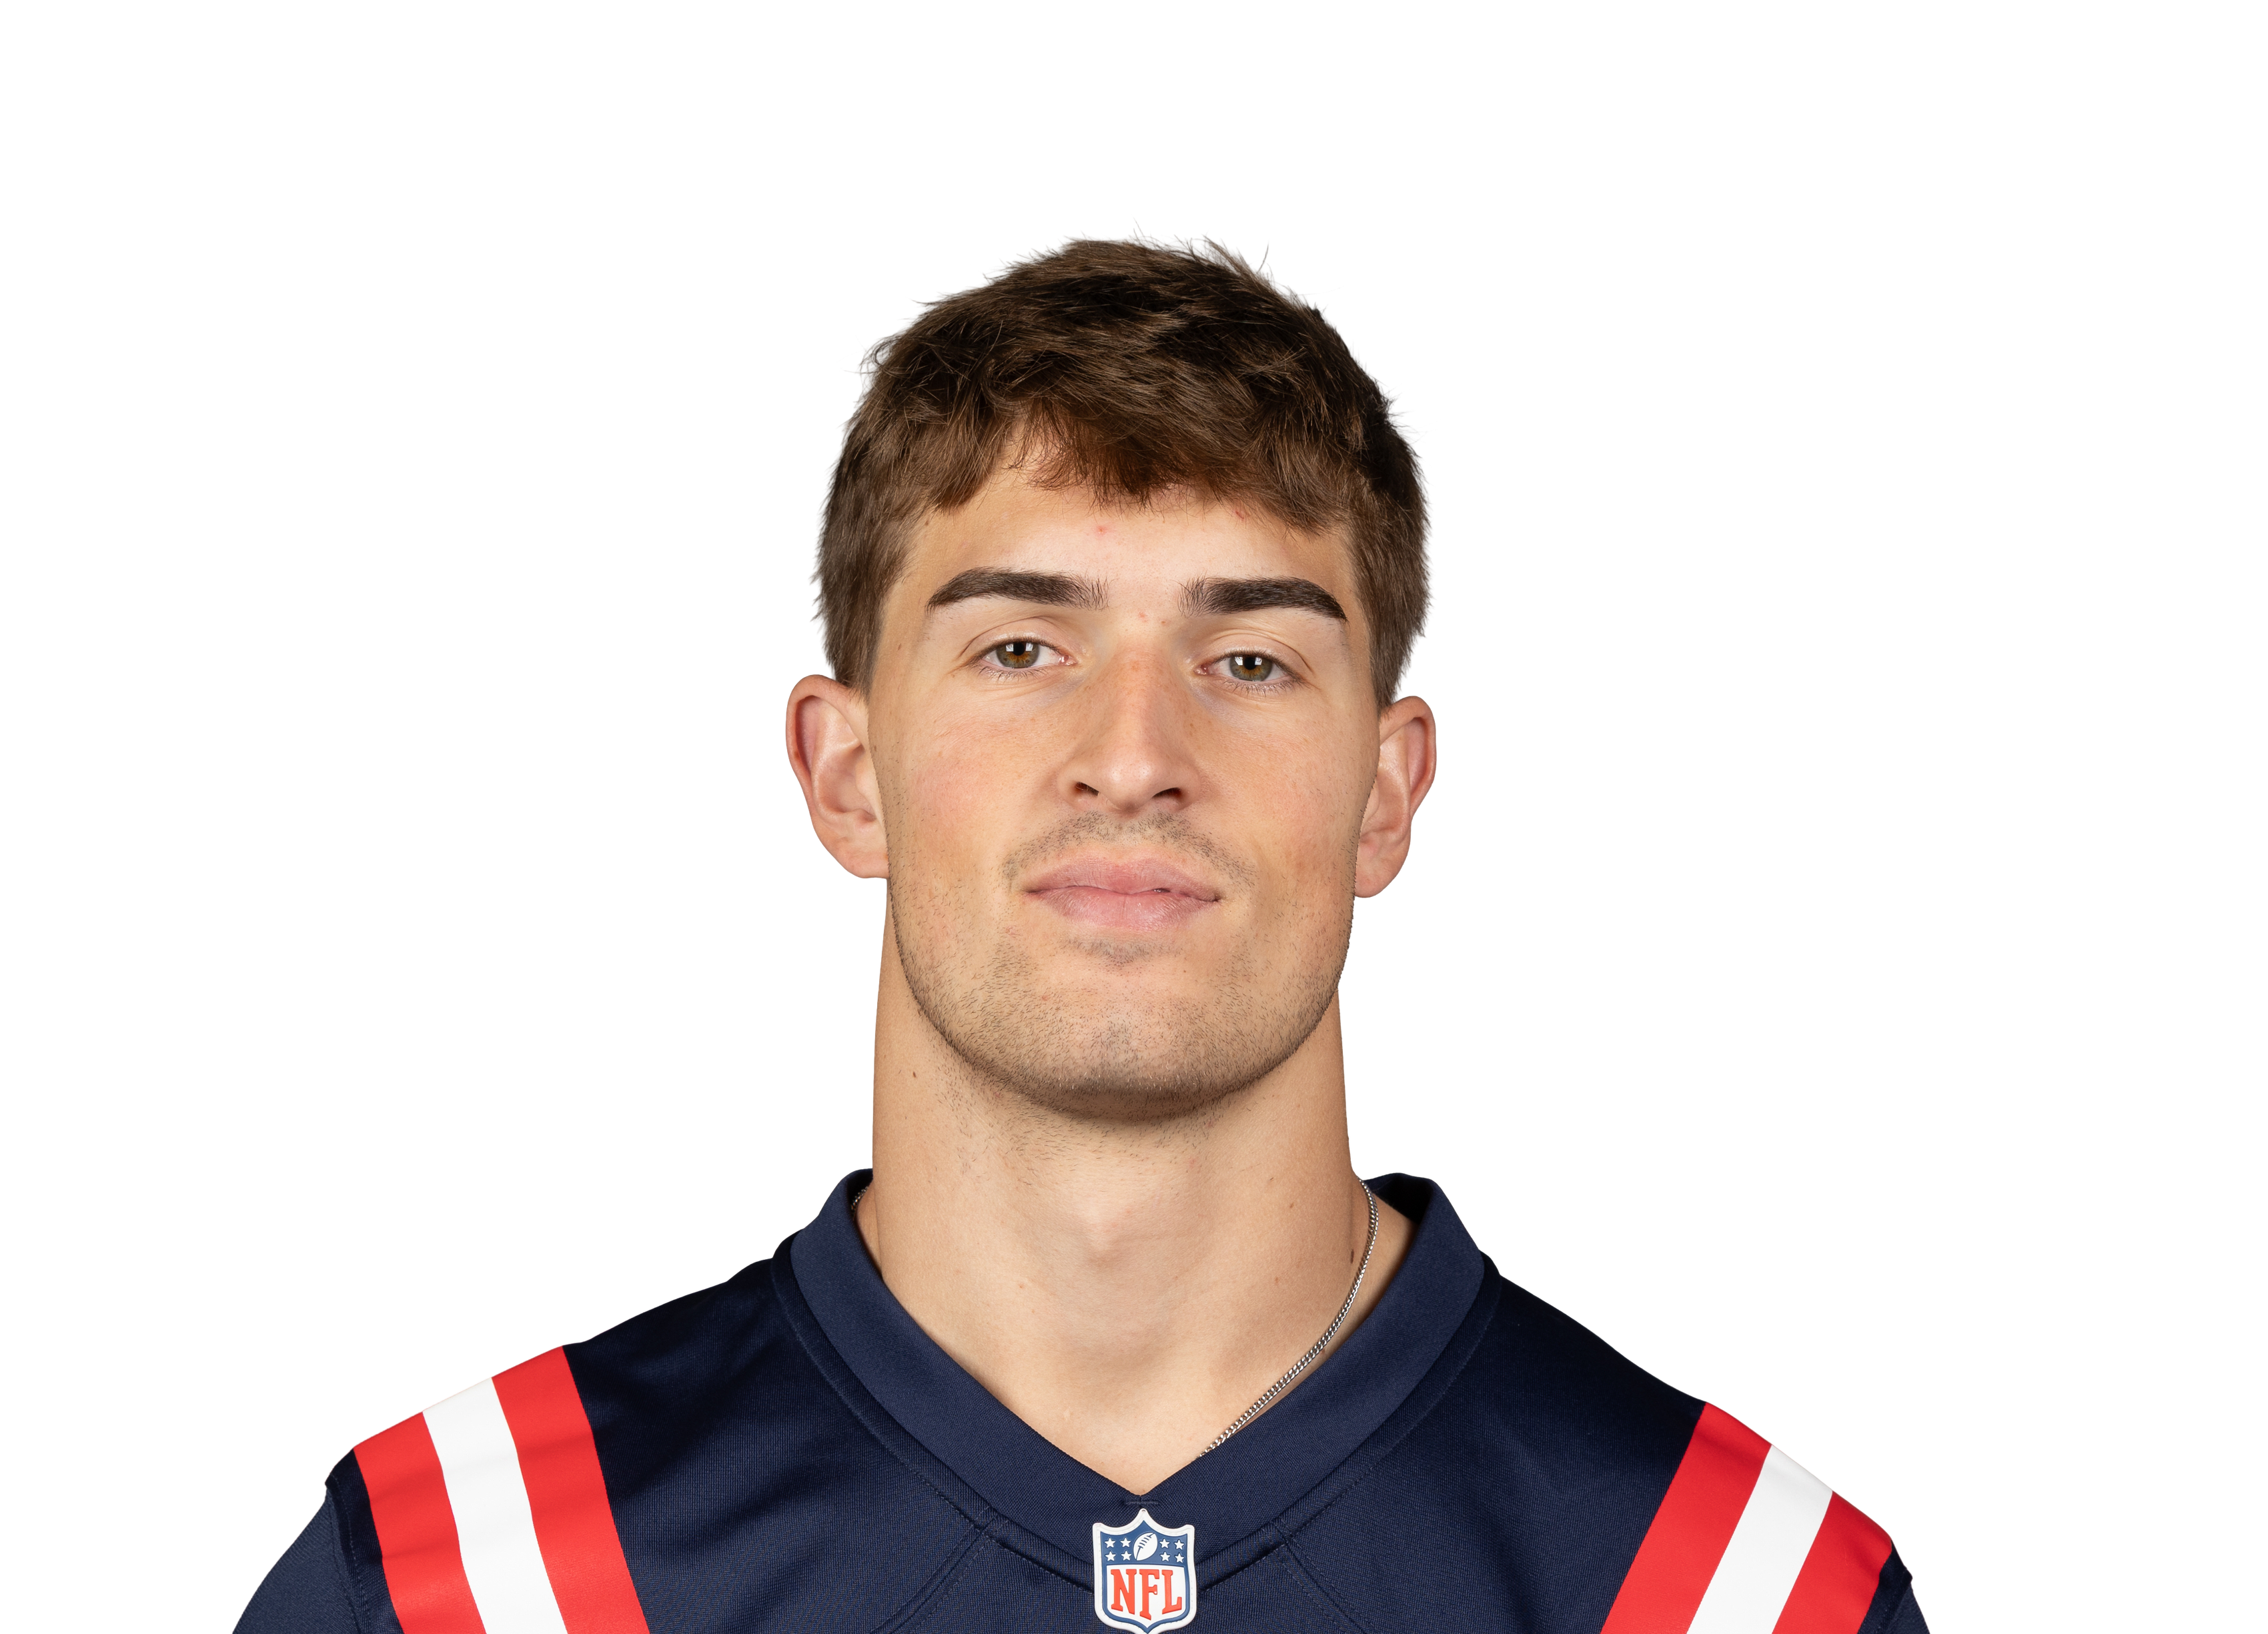 Eli Raridonvs NE • Wk 10 | 1.6 | 1 | 1 | 6 | 0 | 0 |
 Mark Redmanvs GB • Wk 7 | 0.0 | 1 | 0 | 0 | 0 | 0 |
Fantasy points first, then the stats that matter for his position. Ring around each photo is that player's Mania Rating. Tap a name to open his profile.
Usage
Snaps
40%
Target share
3%
Targets/G
0.7
PPR/G
0.6
By the numbers
PPR / Game
0.5
2nd percentileTE avg 5.9
Targets / Game
0.7
5th percentileTE avg 3.2
Receiving Yards / Game
1.8
2nd percentileTE avg 23.3
Receptions / Game
0.4
3rd percentileTE avg 2.3
Share of Team Targets
2.5%
5th percentileTE avg 10.4%
Share of Team Air Yards
1.1%
9th percentileTE avg 8.5%
Red-Zone Targets / Game
0
13th percentileTE avg 0.5
End-Zone Targets / Game
0
35th percentileTE avg 0.2
Snap Share
39.7%
17th percentileTE avg 56.9%
TDs / Game
0
34th percentileTE avg 0.2
TB TE room
C. Otton17%
P. Durham3%
B. Sharp0%
K. Kieft0%
Share of targets
TB TE room, week by week
Targets and receiving yards each week, with his share of the team targets and his snap percentage.
| Player | W1 | W2 | W3 | W4 | W5 | W6 | W7 | W8 | W9 | Per game |
|---|---|---|---|---|---|---|---|---|---|---|
| Cade Otton | 526 yds19% targets98% snaps | 638 yds18% targets89% snaps | 656 yds17% targets94% snaps | 637 yds23% targets95% snaps | 425 yds16% targets92% snaps | 24 yds5% targets100% snaps | 10 yds9% targets89% snaps | — | 825 yds27% targets100% snaps | 4.826 yds a game • 5.6 per target17% targets95% snaps |
| Payne Durham | — | — | 10 yds3% targets55% snaps | — | 15 yds4% targets38% snaps | — | — | — | 00 yds0% targets21% snaps | 0.72 yds a game • 2.5 per target2% targets38% snaps |
| Ko Kieft | — | — | 00 yds0% targets3% snaps | — | — | 00 yds0% targets0% snaps | 00 yds0% targets10% snaps | 00 yds0% targets0% snaps | 00 yds0% targets1% snaps | 0.00 yds a game0% targets3% snaps |
| Bauer Sharp | 00 yds0% targets2% snaps | — | 00 yds0% targets9% snaps | 00 yds0% targets6% snaps | 00 yds0% targets6% snaps | 121 yds2% targets5% snaps | 00 yds0% targets25% snaps | — | 00 yds0% targets12% snaps | 0.13 yds a game • 21.0 per target0% targets9% snaps |
Each cell is targets that week, with receiving yards, share of team targets and snap percentage. Click a name to open that player.
Game log
Games3
PPR/G0.6
Game log
Durham avg 0.5NFL top 12 TEs avg 13.3
Solid dot is what he scored. Hollow dot is our projection before the game.
| Use | Game | Proj | PPR | Tgt | Rec | Rec Yd | Car | Rush Yd | TD | Snap |
|---|---|---|---|---|---|---|---|---|---|---|
W3 vs MIN | 1.3 | 0 | 1 | 0 | 0 | 0 | 0 | 0 | 55% | |
W5 vs DAL | 2.2 | 1.5 | 1 | 1 | 5 | 0 | 0 | 0 | 38% | |
W9 vs CHI | 1.5 | 0 | 0 | 0 | 0 | 0 | 0 | 0 | 21% |
Opponent color:Easy defense for TEsAverageTough
Schedule ahead
11 DET12 CAR13 LAC14 BAL15 NO16 ATL17 LA18 NO
Green easier, red tougher
Schedule ahead
Colored by what each defense has given up to TEs so far. Green is an easier matchup, red is a tougher one.
Wk 11 DETWk 12 CARWk 13 LACWk 14 BALWk 15 NOWk 16 ATLWk 17 LAWk 18 NOSee every team's TE schedule ›
StatPer gameSeasonRank
Overall
Games—312›
PPR points0.61.55›
Receiving
Targets0.725›
Catches0.416›
Receiving yards1.852›
Yards per target2.5—6›
Rushing
Scrimmage yards1.852›
Usage
Snap %40%—17›
Target share %2.5%—5›
Touch share %1.2%—5›
Air yards share %1.1%69›
Tap any stat to see everyone ranked. Bars: green top 30%, yellow middle, red bottom 40%.
38.2
Mania Rating
Overall profile • Depth
38.1
Week 11 Rating
Start value vs DET
Payne Durham
TB • TE • 3 games#478 OverallTE100#2 TE on TBDepth TE2 ›Age 26
Week 11 projection 0.8 PPR ›
TE78 this week
Games counted
Untick or tick any game and Mania Rating, matchup and Week 11 Rating all recalculate. Official Mania Rating 38.2.
Mix and match games
Pick a teammate with or without. Pick more than one to combine them, like a game without the QB and without the other back.
Mayfield QB ✓ current
Daniels QB
Hurst WR
Teammate injuries shift his Week 11 Rating1 teammate note ▾
Baker Mayfield (QB, Questionable) -0.6 • passing game takes a hit
Injury report updated Sat Nov 21, 6:30 AM ET
Week 11 Rating = recent role + opponent + the latest injury report (updated Sat Nov 21, 6:30 AM ET). Check final inactives before you set your lineup.
Week 11 projection
0.8
projected points
Floor 0.1 · Ceiling 4.3
-0.5Game script
+0.2Matchup
-0.1Injuries
Week 11 projection
TBVSPPR
DETEasy matchup • DET is #1 in points allowed to TEs
0.8
projected pointsReceiving 0.6 targets, 0.4 catches, 4 yds • 0.04 TD
Floor 0.14 of 5 games land hereCeiling 4.3
Vegas lines included. From usage alone: 0.7. Sportsbook lines imply 0.9. Blended: 0.8. Right now he is in line with the sportsbooks.
-0.5Game script
+0.2Matchup
-0.1Injuries
How this is built
Recent and last-season usage, the Vegas spread and total, how this defense treats his position, and the injury report (teammates out, QB out). The three boxes show how many points each moved it. When sportsbook player lines are posted (Wednesday to Sunday) they are blended in, leaning on them most for new starters and players with few games. PPR scoring only. Tested on past seasons it is about 5% closer than a plain season average.
TB TE room
C. Otton17%
P. Durham3%
B. Sharp0%
K. Kieft0%
Share of targets
TB TE room, week by week
Targets and receiving yards each week, with his share of the team targets and his snap percentage.
| Player | W1 | W2 | W3 | W4 | W5 | W6 | W7 | W8 | W9 | Per game |
|---|---|---|---|---|---|---|---|---|---|---|
| Cade Otton | 526 yds19% targets98% snaps | 638 yds18% targets89% snaps | 656 yds17% targets94% snaps | 637 yds23% targets95% snaps | 425 yds16% targets92% snaps | 24 yds5% targets100% snaps | 10 yds9% targets89% snaps | — | 825 yds27% targets100% snaps | 4.826 yds a game • 5.6 per target17% targets95% snaps |
| Payne Durham | — | — | 10 yds3% targets55% snaps | — | 15 yds4% targets38% snaps | — | — | — | 00 yds0% targets21% snaps | 0.72 yds a game • 2.5 per target2% targets38% snaps |
| Ko Kieft | — | — | 00 yds0% targets3% snaps | — | — | 00 yds0% targets0% snaps | 00 yds0% targets10% snaps | 00 yds0% targets0% snaps | 00 yds0% targets1% snaps | 0.00 yds a game0% targets3% snaps |
| Bauer Sharp | 00 yds0% targets2% snaps | — | 00 yds0% targets9% snaps | 00 yds0% targets6% snaps | 00 yds0% targets6% snaps | 121 yds2% targets5% snaps | 00 yds0% targets25% snaps | — | 00 yds0% targets12% snaps | 0.13 yds a game • 21.0 per target0% targets9% snaps |
Each cell is targets that week, with receiving yards, share of team targets and snap percentage. Click a name to open that player.
Game log
Games3
PPR/G0.6
Game log
Durham avg 0.5NFL top 12 TEs avg 13.3
Solid dot is what he scored. Hollow dot is our projection before the game.
| Use | Game | Proj | PPR | Tgt | Rec | Rec Yd | Car | Rush Yd | TD | Snap |
|---|---|---|---|---|---|---|---|---|---|---|
| W3vs MIN | 1.3 | 0 | 1 | 0 | 0 | 0 | 0 | 0 | 55% | |
| W5vs DAL | 2.2 | 1.5 | 1 | 1 | 5 | 0 | 0 | 0 | 38% | |
| W9vs CHI | 1.5 | 0 | 0 | 0 | 0 | 0 | 0 | 0 | 21% |
Opponent color:Easy defense for TEsAverageTough
Schedule ahead
11 DET12 CAR13 LAC14 BAL15 NO16 ATL17 LA18 NO
Green easier, red tougher
Schedule ahead
Colored by what each defense has given up to TEs so far. Green is an easier matchup, red is a tougher one.
Wk 11 DETWk 12 CARWk 13 LACWk 14 BALWk 15 NOWk 16 ATLWk 17 LAWk 18 NOSee every team's TE schedule ›
StatPer gameSeasonRank
Overall
Games—312›
PPR points0.61.55›
Receiving
Targets0.725›
Catches0.416›
Receiving yards1.852›
Yards per target2.5—6›
Rushing
Scrimmage yards1.852›
Usage
Snap %40%—17›
Target share %2.5%—5›
Touch share %1.2%—5›
Air yards share %1.1%69›
Tap any stat to see everyone ranked. Bars: green top 30%, yellow middle, red bottom 40%.
Mania breakdown
Fantasy Production0
Target Volume3
Team Target Role3
Red-Zone Threat0
Per-Target Efficiency6
Mania breakdown
Percentile among TEs. 100 is the best, 50 is average.
How many fantasy points and total yards he is actually producing, compared with players at his position. Ranks better than 0% of TEs.
How often he is targeted: targets per game, receptions and his share of the team targets. Ranks better than 3% of TEs.
How big a slice of his team passing game belongs to him: target share, air-yard share and snaps. Ranks better than 3% of TEs.
How often the offense uses him near the goal line: red-zone targets and end-zone targets. Ranks better than 0% of TEs.
What he produces with each chance instead of just rewarding volume: yards per target, catch rate and fantasy points per opportunity. Ranks better than 6% of TEs.
Top 30%MiddleBottom 40%Tap a category to see what it means.
Week 11 matchup
vs DET
Good matchup
Adjustment+6.0 pts
Allows to TEs1st most
Week11
Week 11 matchup
vs DET
+2.1Rating boost
Good matchup1st easiest of 32 defenses for TEs
ToughEasy
22.9PPR a game DET allows to TEs
5.3Similar players, usual PPR a game
11.4Same players against DET
Players with a role like his scored 11.4 PPR a game against DET, versus 5.3 in their usual games (+114%). That moves his Week 11 Rating by +2.1.
How tight ends did against DET
22.9 PPR points a game allowed to tight ends, 1st most of 32 defenses.
| Player | PPR | Tgt | Rec | Rec Yd | Rec TD | Rush Yd |
|---|---|---|---|---|---|---|
| Kenyon Sadiqvs NYJ • Wk 3 | 23.5 | 8 | 7 | 105 | 1 | 0 |
| Dalton Kincaid@ BUF • Wk 2 | 22.5 | 8 | 7 | 95 | 1 | 0 |
| Trey McBride@ ARI • Wk 5 | 21.6 | 10 | 9 | 66 | 1 | 0 |
| T.J. Hockensonvs MIN • Wk 8 | 15.8 | 5 | 4 | 58 | 1 | 0 |
| Teagan Quitoriano@ ARI • Wk 5 | 15.5 | 2 | 2 | 15 | 2 | 0 |
| Jeremy Ruckertvs NYJ • Wk 3 | 14.9 | 5 | 5 | 39 | 1 | 0 |
| Tucker Kraftvs GB • Wk 7 | 14.8 | 6 | 4 | 48 | 1 | 0 |
| Juwan Johnsonvs NO • Wk 1 | 14.4 | 7 | 3 | 54 | 1 | 0 |
| Noah Fantvs NO • Wk 1 | 13.3 | 8 | 4 | 33 | 1 | 0 |
| Elijah Higgins@ ARI • Wk 5 | 8.7 | 3 | 3 | 57 | 0 | 0 |
| Dawson Knox@ BUF • Wk 2 | 8.5 | 2 | 2 | 5 | 1 | 0 |
| Darren Waller@ CAR • Wk 4 | 6.6 | 6 | 3 | 36 | 0 | 0 |
| Tommy Tremble@ CAR • Wk 4 | 5.2 | 4 | 4 | 12 | 0 | 0 |
| Hunter Henryvs NE • Wk 10 | 4.2 | 3 | 2 | 22 | 0 | 0 |
| Ben Yurosekvs MIN • Wk 8 | 3.4 | 2 | 1 | 24 | 0 | 0 |
| Greg Dulcich@ MIA • Wk 9 | 3.4 | 4 | 2 | 14 | 0 | 0 |
| Jelani Woodsvs NYJ • Wk 3 | 3.0 | 1 | 1 | 20 | 0 | 0 |
| Jonnu Smithvs GB • Wk 7 | 1.9 | 1 | 1 | 9 | 0 | 0 |
| Mitchell Evans@ CAR • Wk 4 | 1.8 | 1 | 1 | 8 | 0 | 0 |
| Will Kacmarek@ MIA • Wk 9 | 1.6 | 2 | 1 | 6 | 0 | 0 |
| Eli Raridonvs NE • Wk 10 | 1.6 | 1 | 1 | 6 | 0 | 0 |
| Mark Redmanvs GB • Wk 7 | 0.0 | 1 | 0 | 0 | 0 | 0 |
Fantasy points first, then the stats that matter for his position. Ring around each photo is that player's Mania Rating. Tap a name to open his profile.
Usage
Snaps
40%
Target share
3%
Targets/G
0.7
PPR/G
0.6
By the numbers
PPR / Game
0.5
2nd percentileTE avg 5.9
Targets / Game
0.7
5th percentileTE avg 3.2
Receiving Yards / Game
1.8
2nd percentileTE avg 23.3
Receptions / Game
0.4
3rd percentileTE avg 2.3
Share of Team Targets
2.5%
5th percentileTE avg 10.4%
Share of Team Air Yards
1.1%
9th percentileTE avg 8.5%
Red-Zone Targets / Game
0
13th percentileTE avg 0.5
End-Zone Targets / Game
0
35th percentileTE avg 0.2
Snap Share
39.7%
17th percentileTE avg 56.9%
TDs / Game
0
34th percentileTE avg 0.2