
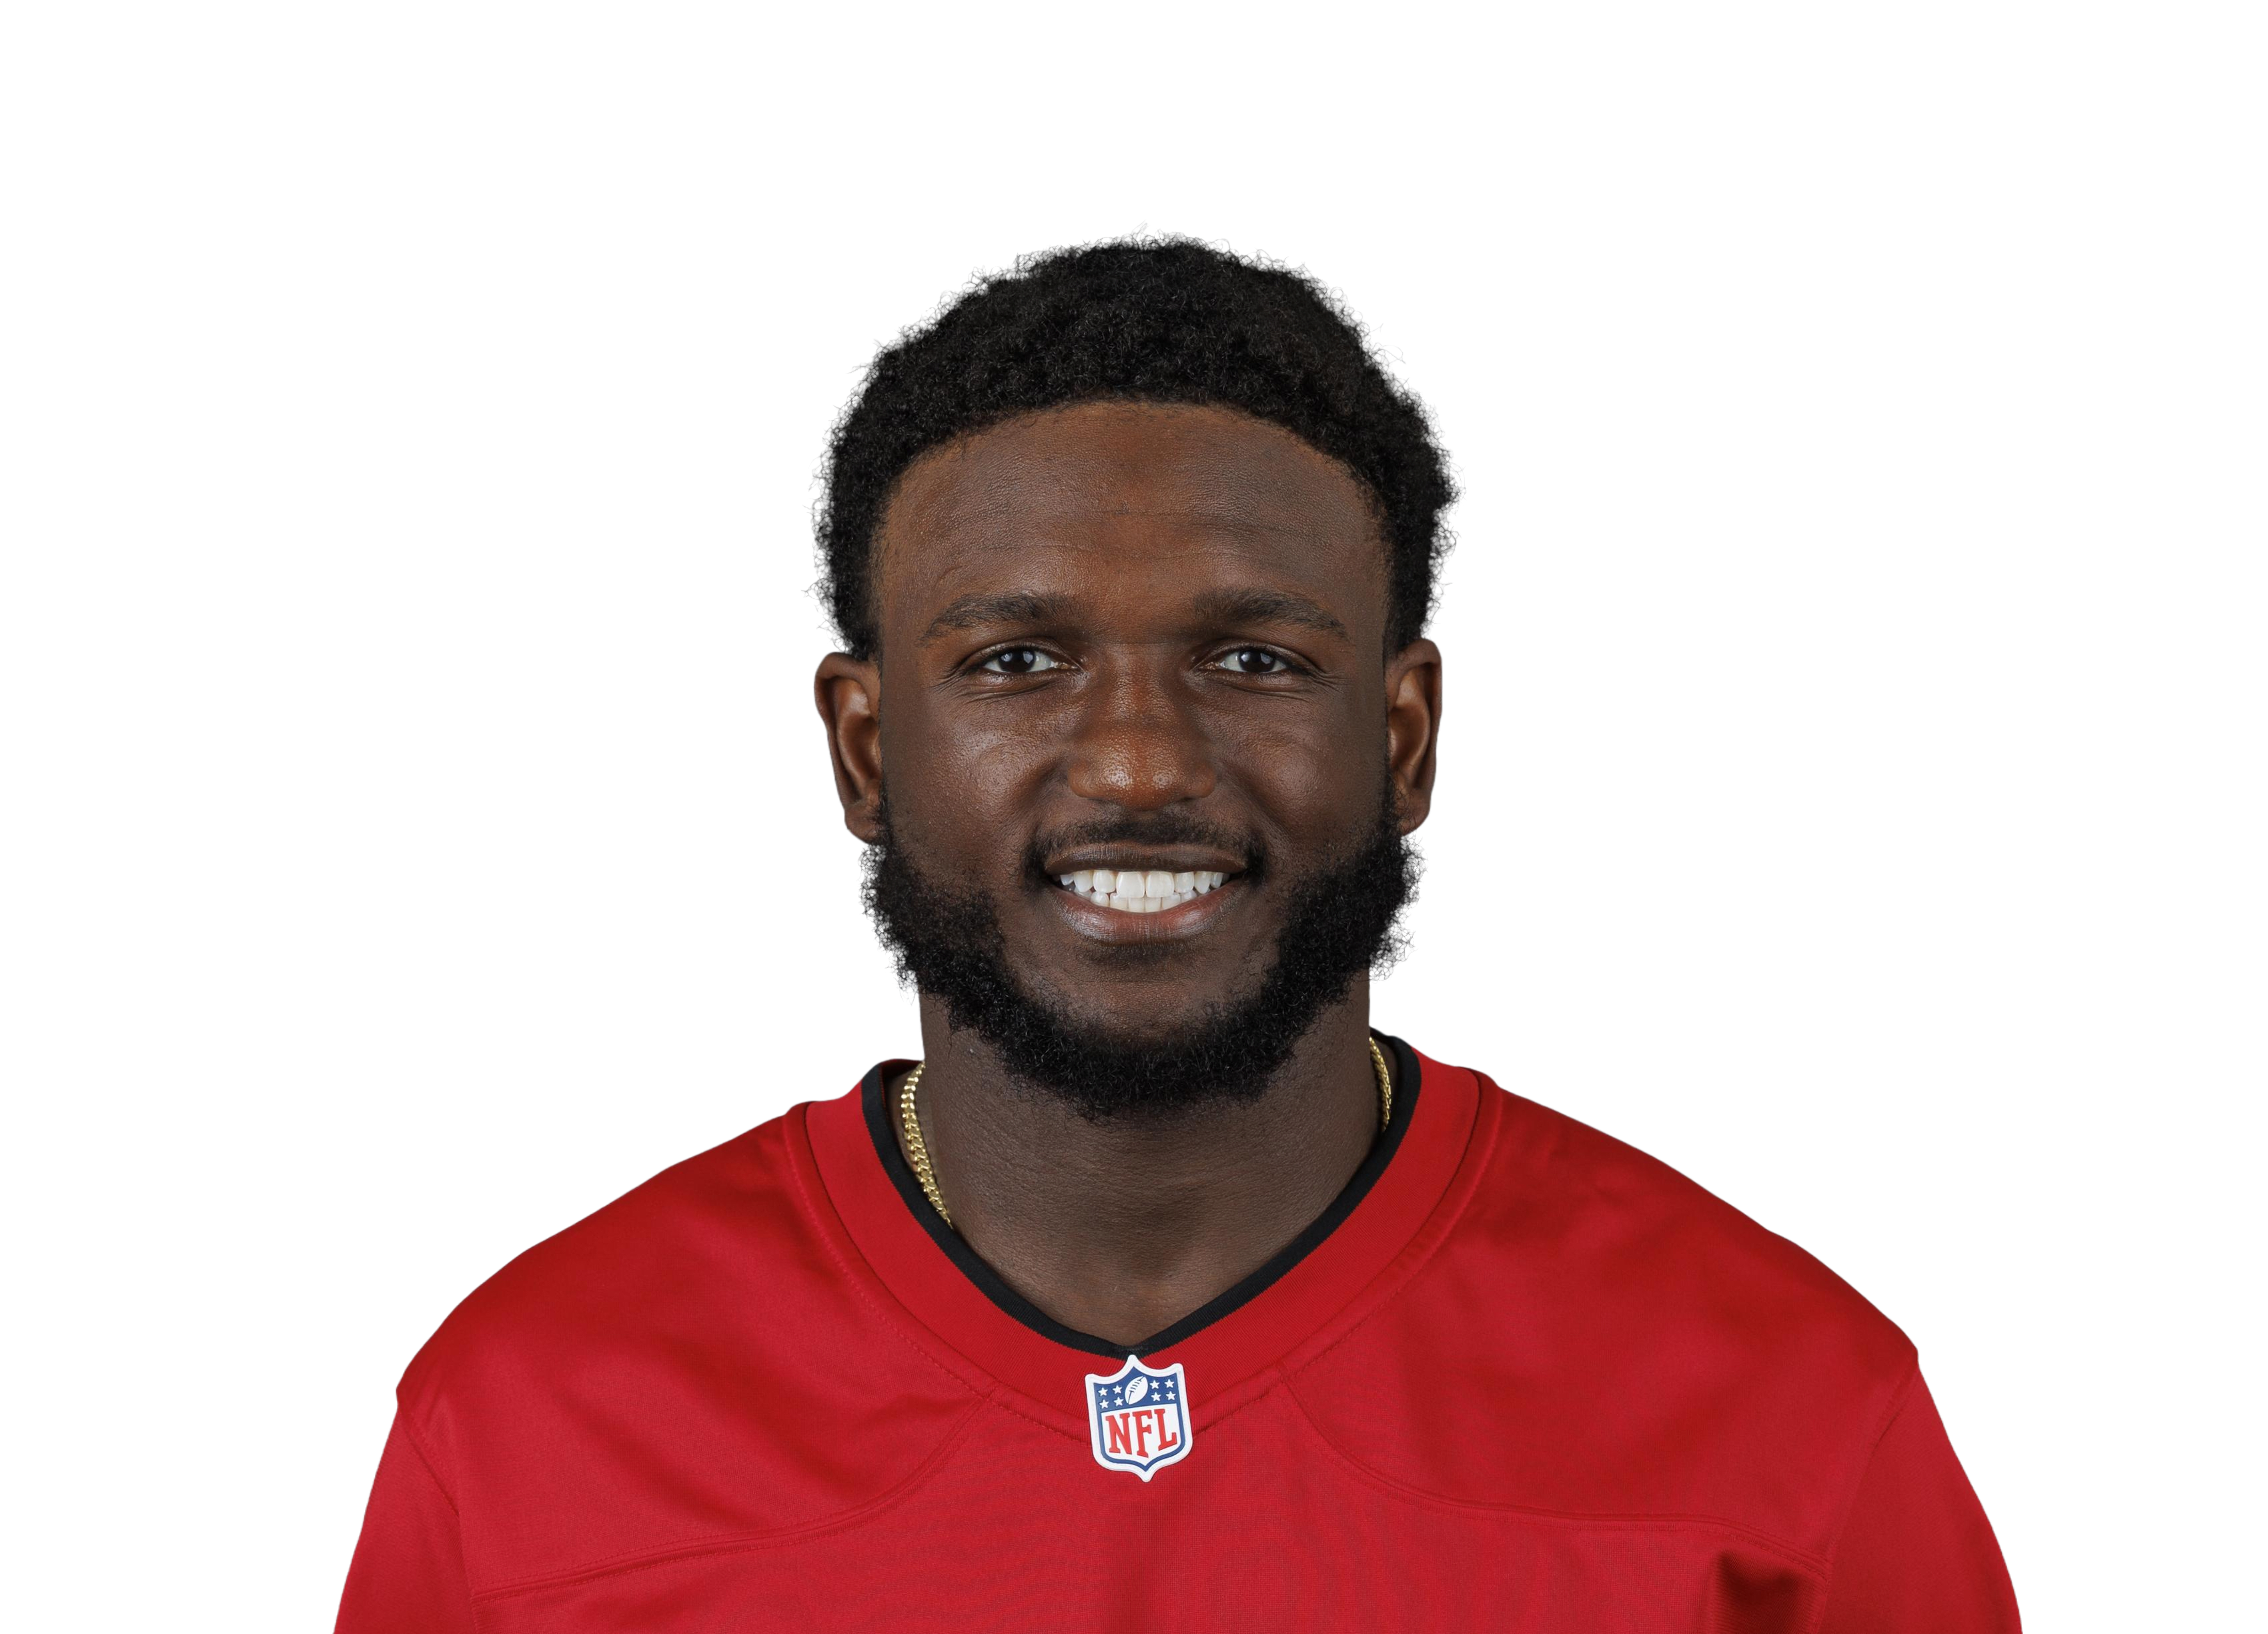
Chris Godwin Jr.
Pick a teammate with or without. Pick more than one to combine them, like a game without the QB and without the other back.
Teammate injuries shift his Week 11 Rating2 teammate notes ▾
 TB
 DET
How this is built
33.1 PPR points a game allowed to wide receivers, 12th most of 32 defenses.
| Player | PPR | Tgt | Rec | Rec Yd | Rec TD | Rush Yd |
|---|---|---|---|---|---|---|
 Tetairoa McMillan@ CAR • Wk 4 | 45.2 | 16 | 14 | 192 | 2 | 0 |
 Chris Olavevs NO • Wk 1 | 28.2 | 13 | 10 | 182 | 0 | 0 |
 Garrett Wilsonvs NYJ • Wk 3 | 26.7 | 13 | 10 | 107 | 1 | 0 |
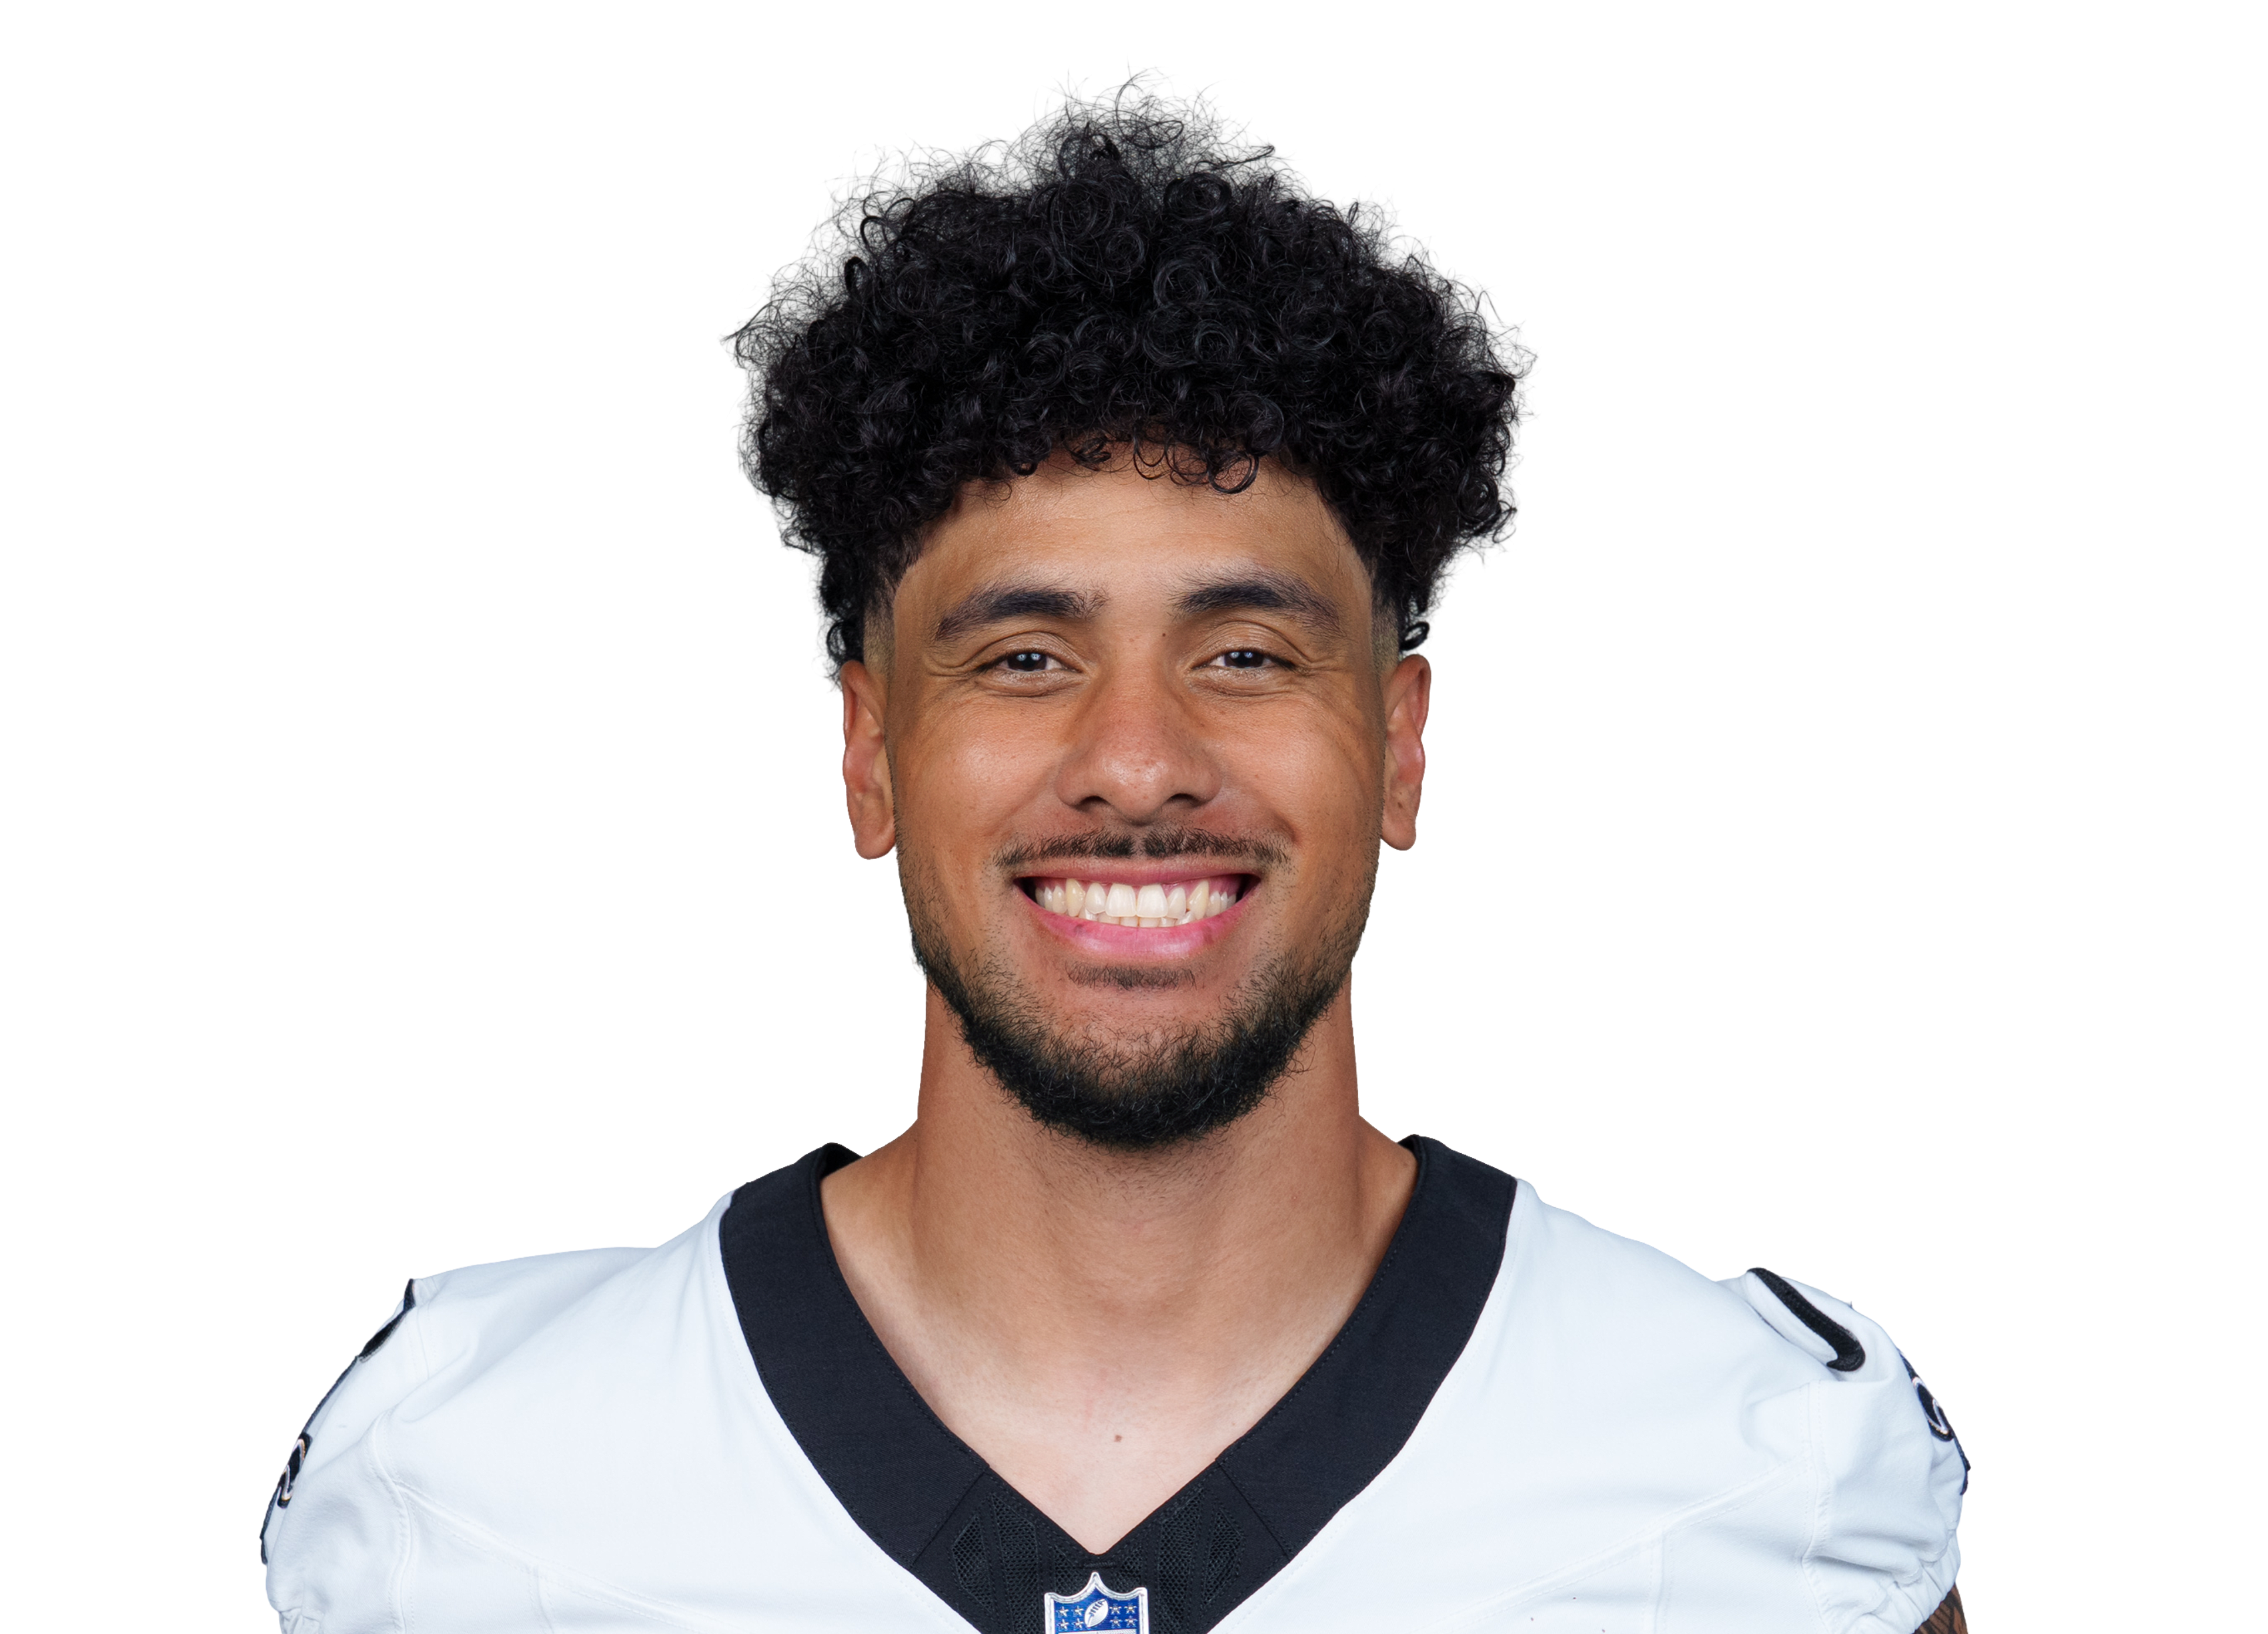 Devaughn Velevs NO • Wk 1 | 19.9 | 9 | 7 | 69 | 1 | 0 |
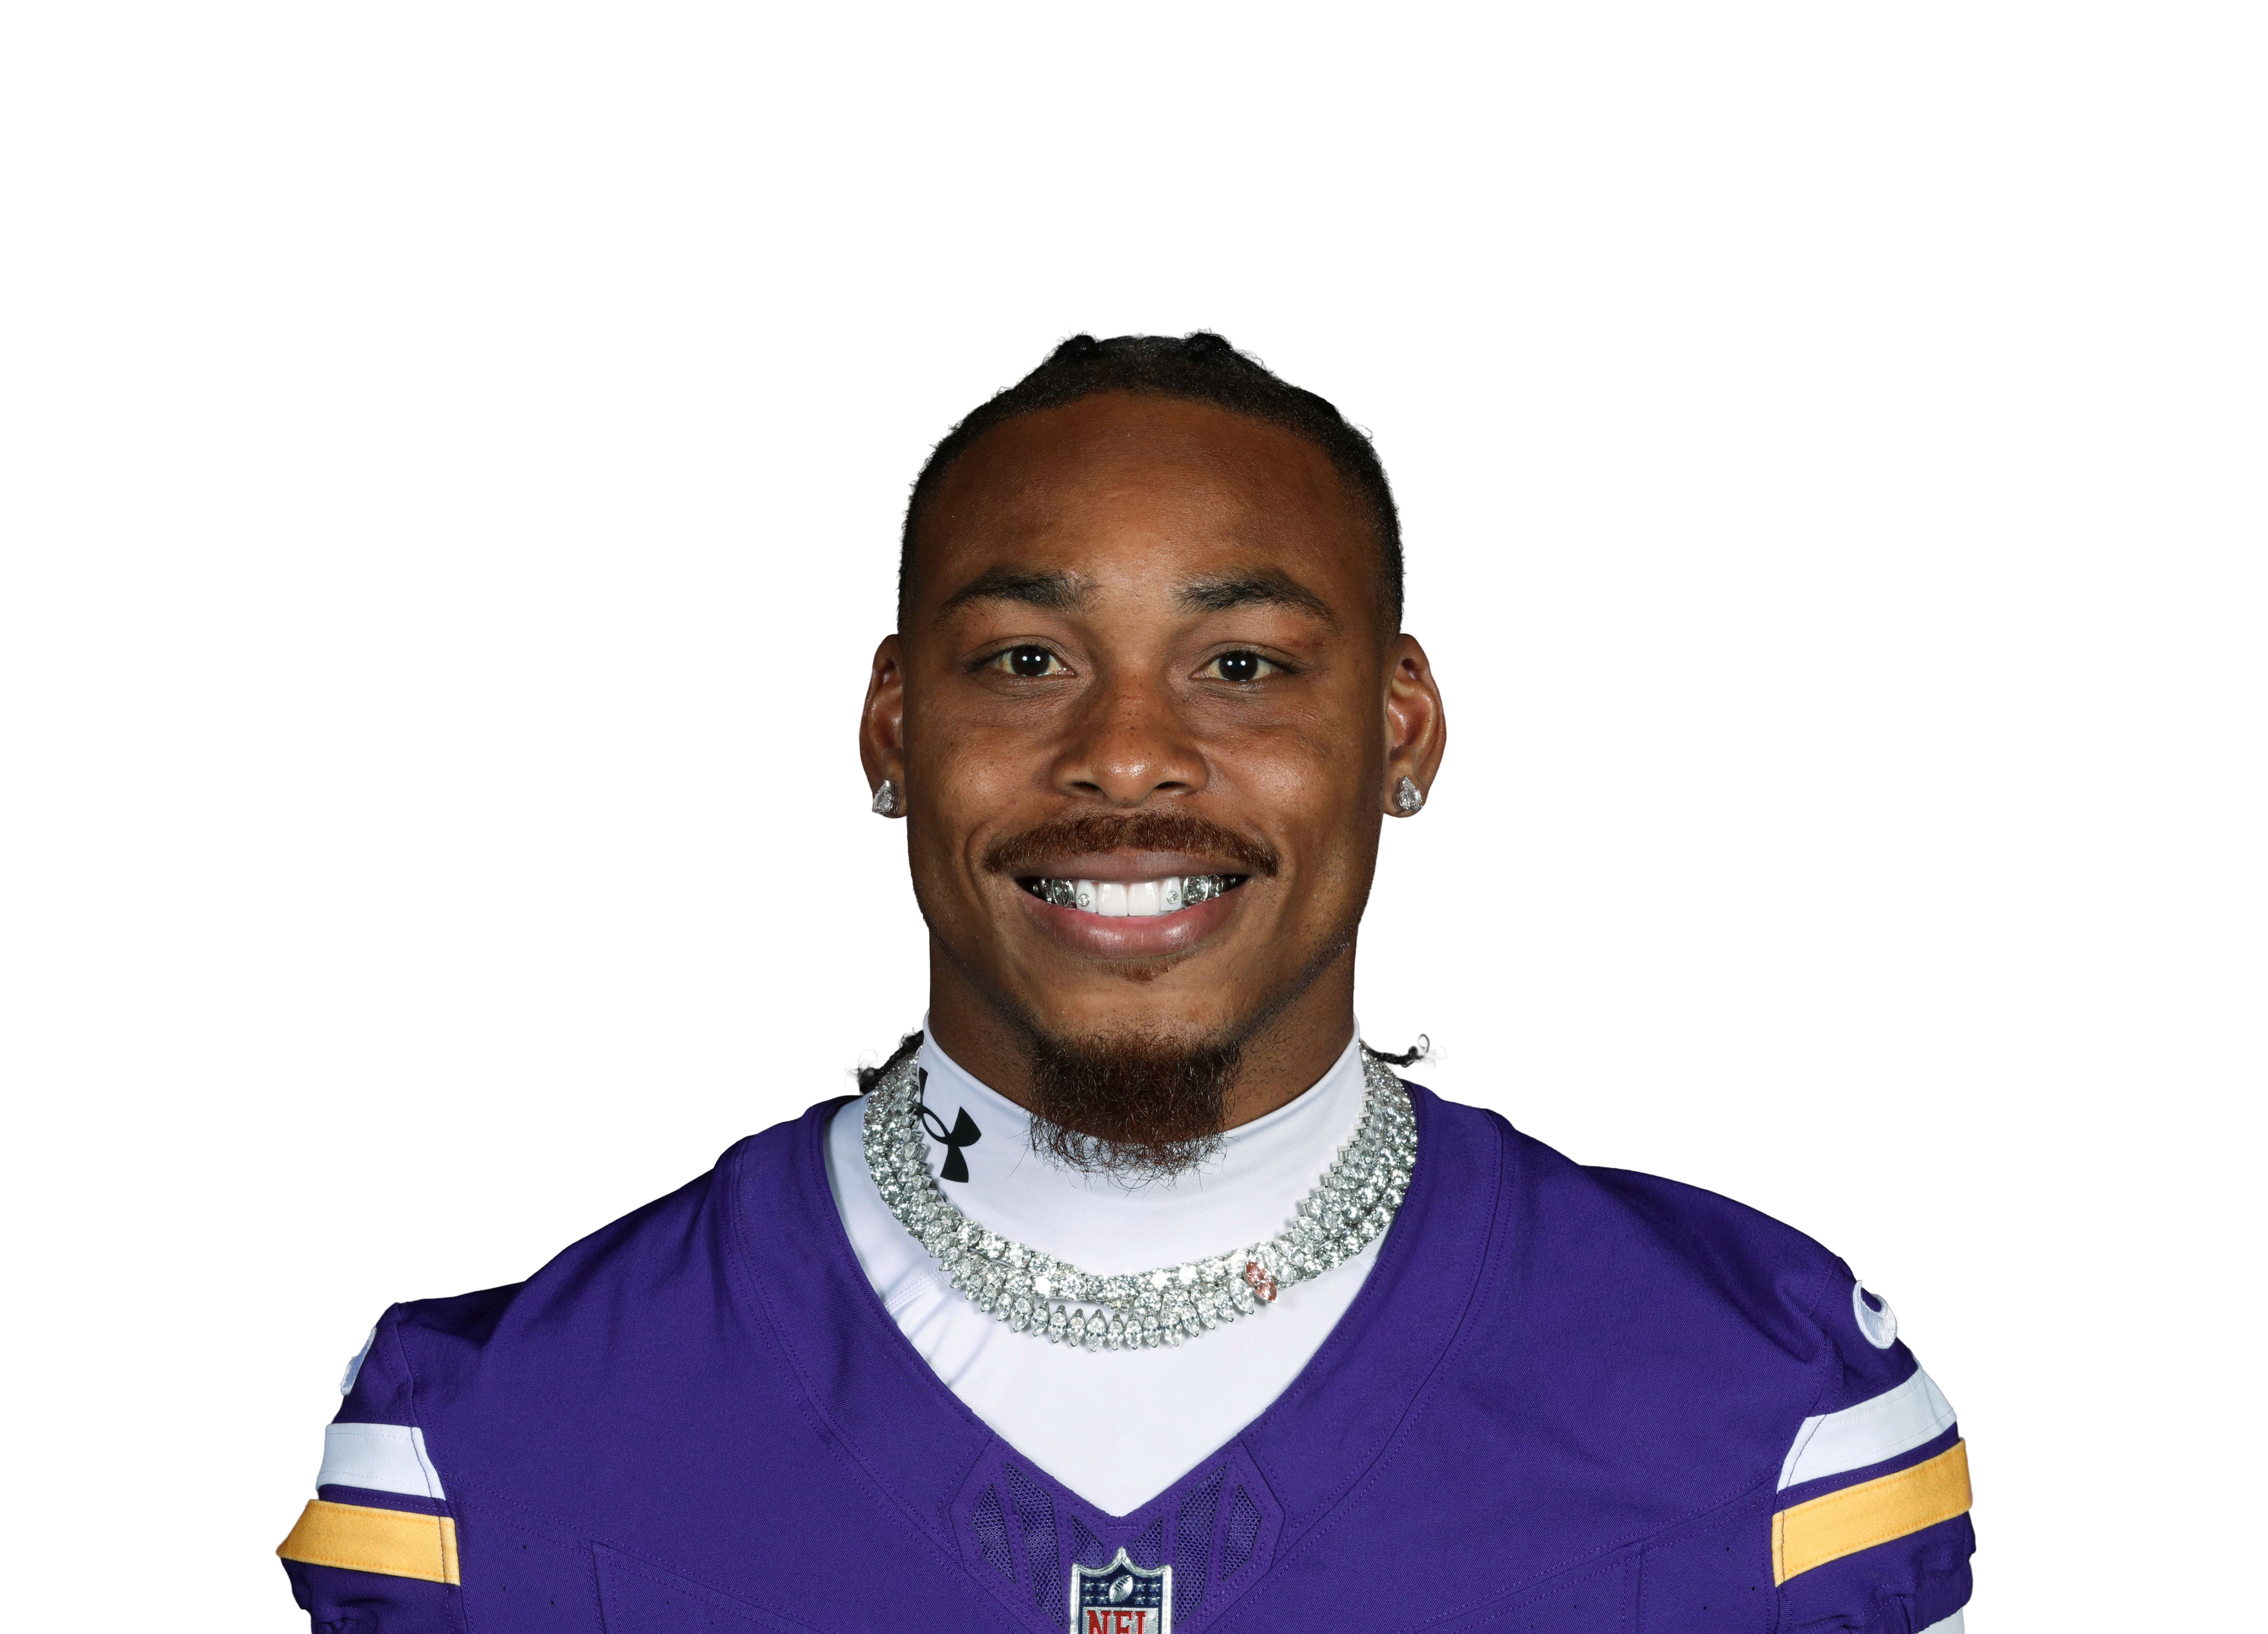 Justin Jeffersonvs MIN • Wk 8 | 14.3 | 9 | 5 | 33 | 1 | 0 |
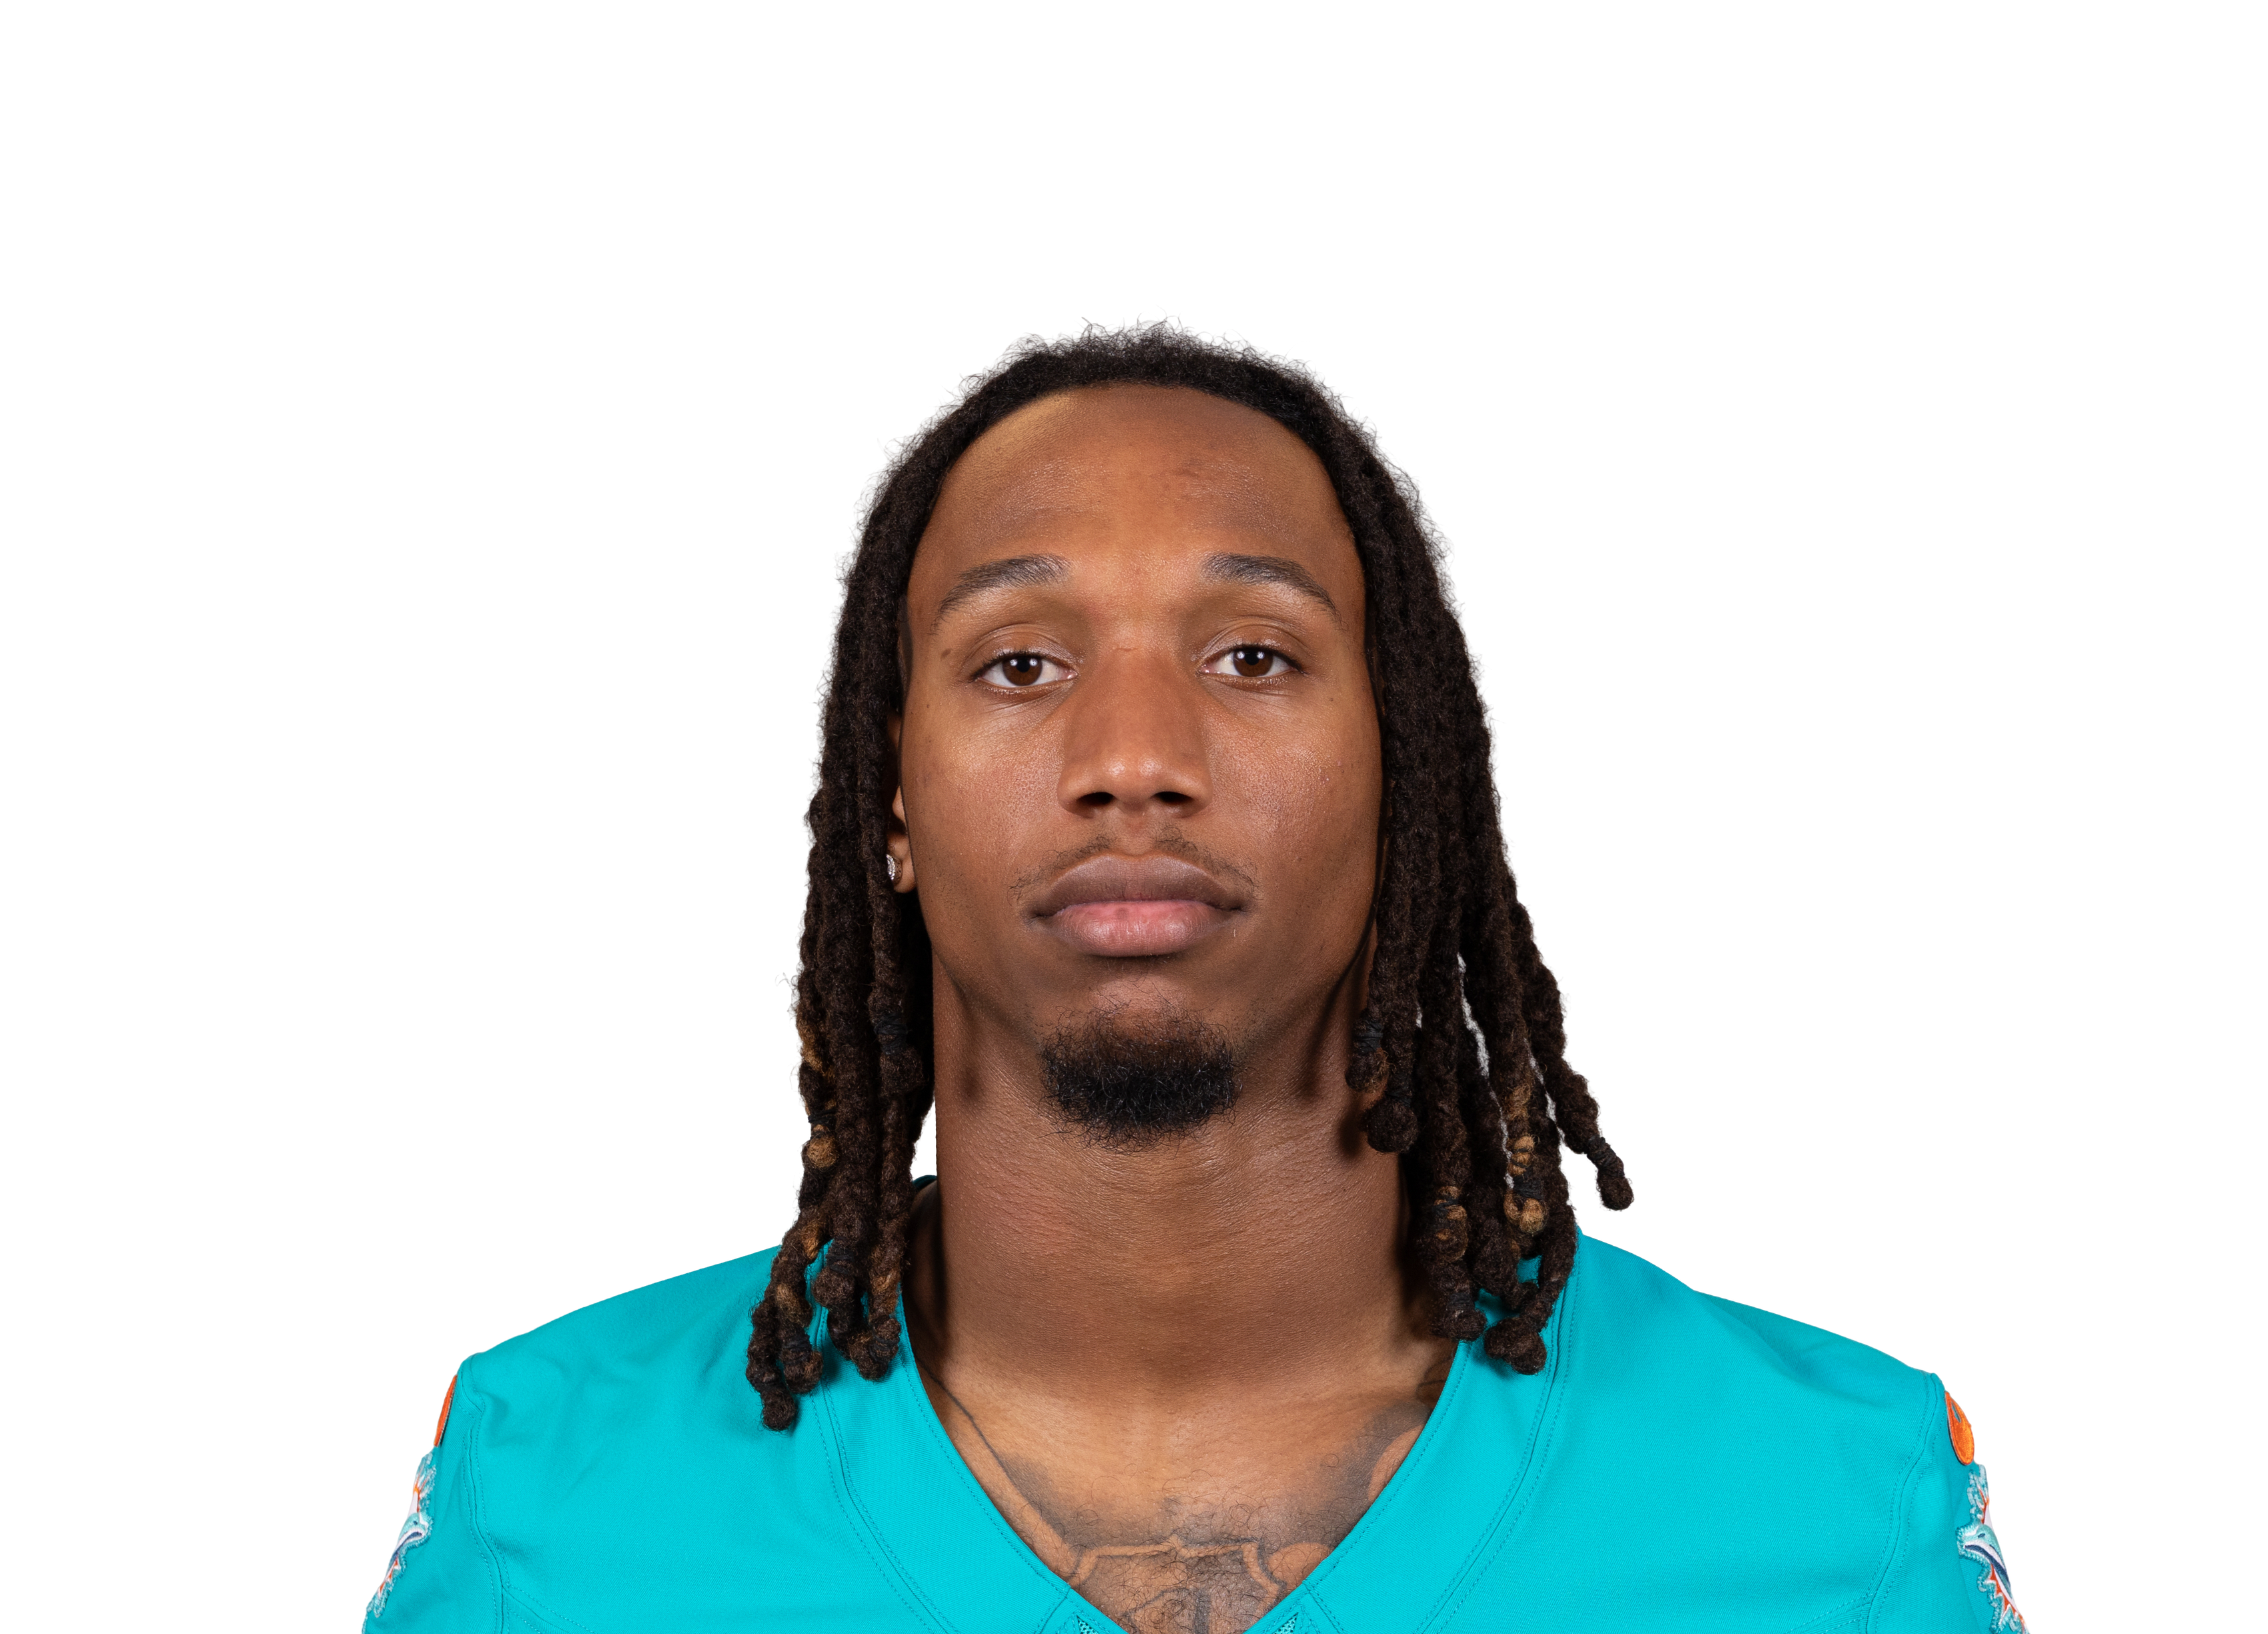 Caleb Douglas@ MIA • Wk 9 | 13.0 | 8 | 6 | 70 | 0 | 0 |
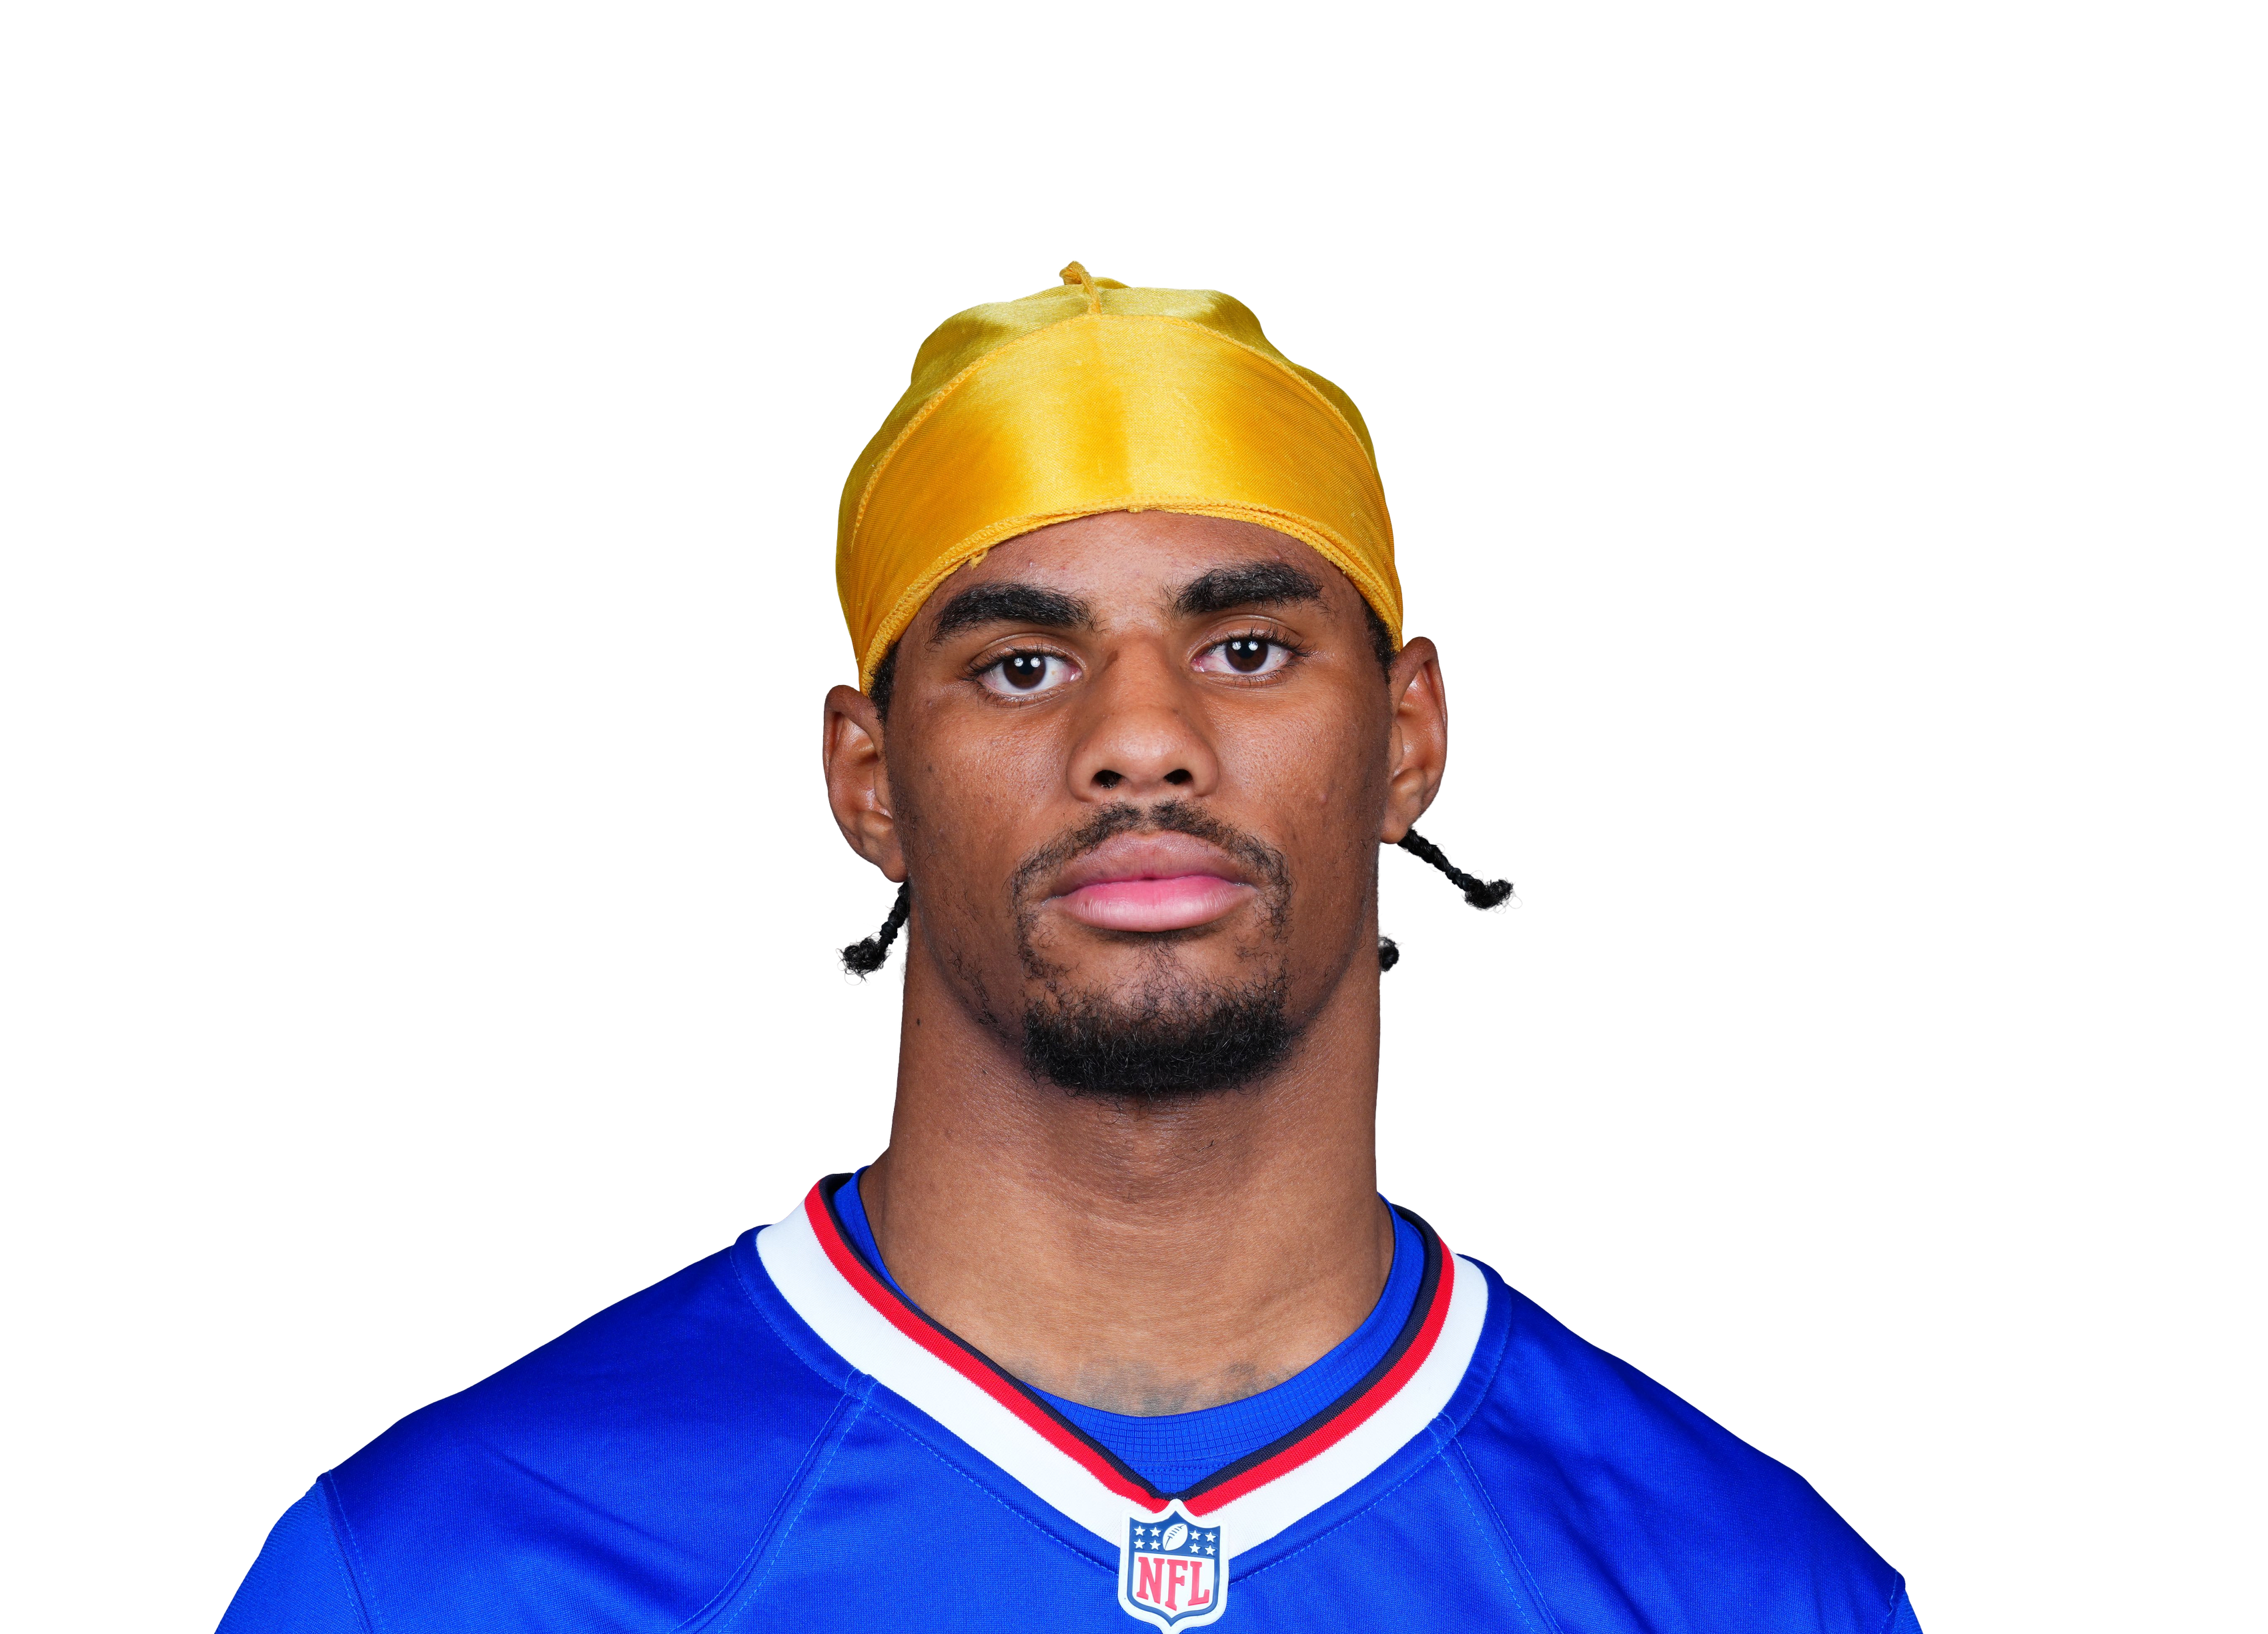 Keon Coleman@ BUF • Wk 2 | 12.3 | 6 | 6 | 63 | 0 | 0 |
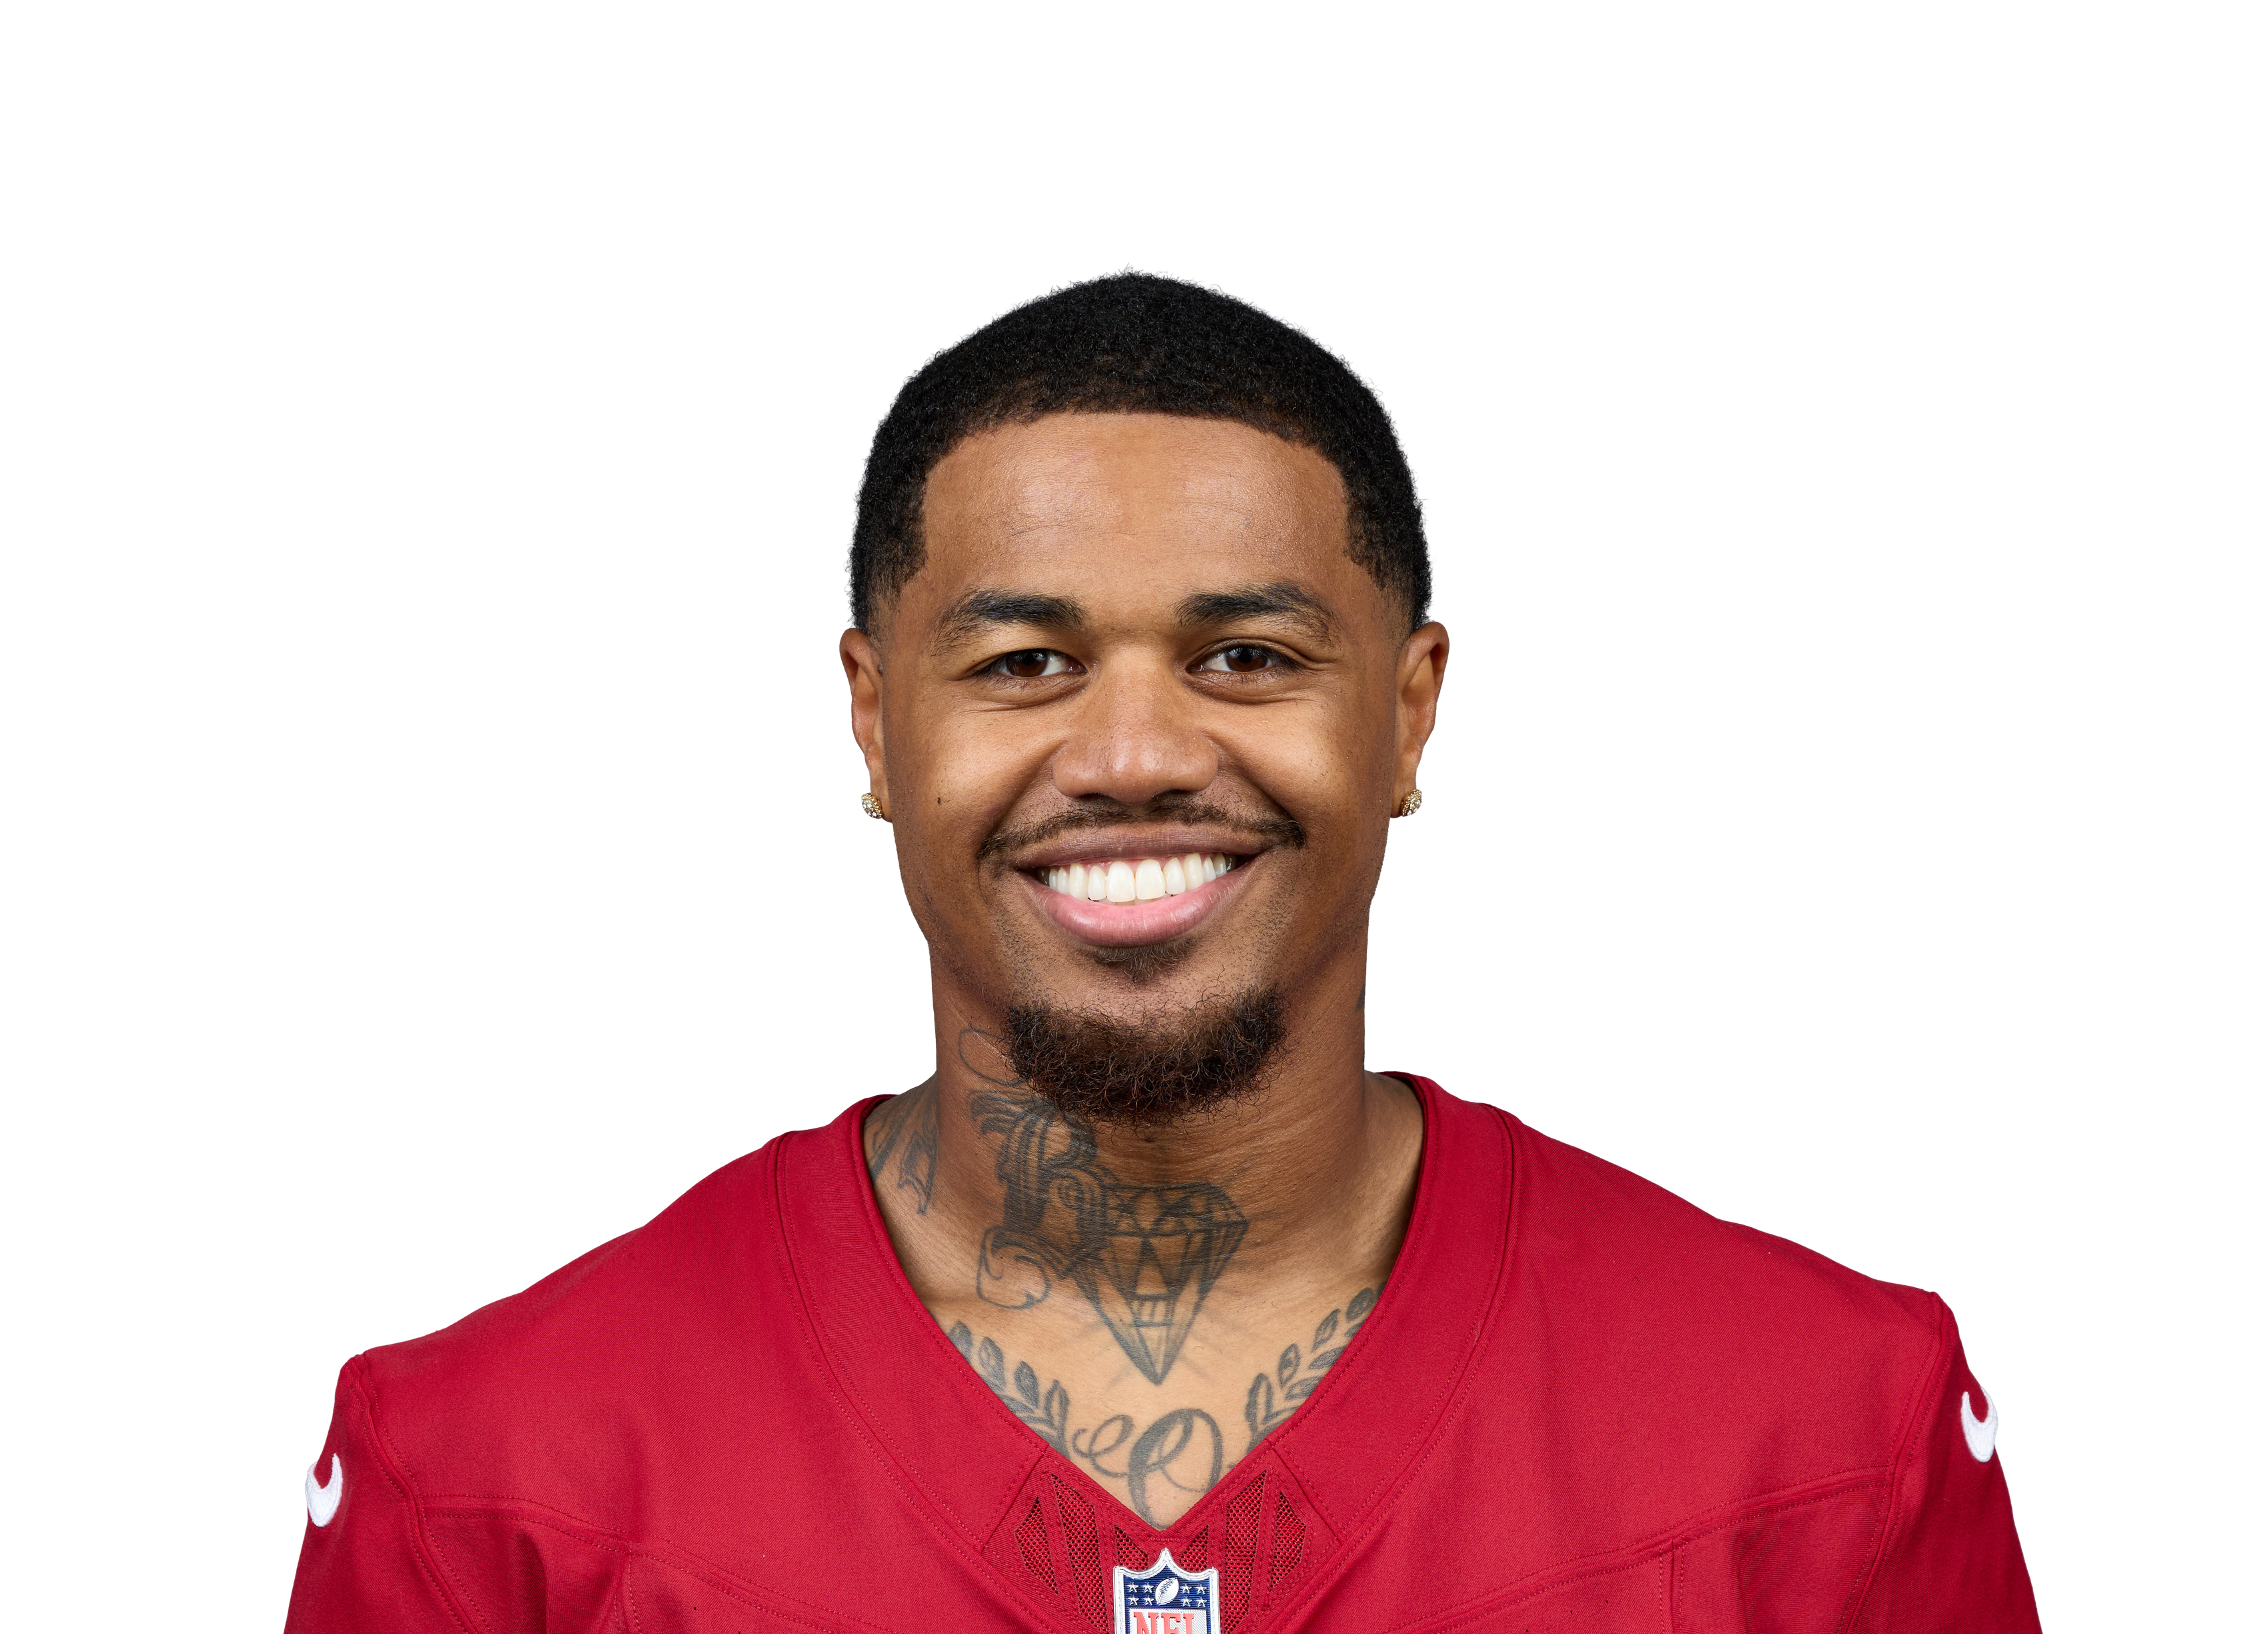 Kendrick Bourne@ ARI • Wk 5 | 12.0 | 8 | 5 | 70 | 0 | 0 |
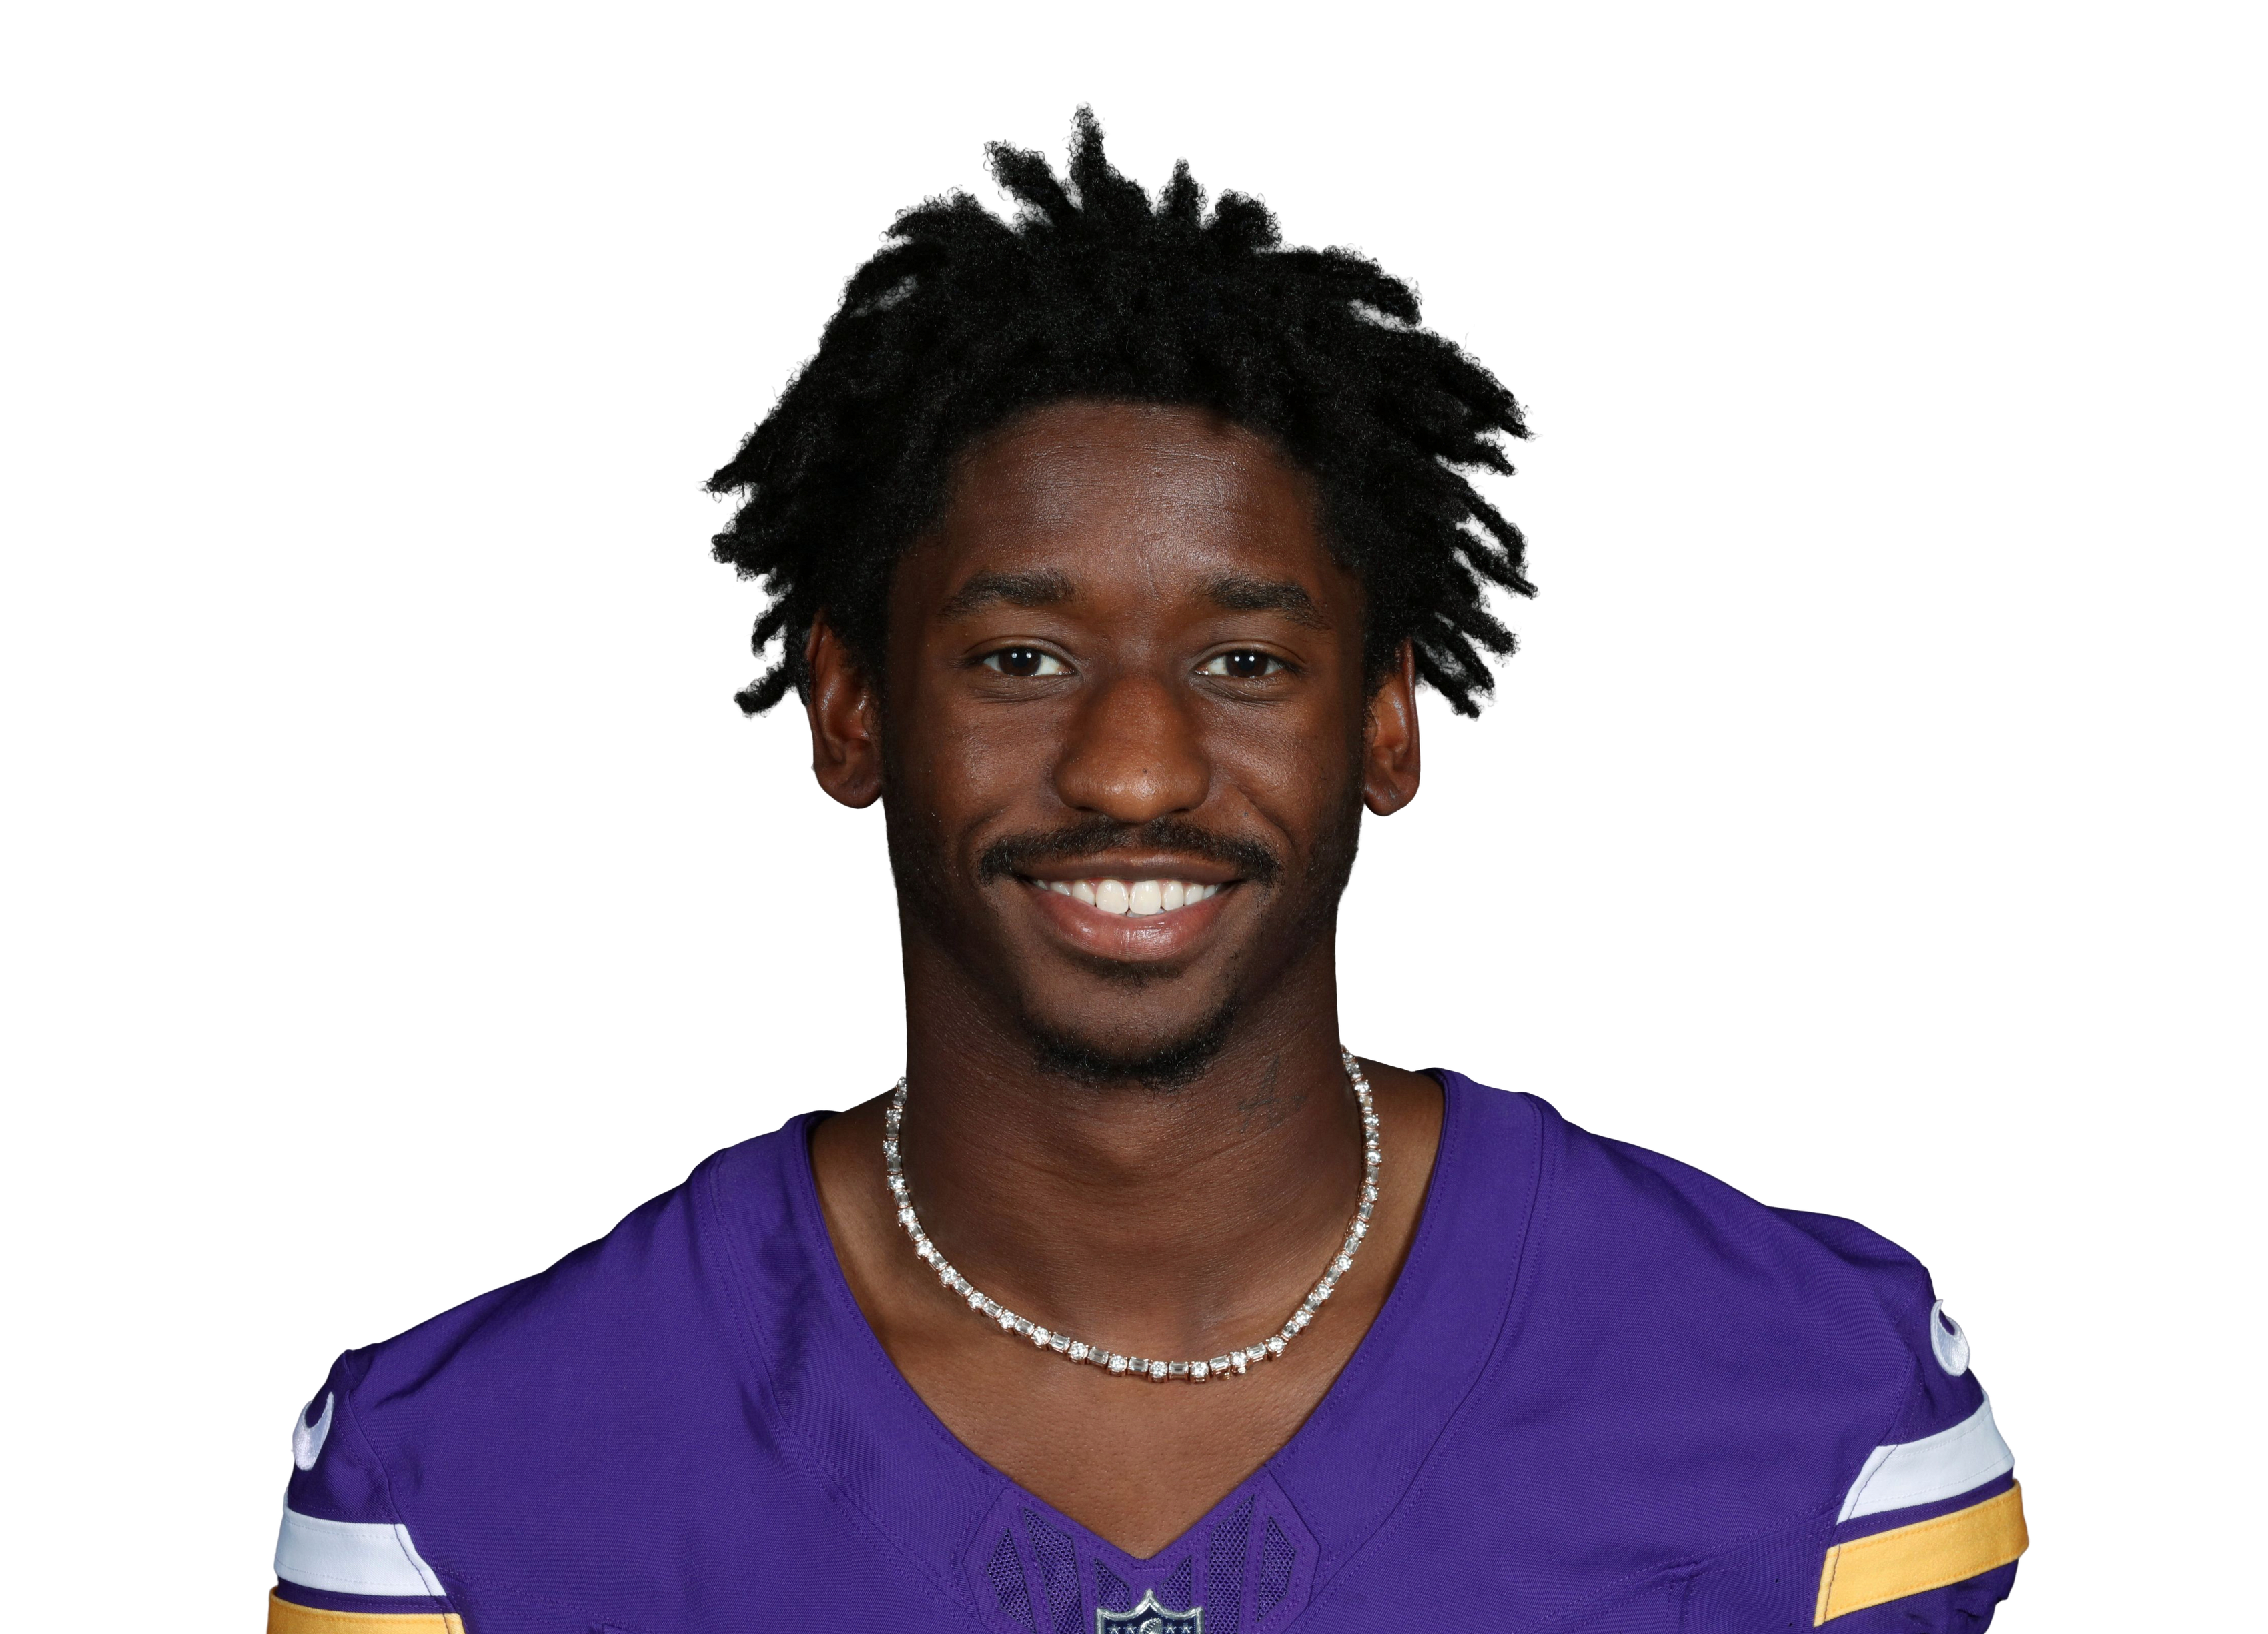 Jordan Addisonvs MIN • Wk 8 | 11.6 | 8 | 3 | 66 | 0 | 0 |
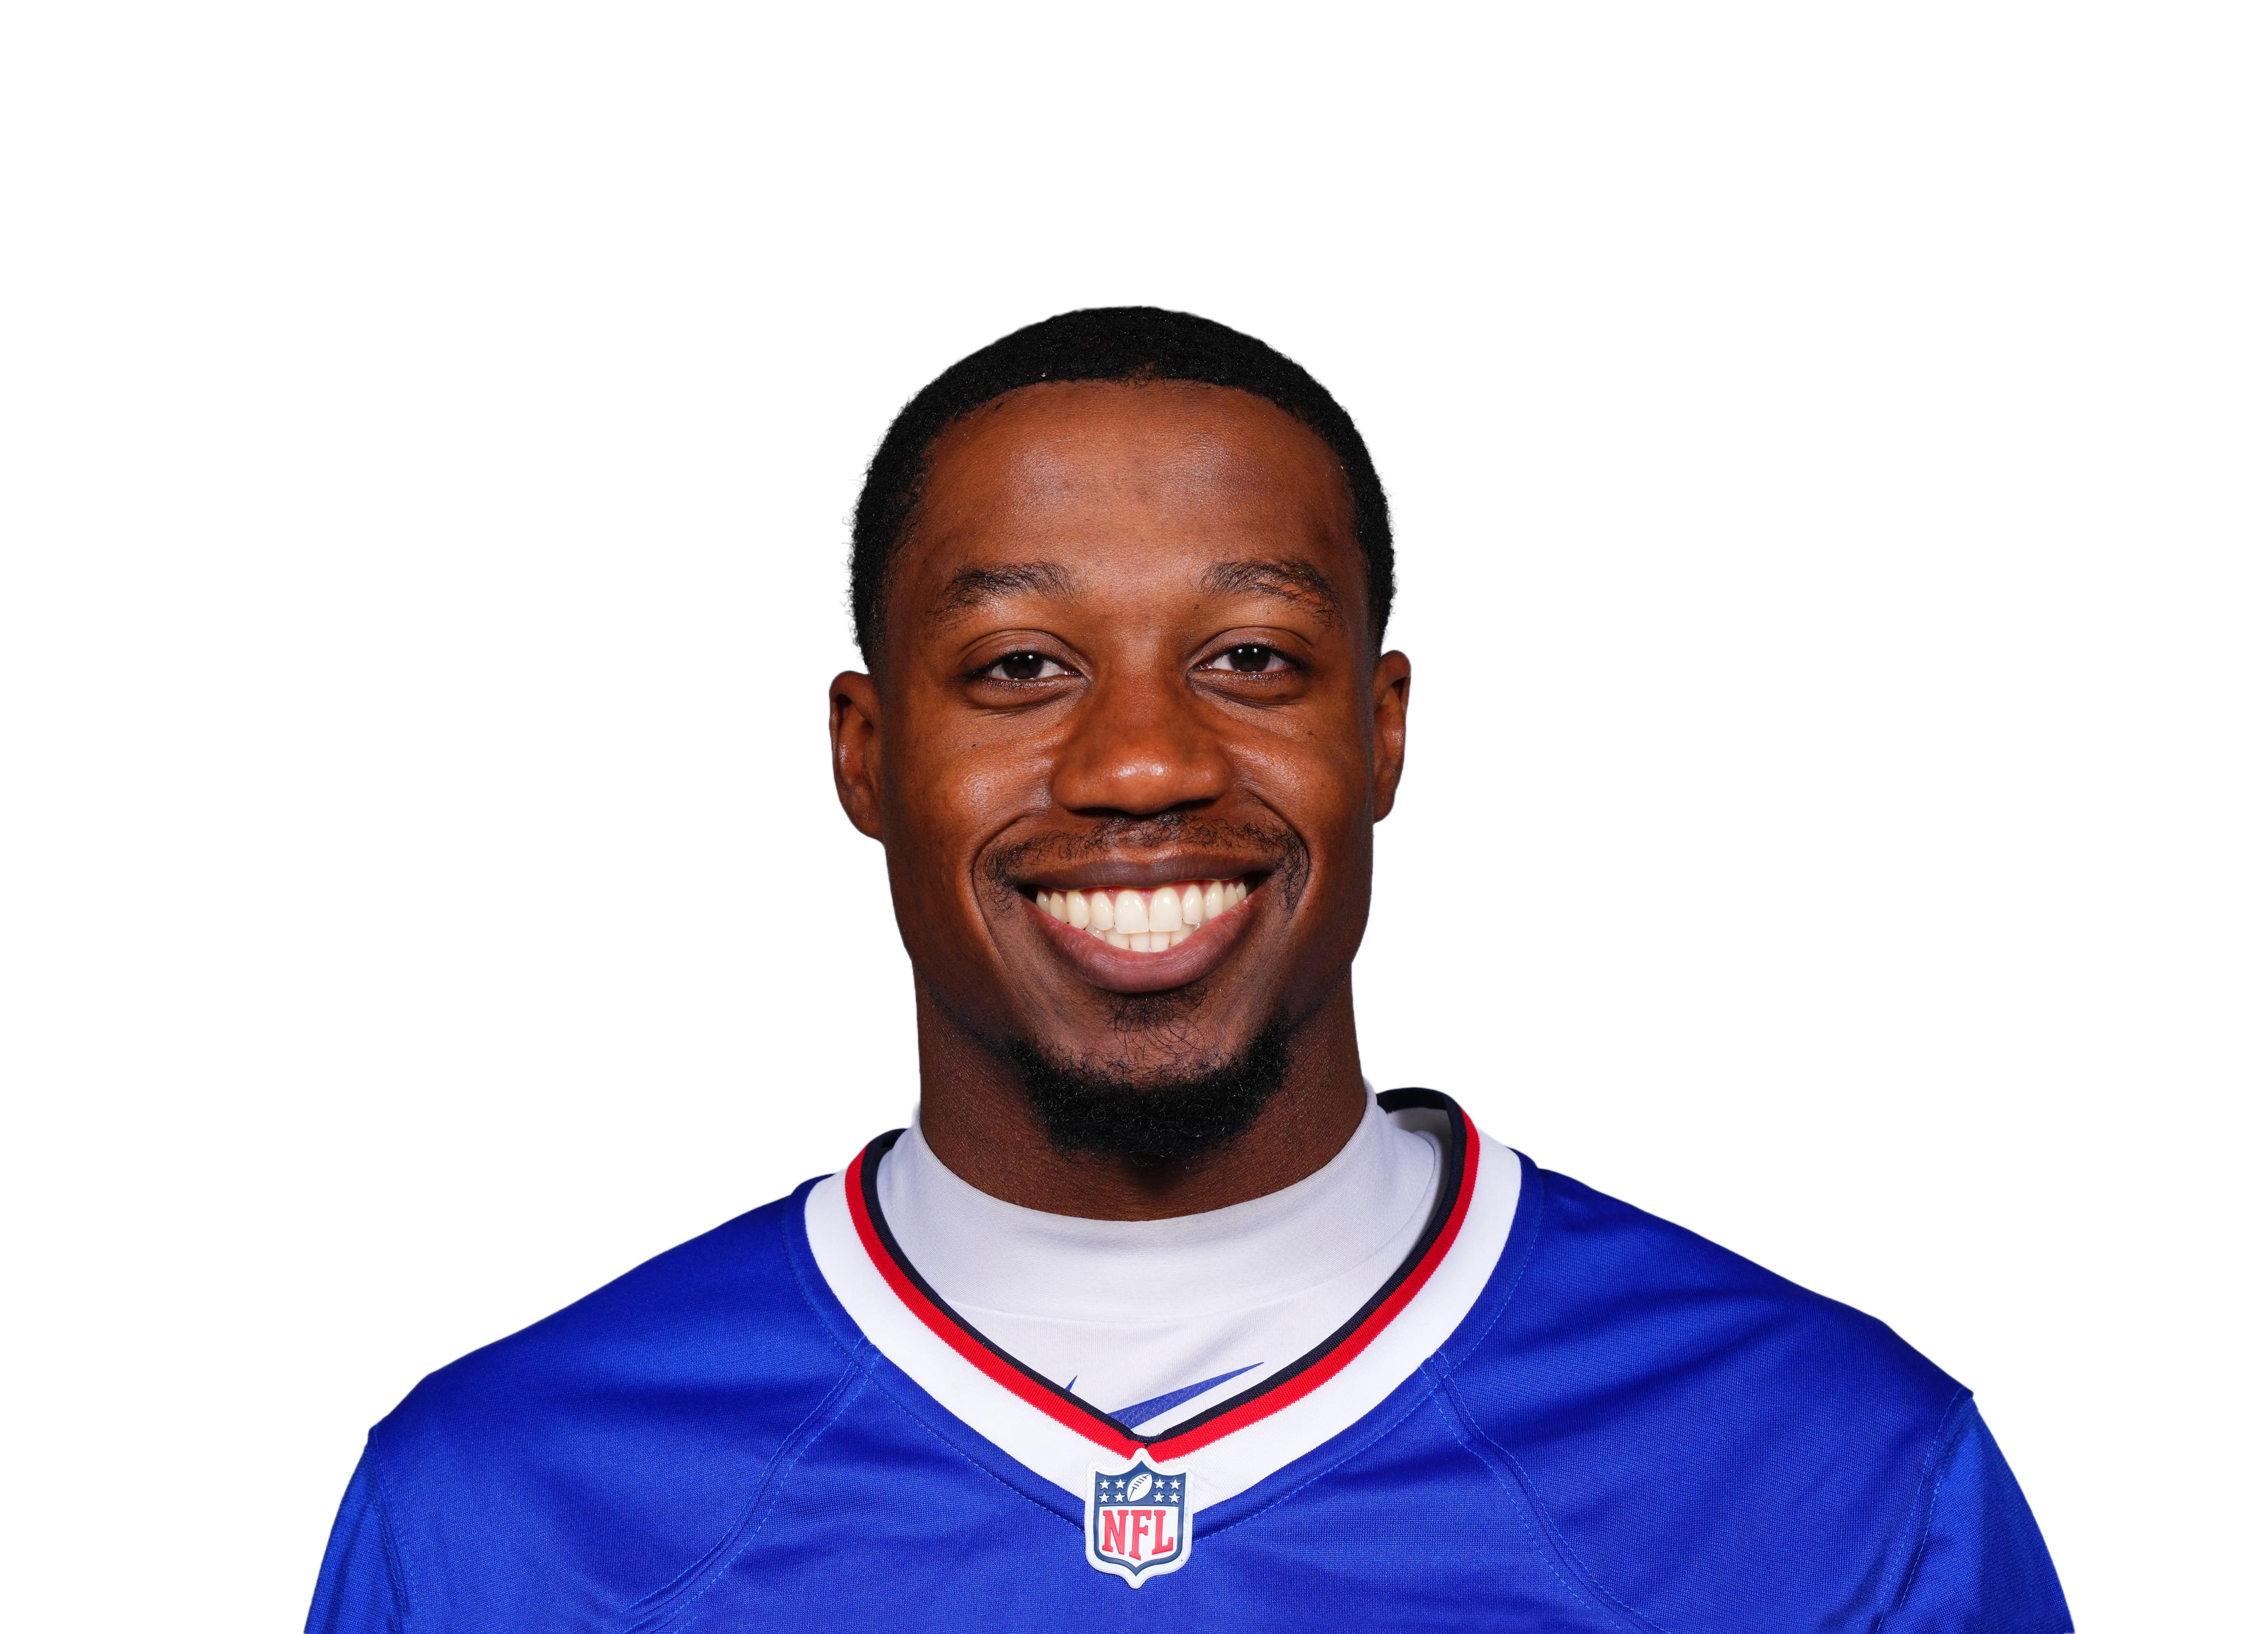 Josh Palmer@ BUF • Wk 2 | 11.3 | 3 | 1 | 43 | 1 | 0 |
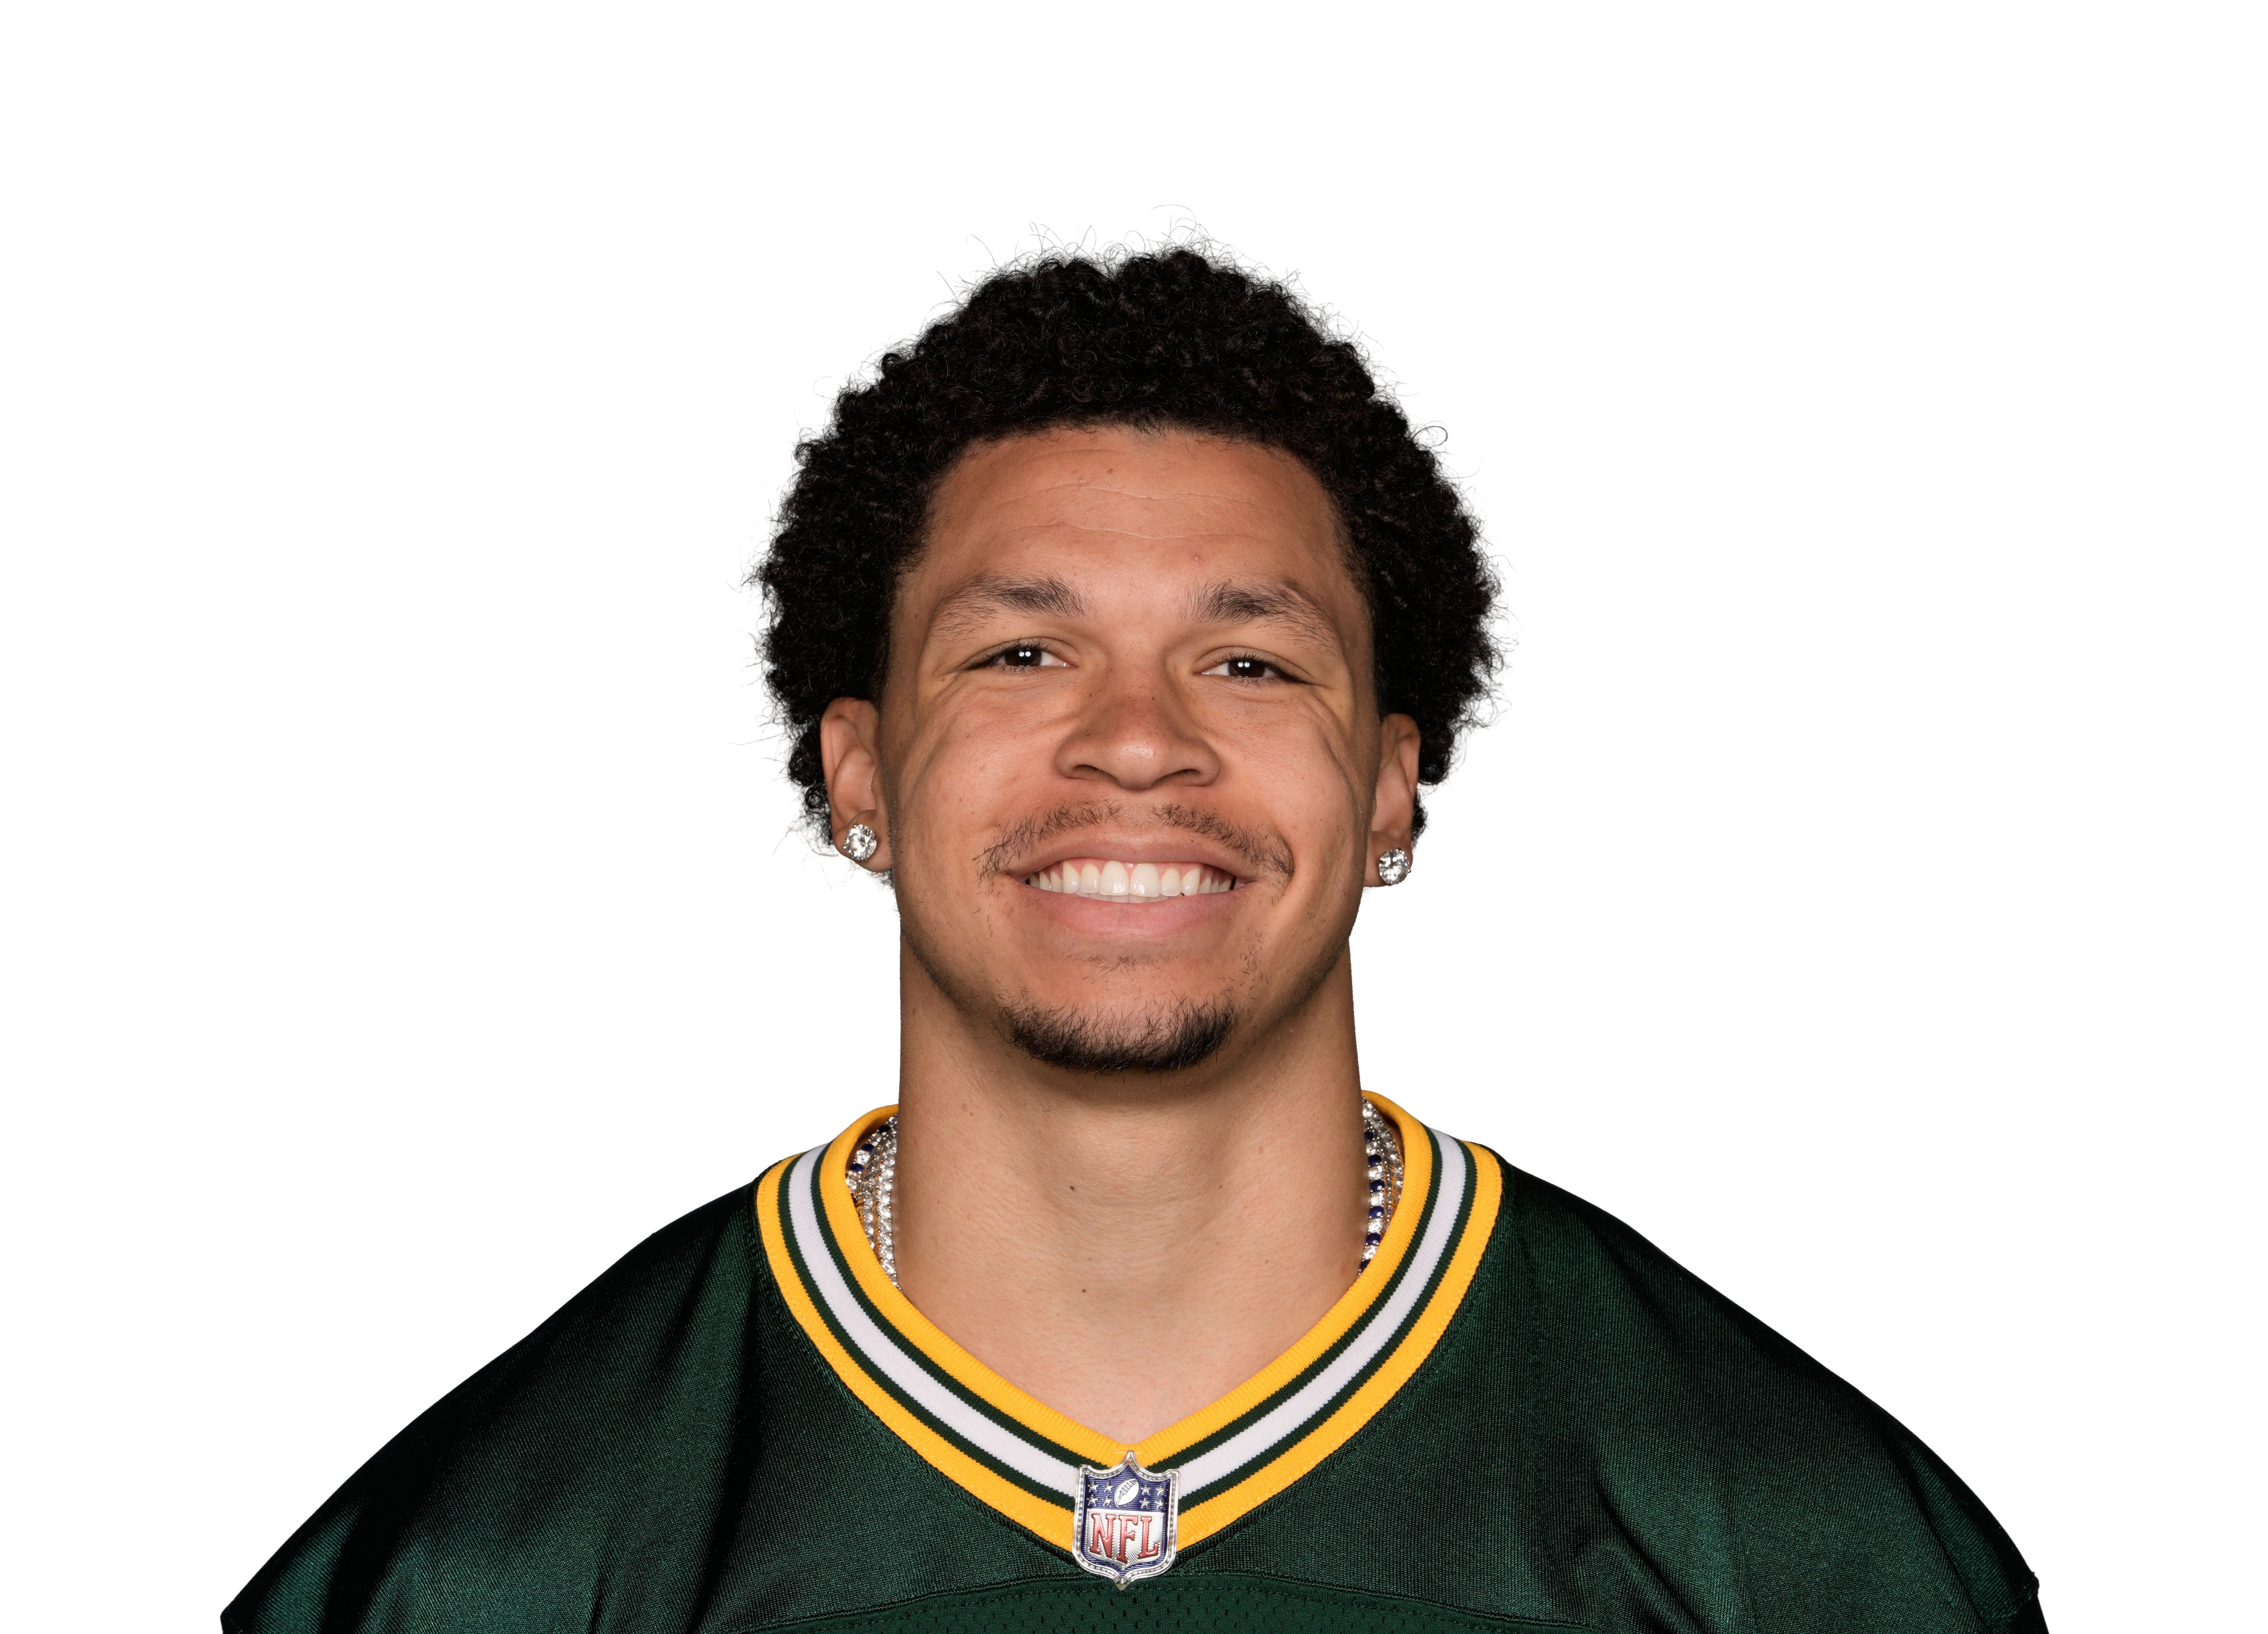 Christian Watsonvs GB • Wk 7 | 10.7 | 8 | 5 | 57 | 0 | 0 |
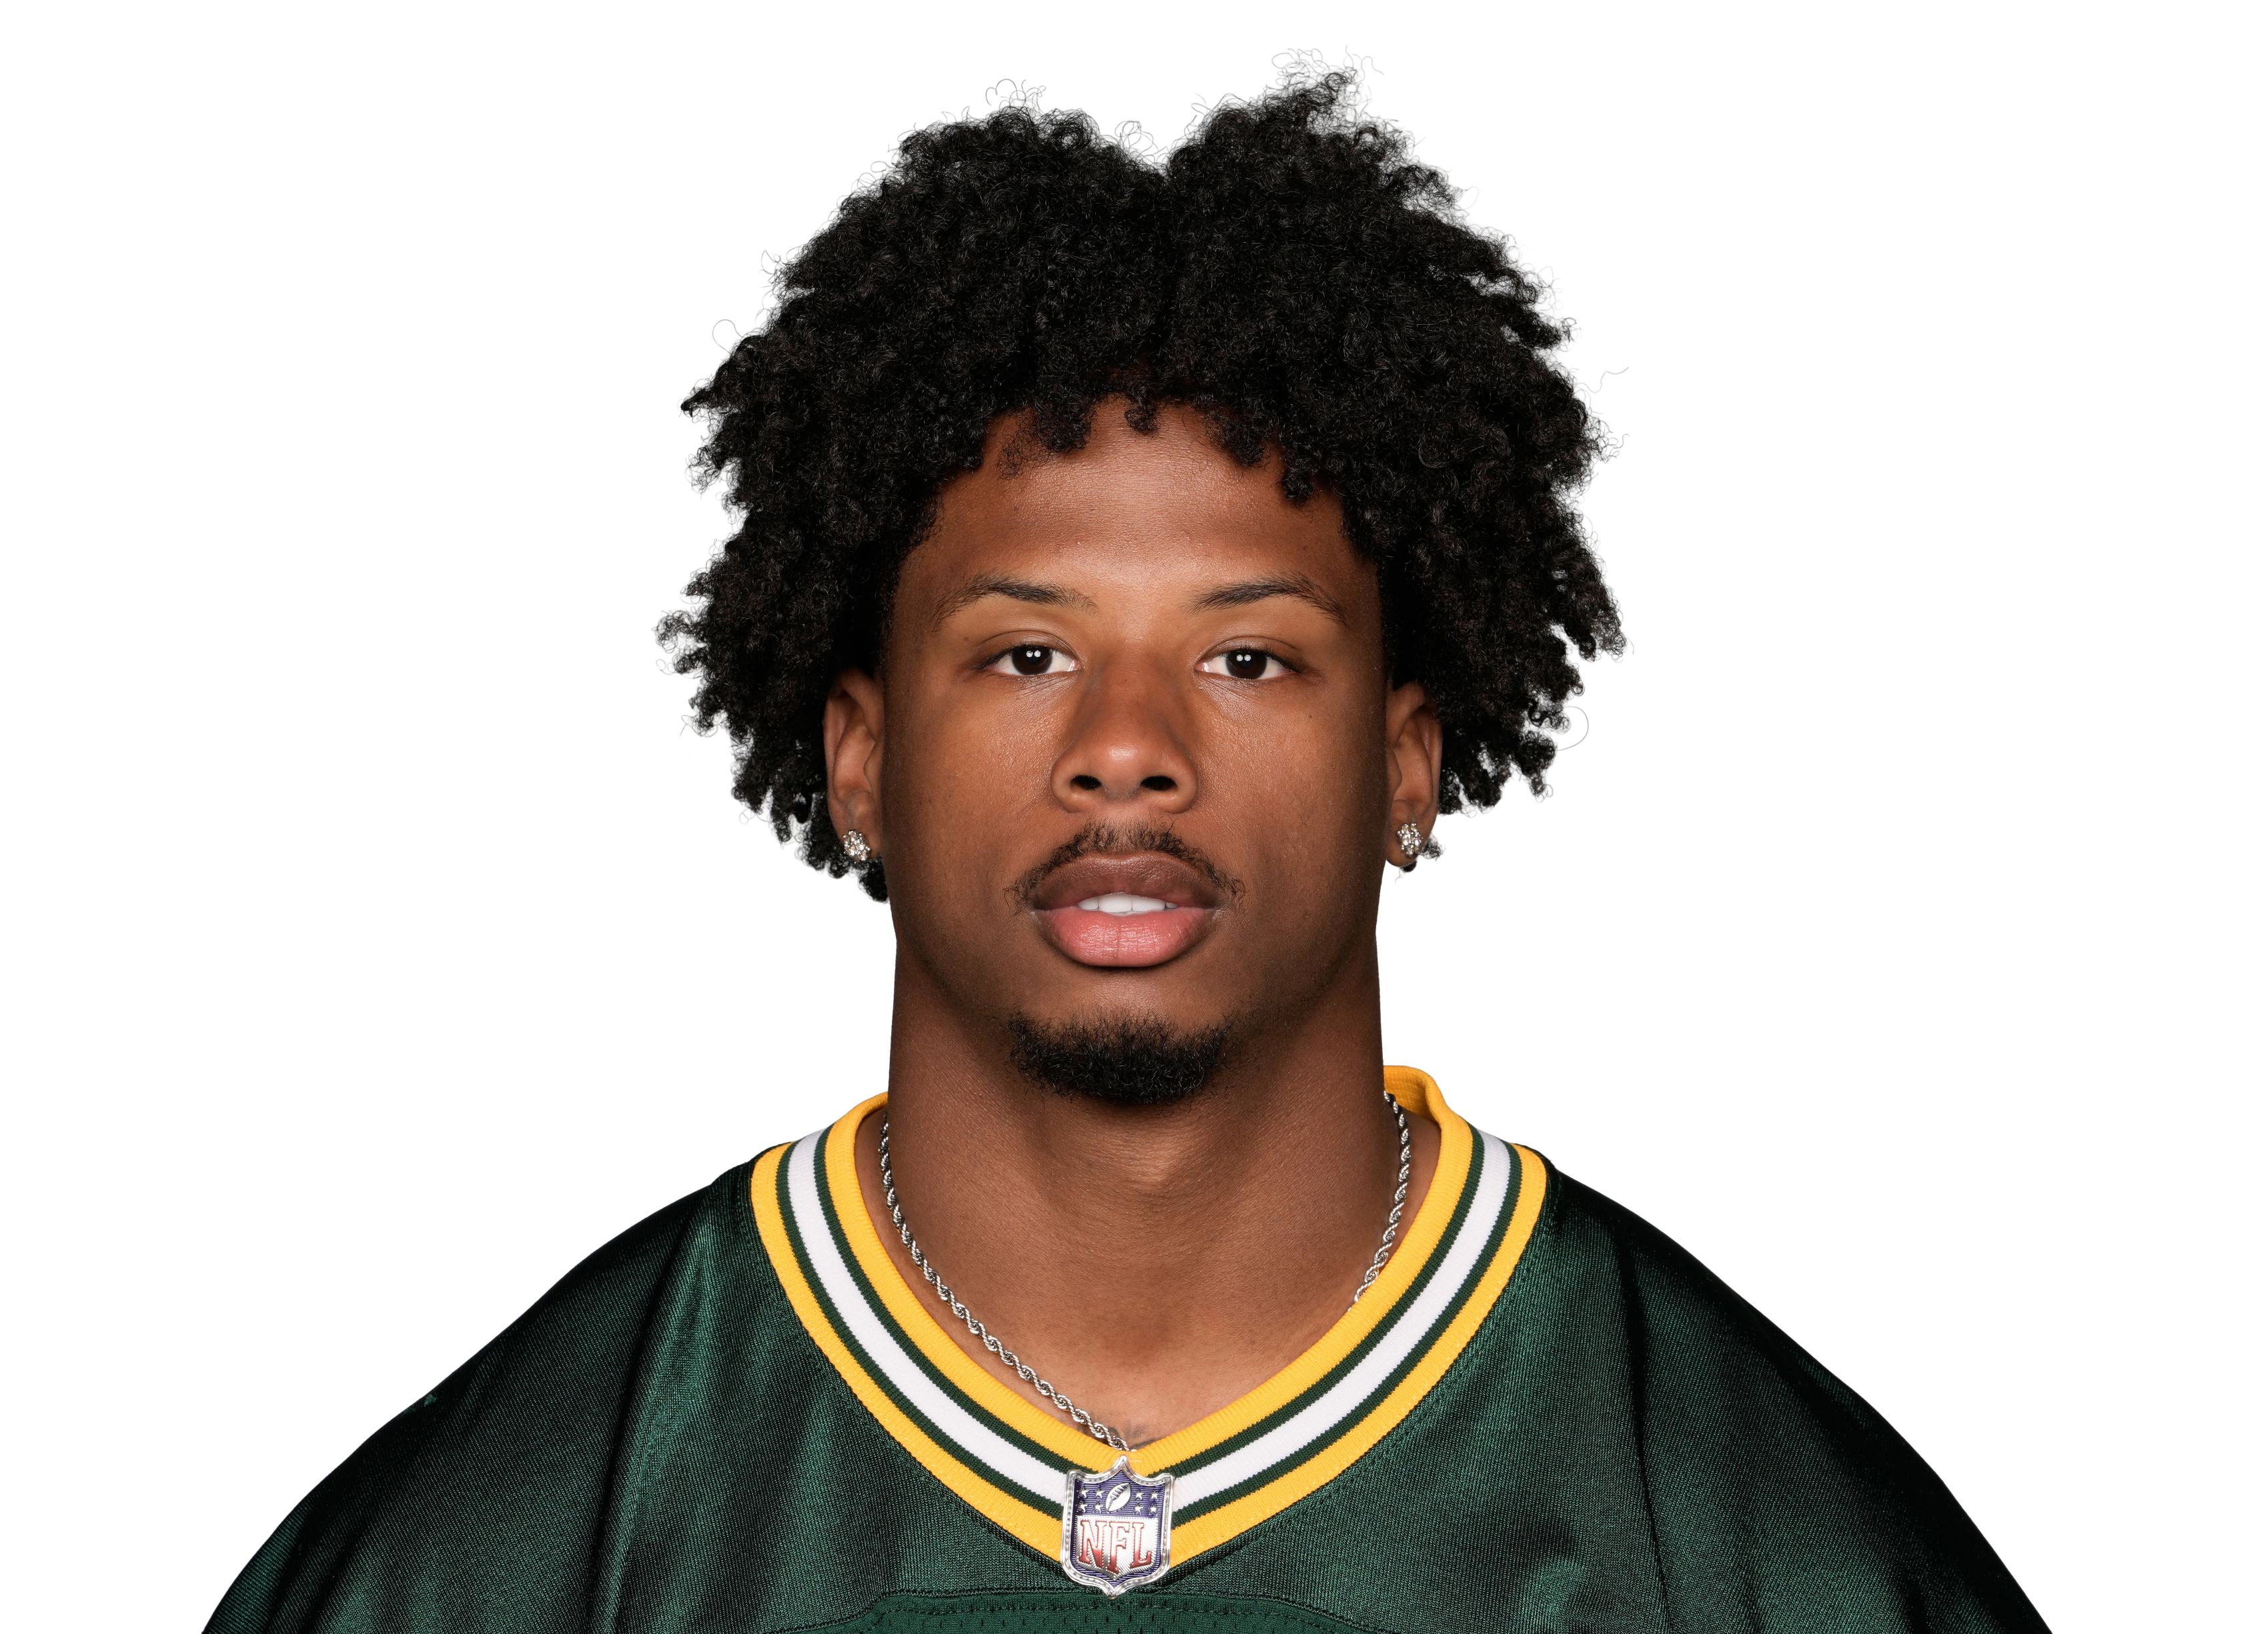 Matthew Goldenvs GB • Wk 7 | 9.9 | 12 | 6 | 39 | 0 | 0 |
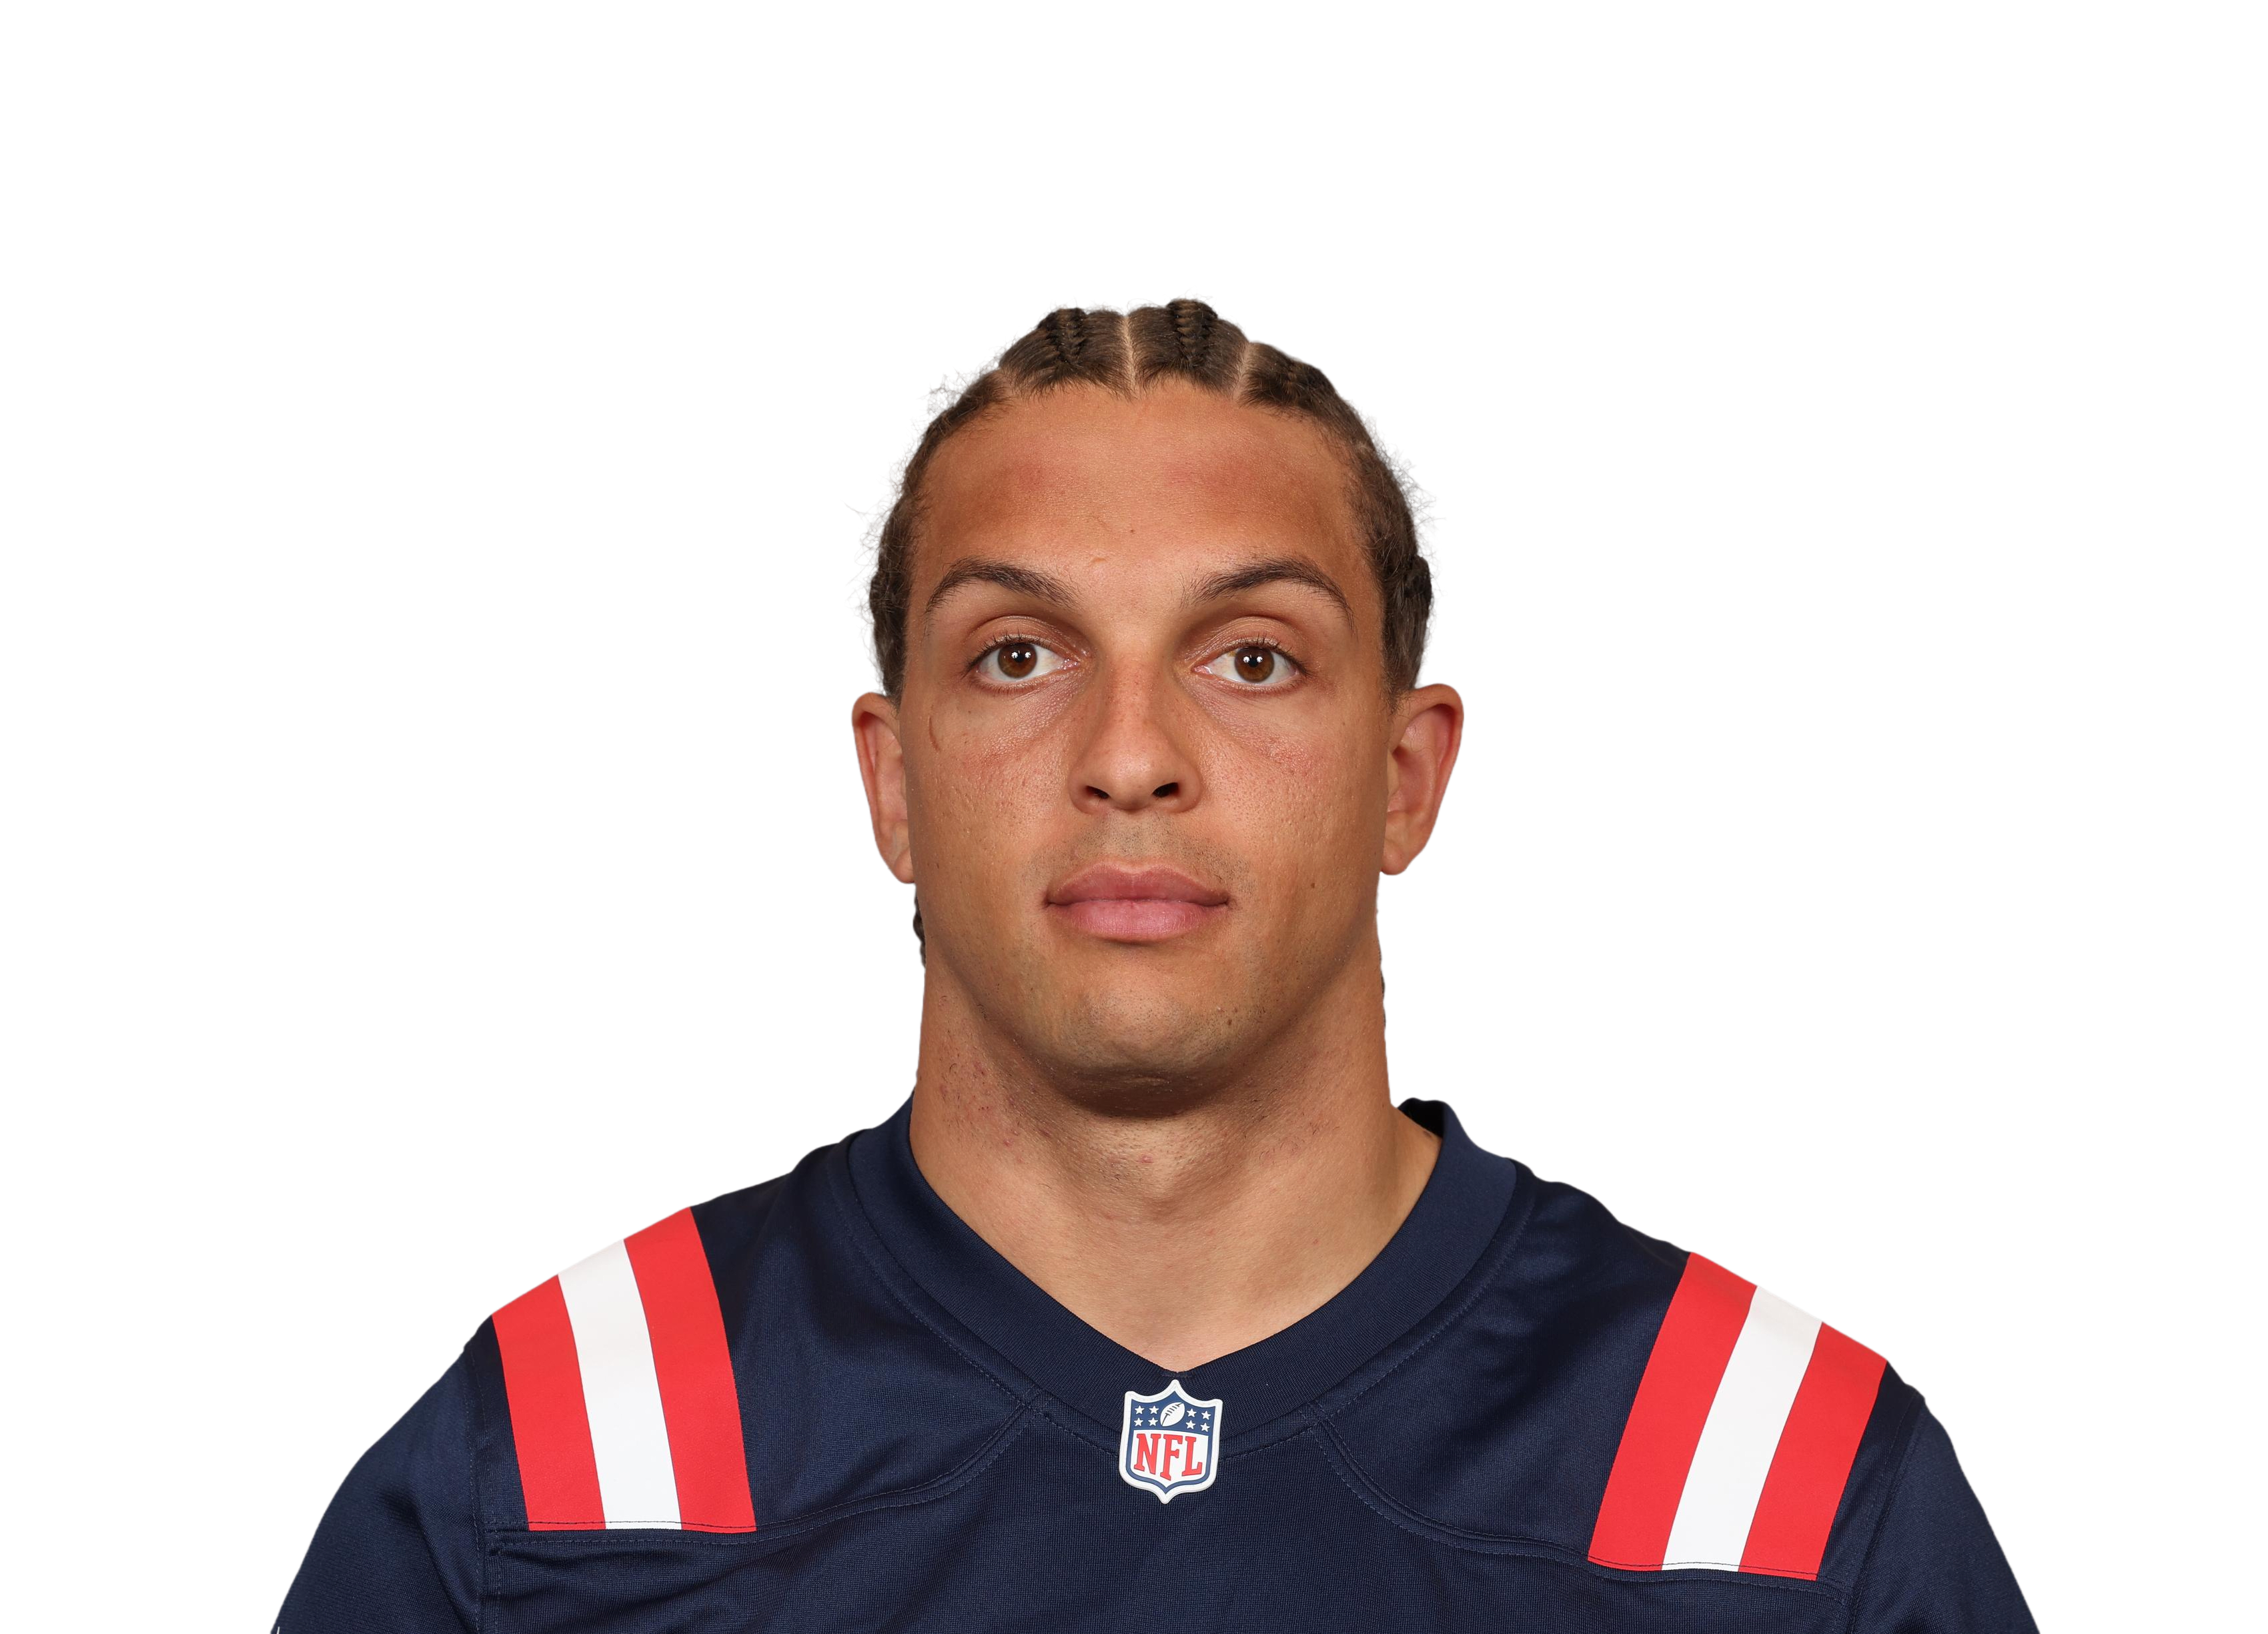 Mack Hollinsvs NE • Wk 10 | 9.8 | 6 | 5 | 48 | 0 | 0 |
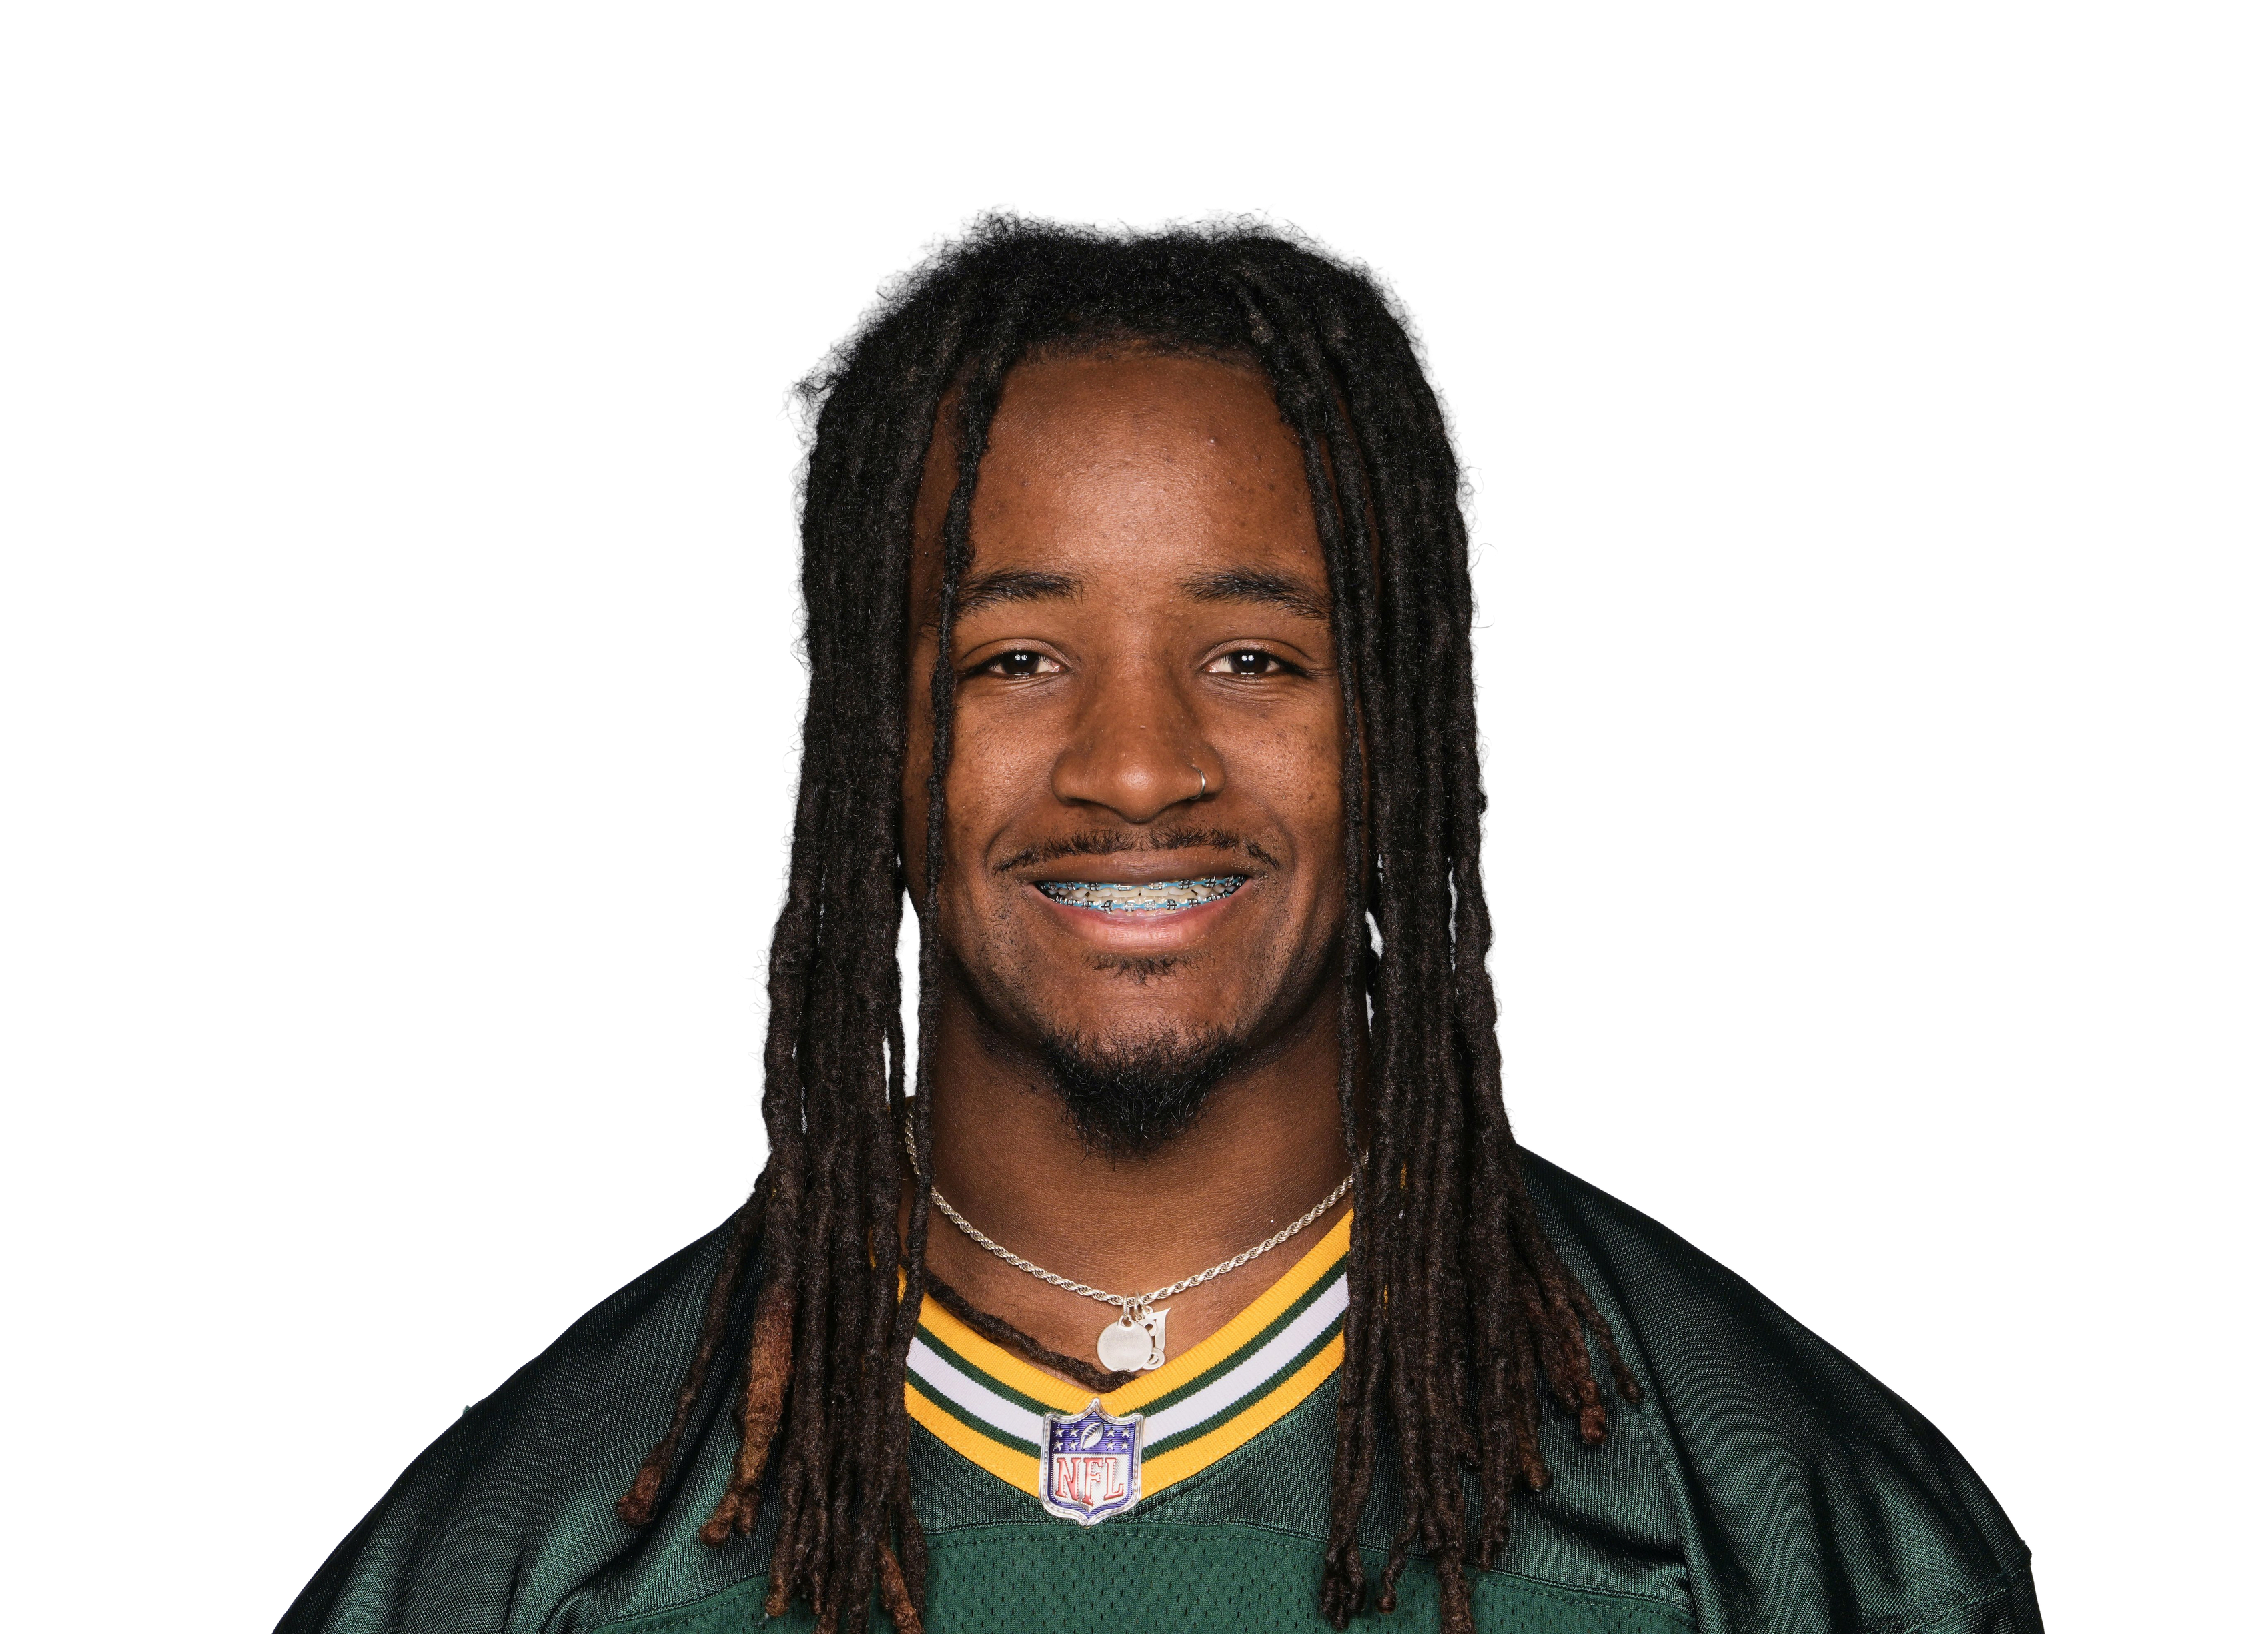 Savion Williamsvs GB • Wk 7 | 8.1 | 3 | 3 | 47 | 0 | 4 |
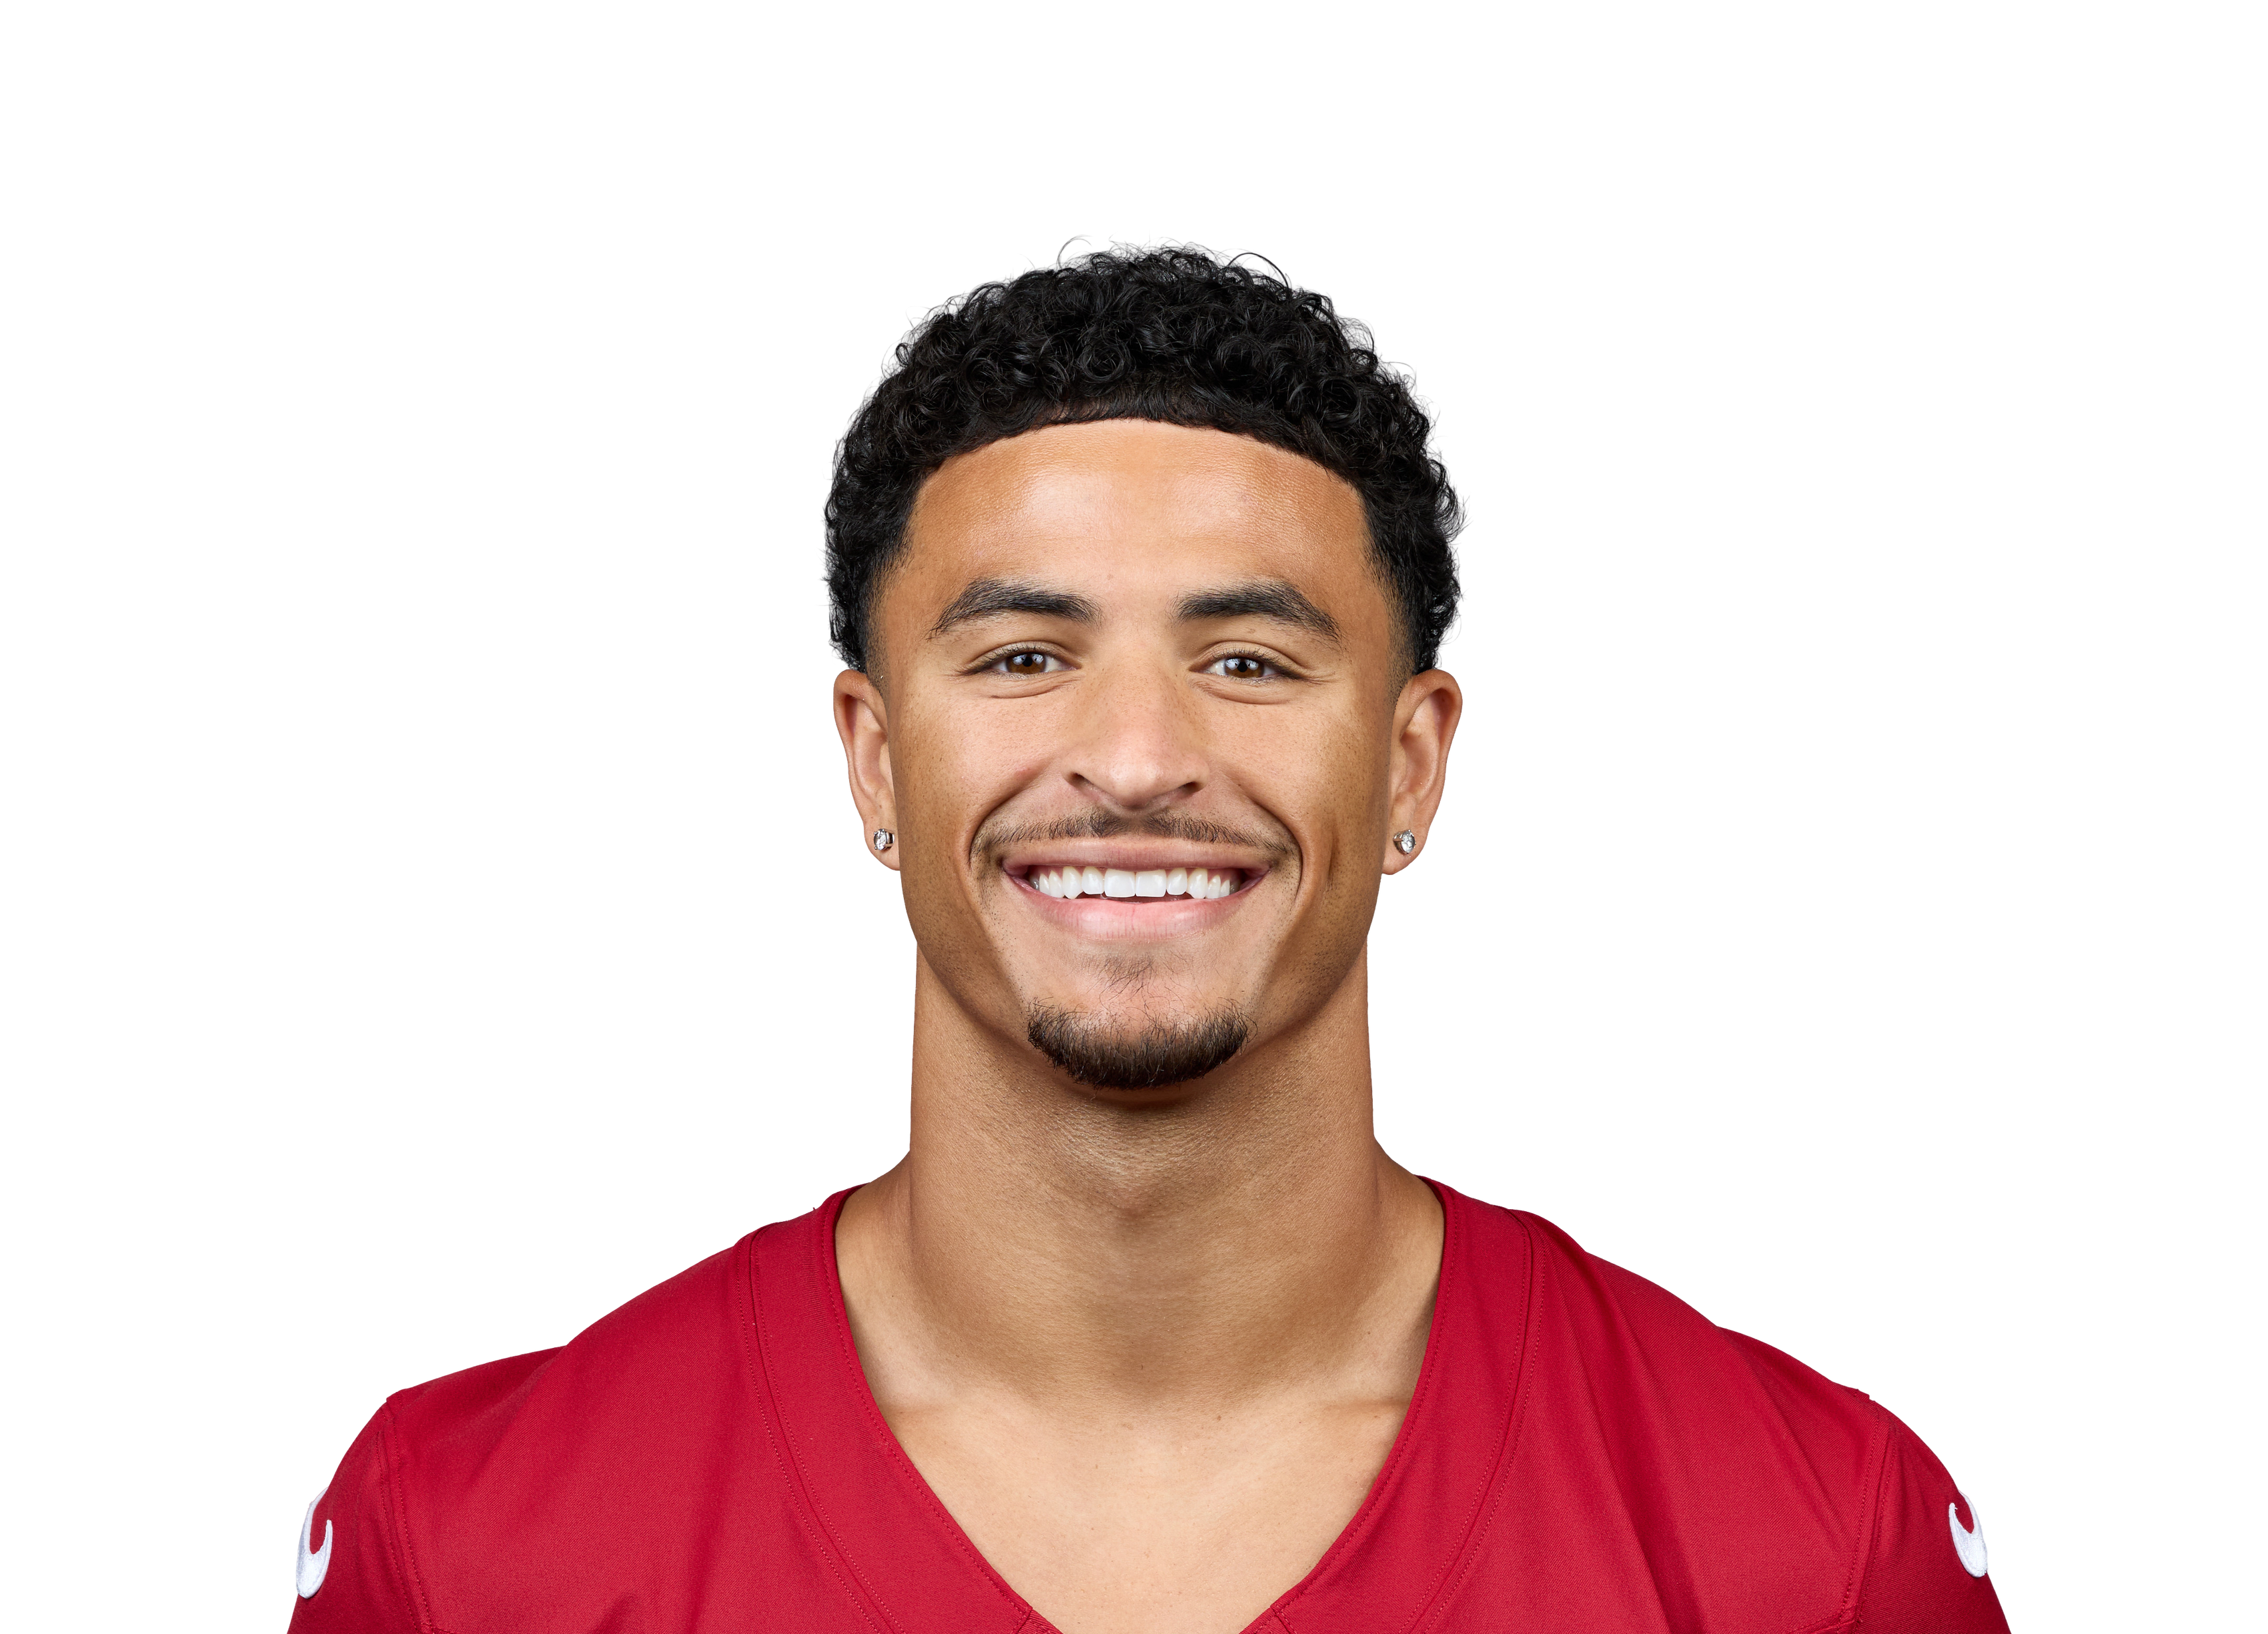 Michael Wilson@ ARI • Wk 5 | 7.3 | 7 | 4 | 30 | 0 | 0 |
 Bryce Lancevs NO • Wk 1 | 7.2 | 4 | 3 | 42 | 0 | 0 |
 Khalil Shakir@ BUF • Wk 2 | 6.8 | 6 | 3 | 38 | 0 | 0 |
 John Metchie III@ CAR • Wk 4 | 6.7 | 5 | 3 | 37 | 0 | 0 |
 Brycen Tremayne@ CAR • Wk 4 | 5.2 | 3 | 2 | 32 | 0 | 0 |
 Reggie Virgil@ ARI • Wk 5 | 4.9 | 5 | 2 | 29 | 0 | 0 |
 A.J. Brownvs NE • Wk 10 | 4.7 | 6 | 2 | 27 | 0 | 0 |
 Malik Washington@ MIA • Wk 9 | 4.1 | 3 | 2 | 21 | 0 | 0 |
 Jalen Brooks@ ARI • Wk 5 | 3.6 | 7 | 2 | 16 | 0 | 0 |
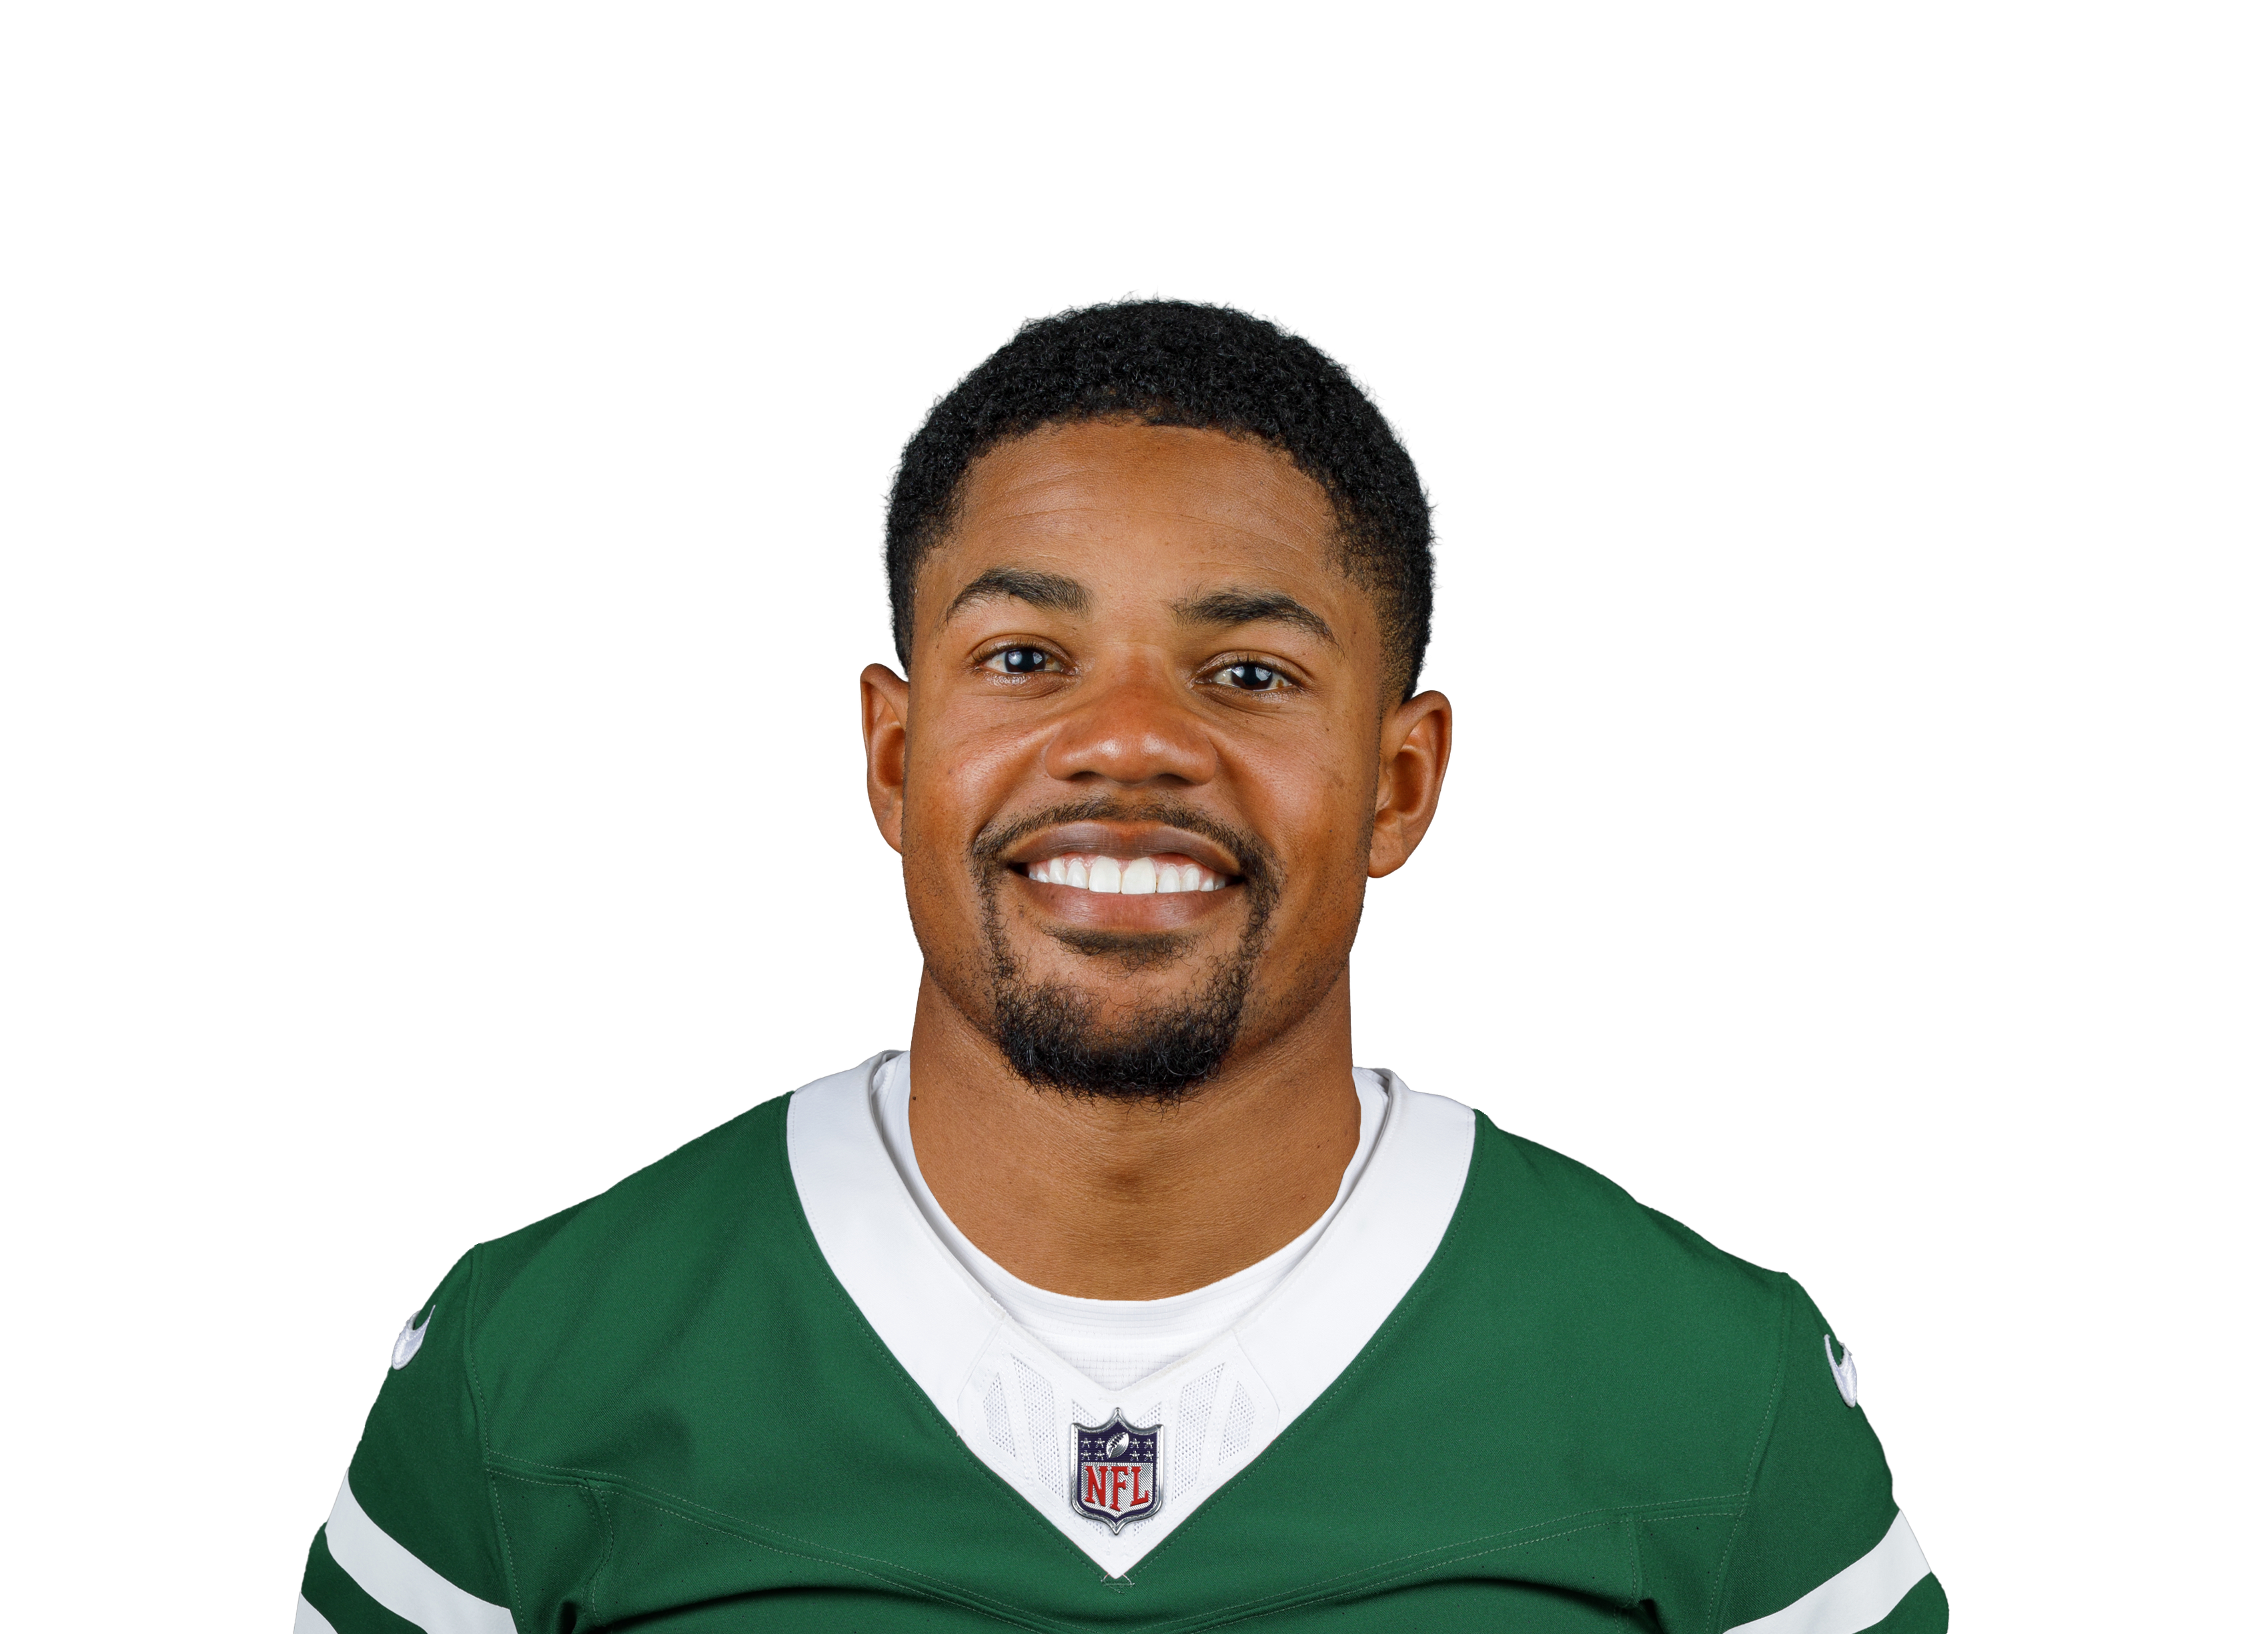 Sterling Shepardvs NYJ • Wk 3 | 3.3 | 1 | 1 | 3 | 0 | 0 |
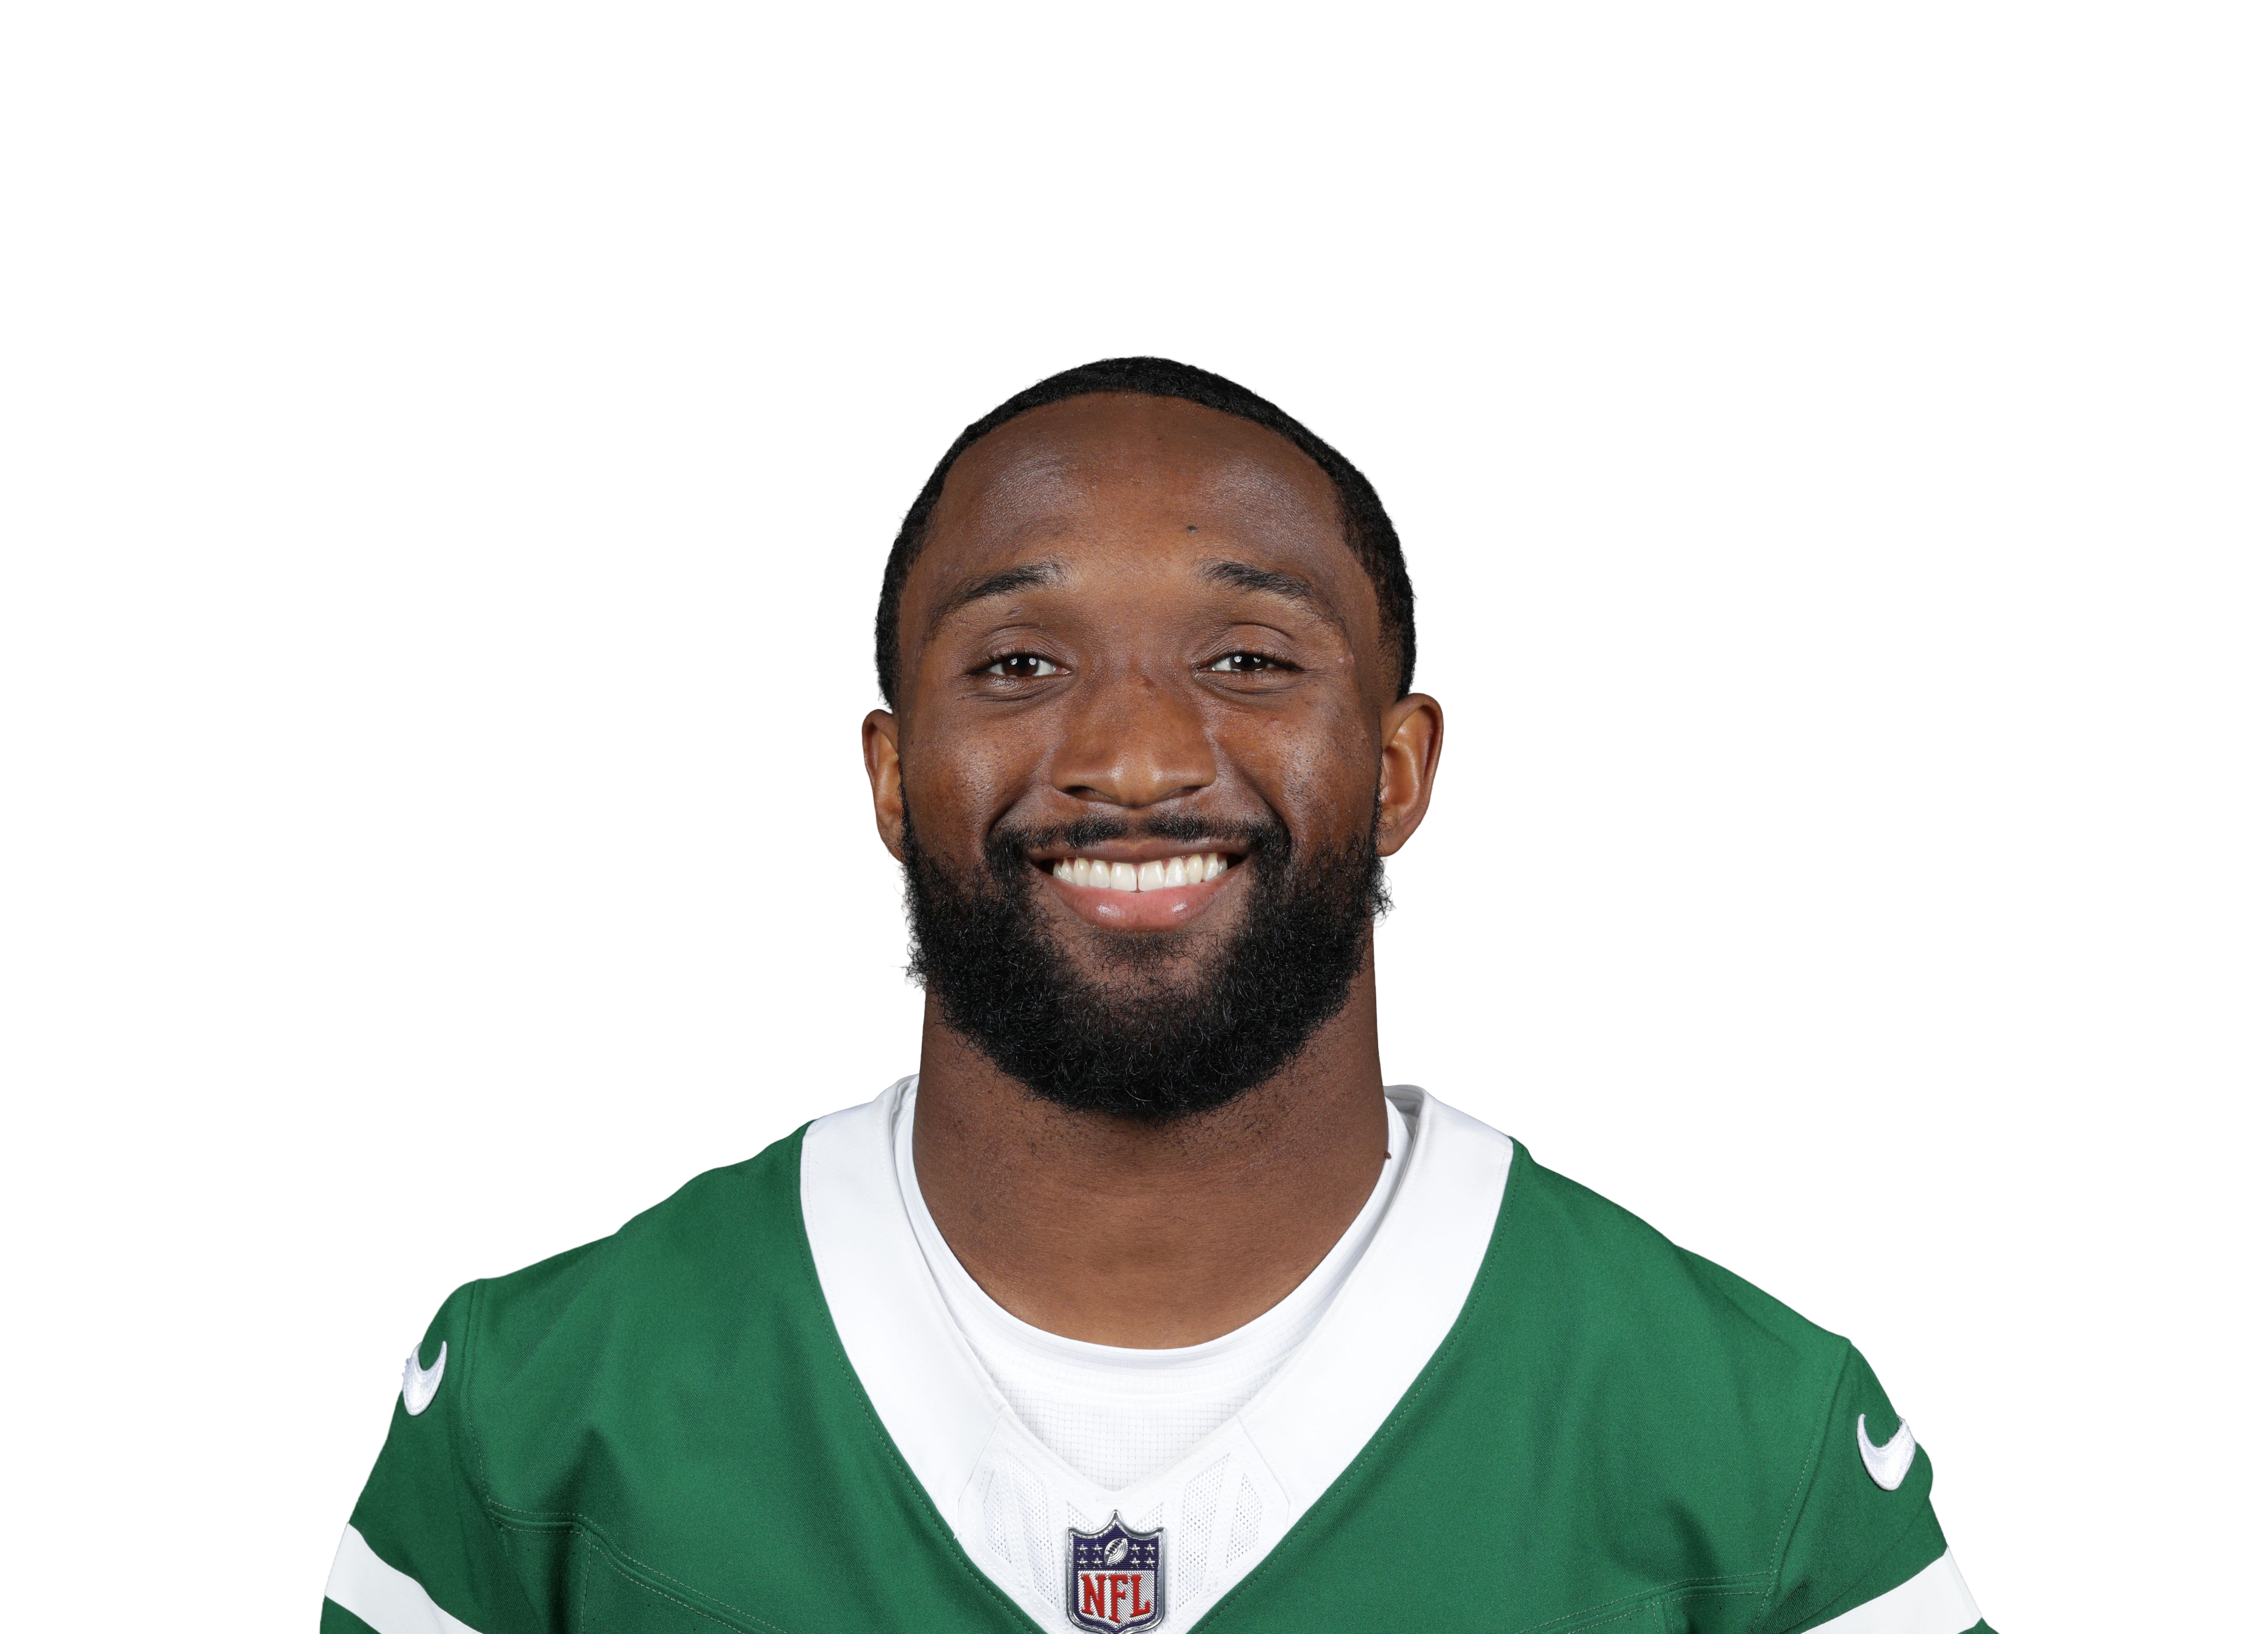 Isaiah Williamsvs NYJ • Wk 3 | 3.1 | 2 | 1 | 21 | 0 | 0 |
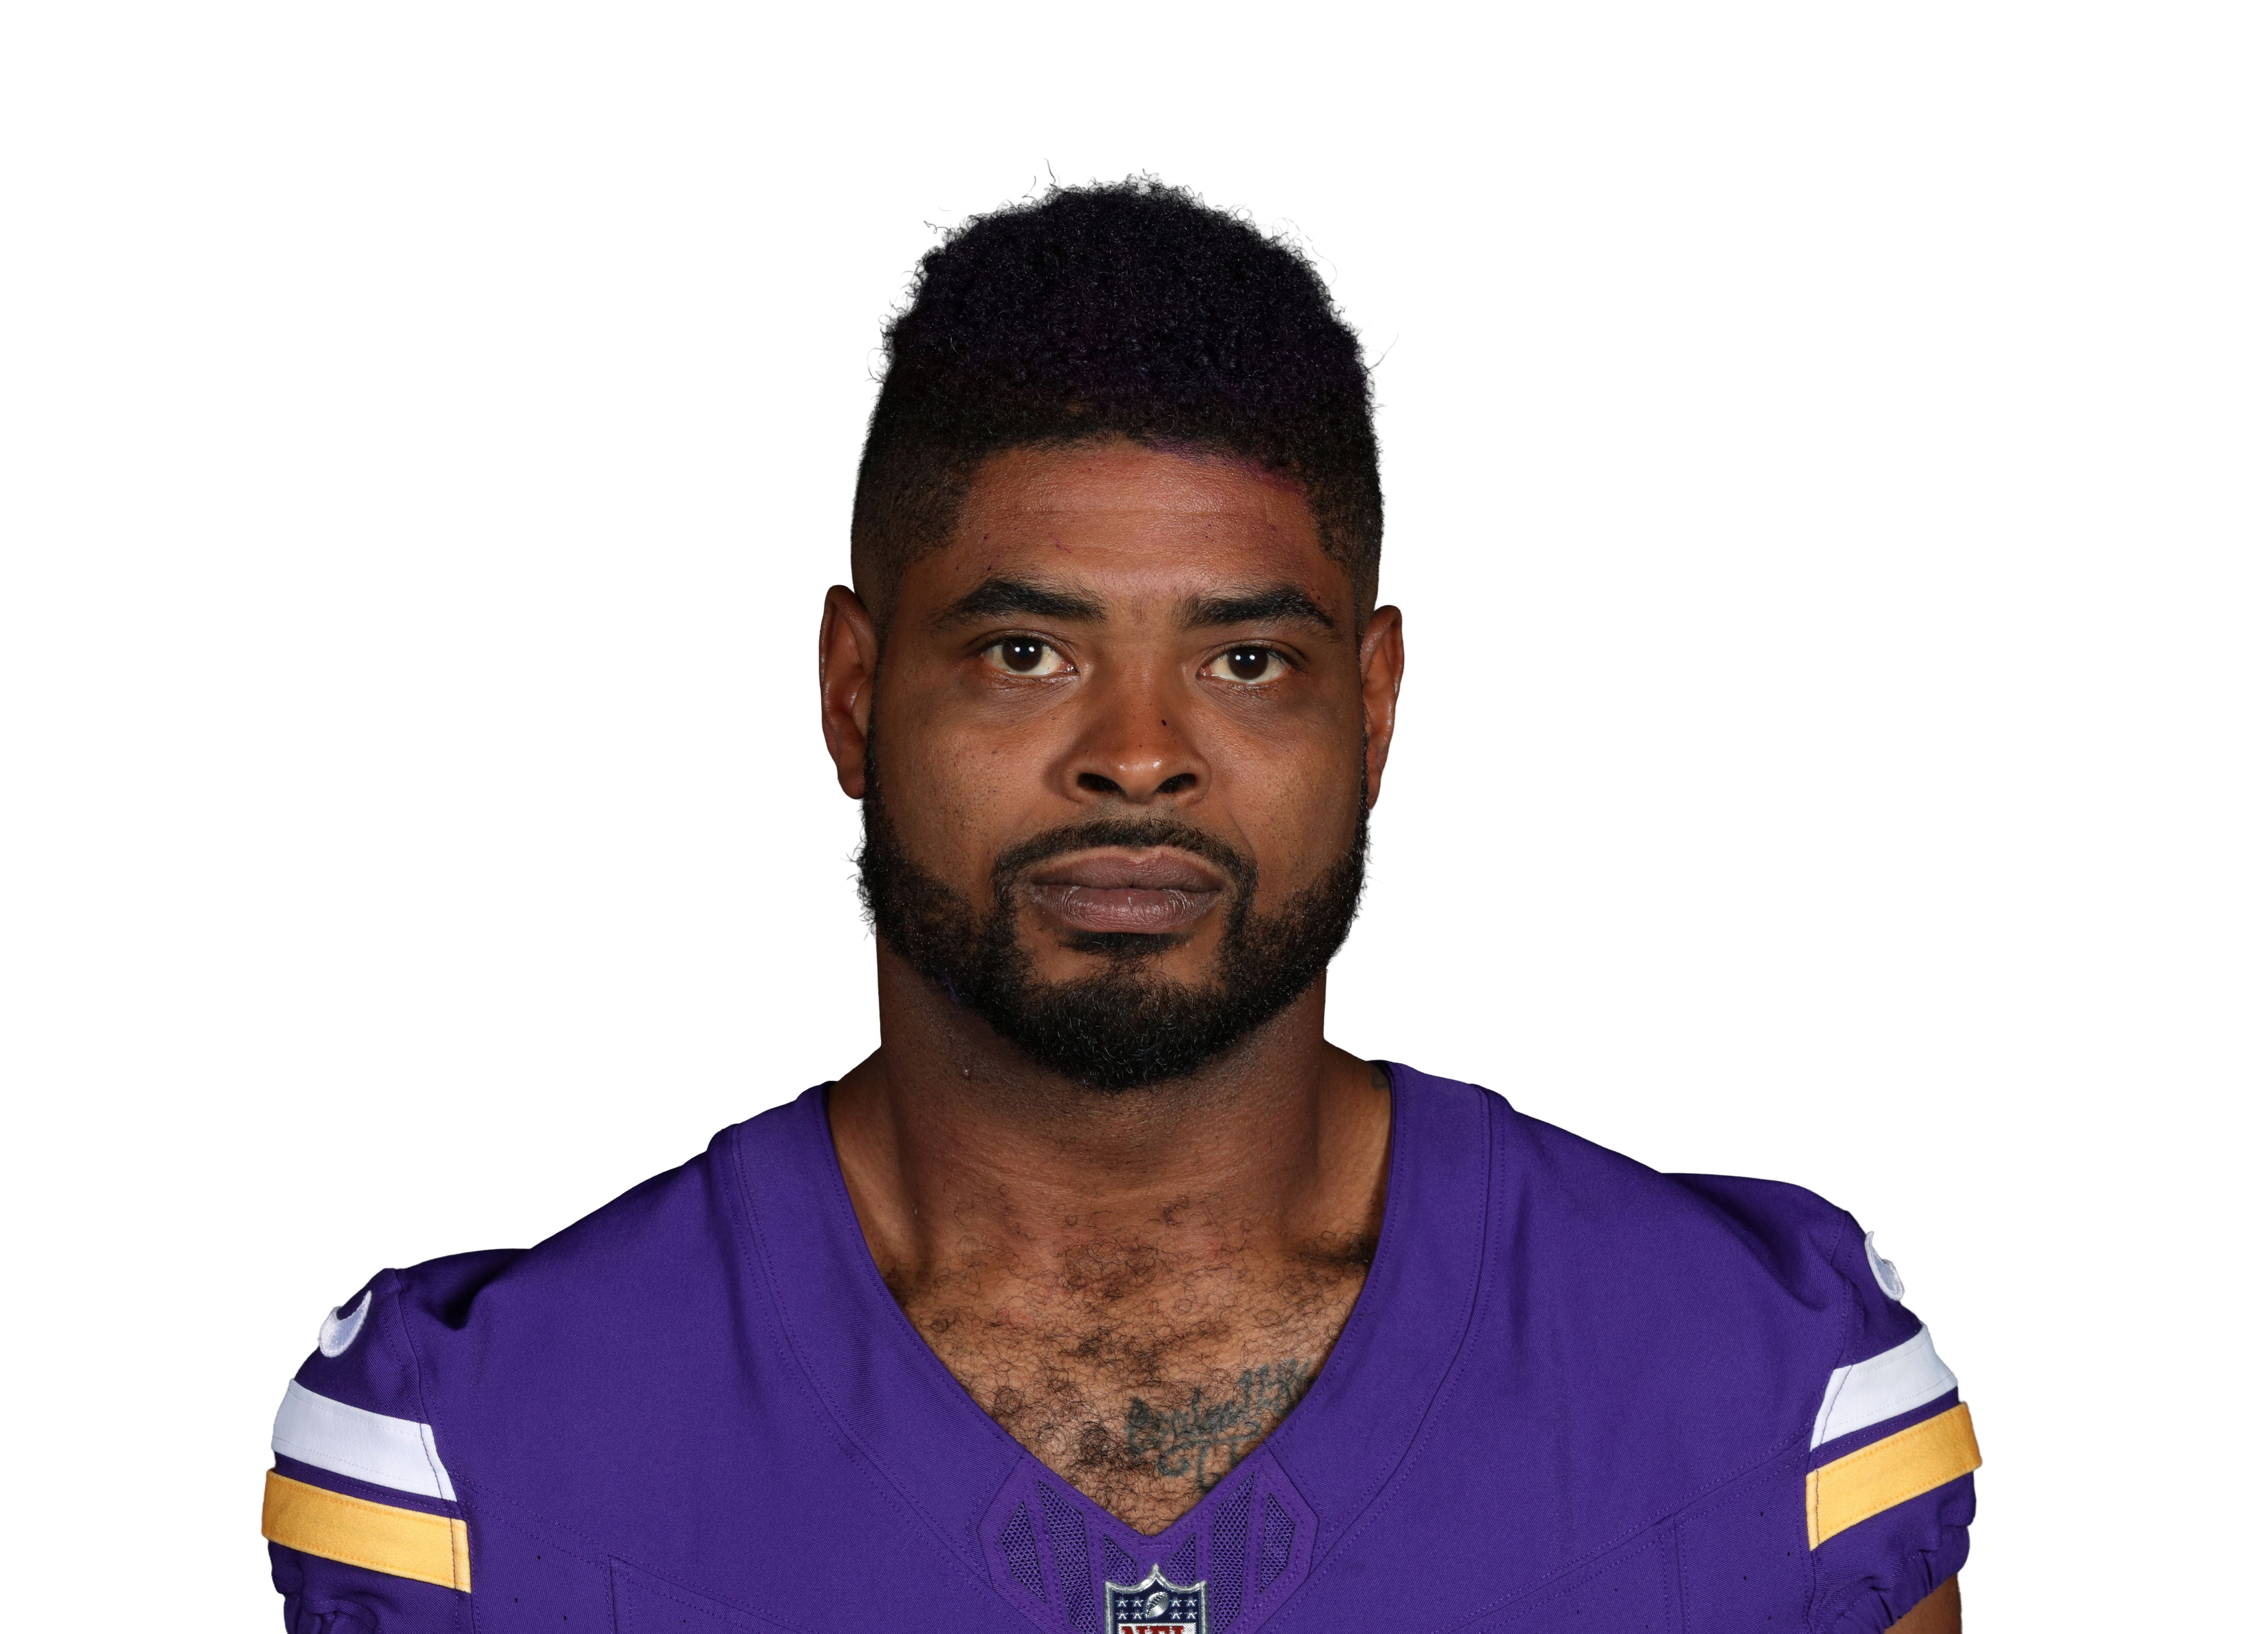 Jauan Jenningsvs MIN • Wk 8 | 3.1 | 2 | 2 | 11 | 0 | 0 |
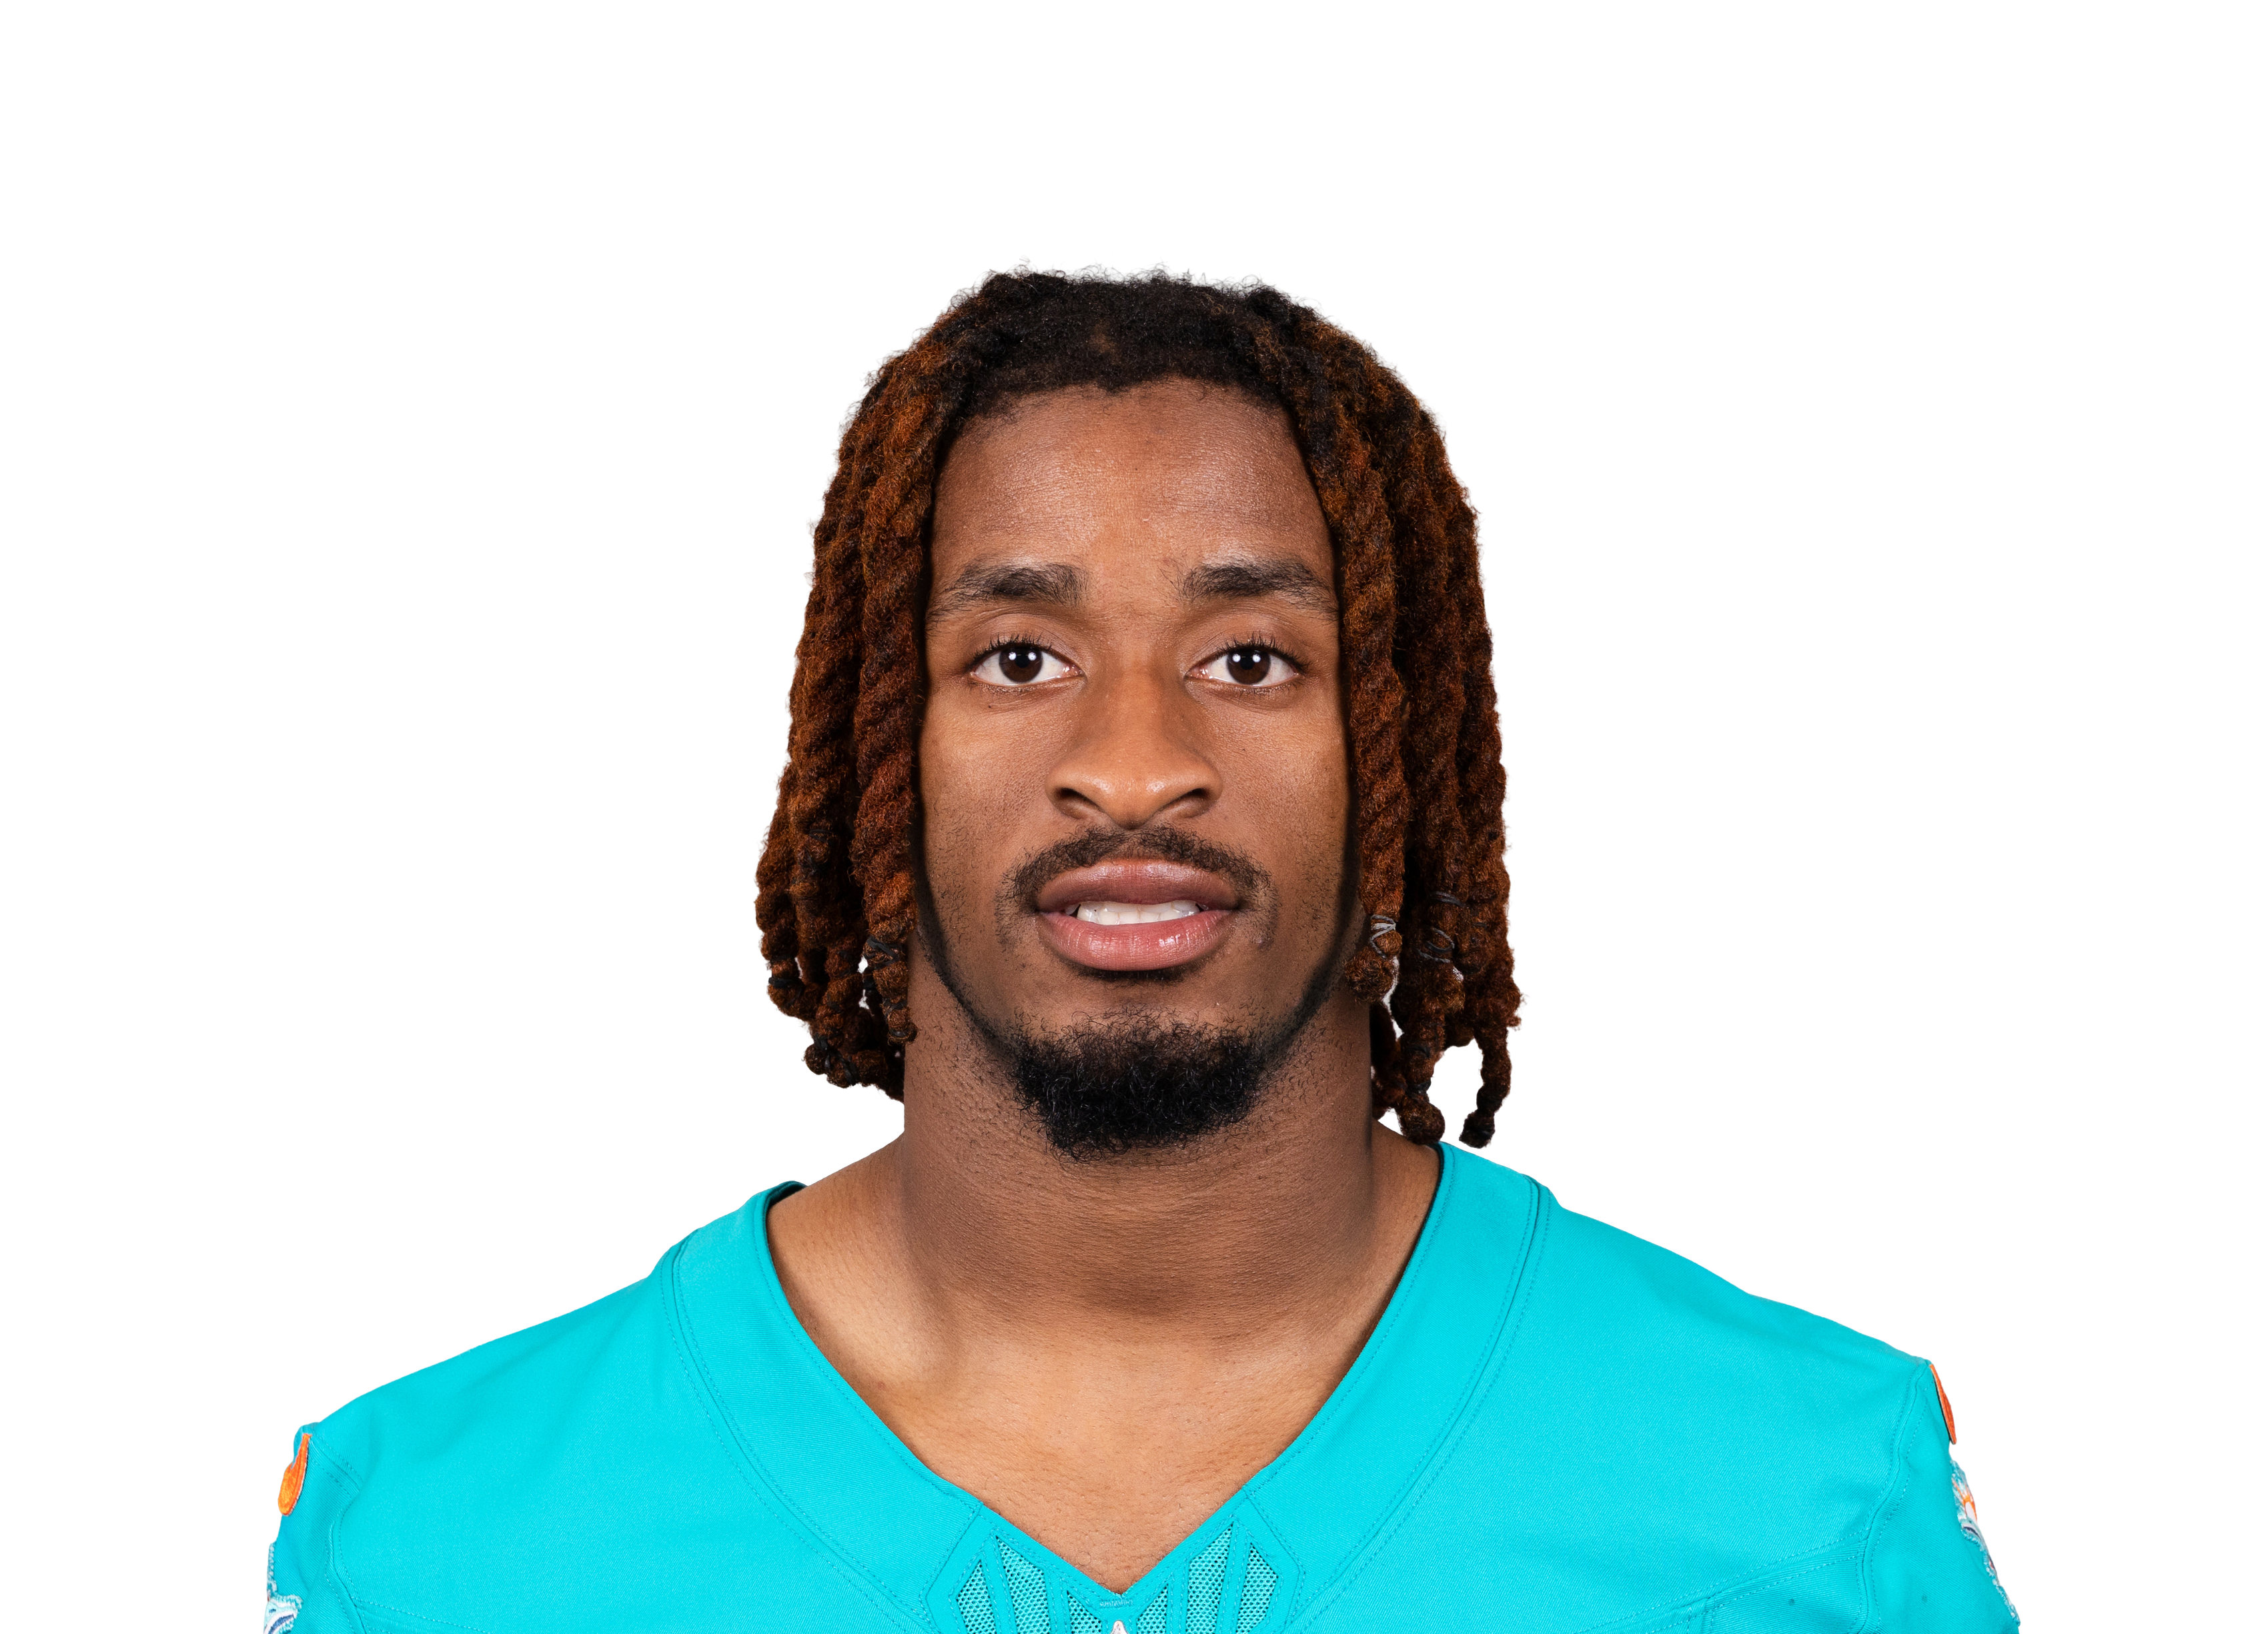 Kevin Coleman Jr.@ MIA • Wk 9 | 1.6 | 0 | 0 | 0 | 0 | 16 |
 Bo Meltonvs GB • Wk 7 | 1.4 | 2 | 1 | 4 | 0 | 0 |
 DeMario Douglasvs NE • Wk 10 | 1.4 | 3 | 1 | 4 | 0 | 0 |
 Barion Brownvs NO • Wk 1 | 0.3 | 0 | 0 | 0 | 0 | 3 |
 Ja'Seem Reed@ CAR • Wk 4 | 0.0 | 1 | 0 | 0 | 0 | 0 |
 Chris Bell@ MIA • Wk 9 | 0.0 | 1 | 0 | 0 | 0 | 0 |
 Kyle Williamsvs NE • Wk 10 | 0.0 | 1 | 0 | 0 | 0 | 0 |
 Efton Chism IIIvs NE • Wk 10 | 0.0 | 1 | 0 | 0 | 0 | 0 |
 DJ Moore@ BUF • Wk 2 | -0.1 | 0 | 0 | 0 | 0 | -1 |
Fantasy points first, then the stats that matter for his position. Ring around each photo is that player's Mania Rating. Tap a name to open his profile.
| Player | W1 | W2 | W3 | W4 | W5 | W6 | W7 | W8 | W9 | Per game |
|---|---|---|---|---|---|---|---|---|---|---|
| Emeka Egbuka | 663 yds22% targets86% snaps | 516 yds15% targets86% snaps | 962 yds26% targets74% snaps | 413 yds15% targets94% snaps | 938 yds36% targets89% snaps | 1648 yds39% targets86% snaps | — | — | 538 yds17% targets76% snaps | 7.740 yds a game • 5.1 per target24% targets84% snaps |
| Chris Godwin Jr. | 440 yds15% targets86% snaps | 346 yds9% targets86% snaps | 425 yds11% targets62% snaps | 731 yds27% targets89% snaps | 337 yds12% targets88% snaps | 837 yds20% targets92% snaps | 527 yds46% targets73% snaps | 10 yds33% targets82% snaps | 316 yds10% targets91% snaps | 4.229 yds a game • 6.8 per target20% targets83% snaps |
| Ted Hurst III | 336 yds11% targets75% snaps | 727 yds21% targets74% snaps | 340 yds9% targets75% snaps | 325 yds12% targets40% snaps | — | 640 yds15% targets50% snaps | 10 yds9% targets56% snaps | 10 yds33% targets42% snaps | 10 yds3% targets1% snaps | 3.121 yds a game • 6.7 per target14% targets52% snaps |
| Tez Johnson | 10 yds4% targets23% snaps | 449 yds12% targets29% snaps | 28 yds6% targets23% snaps | 217 yds8% targets56% snaps | 164 yds4% targets39% snaps | 37 yds7% targets34% snaps | 233 yds18% targets65% snaps | 00 yds0% targets42% snaps | 576 yds17% targets79% snaps | 2.228 yds a game • 12.7 per target8% targets43% snaps |
| Jalen McMillan | — | — | 10 yds3% targets3% snaps | — | — | — | — | — | — | 1.00 yds a game • 0.0 per target3% targets3% snaps |
| David Sills | — | — | — | — | — | — | 00 yds0% targets25% snaps | — | 00 yds0% targets9% snaps | 0.00 yds a game0% targets17% snaps |
| Kameron Johnson | 00 yds0% targets9% snaps | 00 yds0% targets0% snaps | 00 yds0% targets1% snaps | 23 yds8% targets8% snaps | 00 yds0% targets3% snaps | 00 yds0% targets0% snaps | 00 yds0% targets3% snaps | — | 00 yds0% targets0% snaps | 0.30 yds a game • 1.5 per target1% targets3% snaps |
| Use | Game | Proj | PPR | Tgt | Rec | Rec Yd | Car | Rush Yd | TD | Snap |
|---|---|---|---|---|---|---|---|---|---|---|
W1 vs CIN | 10.4 | 8.3 | 4 | 4 | 40 | 1 | 3 | 0 | 86% | |
W2 vs CLE | 10.8 | 8.8 | 3 | 3 | 46 | 1 | 12 | 0 | 86% | |
W3 vs MIN | 9.6 | 5.5 | 4 | 3 | 25 | 0 | 0 | 0 | 62% | |
W4 vs GB | 8.2 | 9.1 | 7 | 6 | 31 | 0 | 0 | 0 | 89% | |
W5 vs DAL | 9.5 | 7 | 3 | 3 | 37 | 1 | 3 | 0 | 88% | |
W6 vs PIT | 8.5 | 7.7 | 8 | 4 | 37 | 0 | 0 | 0 | 92% | |
W7 vs CAR | 11.1 | 6.7 | 5 | 4 | 27 | 0 | 0 | 0 | 73% | |
W8 vs ATL | 12.6 | 0 | 1 | 0 | 0 | 0 | 0 | 0 | 82% | |
W9 vs CHI | 9.3 | 4.8 | 3 | 2 | 16 | 1 | 12 | 0 | 91% |
Ranked against 64 WRs with at least 35 targets. He is still a small sample (38 targets), so his ranks lean toward average. Ranks account for how much work each number is based on, so a perfect record on a few plays does not beat one over a full workload. Tap a stat to see the full ranking.
Chris Godwin Jr.
Pick a teammate with or without. Pick more than one to combine them, like a game without the QB and without the other back.
Teammate injuries shift his Week 11 Rating2 teammate notes ▾
TBDETHow this is built
| Player | W1 | W2 | W3 | W4 | W5 | W6 | W7 | W8 | W9 | Per game |
|---|---|---|---|---|---|---|---|---|---|---|
| Emeka Egbuka | 663 yds22% targets86% snaps | 516 yds15% targets86% snaps | 962 yds26% targets74% snaps | 413 yds15% targets94% snaps | 938 yds36% targets89% snaps | 1648 yds39% targets86% snaps | — | — | 538 yds17% targets76% snaps | 7.740 yds a game • 5.1 per target24% targets84% snaps |
| Chris Godwin Jr. | 440 yds15% targets86% snaps | 346 yds9% targets86% snaps | 425 yds11% targets62% snaps | 731 yds27% targets89% snaps | 337 yds12% targets88% snaps | 837 yds20% targets92% snaps | 527 yds46% targets73% snaps | 10 yds33% targets82% snaps | 316 yds10% targets91% snaps | 4.229 yds a game • 6.8 per target20% targets83% snaps |
| Ted Hurst III | 336 yds11% targets75% snaps | 727 yds21% targets74% snaps | 340 yds9% targets75% snaps | 325 yds12% targets40% snaps | — | 640 yds15% targets50% snaps | 10 yds9% targets56% snaps | 10 yds33% targets42% snaps | 10 yds3% targets1% snaps | 3.121 yds a game • 6.7 per target14% targets52% snaps |
| Tez Johnson | 10 yds4% targets23% snaps | 449 yds12% targets29% snaps | 28 yds6% targets23% snaps | 217 yds8% targets56% snaps | 164 yds4% targets39% snaps | 37 yds7% targets34% snaps | 233 yds18% targets65% snaps | 00 yds0% targets42% snaps | 576 yds17% targets79% snaps | 2.228 yds a game • 12.7 per target8% targets43% snaps |
| Jalen McMillan | — | — | 10 yds3% targets3% snaps | — | — | — | — | — | — | 1.00 yds a game • 0.0 per target3% targets3% snaps |
| David Sills | — | — | — | — | — | — | 00 yds0% targets25% snaps | — | 00 yds0% targets9% snaps | 0.00 yds a game0% targets17% snaps |
| Kameron Johnson | 00 yds0% targets9% snaps | 00 yds0% targets0% snaps | 00 yds0% targets1% snaps | 23 yds8% targets8% snaps | 00 yds0% targets3% snaps | 00 yds0% targets0% snaps | 00 yds0% targets3% snaps | — | 00 yds0% targets0% snaps | 0.30 yds a game • 1.5 per target1% targets3% snaps |
| Use | Game | Proj | PPR | Tgt | Rec | Rec Yd | Car | Rush Yd | TD | Snap |
|---|---|---|---|---|---|---|---|---|---|---|
| W1vs CIN | 10.4 | 8.3 | 4 | 4 | 40 | 1 | 3 | 0 | 86% | |
| W2vs CLE | 10.8 | 8.8 | 3 | 3 | 46 | 1 | 12 | 0 | 86% | |
| W3vs MIN | 9.6 | 5.5 | 4 | 3 | 25 | 0 | 0 | 0 | 62% | |
| W4vs GB | 8.2 | 9.1 | 7 | 6 | 31 | 0 | 0 | 0 | 89% | |
| W5vs DAL | 9.5 | 7 | 3 | 3 | 37 | 1 | 3 | 0 | 88% | |
| W6vs PIT | 8.5 | 7.7 | 8 | 4 | 37 | 0 | 0 | 0 | 92% | |
| W7vs CAR | 11.1 | 6.7 | 5 | 4 | 27 | 0 | 0 | 0 | 73% | |
| W8vs ATL | 12.6 | 0 | 1 | 0 | 0 | 0 | 0 | 0 | 82% | |
| W9vs CHI | 9.3 | 4.8 | 3 | 2 | 16 | 1 | 12 | 0 | 91% |
Ranked against 64 WRs with at least 35 targets. He is still a small sample (38 targets), so his ranks lean toward average. Ranks account for how much work each number is based on, so a perfect record on a few plays does not beat one over a full workload. Tap a stat to see the full ranking.
33.1 PPR points a game allowed to wide receivers, 12th most of 32 defenses.
| Player | PPR | Tgt | Rec | Rec Yd | Rec TD | Rush Yd |
|---|---|---|---|---|---|---|
| Tetairoa McMillan@ CAR • Wk 4 | 45.2 | 16 | 14 | 192 | 2 | 0 |
| Chris Olavevs NO • Wk 1 | 28.2 | 13 | 10 | 182 | 0 | 0 |
| Garrett Wilsonvs NYJ • Wk 3 | 26.7 | 13 | 10 | 107 | 1 | 0 |
| Devaughn Velevs NO • Wk 1 | 19.9 | 9 | 7 | 69 | 1 | 0 |
| Justin Jeffersonvs MIN • Wk 8 | 14.3 | 9 | 5 | 33 | 1 | 0 |
| Caleb Douglas@ MIA • Wk 9 | 13.0 | 8 | 6 | 70 | 0 | 0 |
| Keon Coleman@ BUF • Wk 2 | 12.3 | 6 | 6 | 63 | 0 | 0 |
| Kendrick Bourne@ ARI • Wk 5 | 12.0 | 8 | 5 | 70 | 0 | 0 |
| Jordan Addisonvs MIN • Wk 8 | 11.6 | 8 | 3 | 66 | 0 | 0 |
| Josh Palmer@ BUF • Wk 2 | 11.3 | 3 | 1 | 43 | 1 | 0 |
| Christian Watsonvs GB • Wk 7 | 10.7 | 8 | 5 | 57 | 0 | 0 |
| Matthew Goldenvs GB • Wk 7 | 9.9 | 12 | 6 | 39 | 0 | 0 |
| Mack Hollinsvs NE • Wk 10 | 9.8 | 6 | 5 | 48 | 0 | 0 |
| Savion Williamsvs GB • Wk 7 | 8.1 | 3 | 3 | 47 | 0 | 4 |
| Michael Wilson@ ARI • Wk 5 | 7.3 | 7 | 4 | 30 | 0 | 0 |
| Bryce Lancevs NO • Wk 1 | 7.2 | 4 | 3 | 42 | 0 | 0 |
| Khalil Shakir@ BUF • Wk 2 | 6.8 | 6 | 3 | 38 | 0 | 0 |
| John Metchie III@ CAR • Wk 4 | 6.7 | 5 | 3 | 37 | 0 | 0 |
| Brycen Tremayne@ CAR • Wk 4 | 5.2 | 3 | 2 | 32 | 0 | 0 |
| Reggie Virgil@ ARI • Wk 5 | 4.9 | 5 | 2 | 29 | 0 | 0 |
| A.J. Brownvs NE • Wk 10 | 4.7 | 6 | 2 | 27 | 0 | 0 |
| Malik Washington@ MIA • Wk 9 | 4.1 | 3 | 2 | 21 | 0 | 0 |
| Jalen Brooks@ ARI • Wk 5 | 3.6 | 7 | 2 | 16 | 0 | 0 |
| Sterling Shepardvs NYJ • Wk 3 | 3.3 | 1 | 1 | 3 | 0 | 0 |
| Isaiah Williamsvs NYJ • Wk 3 | 3.1 | 2 | 1 | 21 | 0 | 0 |
| Jauan Jenningsvs MIN • Wk 8 | 3.1 | 2 | 2 | 11 | 0 | 0 |
| Kevin Coleman Jr.@ MIA • Wk 9 | 1.6 | 0 | 0 | 0 | 0 | 16 |
| Bo Meltonvs GB • Wk 7 | 1.4 | 2 | 1 | 4 | 0 | 0 |
| DeMario Douglasvs NE • Wk 10 | 1.4 | 3 | 1 | 4 | 0 | 0 |
| Barion Brownvs NO • Wk 1 | 0.3 | 0 | 0 | 0 | 0 | 3 |
| Ja'Seem Reed@ CAR • Wk 4 | 0.0 | 1 | 0 | 0 | 0 | 0 |
| Chris Bell@ MIA • Wk 9 | 0.0 | 1 | 0 | 0 | 0 | 0 |
| Kyle Williamsvs NE • Wk 10 | 0.0 | 1 | 0 | 0 | 0 | 0 |
| Efton Chism IIIvs NE • Wk 10 | 0.0 | 1 | 0 | 0 | 0 | 0 |
| DJ Moore@ BUF • Wk 2 | -0.1 | 0 | 0 | 0 | 0 | -1 |
Fantasy points first, then the stats that matter for his position. Ring around each photo is that player's Mania Rating. Tap a name to open his profile.