
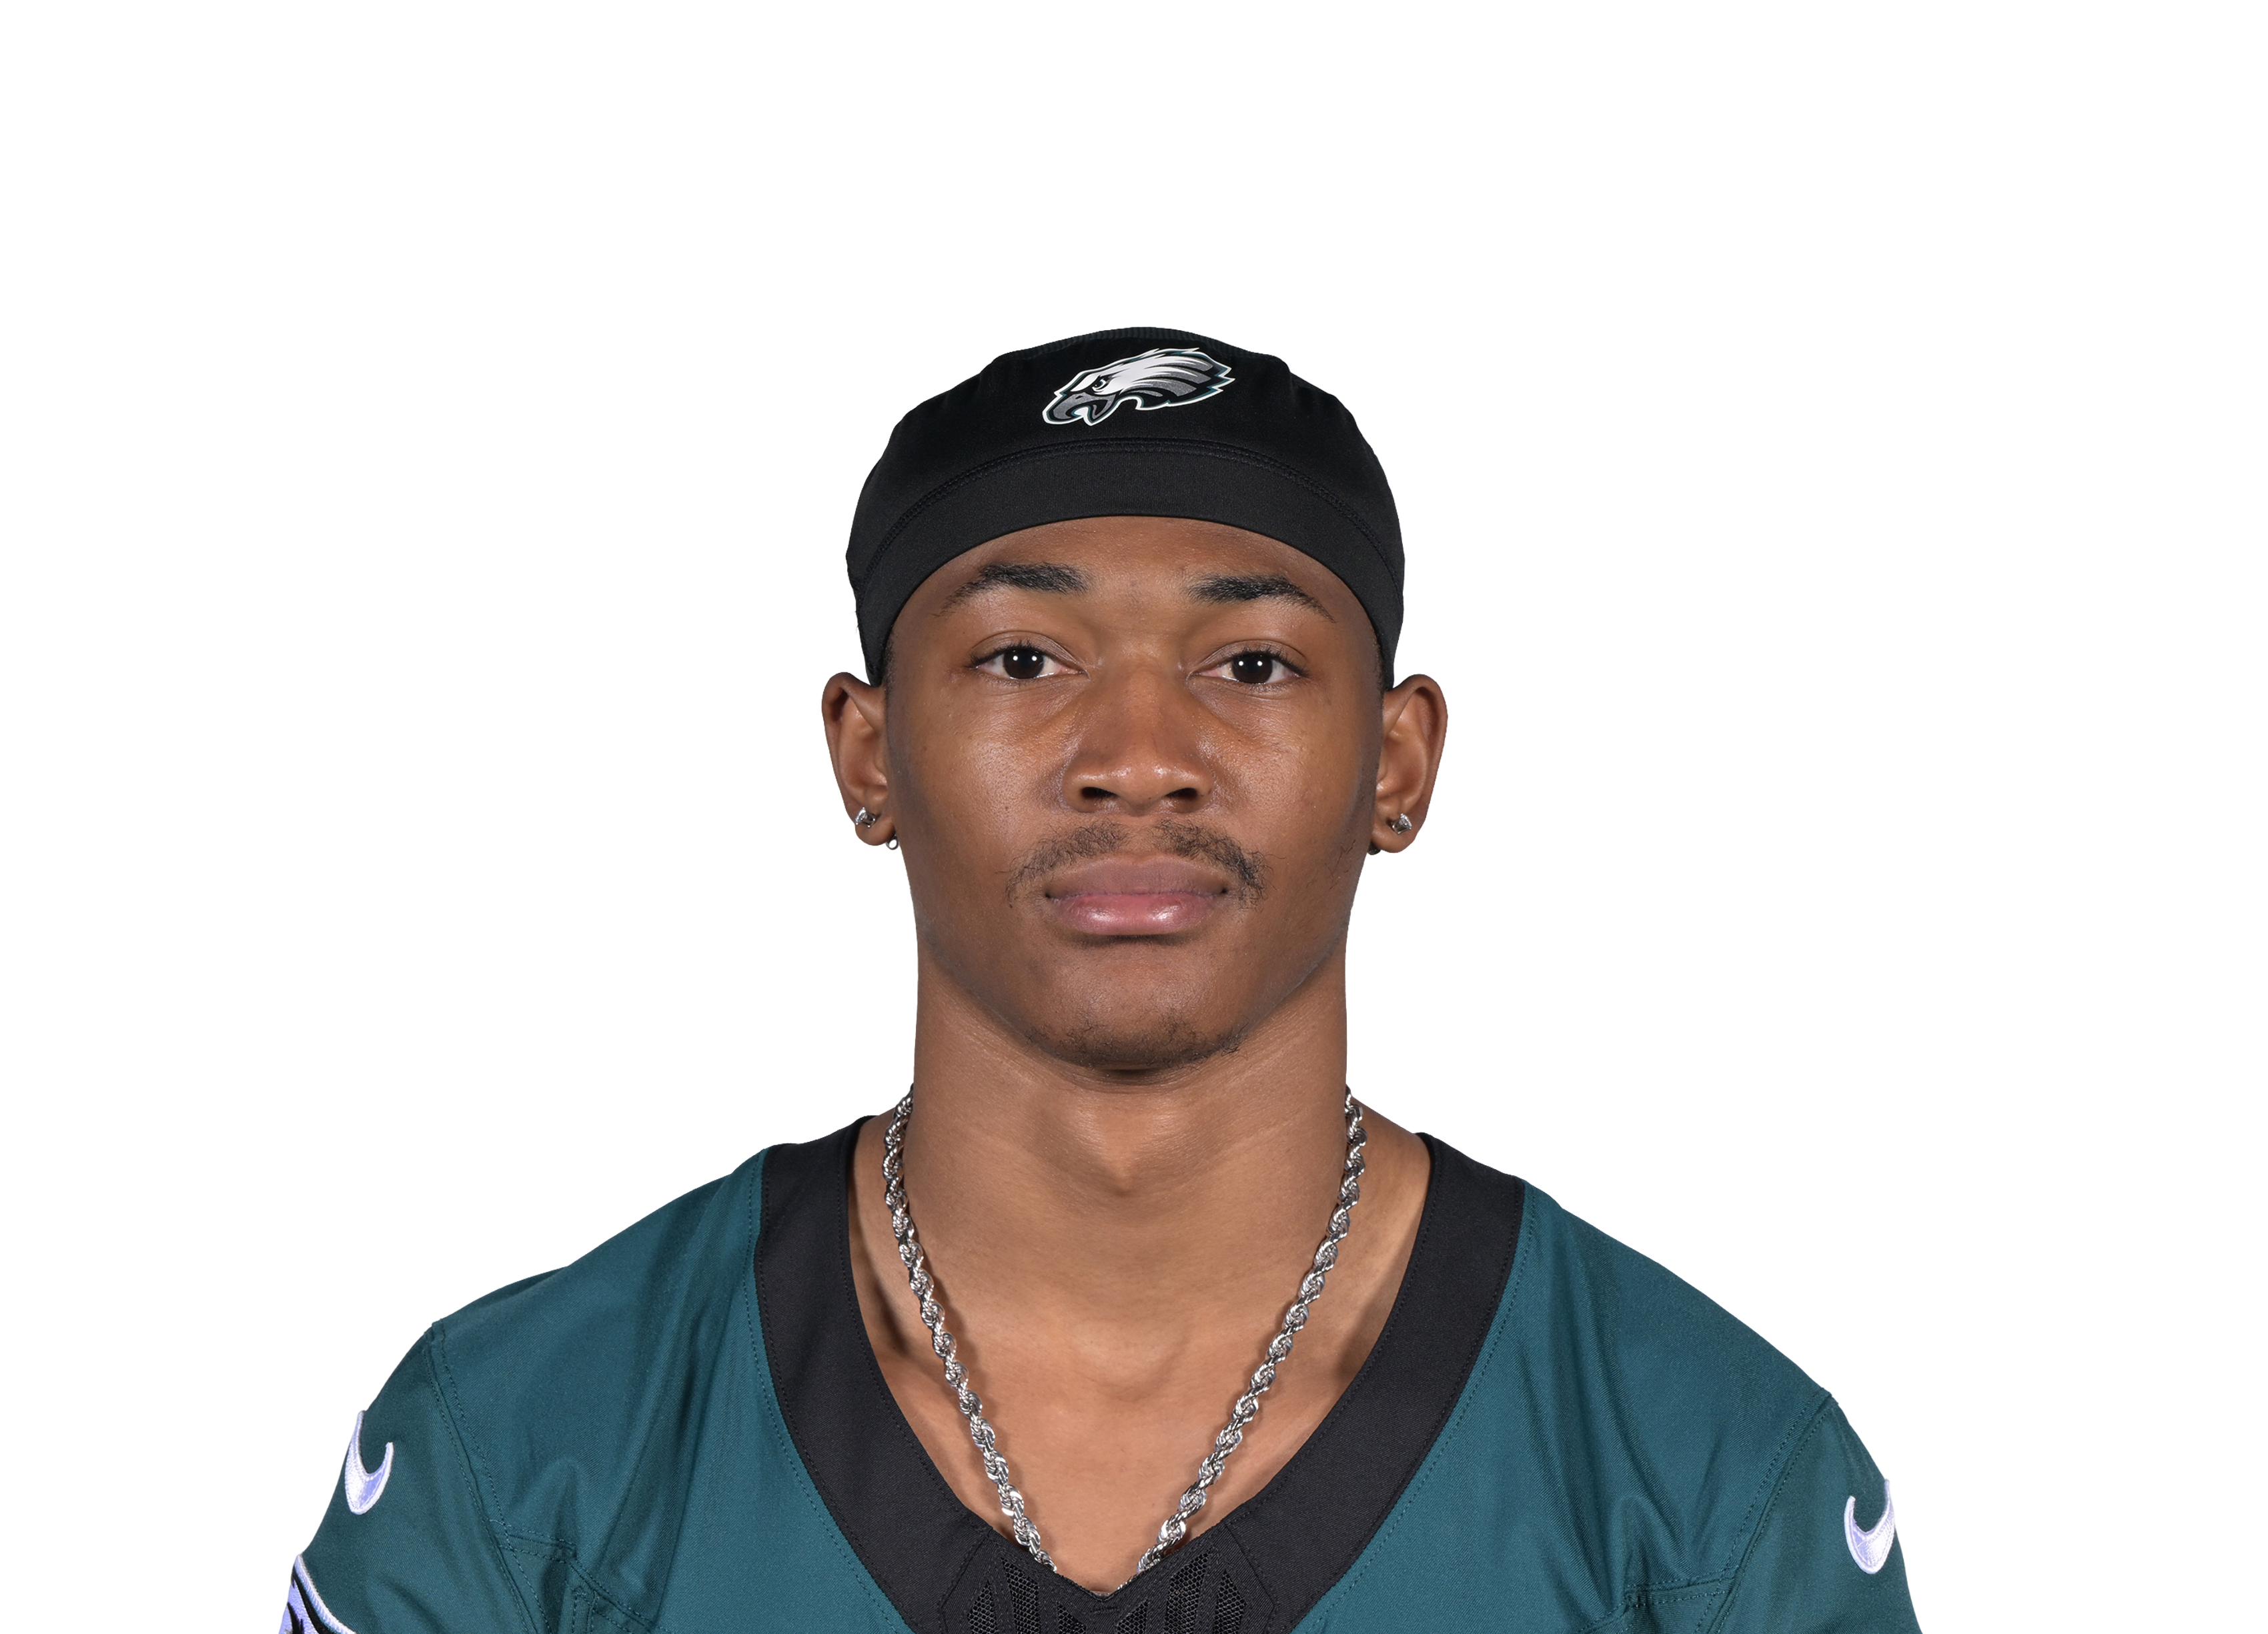
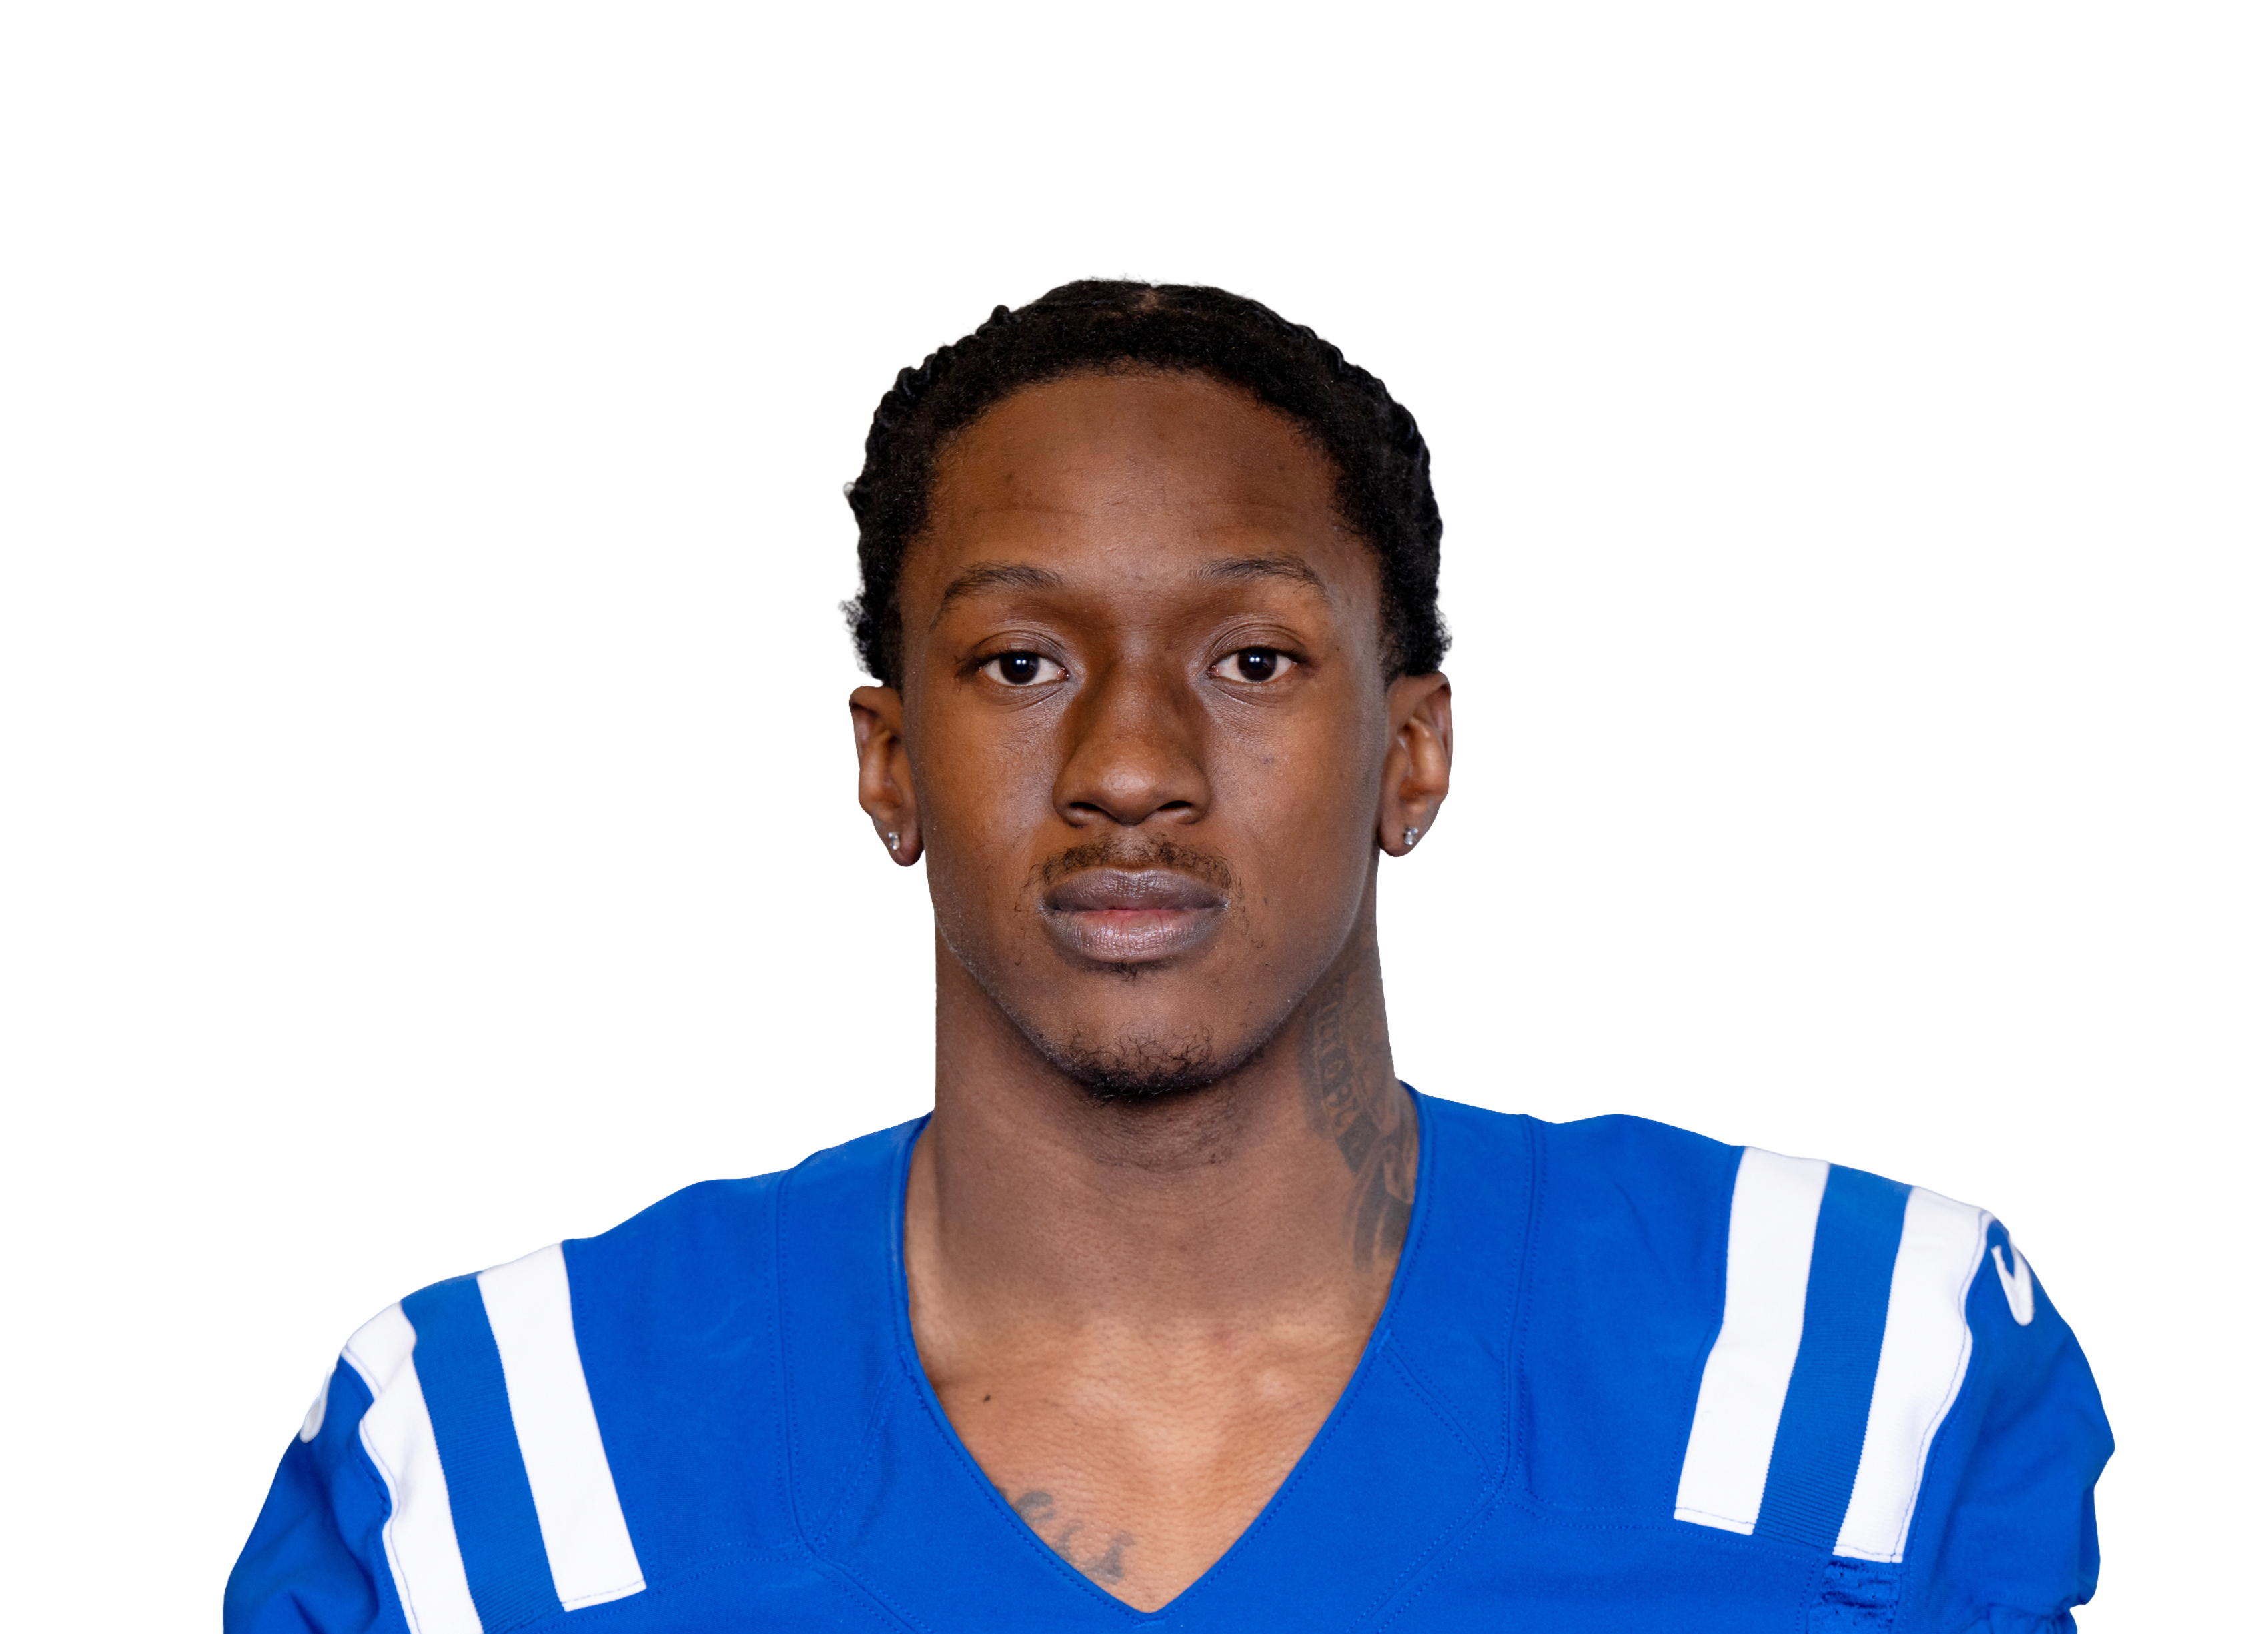
DeVonta Smith
Pick a teammate with or without. Pick more than one to combine them, like a game without the QB and without the other back.
Teammate injuries shift his Week 11 Rating3 teammate notes ▾
 PHI
 PIT
How this is built
31.9 PPR points a game allowed to wide receivers, 17th most of 32 defenses.
| Player | PPR | Tgt | Rec | Rec Yd | Rec TD | Rush Yd |
|---|---|---|---|---|---|---|
 Ja'Marr Chase@ CIN • Wk 10 | 34.1 | 14 | 11 | 231 | 0 | 0 |
| Ja'Marr Chasevs CIN • Wk 3 | 24.8 | 12 | 9 | 98 | 1 | 0 |
 Tee Higginsvs CIN • Wk 3 | 21.0 | 7 | 6 | 90 | 1 | 0 |
 Emeka Egbuka@ TB • Wk 6 | 17.8 | 16 | 7 | 48 | 1 | 0 |
 Devaughn Vele@ NO • Wk 7 | 16.4 | 5 | 5 | 54 | 1 | 0 |
 Denzel Boston@ CLE • Wk 4 | 12.9 | 7 | 4 | 89 | 0 | 0 |
 Romeo Doubs@ NE • Wk 2 | 12.6 | 4 | 3 | 96 | 0 | 0 |
 Chris Olave@ NO • Wk 7 | 11.6 | 10 | 6 | 56 | 0 | 0 |
| Tee Higgins@ CIN • Wk 10 | 11.6 | 6 | 5 | 66 | 0 | 0 |
 KC Concepcion@ CLE • Wk 4 | 11.4 | 8 | 5 | 64 | 0 | 0 |
 Dohnte Meyers@ CIN • Wk 10 | 10.0 | 2 | 2 | 20 | 1 | 0 |
| Denzel Bostonvs CLE • Wk 8 | 9.7 | 11 | 6 | 37 | 0 | 0 |
 Keenan Allenvs IND • Wk 5 | 9.5 | 9 | 5 | 45 | 0 | 0 |
 Barion Brown@ NO • Wk 7 | 8.7 | 3 | 3 | 57 | 0 | 0 |
 Josh Downsvs IND • Wk 5 | 7.7 | 6 | 3 | 47 | 0 | 0 |
 Chris Godwin Jr.@ TB • Wk 6 | 7.7 | 8 | 4 | 37 | 0 | 0 |
 Ted Hurst III@ TB • Wk 6 | 7.0 | 6 | 3 | 40 | 0 | 0 |
| KC Concepcionvs CLE • Wk 8 | 6.7 | 4 | 3 | 37 | 0 | 0 |
 Jerry Jeudy@ CLE • Wk 4 | 6.6 | 3 | 3 | 36 | 0 | 0 |
| Dohnte Meyersvs CIN • Wk 3 | 5.9 | 5 | 3 | 29 | 0 | 0 |
 Drake Londonvs ATL • Wk 1 | 5.5 | 4 | 2 | 29 | 0 | 6 |
 Laquon Treadwellvs IND • Wk 5 | 5.4 | 8 | 2 | 34 | 0 | 0 |
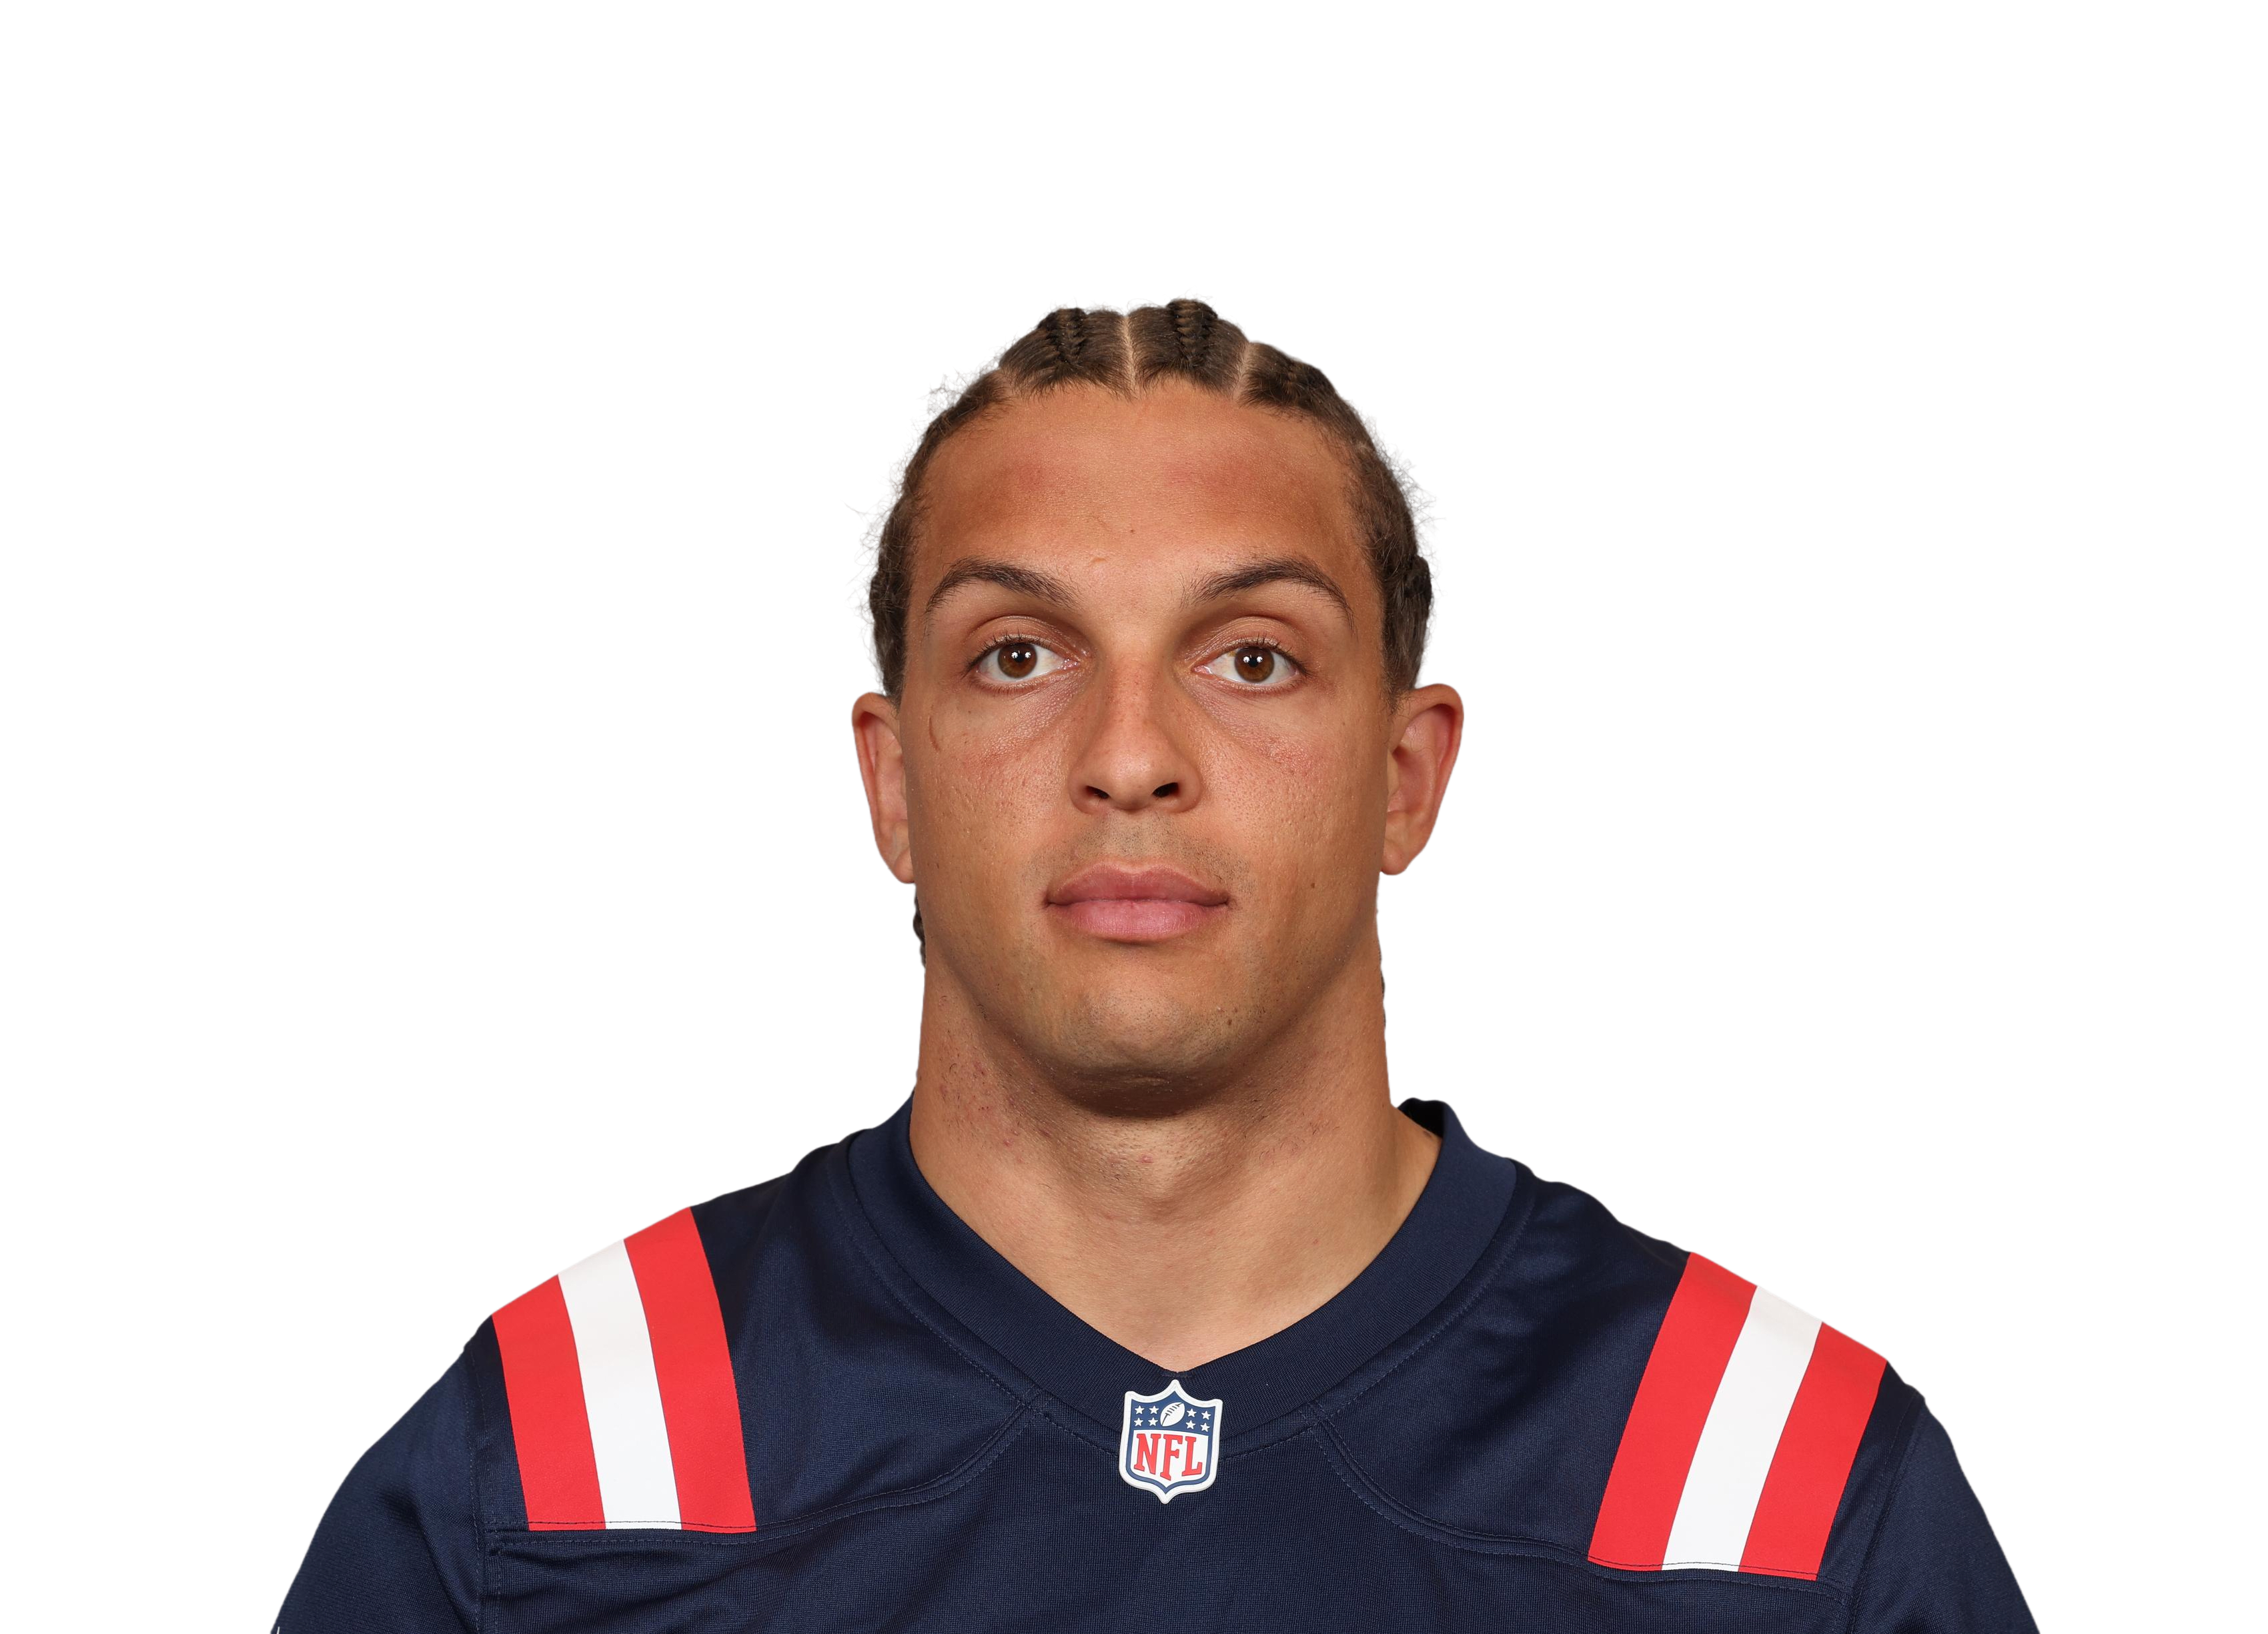 Mack Hollins@ NE • Wk 2 | 3.8 | 2 | 2 | 18 | 0 | 0 |
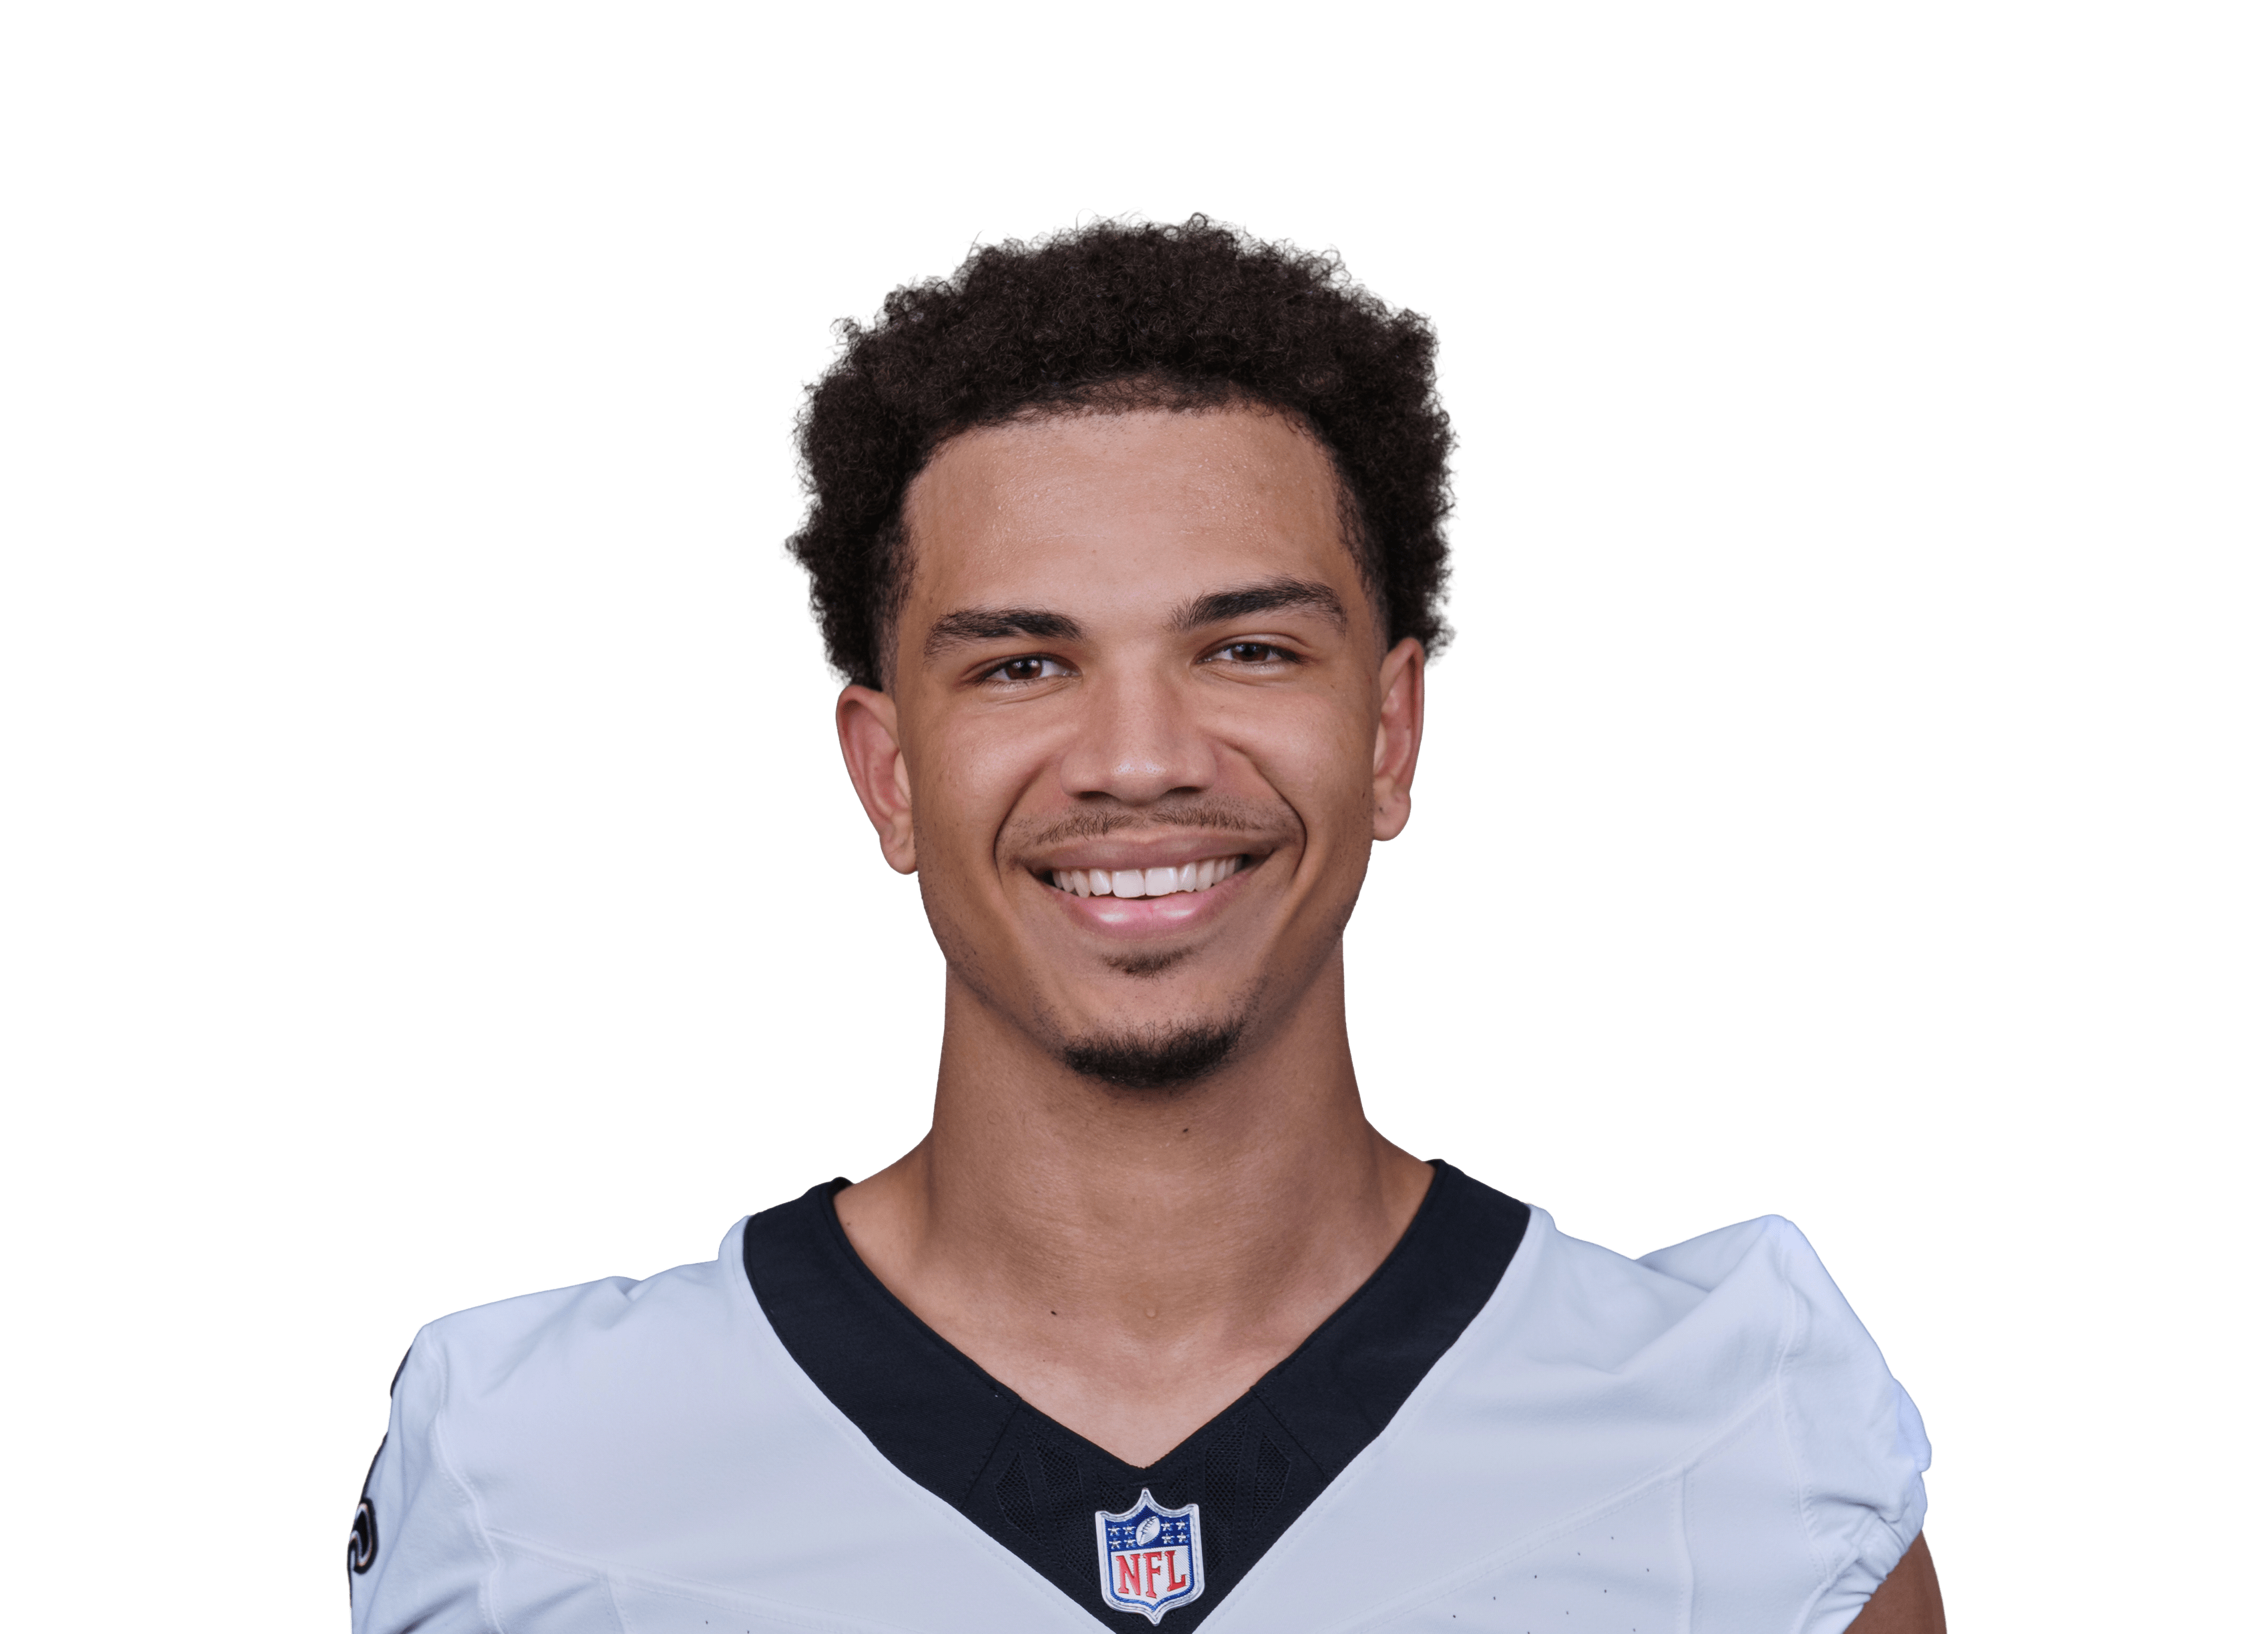 Bryce Lance@ NO • Wk 7 | 3.2 | 2 | 2 | 12 | 0 | 0 |
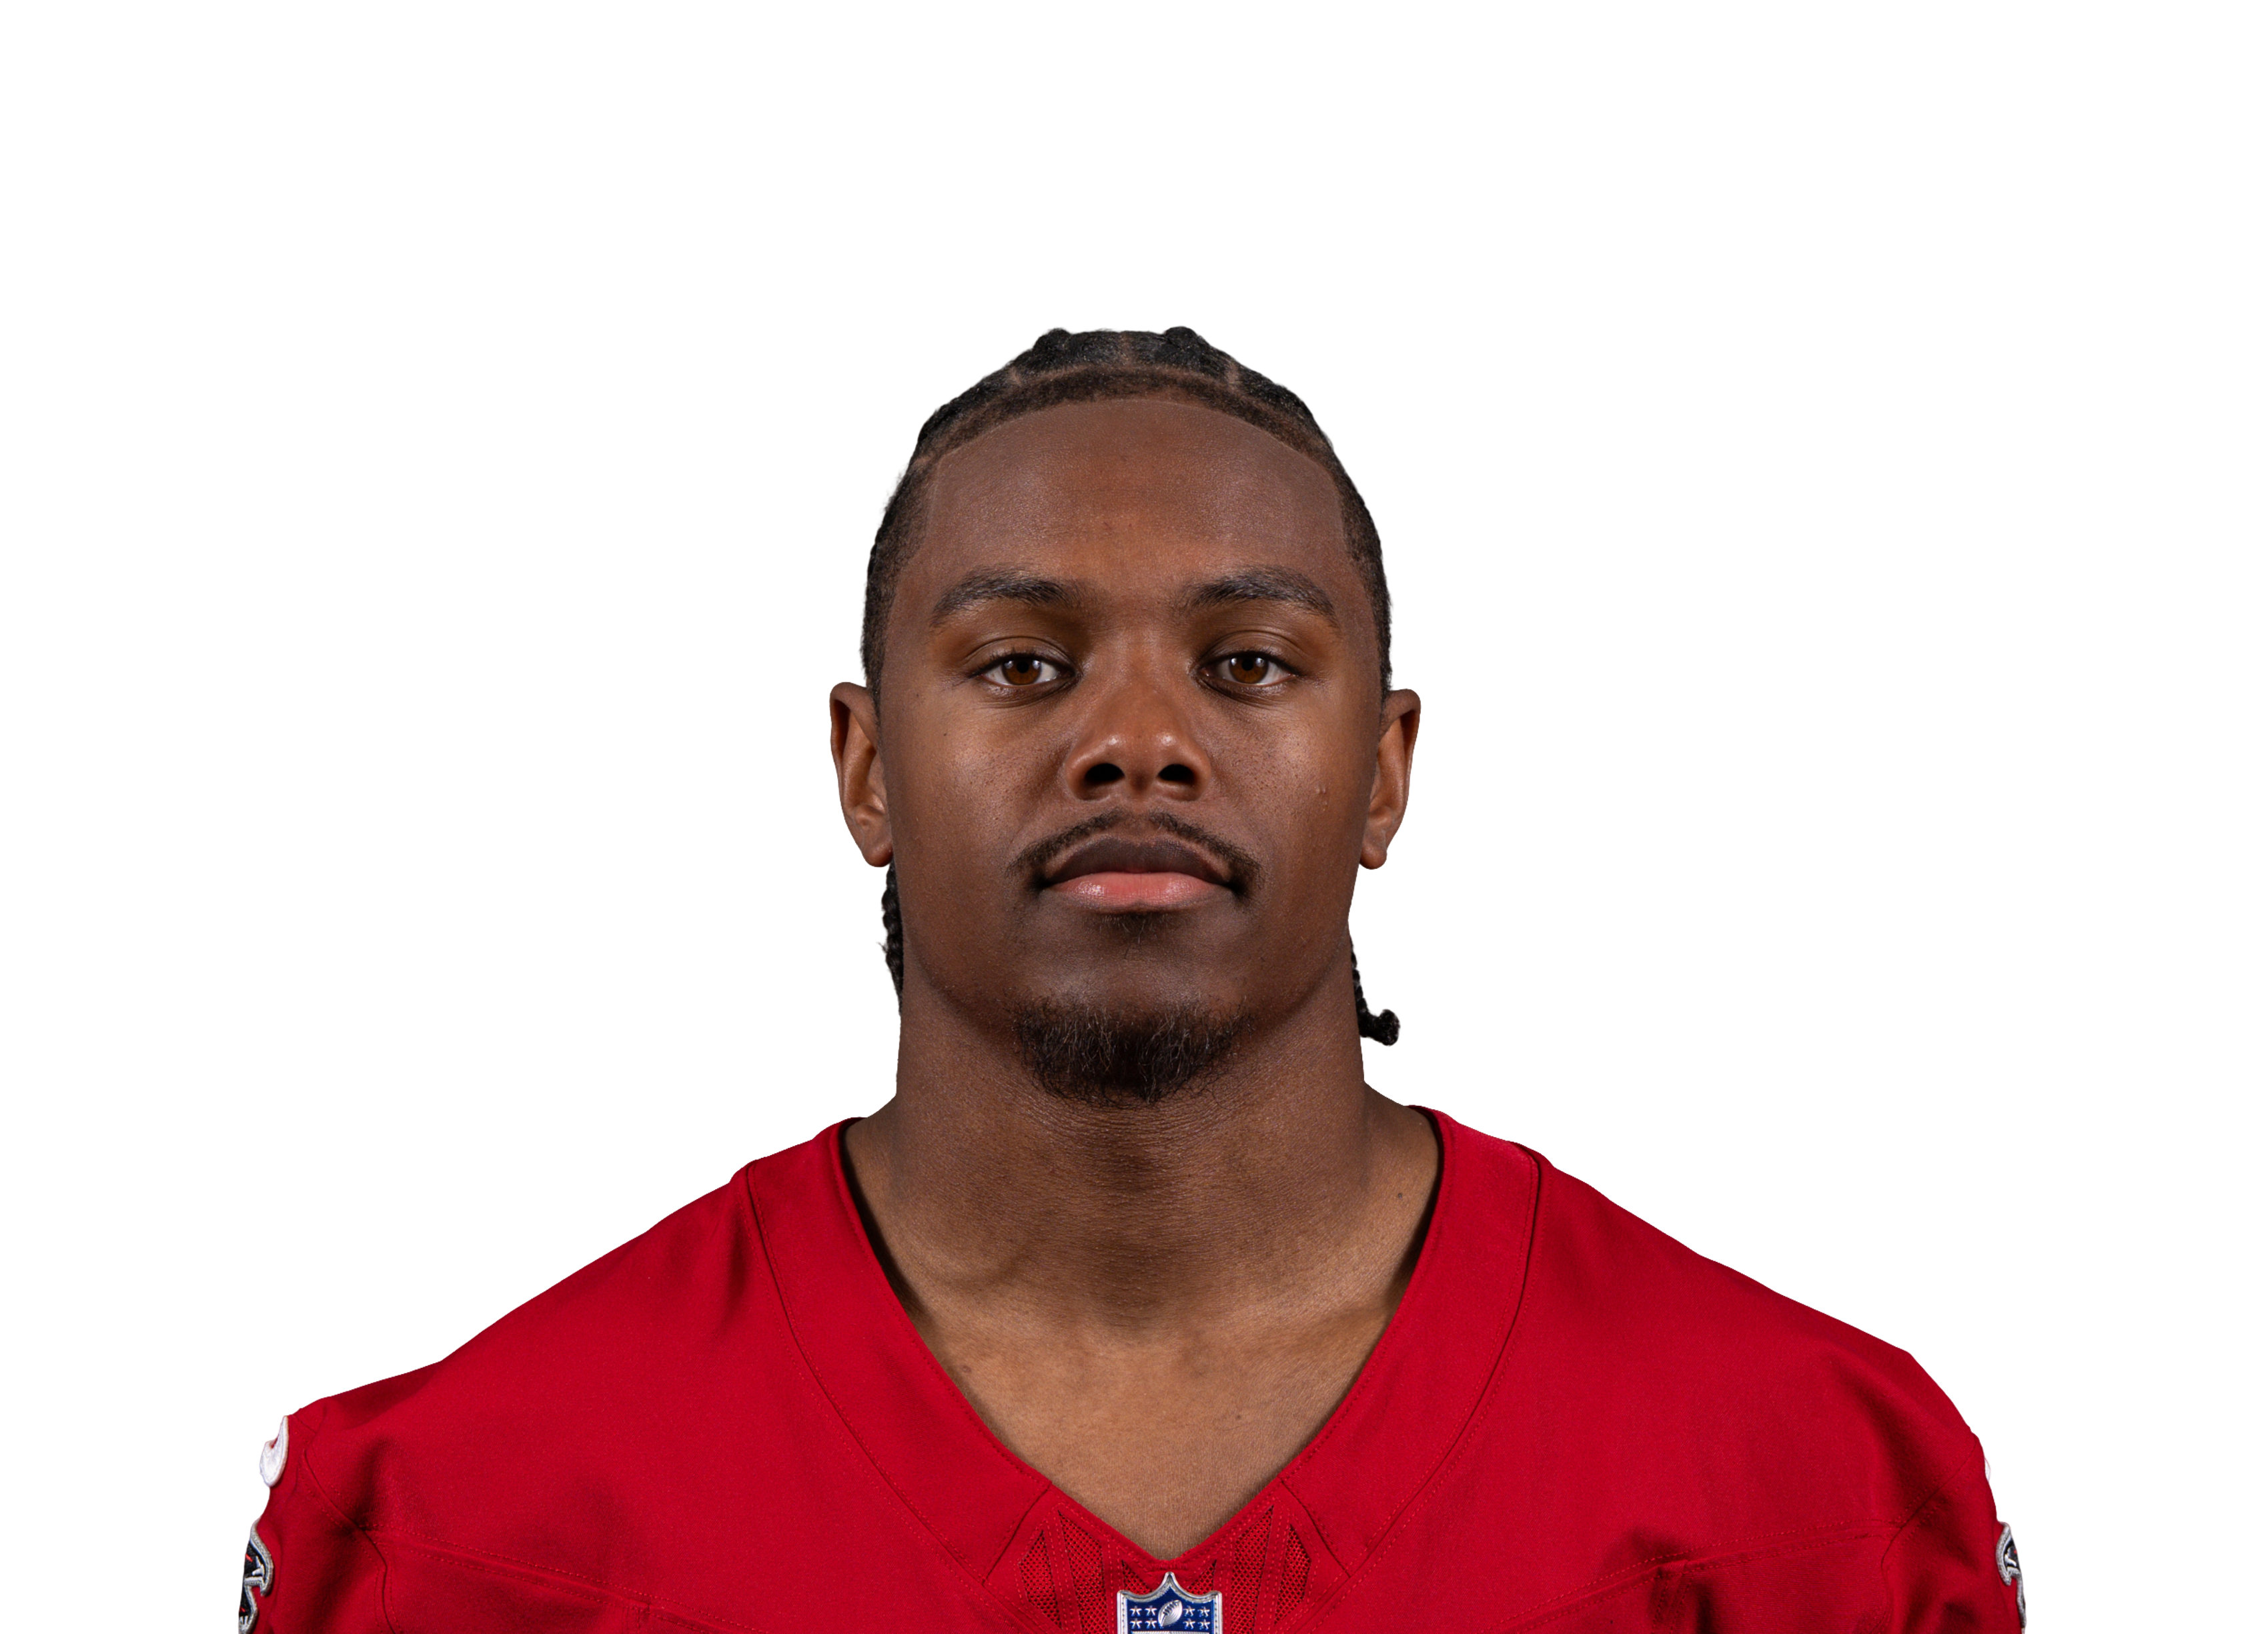 Jahan Dotsonvs ATL • Wk 1 | 2.9 | 3 | 1 | 19 | 0 | 0 |
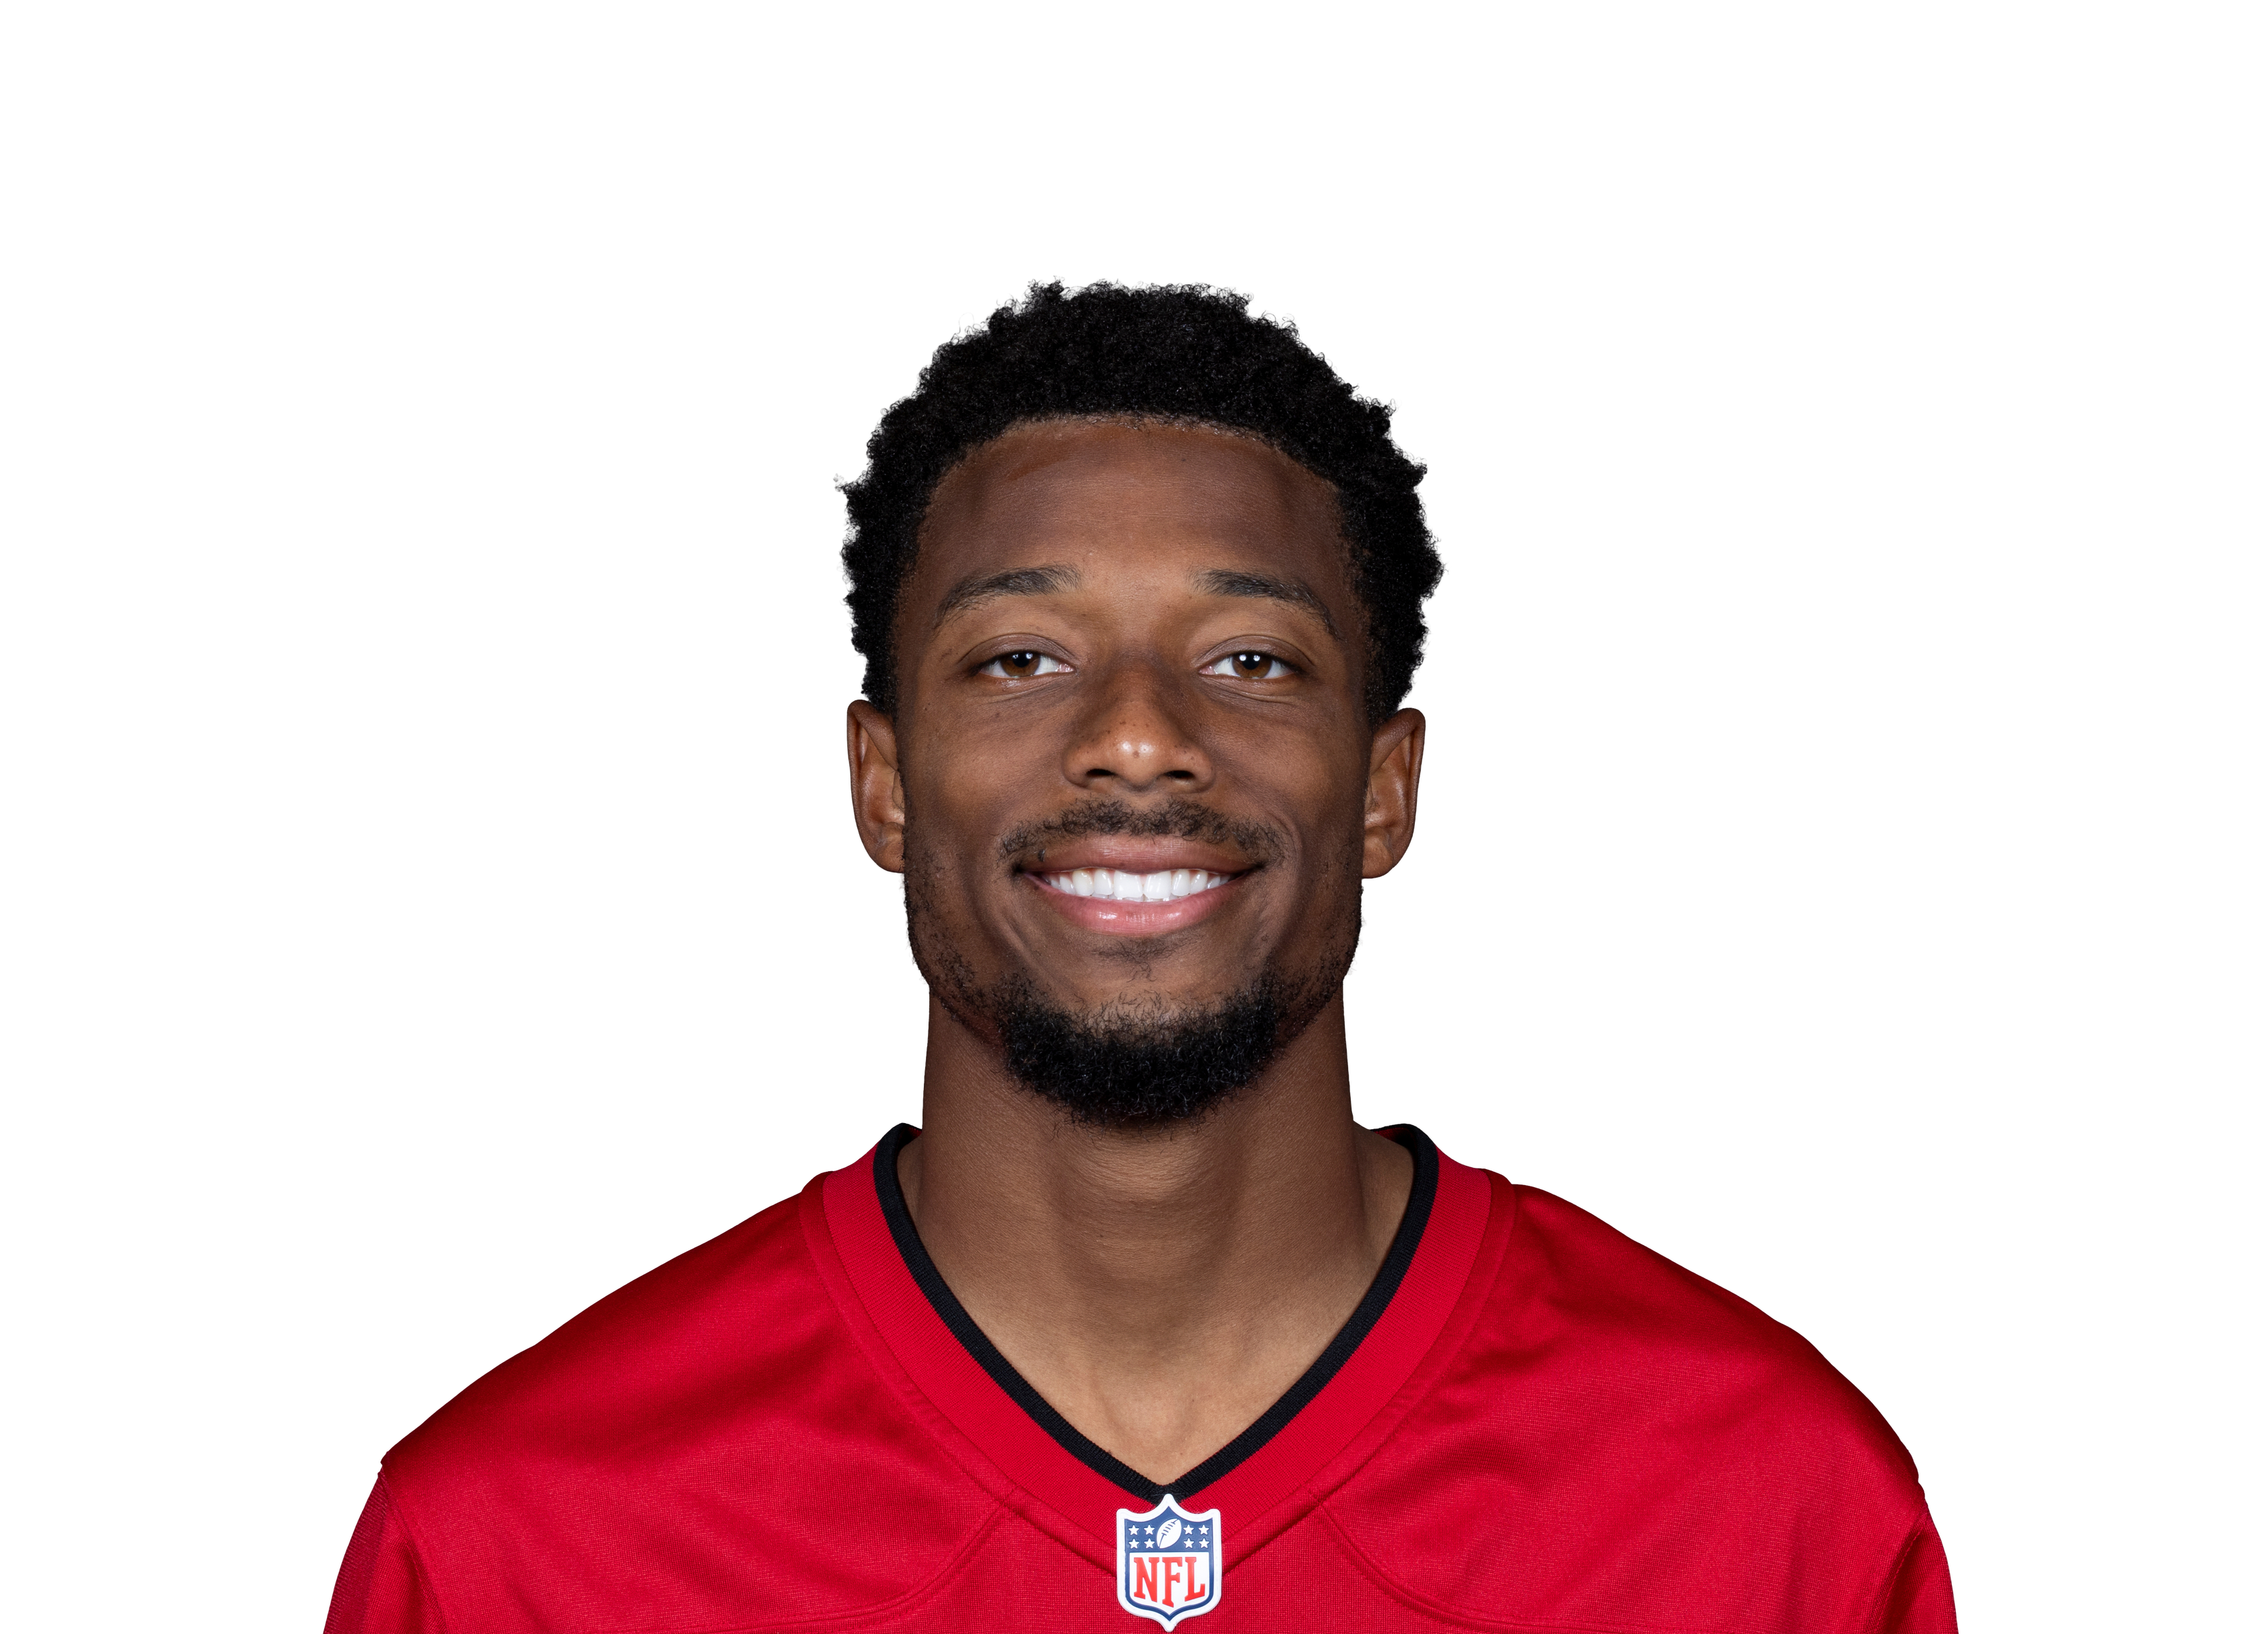 Tez Johnson@ TB • Wk 6 | 2.7 | 3 | 2 | 7 | 0 | 0 |
 Kyle Williams@ NE • Wk 2 | 2.0 | 2 | 1 | 10 | 0 | 0 |
 DeMario Douglas@ NE • Wk 2 | 1.9 | 2 | 1 | 9 | 0 | 0 |
 Olamide Zaccheausvs ATL • Wk 1 | 1.5 | 1 | 1 | 5 | 0 | 0 |
 Tylan Wallacevs CLE • Wk 8 | 1.3 | 1 | 1 | 3 | 0 | 0 |
 Colbie Youngvs CIN • Wk 3 | 1.2 | 1 | 1 | 2 | 0 | 0 |
 Isaiah Bond@ CLE • Wk 4 | 1.2 | 1 | 1 | 2 | 0 | 0 |
 Efton Chism III@ NE • Wk 2 | 0.8 | 1 | 1 | -2 | 0 | 0 |
 Nick Westbrook-Ikhinevs IND • Wk 5 | 0.0 | 1 | 0 | 0 | 0 | 0 |
 Deion Burksvs IND • Wk 5 | 0.0 | 2 | 0 | 0 | 0 | 0 |
| Jerry Jeudyvs CLE • Wk 8 | 0.0 | 1 | 0 | 0 | 0 | 0 |
Fantasy points first, then the stats that matter for his position. Ring around each photo is that player's Mania Rating. Tap a name to open his profile.
| Player | W1 | W2 | W3 | W4 | W5 | W6 | W7 | W8 | W9 | Per game |
|---|---|---|---|---|---|---|---|---|---|---|
| DeVonta Smith | 653 yds27% targets95% snaps | 13117 yds38% targets88% snaps | 865 yds32% targets100% snaps | — | — | 1475 yds32% targets66% snaps | — | — | — | 10.378 yds a game • 7.6 per target32% targets87% snaps |
| Dontayvion Wicks | 473 yds18% targets91% snaps | 674 yds18% targets62% snaps | 532 yds20% targets88% snaps | 518 yds20% targets92% snaps | 863 yds22% targets84% snaps | 424 yds9% targets62% snaps | — | — | — | 5.347 yds a game • 8.9 per target18% targets80% snaps |
| Makai Lemon | 4-5 yds18% targets64% snaps | 114 yds3% targets63% snaps | 429 yds16% targets70% snaps | 627 yds24% targets74% snaps | 743 yds19% targets81% snaps | 619 yds14% targets81% snaps | 867 yds24% targets91% snaps | 957 yds28% targets94% snaps | 961 yds27% targets93% snaps | 6.035 yds a game • 5.8 per target19% targets79% snaps |
| Darius Cooper | 00 yds0% targets15% snaps | 326 yds9% targets41% snaps | 00 yds0% targets10% snaps | 733 yds28% targets90% snaps | 371 yds8% targets85% snaps | 29 yds5% targets61% snaps | 317 yds9% targets92% snaps | 619 yds19% targets96% snaps | 825 yds24% targets93% snaps | 3.622 yds a game • 6.3 per target11% targets65% snaps |
| Marquise Brown | — | 00 yds0% targets22% snaps | — | — | — | — | 530 yds15% targets55% snaps | 217 yds6% targets46% snaps | 116 yds3% targets50% snaps | 2.016 yds a game • 7.9 per target6% targets43% snaps |
| Elijah Moore | — | — | — | — | — | 24 yds5% targets12% snaps | 216 yds6% targets33% snaps | — | 2-3 yds6% targets37% snaps | 2.06 yds a game • 2.8 per target6% targets27% snaps |
| Britain Covey | 00 yds0% targets0% snaps | 00 yds0% targets0% snaps | 00 yds0% targets0% snaps | 00 yds0% targets0% snaps | 00 yds0% targets0% snaps | 00 yds0% targets0% snaps | 00 yds0% targets0% snaps | — | — | 0.00 yds a game0% targets0% snaps |
| Use | Game | Proj | PPR | Tgt | Rec | Rec Yd | Car | Rush Yd | TD | Snap |
|---|---|---|---|---|---|---|---|---|---|---|
W1 vs WAS | 12.3 | 8.3 | 6 | 3 | 53 | 0 | 0 | 0 | 95% | |
W2 vs TEN | 11.8 | 27.7 | 13 | 10 | 117 | 0 | 0 | 1 | 88% | |
W3 vs CHI | 14.6 | 12.5 | 8 | 6 | 65 | 0 | 0 | 0 | 100% | |
W6 vs CAR | 13.3 | 20.5 | 14 | 7 | 75 | 0 | 0 | 1 | 66% |
Ranked against 64 WRs with at least 35 targets. He is still a small sample (41 targets), so his ranks lean toward average. Ranks account for how much work each number is based on, so a perfect record on a few plays does not beat one over a full workload. Tap a stat to see the full ranking.
DeVonta Smith
PHI • WR • 4 gamesPick a teammate with or without. Pick more than one to combine them, like a game without the QB and without the other back.
Teammate injuries shift his Week 11 Rating3 teammate notes ▾
PHIPITHow this is built
| Player | W1 | W2 | W3 | W4 | W5 | W6 | W7 | W8 | W9 | Per game |
|---|---|---|---|---|---|---|---|---|---|---|
| DeVonta Smith | 653 yds27% targets95% snaps | 13117 yds38% targets88% snaps | 865 yds32% targets100% snaps | — | — | 1475 yds32% targets66% snaps | — | — | — | 10.378 yds a game • 7.6 per target32% targets87% snaps |
| Dontayvion Wicks | 473 yds18% targets91% snaps | 674 yds18% targets62% snaps | 532 yds20% targets88% snaps | 518 yds20% targets92% snaps | 863 yds22% targets84% snaps | 424 yds9% targets62% snaps | — | — | — | 5.347 yds a game • 8.9 per target18% targets80% snaps |
| Makai Lemon | 4-5 yds18% targets64% snaps | 114 yds3% targets63% snaps | 429 yds16% targets70% snaps | 627 yds24% targets74% snaps | 743 yds19% targets81% snaps | 619 yds14% targets81% snaps | 867 yds24% targets91% snaps | 957 yds28% targets94% snaps | 961 yds27% targets93% snaps | 6.035 yds a game • 5.8 per target19% targets79% snaps |
| Darius Cooper | 00 yds0% targets15% snaps | 326 yds9% targets41% snaps | 00 yds0% targets10% snaps | 733 yds28% targets90% snaps | 371 yds8% targets85% snaps | 29 yds5% targets61% snaps | 317 yds9% targets92% snaps | 619 yds19% targets96% snaps | 825 yds24% targets93% snaps | 3.622 yds a game • 6.3 per target11% targets65% snaps |
| Marquise Brown | — | 00 yds0% targets22% snaps | — | — | — | — | 530 yds15% targets55% snaps | 217 yds6% targets46% snaps | 116 yds3% targets50% snaps | 2.016 yds a game • 7.9 per target6% targets43% snaps |
| Elijah Moore | — | — | — | — | — | 24 yds5% targets12% snaps | 216 yds6% targets33% snaps | — | 2-3 yds6% targets37% snaps | 2.06 yds a game • 2.8 per target6% targets27% snaps |
| Britain Covey | 00 yds0% targets0% snaps | 00 yds0% targets0% snaps | 00 yds0% targets0% snaps | 00 yds0% targets0% snaps | 00 yds0% targets0% snaps | 00 yds0% targets0% snaps | 00 yds0% targets0% snaps | — | — | 0.00 yds a game0% targets0% snaps |
| Use | Game | Proj | PPR | Tgt | Rec | Rec Yd | Car | Rush Yd | TD | Snap |
|---|---|---|---|---|---|---|---|---|---|---|
| W1vs WAS | 12.3 | 8.3 | 6 | 3 | 53 | 0 | 0 | 0 | 95% | |
| W2vs TEN | 11.8 | 27.7 | 13 | 10 | 117 | 0 | 0 | 1 | 88% | |
| W3vs CHI | 14.6 | 12.5 | 8 | 6 | 65 | 0 | 0 | 0 | 100% | |
| W6vs CAR | 13.3 | 20.5 | 14 | 7 | 75 | 0 | 0 | 1 | 66% |
Ranked against 64 WRs with at least 35 targets. He is still a small sample (41 targets), so his ranks lean toward average. Ranks account for how much work each number is based on, so a perfect record on a few plays does not beat one over a full workload. Tap a stat to see the full ranking.
31.9 PPR points a game allowed to wide receivers, 17th most of 32 defenses.
| Player | PPR | Tgt | Rec | Rec Yd | Rec TD | Rush Yd |
|---|---|---|---|---|---|---|
| Ja'Marr Chase@ CIN • Wk 10 | 34.1 | 14 | 11 | 231 | 0 | 0 |
| Ja'Marr Chasevs CIN • Wk 3 | 24.8 | 12 | 9 | 98 | 1 | 0 |
| Tee Higginsvs CIN • Wk 3 | 21.0 | 7 | 6 | 90 | 1 | 0 |
| Emeka Egbuka@ TB • Wk 6 | 17.8 | 16 | 7 | 48 | 1 | 0 |
| Devaughn Vele@ NO • Wk 7 | 16.4 | 5 | 5 | 54 | 1 | 0 |
| Denzel Boston@ CLE • Wk 4 | 12.9 | 7 | 4 | 89 | 0 | 0 |
| Romeo Doubs@ NE • Wk 2 | 12.6 | 4 | 3 | 96 | 0 | 0 |
| Chris Olave@ NO • Wk 7 | 11.6 | 10 | 6 | 56 | 0 | 0 |
| Tee Higgins@ CIN • Wk 10 | 11.6 | 6 | 5 | 66 | 0 | 0 |
| KC Concepcion@ CLE • Wk 4 | 11.4 | 8 | 5 | 64 | 0 | 0 |
| Dohnte Meyers@ CIN • Wk 10 | 10.0 | 2 | 2 | 20 | 1 | 0 |
| Denzel Bostonvs CLE • Wk 8 | 9.7 | 11 | 6 | 37 | 0 | 0 |
| Keenan Allenvs IND • Wk 5 | 9.5 | 9 | 5 | 45 | 0 | 0 |
| Barion Brown@ NO • Wk 7 | 8.7 | 3 | 3 | 57 | 0 | 0 |
| Josh Downsvs IND • Wk 5 | 7.7 | 6 | 3 | 47 | 0 | 0 |
| Chris Godwin Jr.@ TB • Wk 6 | 7.7 | 8 | 4 | 37 | 0 | 0 |
| Ted Hurst III@ TB • Wk 6 | 7.0 | 6 | 3 | 40 | 0 | 0 |
| KC Concepcionvs CLE • Wk 8 | 6.7 | 4 | 3 | 37 | 0 | 0 |
| Jerry Jeudy@ CLE • Wk 4 | 6.6 | 3 | 3 | 36 | 0 | 0 |
| Dohnte Meyersvs CIN • Wk 3 | 5.9 | 5 | 3 | 29 | 0 | 0 |
| Drake Londonvs ATL • Wk 1 | 5.5 | 4 | 2 | 29 | 0 | 6 |
| Laquon Treadwellvs IND • Wk 5 | 5.4 | 8 | 2 | 34 | 0 | 0 |
| Mack Hollins@ NE • Wk 2 | 3.8 | 2 | 2 | 18 | 0 | 0 |
| Bryce Lance@ NO • Wk 7 | 3.2 | 2 | 2 | 12 | 0 | 0 |
| Jahan Dotsonvs ATL • Wk 1 | 2.9 | 3 | 1 | 19 | 0 | 0 |
| Tez Johnson@ TB • Wk 6 | 2.7 | 3 | 2 | 7 | 0 | 0 |
| Kyle Williams@ NE • Wk 2 | 2.0 | 2 | 1 | 10 | 0 | 0 |
| DeMario Douglas@ NE • Wk 2 | 1.9 | 2 | 1 | 9 | 0 | 0 |
| Olamide Zaccheausvs ATL • Wk 1 | 1.5 | 1 | 1 | 5 | 0 | 0 |
| Tylan Wallacevs CLE • Wk 8 | 1.3 | 1 | 1 | 3 | 0 | 0 |
| Colbie Youngvs CIN • Wk 3 | 1.2 | 1 | 1 | 2 | 0 | 0 |
| Isaiah Bond@ CLE • Wk 4 | 1.2 | 1 | 1 | 2 | 0 | 0 |
| Efton Chism III@ NE • Wk 2 | 0.8 | 1 | 1 | -2 | 0 | 0 |
| Nick Westbrook-Ikhinevs IND • Wk 5 | 0.0 | 1 | 0 | 0 | 0 | 0 |
| Deion Burksvs IND • Wk 5 | 0.0 | 2 | 0 | 0 | 0 | 0 |
| Jerry Jeudyvs CLE • Wk 8 | 0.0 | 1 | 0 | 0 | 0 | 0 |
Fantasy points first, then the stats that matter for his position. Ring around each photo is that player's Mania Rating. Tap a name to open his profile.