
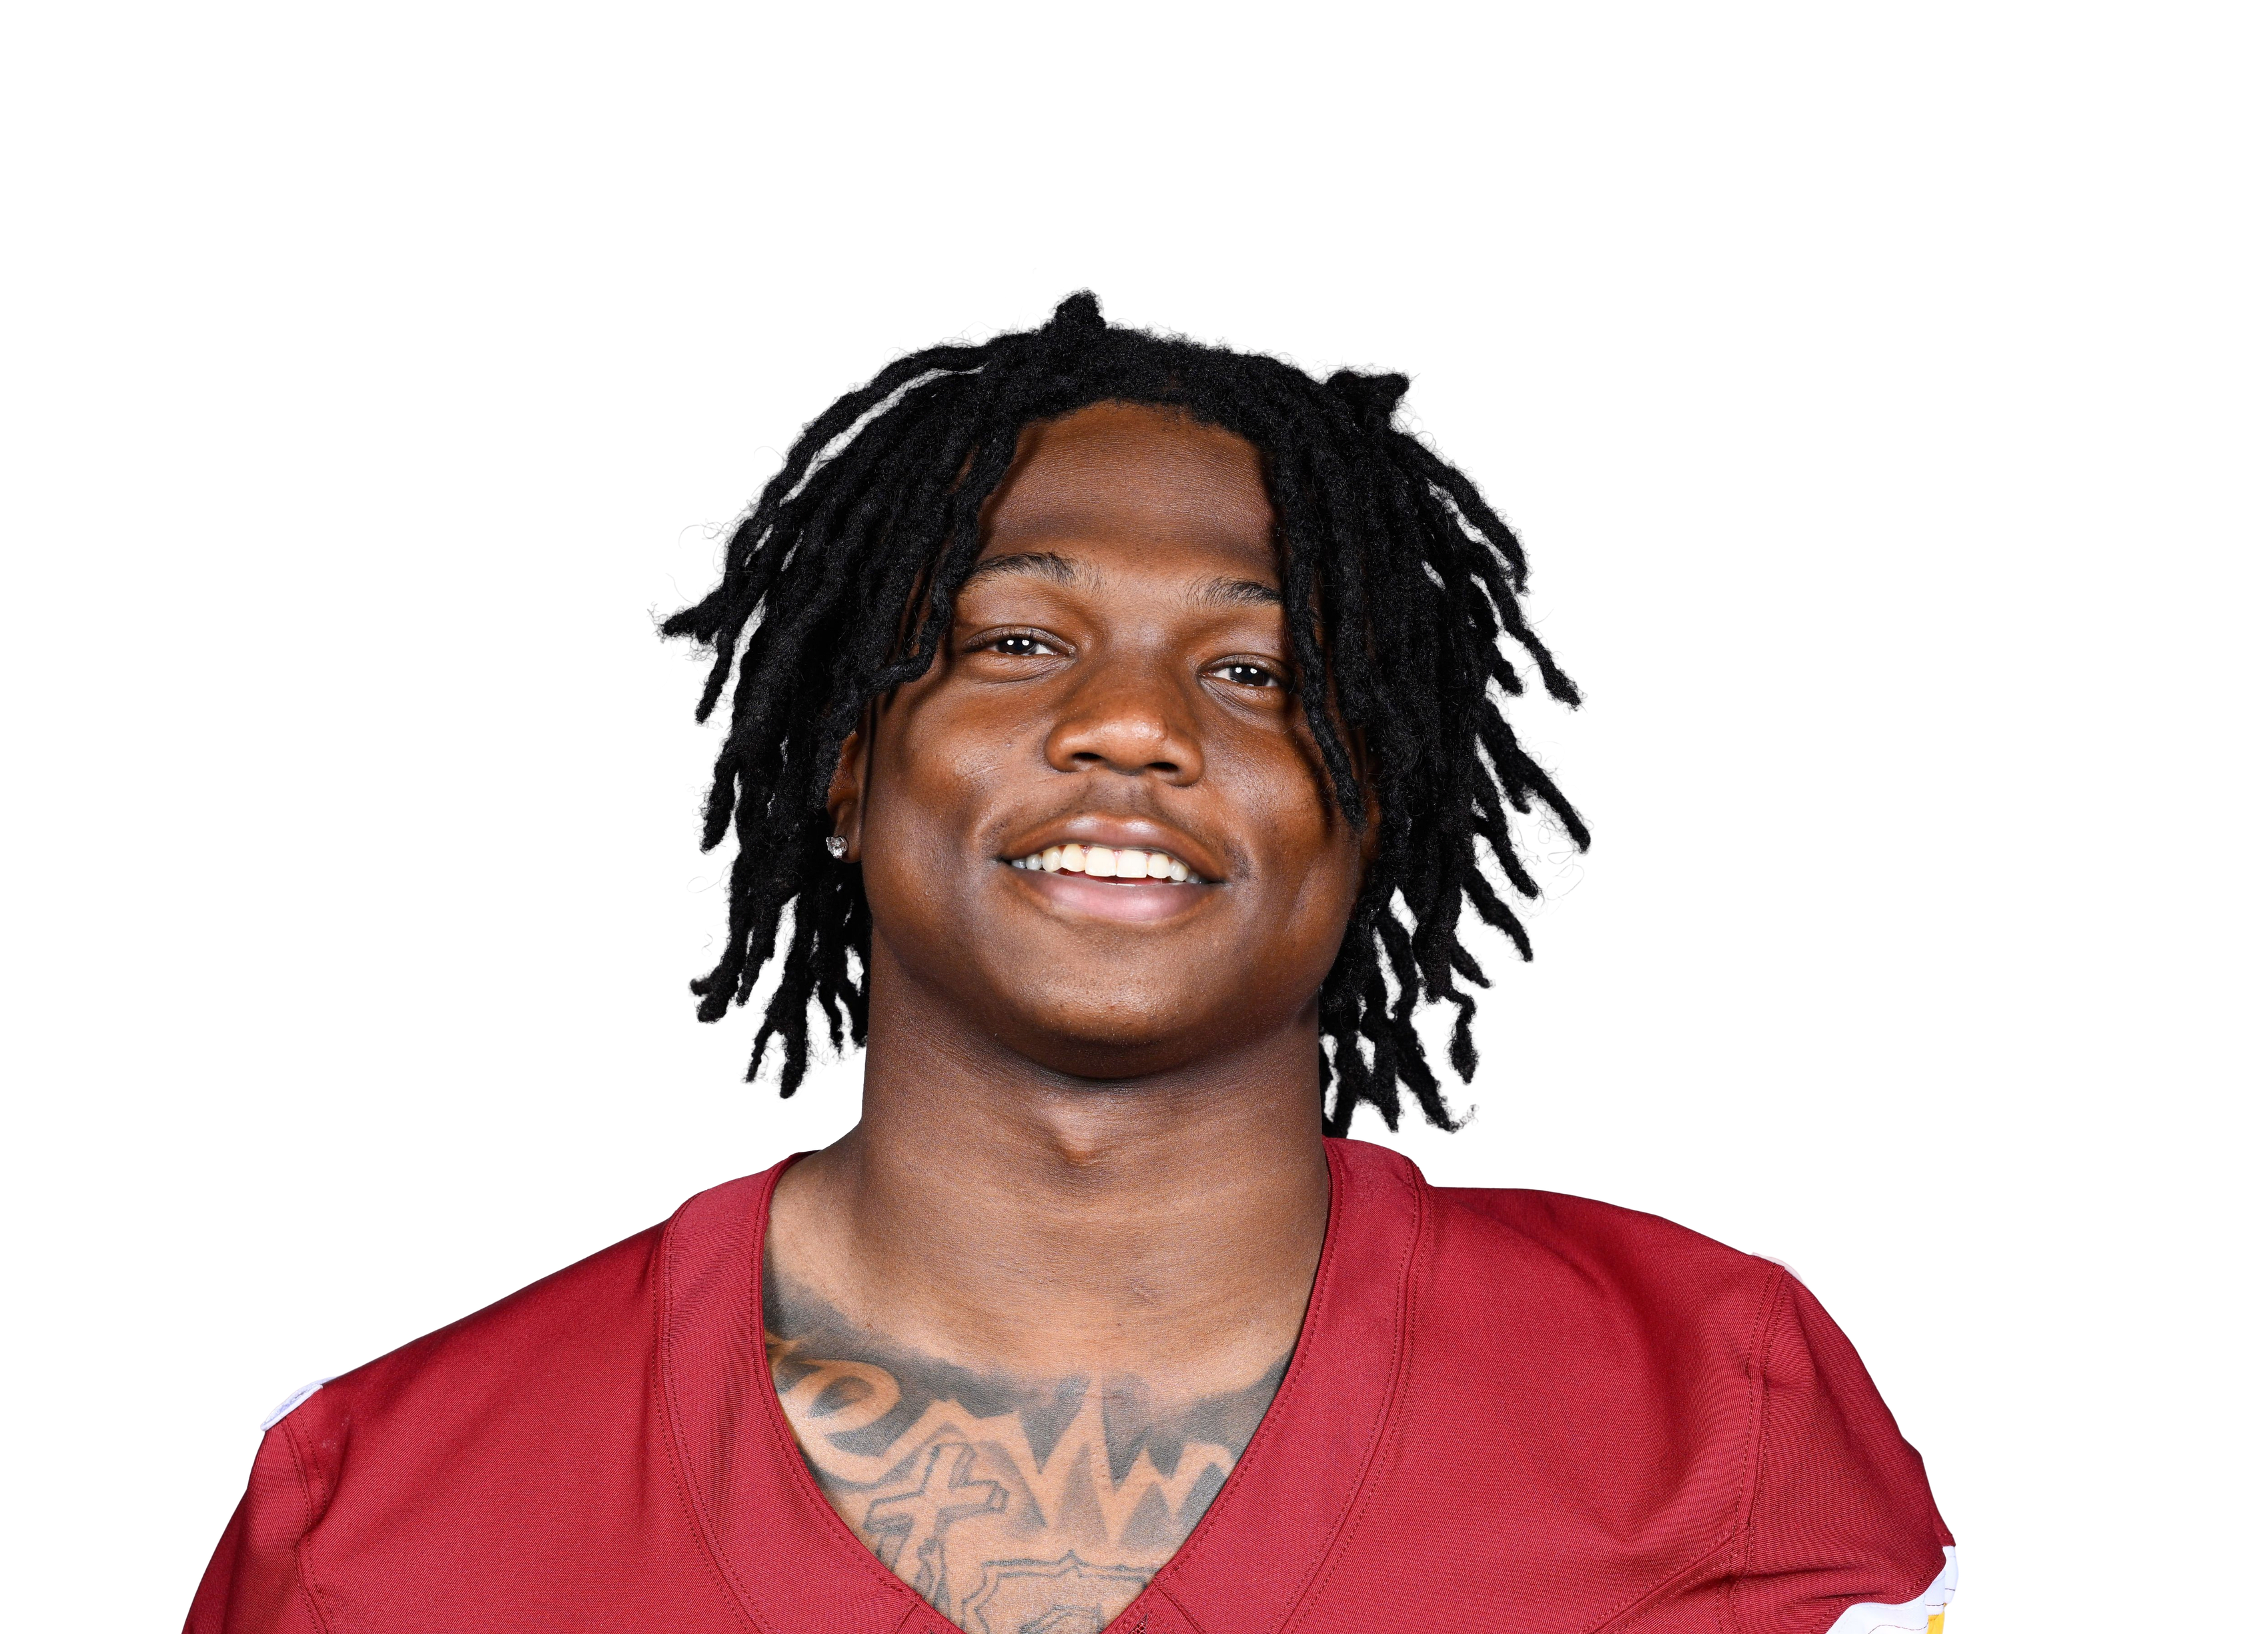
Jacory Croskey-Merritt
Pick a teammate with or without. Pick more than one to combine them, like a game without the QB and without the other back.

20.6 PPR points a game allowed to running backs, 18th most of 32 defenses.
| Player | PPR | Rush | Rush Yd | Rush TD | Rec | Rec Yd |
|---|---|---|---|---|---|---|
 Tony Pollardvs TEN • Wk 8 | 28.7 | 21 | 117 | 2 | 3 | 20 |
 Bijan Robinson@ ATL • Wk 9 | 26.7 | 19 | 100 | 1 | 6 | 47 |
 Jaylen Warren@ PIT • Wk 3 | 20.6 | 17 | 127 | 0 | 3 | 49 |
 Bucky Irvingvs TB • Wk 1 | 20.3 | 8 | 45 | 1 | 7 | 48 |
 Ollie Gordon II@ MIA • Wk 5 | 14.8 | 18 | 88 | 1 | 0 | 0 |
 Bhayshul Tutenvs JAX • Wk 4 | 11.1 | 17 | 73 | 0 | 2 | 18 |
 Chris Rodriguez Jr.vs JAX • Wk 4 | 9.5 | 6 | 35 | 1 | 0 | 0 |
| Jaylen Warrenvs PIT • Wk 10 | 9.1 | 7 | 15 | 0 | 5 | 26 |
 Woody Marks@ HOU • Wk 2 | 8.5 | 8 | 8 | 0 | 5 | 27 |
 Justice Hill@ BAL • Wk 7 | 6.3 | 3 | 7 | 0 | 3 | 26 |
 Derrick Henry@ BAL • Wk 7 | 5.9 | 17 | 45 | 0 | 1 | 4 |
 Lew Nichols IIIvs PIT • Wk 10 | 5.5 | 6 | 43 | 0 | 1 | 2 |
 Rico Dowdlevs PIT • Wk 10 | 5.4 | 5 | 26 | 0 | 2 | 8 |
 David Montgomery@ HOU • Wk 2 | 4.4 | 6 | 10 | 0 | 2 | 14 |
 Khalil Herbert@ ATL • Wk 9 | 2.9 | 1 | 7 | 0 | 2 | 2 |
 Kenny Gainwellvs TB • Wk 1 | 2.8 | 5 | 15 | 0 | 1 | 3 |
 Rasheen Ali@ BAL • Wk 7 | 1.9 | 4 | 19 | 0 | 0 | 0 |
 Jaylen Wright@ MIA • Wk 5 | 1.1 | 6 | 11 | 0 | 0 | 0 |
 Travis Homer@ PIT • Wk 3 | 0.0 | 1 | 0 | 0 | 0 | 0 |
| Lew Nichols III@ PIT • Wk 3 | 0.0 | 1 | 0 | 0 | 0 | 0 |
| Travis Homervs PIT • Wk 10 | 0.0 | 1 | 0 | 0 | 0 | 0 |
Fantasy points first, then the stats that matter for his position. Ring around each photo is that player's Mania Rating. Tap a name to open his profile.
| Player | W1 | W2 | W3 | W4 | W5 | W6 | W8 | W9 | W10 | Per game |
|---|---|---|---|---|---|---|---|---|---|---|
| Rachaad White | 927 yds15% touches41% snaps | 1383 yds20% touches52% snaps | 941 yds15% touches43% snaps | — | 820 yds15% touches60% snaps | 1257 yds23% touches69% snaps | 1460 yds26% touches47% snaps | 1069 yds19% touches56% snaps | 1352 yds20% touches52% snaps | 11.051 yds a game • 4.6 per touch19% touches53% snaps |
| Jacory Croskey-Merritt | 1756 yds28% touches49% snaps | 1348 yds20% touches37% snaps | 2043 yds32% touches57% snaps | 1350 yds22% touches45% snaps | 1182 yds21% touches35% snaps | — | — | — | — | 14.856 yds a game • 3.8 per touch25% touches45% snaps |
| Austin Ekeler | — | — | — | 640 yds10% touches27% snaps | 414 yds8% touches10% snaps | 37 yds6% touches10% snaps | 836 yds15% touches33% snaps | 1134 yds21% touches45% snaps | 1352 yds20% touches43% snaps | 7.531 yds a game • 4.1 per touch13% touches28% snaps |
| Jeremy McNichols | — | — | — | — | — | 513 yds10% touches18% snaps | 628 yds11% touches20% snaps | — | — | 5.521 yds a game • 3.7 per touch10% touches19% snaps |
| Craig Reynolds | — | — | — | 24 yds3% touches9% snaps | — | — | — | — | — | 2.04 yds a game • 2.0 per touch3% touches9% snaps |
| Robert Henry Jr. | — | — | — | — | — | — | — | — | 24 yds3% touches4% snaps | 2.04 yds a game • 2.0 per touch3% touches4% snaps |
| Use | Game | Proj | PPR | Tgt | Rec | Rec Yd | Car | Rush Yd | TD | Snap |
|---|---|---|---|---|---|---|---|---|---|---|
W1 vs PHI | 6.8 | 12.6 | 1 | 1 | -7 | 16 | 63 | 1 | 49% | |
W2 vs DAL | 9.5 | 5.8 | 1 | 1 | 5 | 12 | 43 | 0 | 37% | |
W3 vs SEA | 6.9 | 5.3 | 1 | 1 | 7 | 19 | 36 | 0 | 57% | |
W4 vs IND | 9.5 | 7 | 4 | 2 | 35 | 9 | 15 | 0 | 45% | |
W5 vs NYG | 9.5 | 14.2 | 0 | 0 | 0 | 11 | 82 | 1 | 35% |
Ranked against 41 backs with at least 60 carries. He is still a small sample (67 carries), so his ranks lean toward average. Ranks account for how much work each number is based on, so a perfect record on a few plays does not beat one over a full workload. Tap a stat to see the full ranking.

Jacory Croskey-Merritt
Pick a teammate with or without. Pick more than one to combine them, like a game without the QB and without the other back.
| Player | W1 | W2 | W3 | W4 | W5 | W6 | W8 | W9 | W10 | Per game |
|---|---|---|---|---|---|---|---|---|---|---|
| Rachaad White | 927 yds15% touches41% snaps | 1383 yds20% touches52% snaps | 941 yds15% touches43% snaps | — | 820 yds15% touches60% snaps | 1257 yds23% touches69% snaps | 1460 yds26% touches47% snaps | 1069 yds19% touches56% snaps | 1352 yds20% touches52% snaps | 11.051 yds a game • 4.6 per touch19% touches53% snaps |
| Jacory Croskey-Merritt | 1756 yds28% touches49% snaps | 1348 yds20% touches37% snaps | 2043 yds32% touches57% snaps | 1350 yds22% touches45% snaps | 1182 yds21% touches35% snaps | — | — | — | — | 14.856 yds a game • 3.8 per touch25% touches45% snaps |
| Austin Ekeler | — | — | — | 640 yds10% touches27% snaps | 414 yds8% touches10% snaps | 37 yds6% touches10% snaps | 836 yds15% touches33% snaps | 1134 yds21% touches45% snaps | 1352 yds20% touches43% snaps | 7.531 yds a game • 4.1 per touch13% touches28% snaps |
| Jeremy McNichols | — | — | — | — | — | 513 yds10% touches18% snaps | 628 yds11% touches20% snaps | — | — | 5.521 yds a game • 3.7 per touch10% touches19% snaps |
| Craig Reynolds | — | — | — | 24 yds3% touches9% snaps | — | — | — | — | — | 2.04 yds a game • 2.0 per touch3% touches9% snaps |
| Robert Henry Jr. | — | — | — | — | — | — | — | — | 24 yds3% touches4% snaps | 2.04 yds a game • 2.0 per touch3% touches4% snaps |
| Use | Game | Proj | PPR | Tgt | Rec | Rec Yd | Car | Rush Yd | TD | Snap |
|---|---|---|---|---|---|---|---|---|---|---|
| W1vs PHI | 6.8 | 12.6 | 1 | 1 | -7 | 16 | 63 | 1 | 49% | |
| W2vs DAL | 9.5 | 5.8 | 1 | 1 | 5 | 12 | 43 | 0 | 37% | |
| W3vs SEA | 6.9 | 5.3 | 1 | 1 | 7 | 19 | 36 | 0 | 57% | |
| W4vs IND | 9.5 | 7 | 4 | 2 | 35 | 9 | 15 | 0 | 45% | |
| W5vs NYG | 9.5 | 14.2 | 0 | 0 | 0 | 11 | 82 | 1 | 35% |
Ranked against 41 backs with at least 60 carries. He is still a small sample (67 carries), so his ranks lean toward average. Ranks account for how much work each number is based on, so a perfect record on a few plays does not beat one over a full workload. Tap a stat to see the full ranking.
20.6 PPR points a game allowed to running backs, 18th most of 32 defenses.
| Player | PPR | Rush | Rush Yd | Rush TD | Rec | Rec Yd |
|---|---|---|---|---|---|---|
| Tony Pollardvs TEN • Wk 8 | 28.7 | 21 | 117 | 2 | 3 | 20 |
| Bijan Robinson@ ATL • Wk 9 | 26.7 | 19 | 100 | 1 | 6 | 47 |
| Jaylen Warren@ PIT • Wk 3 | 20.6 | 17 | 127 | 0 | 3 | 49 |
| Bucky Irvingvs TB • Wk 1 | 20.3 | 8 | 45 | 1 | 7 | 48 |
| Ollie Gordon II@ MIA • Wk 5 | 14.8 | 18 | 88 | 1 | 0 | 0 |
| Bhayshul Tutenvs JAX • Wk 4 | 11.1 | 17 | 73 | 0 | 2 | 18 |
| Chris Rodriguez Jr.vs JAX • Wk 4 | 9.5 | 6 | 35 | 1 | 0 | 0 |
| Jaylen Warrenvs PIT • Wk 10 | 9.1 | 7 | 15 | 0 | 5 | 26 |
| Woody Marks@ HOU • Wk 2 | 8.5 | 8 | 8 | 0 | 5 | 27 |
| Justice Hill@ BAL • Wk 7 | 6.3 | 3 | 7 | 0 | 3 | 26 |
| Derrick Henry@ BAL • Wk 7 | 5.9 | 17 | 45 | 0 | 1 | 4 |
| Lew Nichols IIIvs PIT • Wk 10 | 5.5 | 6 | 43 | 0 | 1 | 2 |
| Rico Dowdlevs PIT • Wk 10 | 5.4 | 5 | 26 | 0 | 2 | 8 |
| David Montgomery@ HOU • Wk 2 | 4.4 | 6 | 10 | 0 | 2 | 14 |
| Khalil Herbert@ ATL • Wk 9 | 2.9 | 1 | 7 | 0 | 2 | 2 |
| Kenny Gainwellvs TB • Wk 1 | 2.8 | 5 | 15 | 0 | 1 | 3 |
| Rasheen Ali@ BAL • Wk 7 | 1.9 | 4 | 19 | 0 | 0 | 0 |
| Jaylen Wright@ MIA • Wk 5 | 1.1 | 6 | 11 | 0 | 0 | 0 |
| Travis Homer@ PIT • Wk 3 | 0.0 | 1 | 0 | 0 | 0 | 0 |
| Lew Nichols III@ PIT • Wk 3 | 0.0 | 1 | 0 | 0 | 0 | 0 |
| Travis Homervs PIT • Wk 10 | 0.0 | 1 | 0 | 0 | 0 | 0 |
Fantasy points first, then the stats that matter for his position. Ring around each photo is that player's Mania Rating. Tap a name to open his profile.