
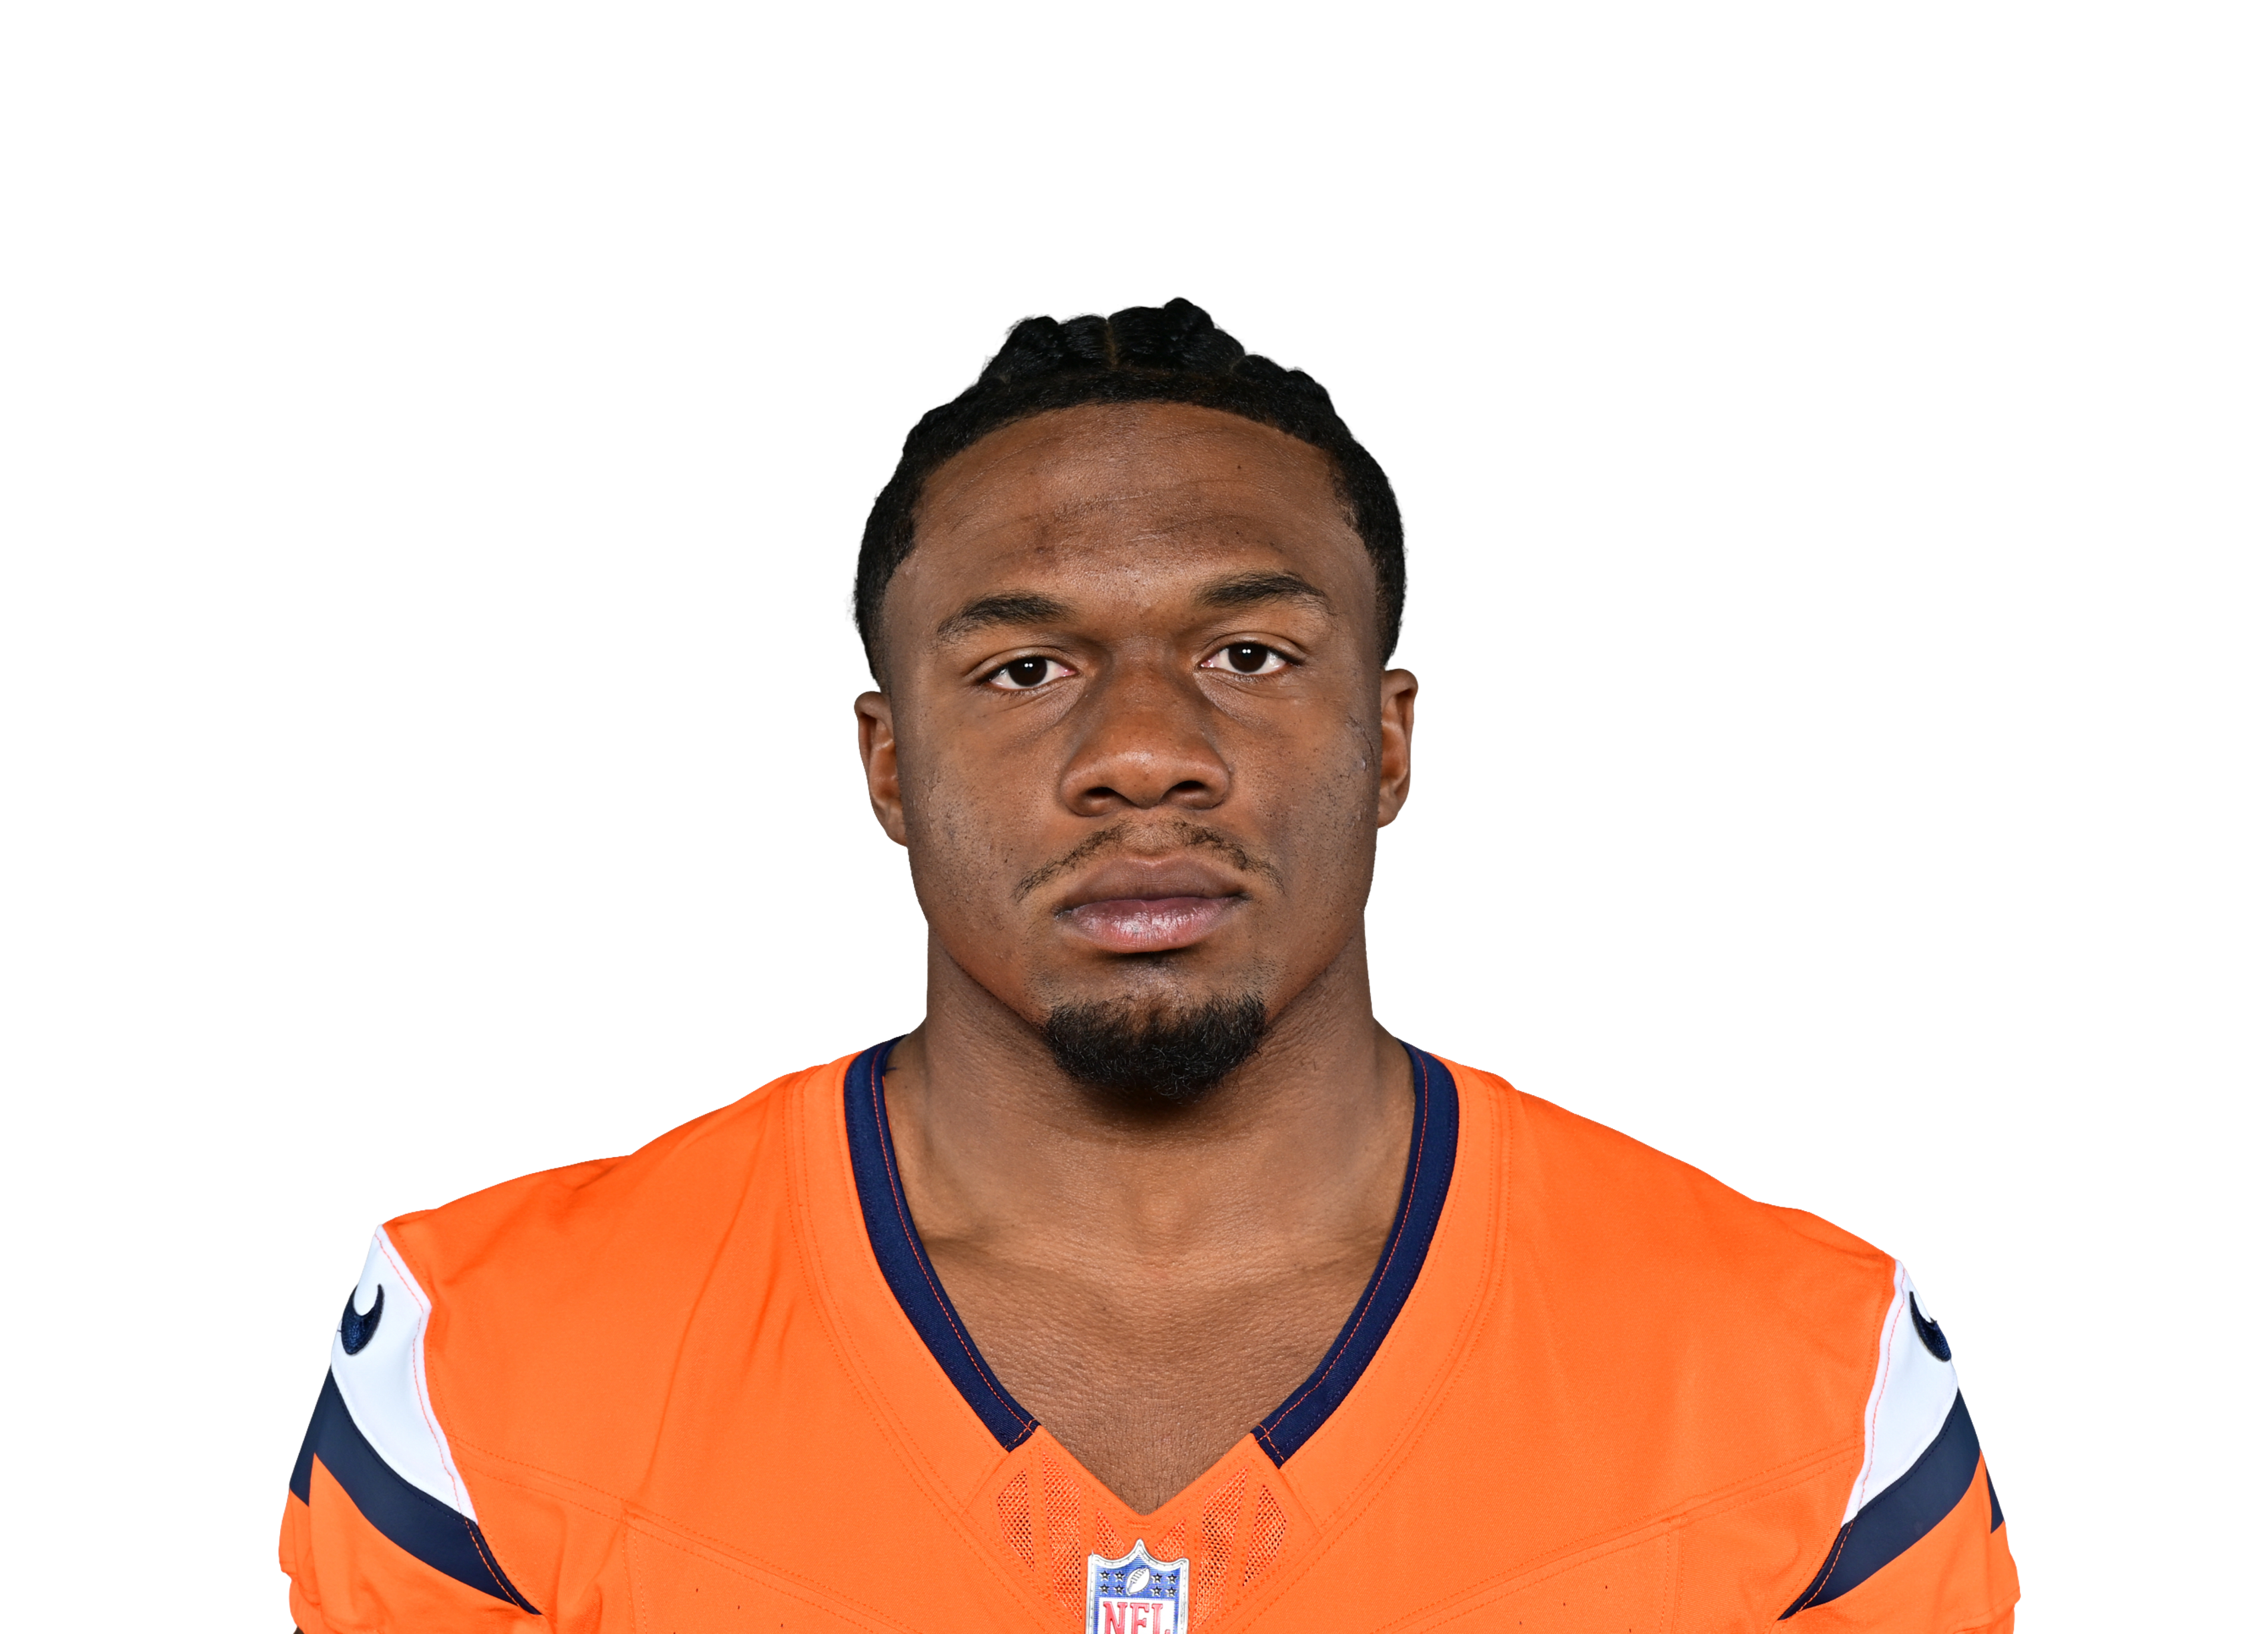
RJ Harvey
 DEN • RB • 6 games
Pick a teammate with or without. Pick more than one to combine them, like a game without the QB and without the other back.

25.4 PPR points a game allowed to running backs, 5th most of 32 defenses.
| Player | PPR | Rush | Rush Yd | Rush TD | Rec | Rec Yd |
|---|---|---|---|---|---|---|
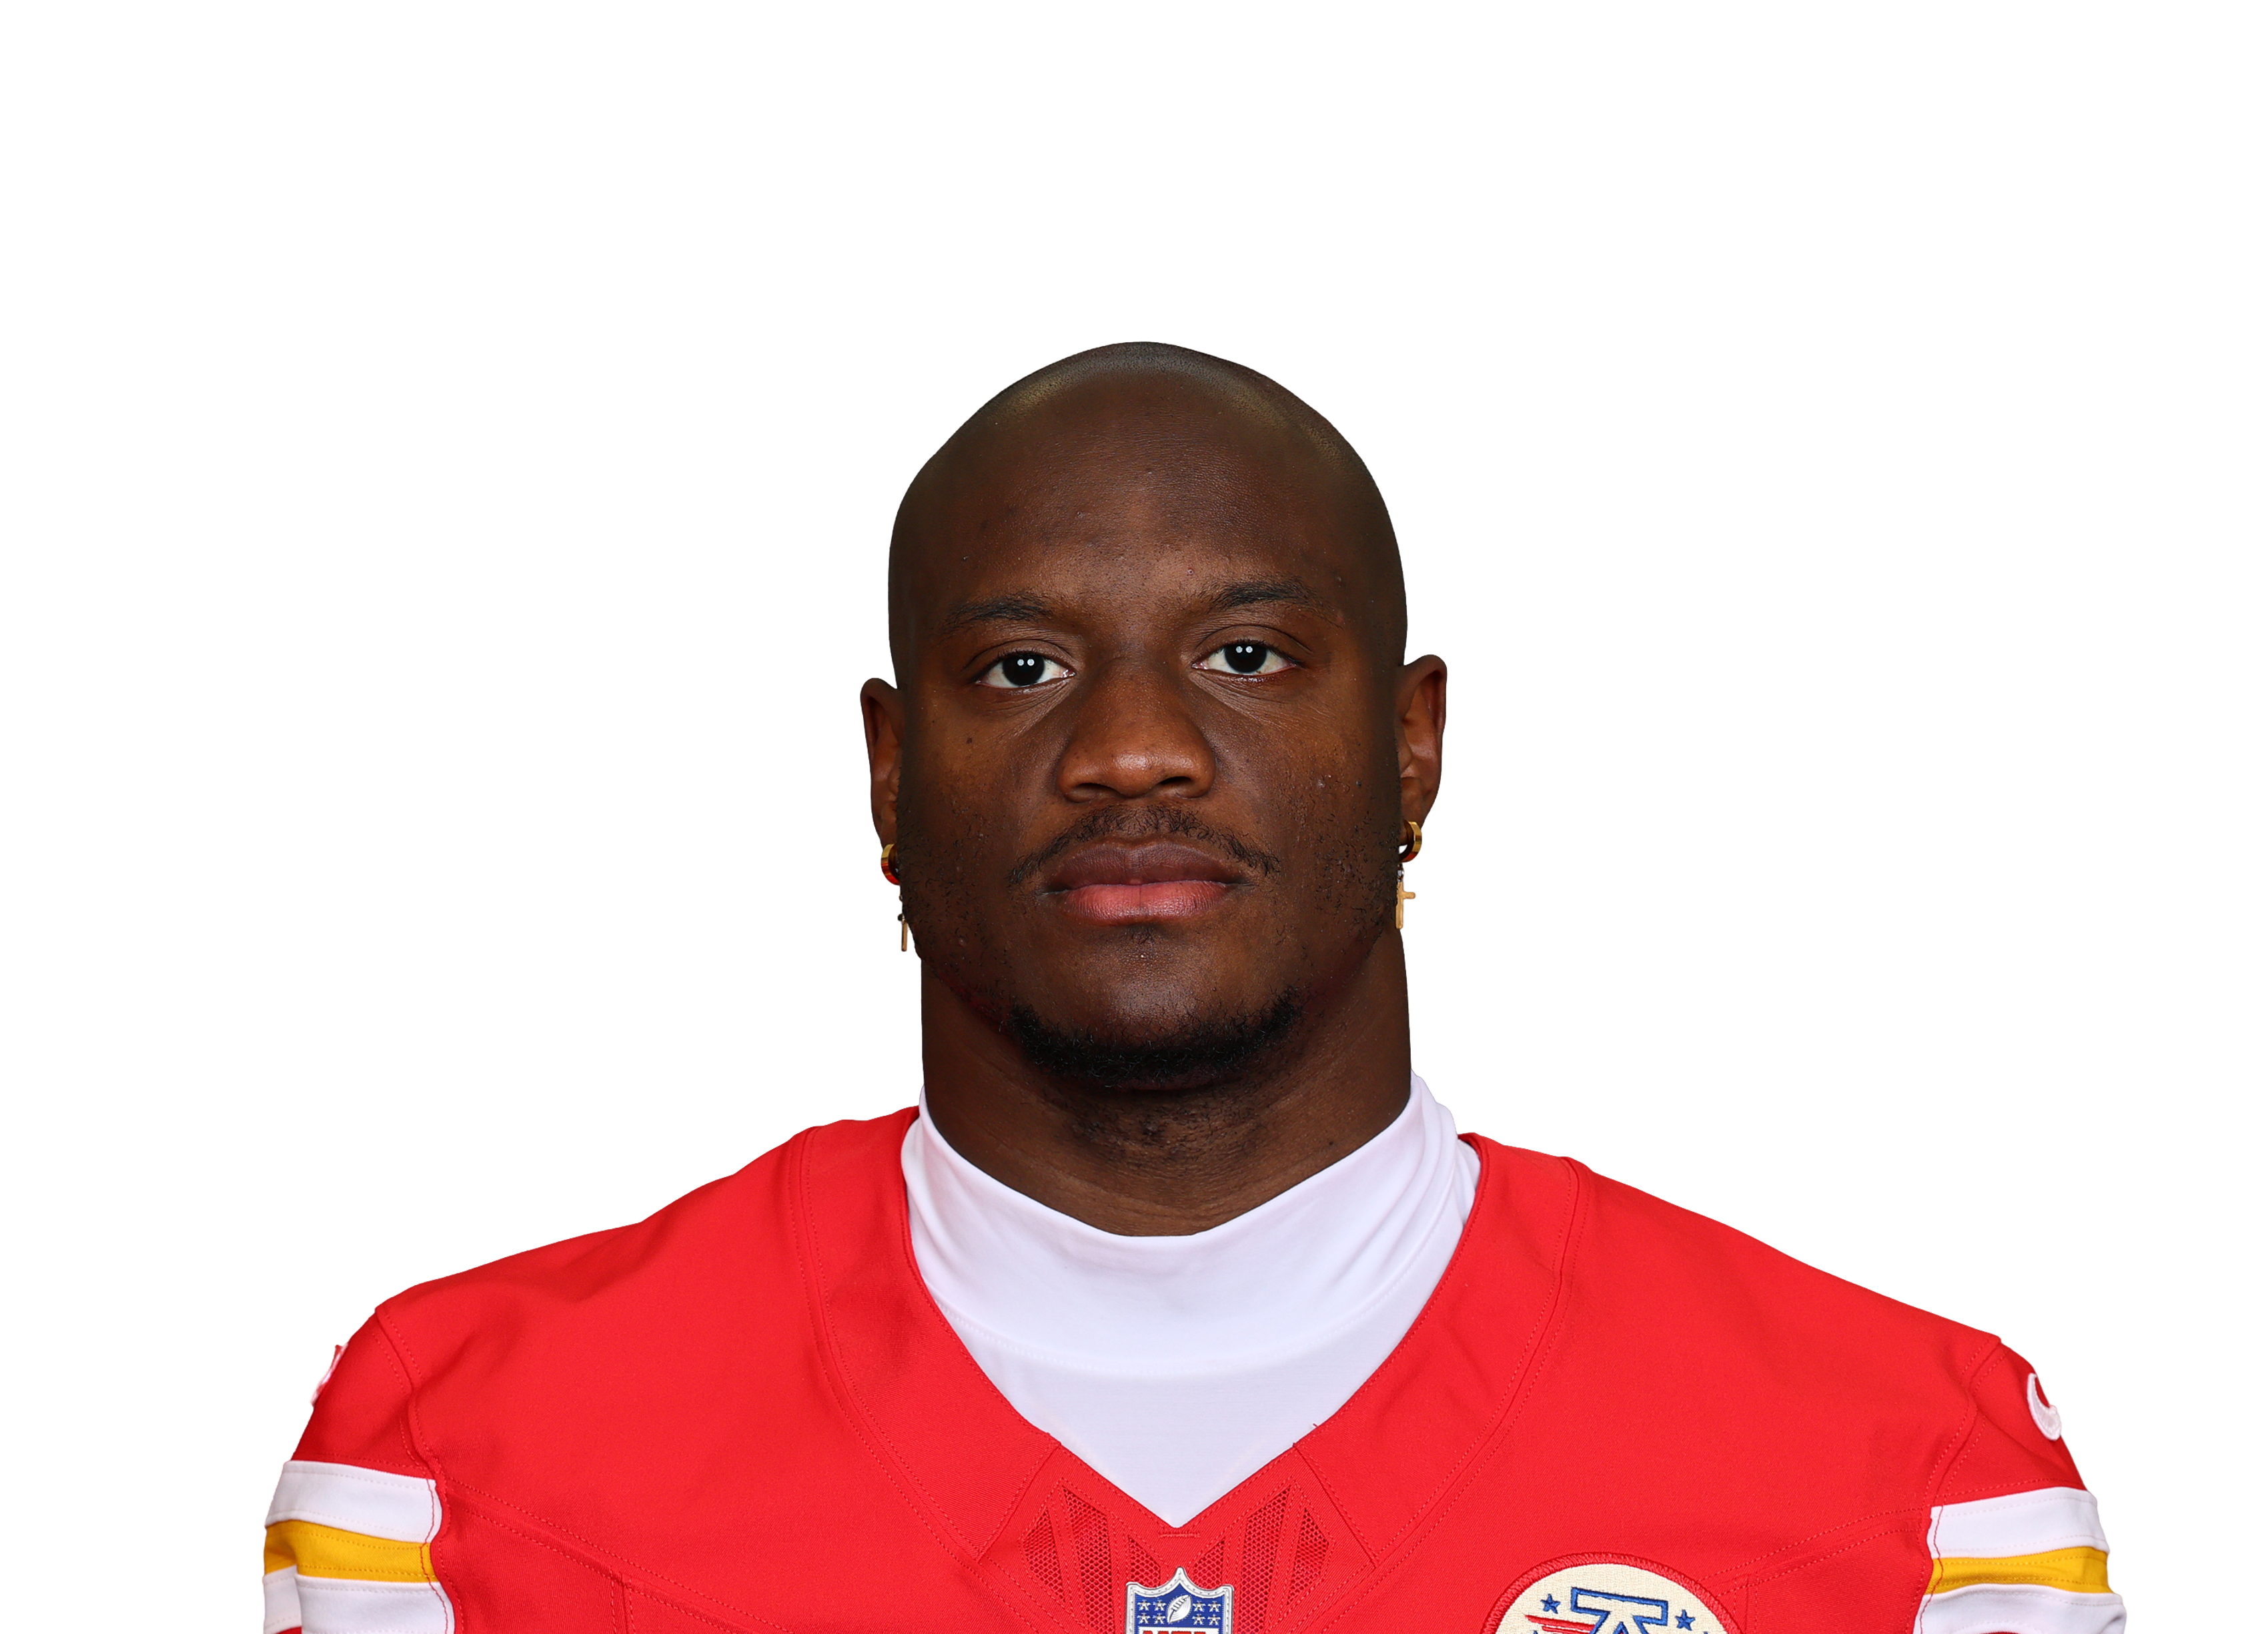 Kenneth Walker IIIvs KC • Wk 4 | 30.9 | 22 | 177 | 2 | 1 | 2 |
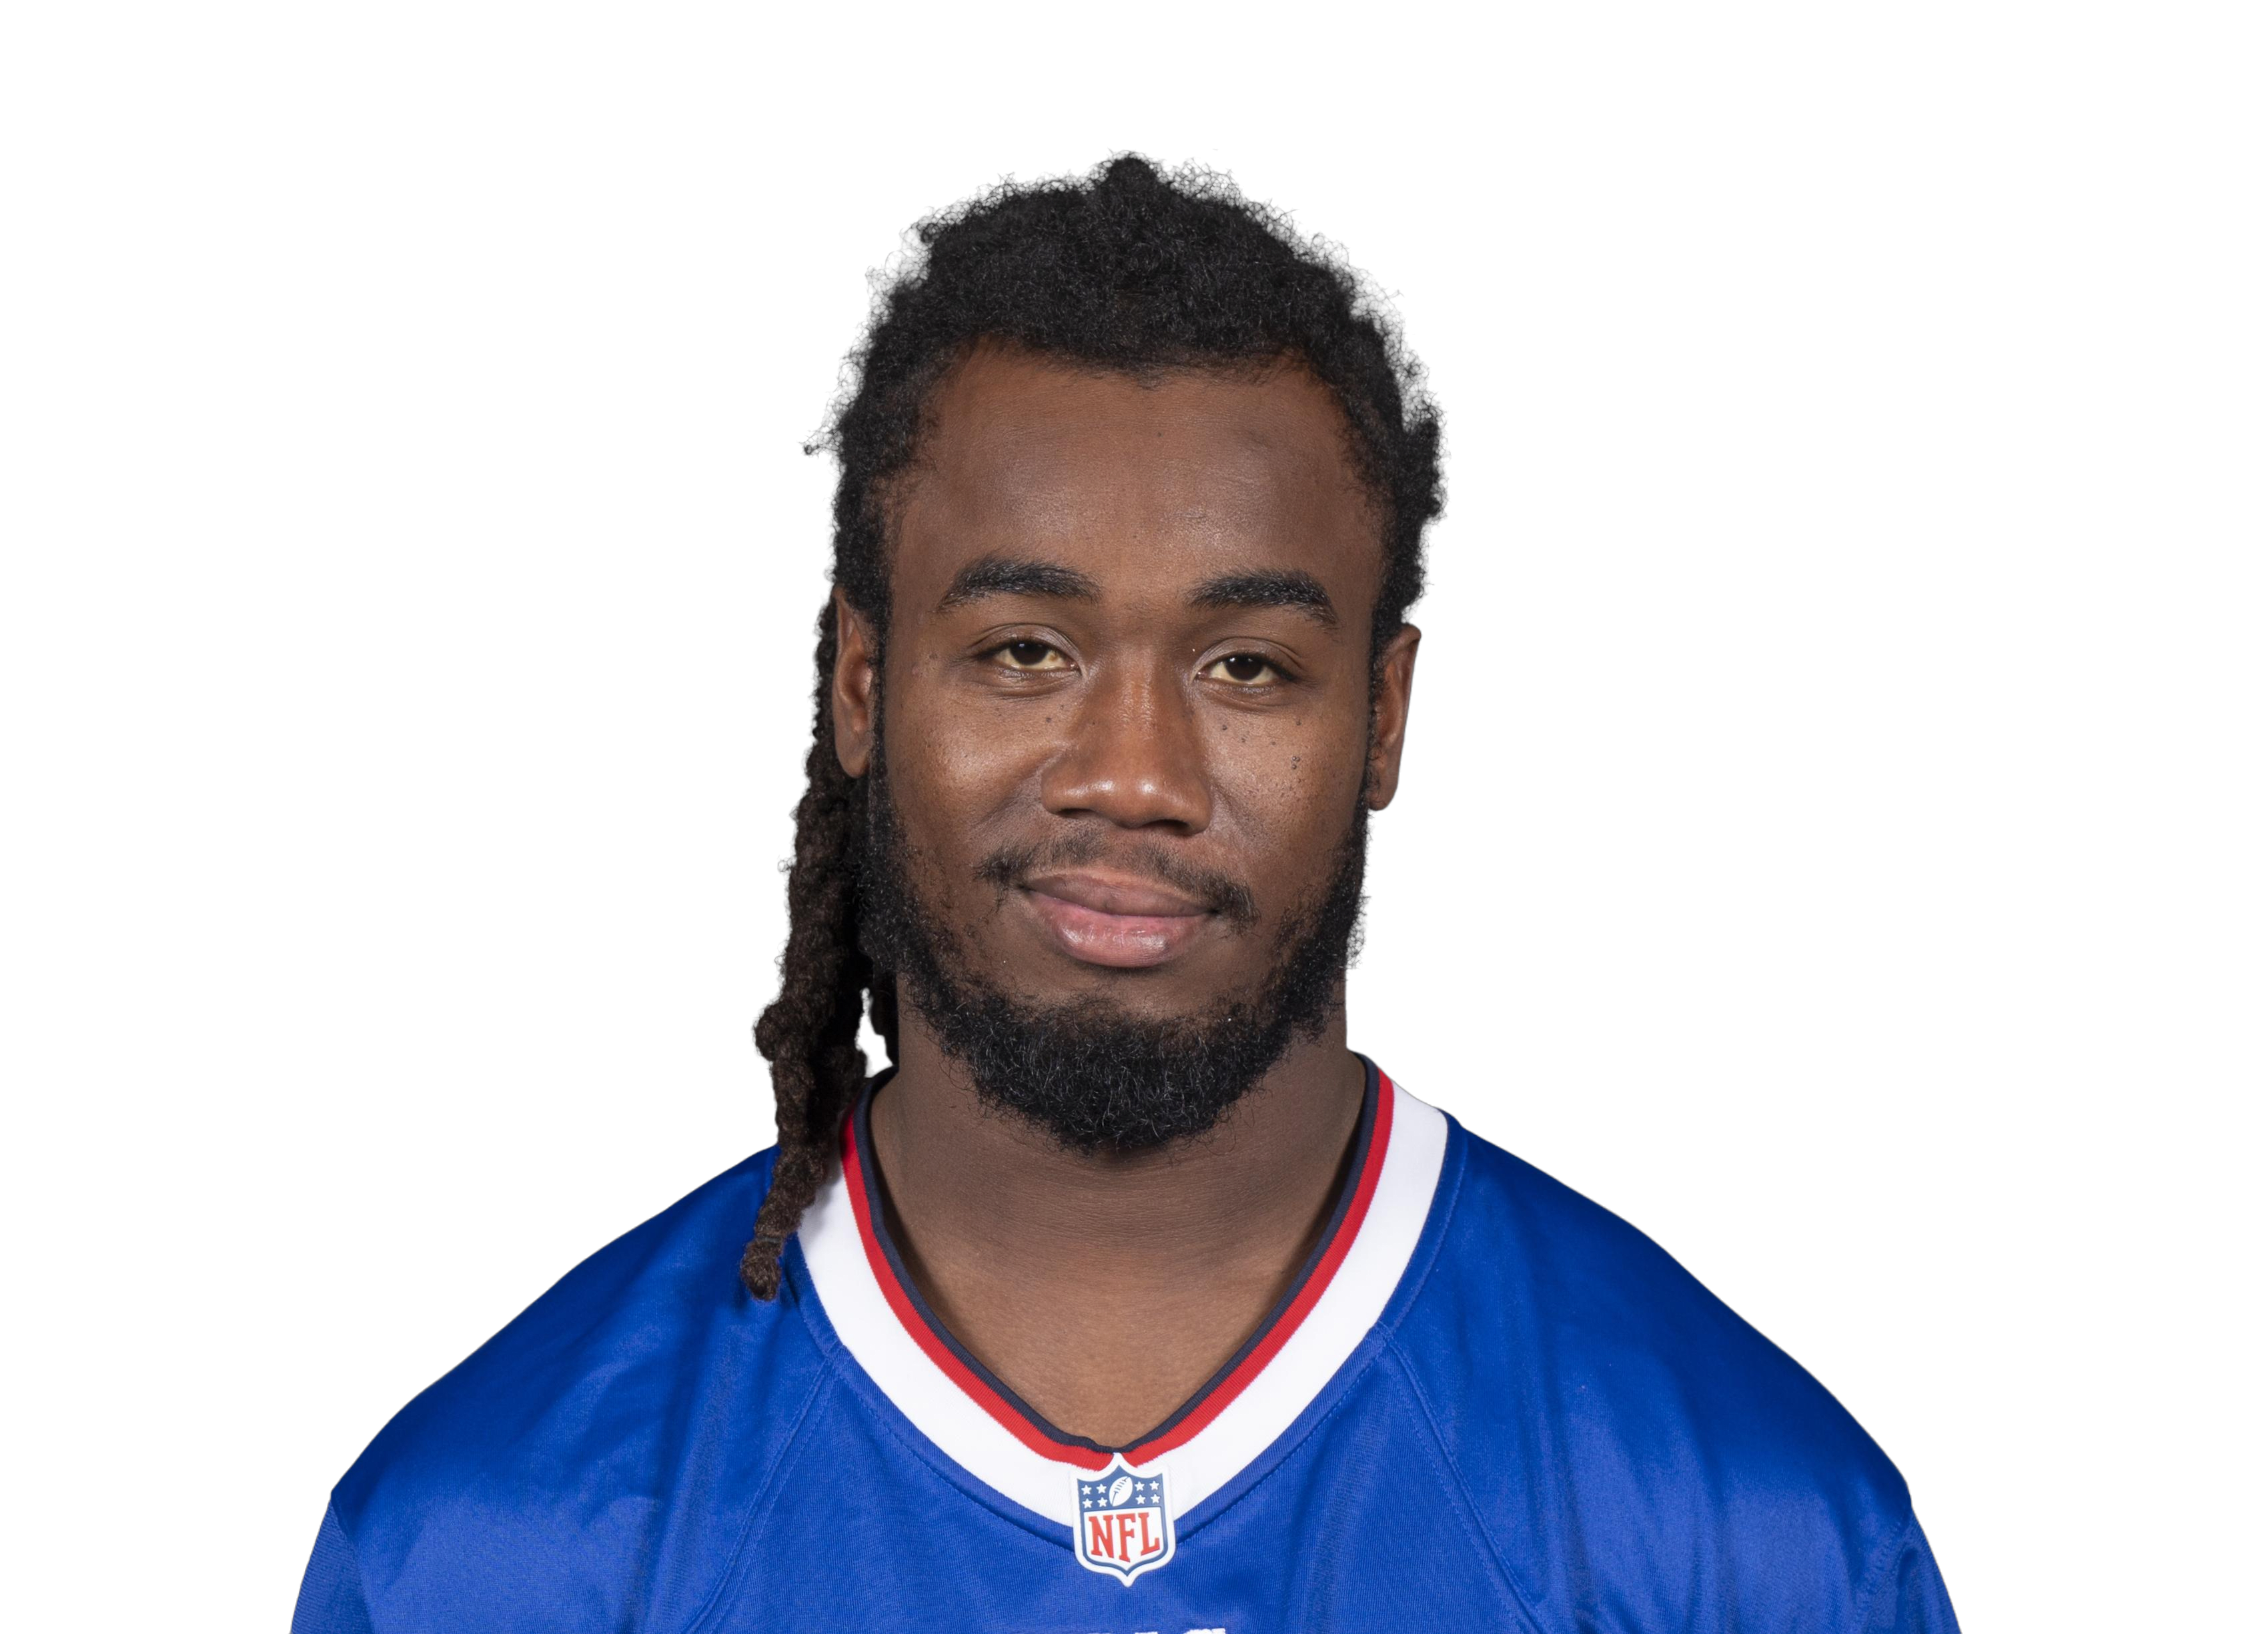 James Cookvs BUF • Wk 6 | 24.3 | 22 | 95 | 1 | 3 | 58 |
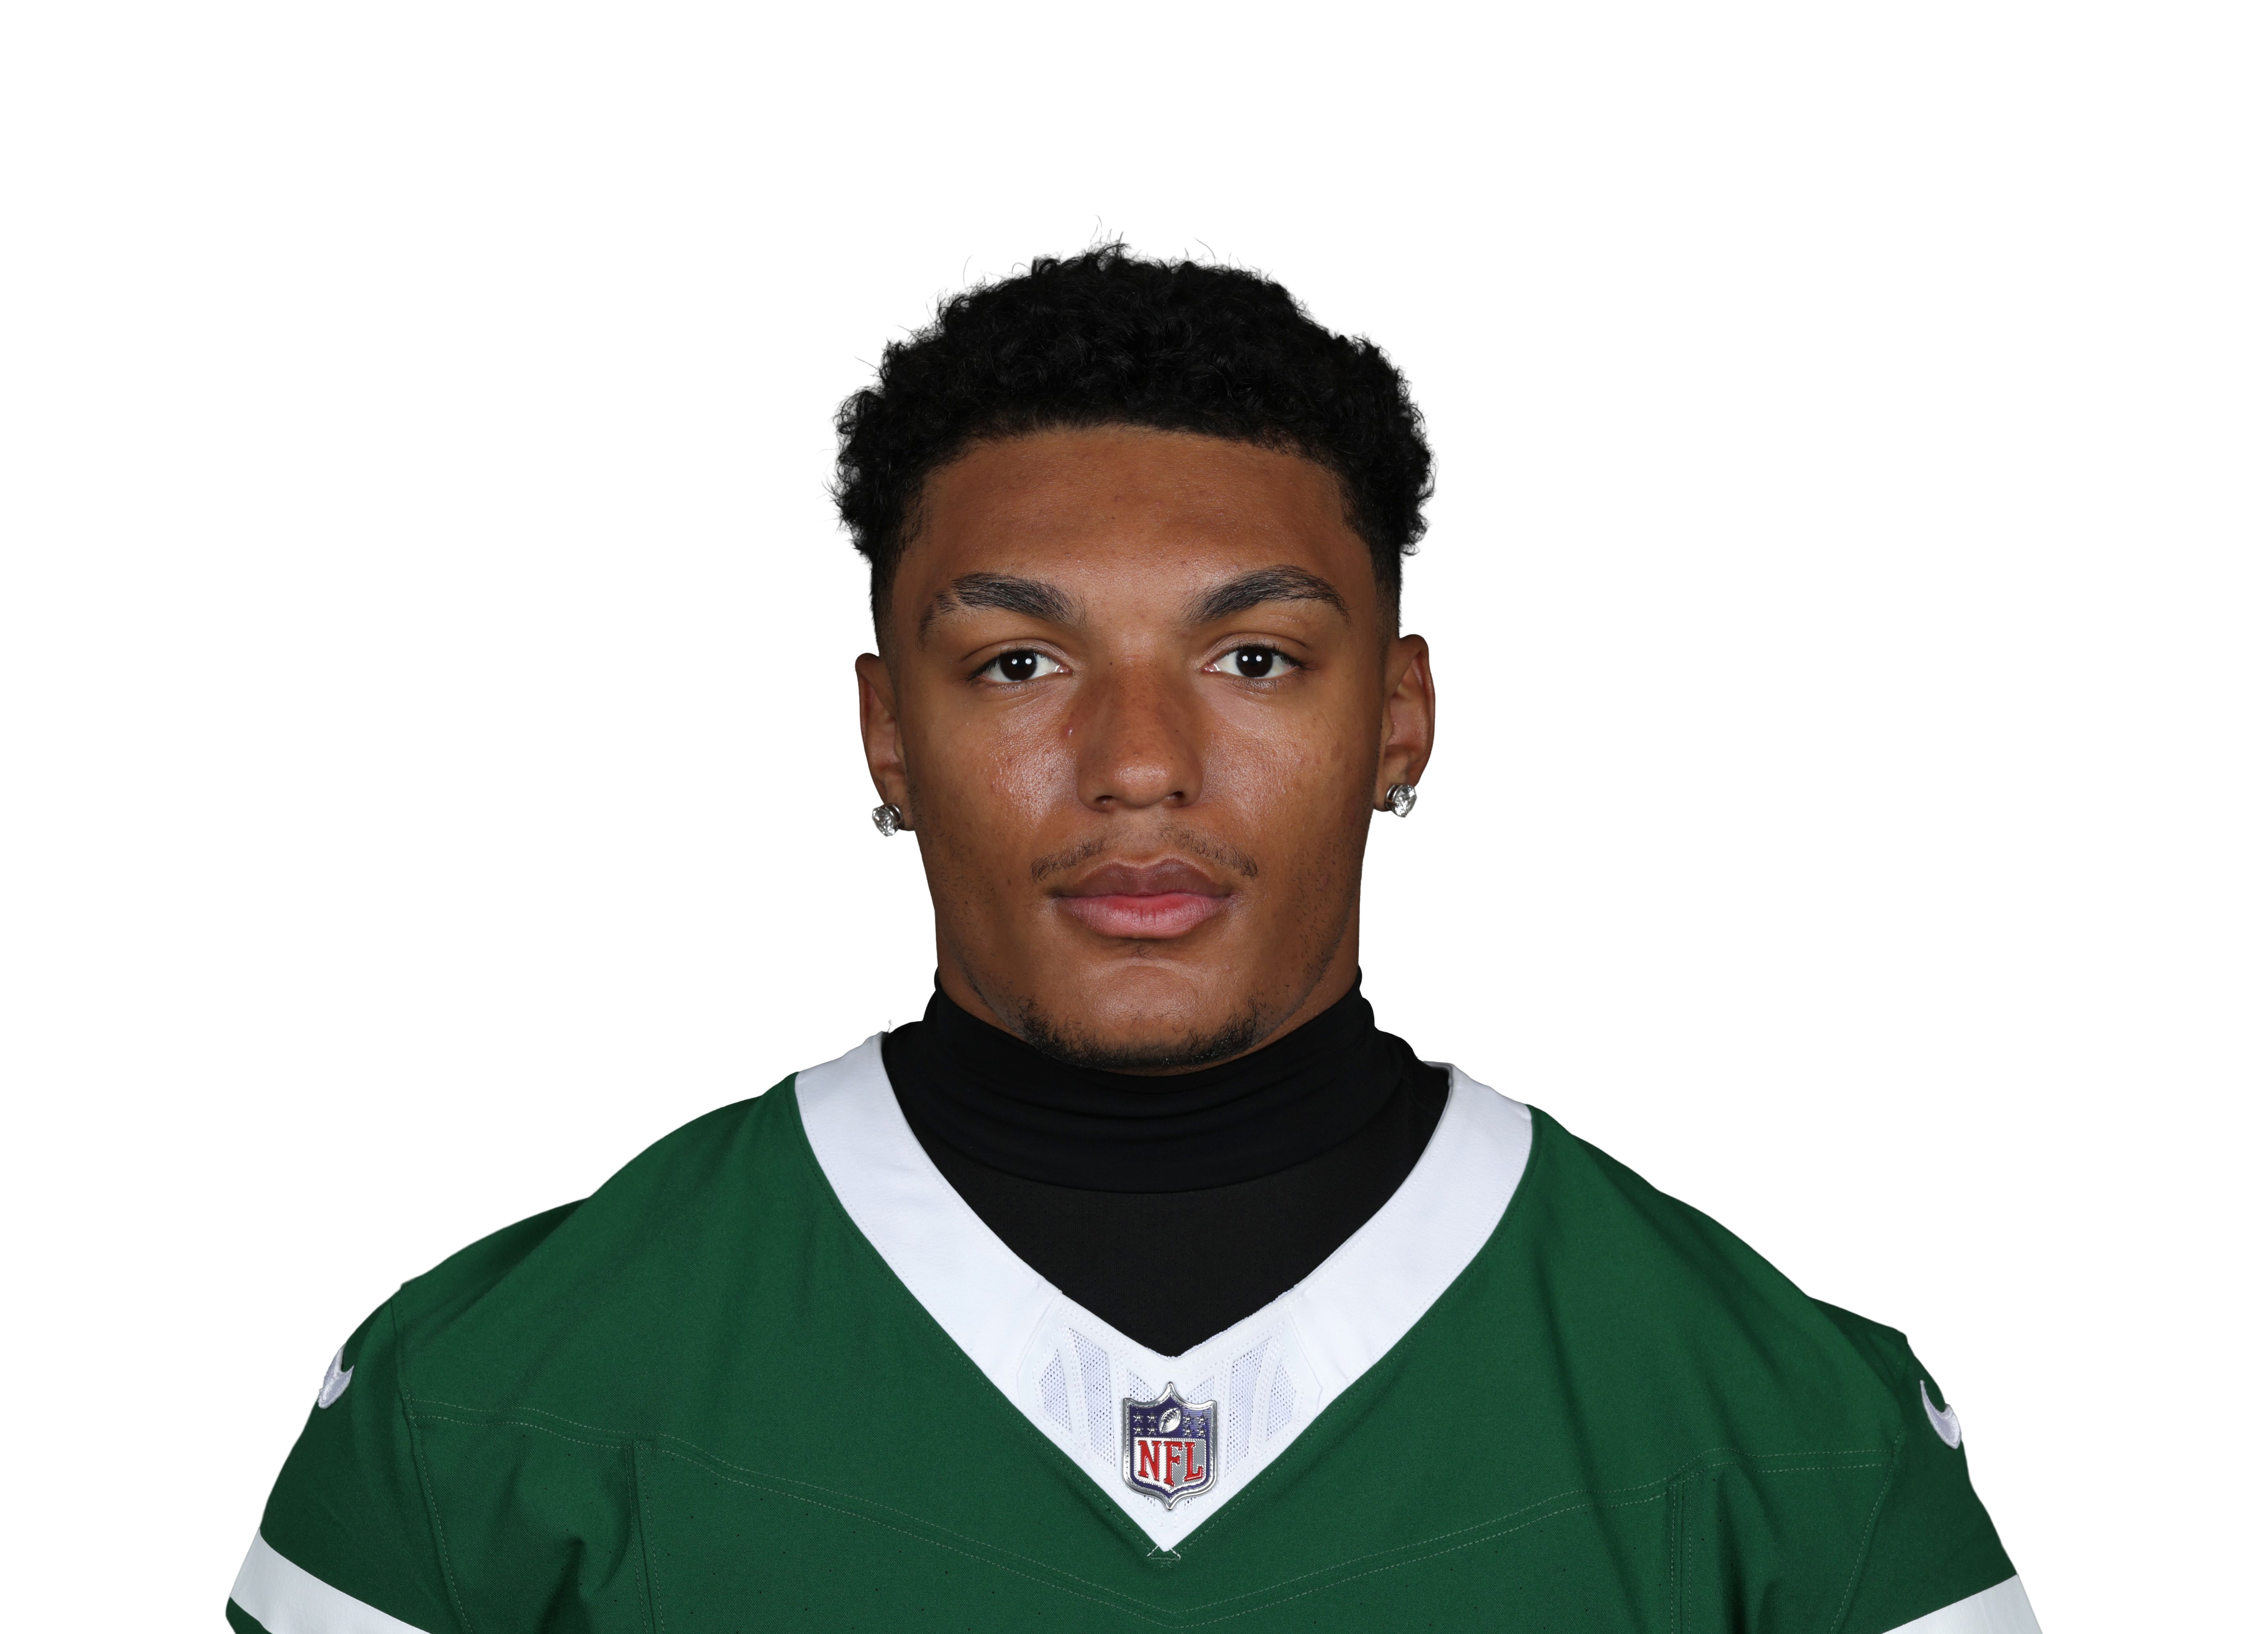 Braelon Allen@ NYJ • Wk 8 | 23.3 | 21 | 147 | 1 | 2 | 6 |
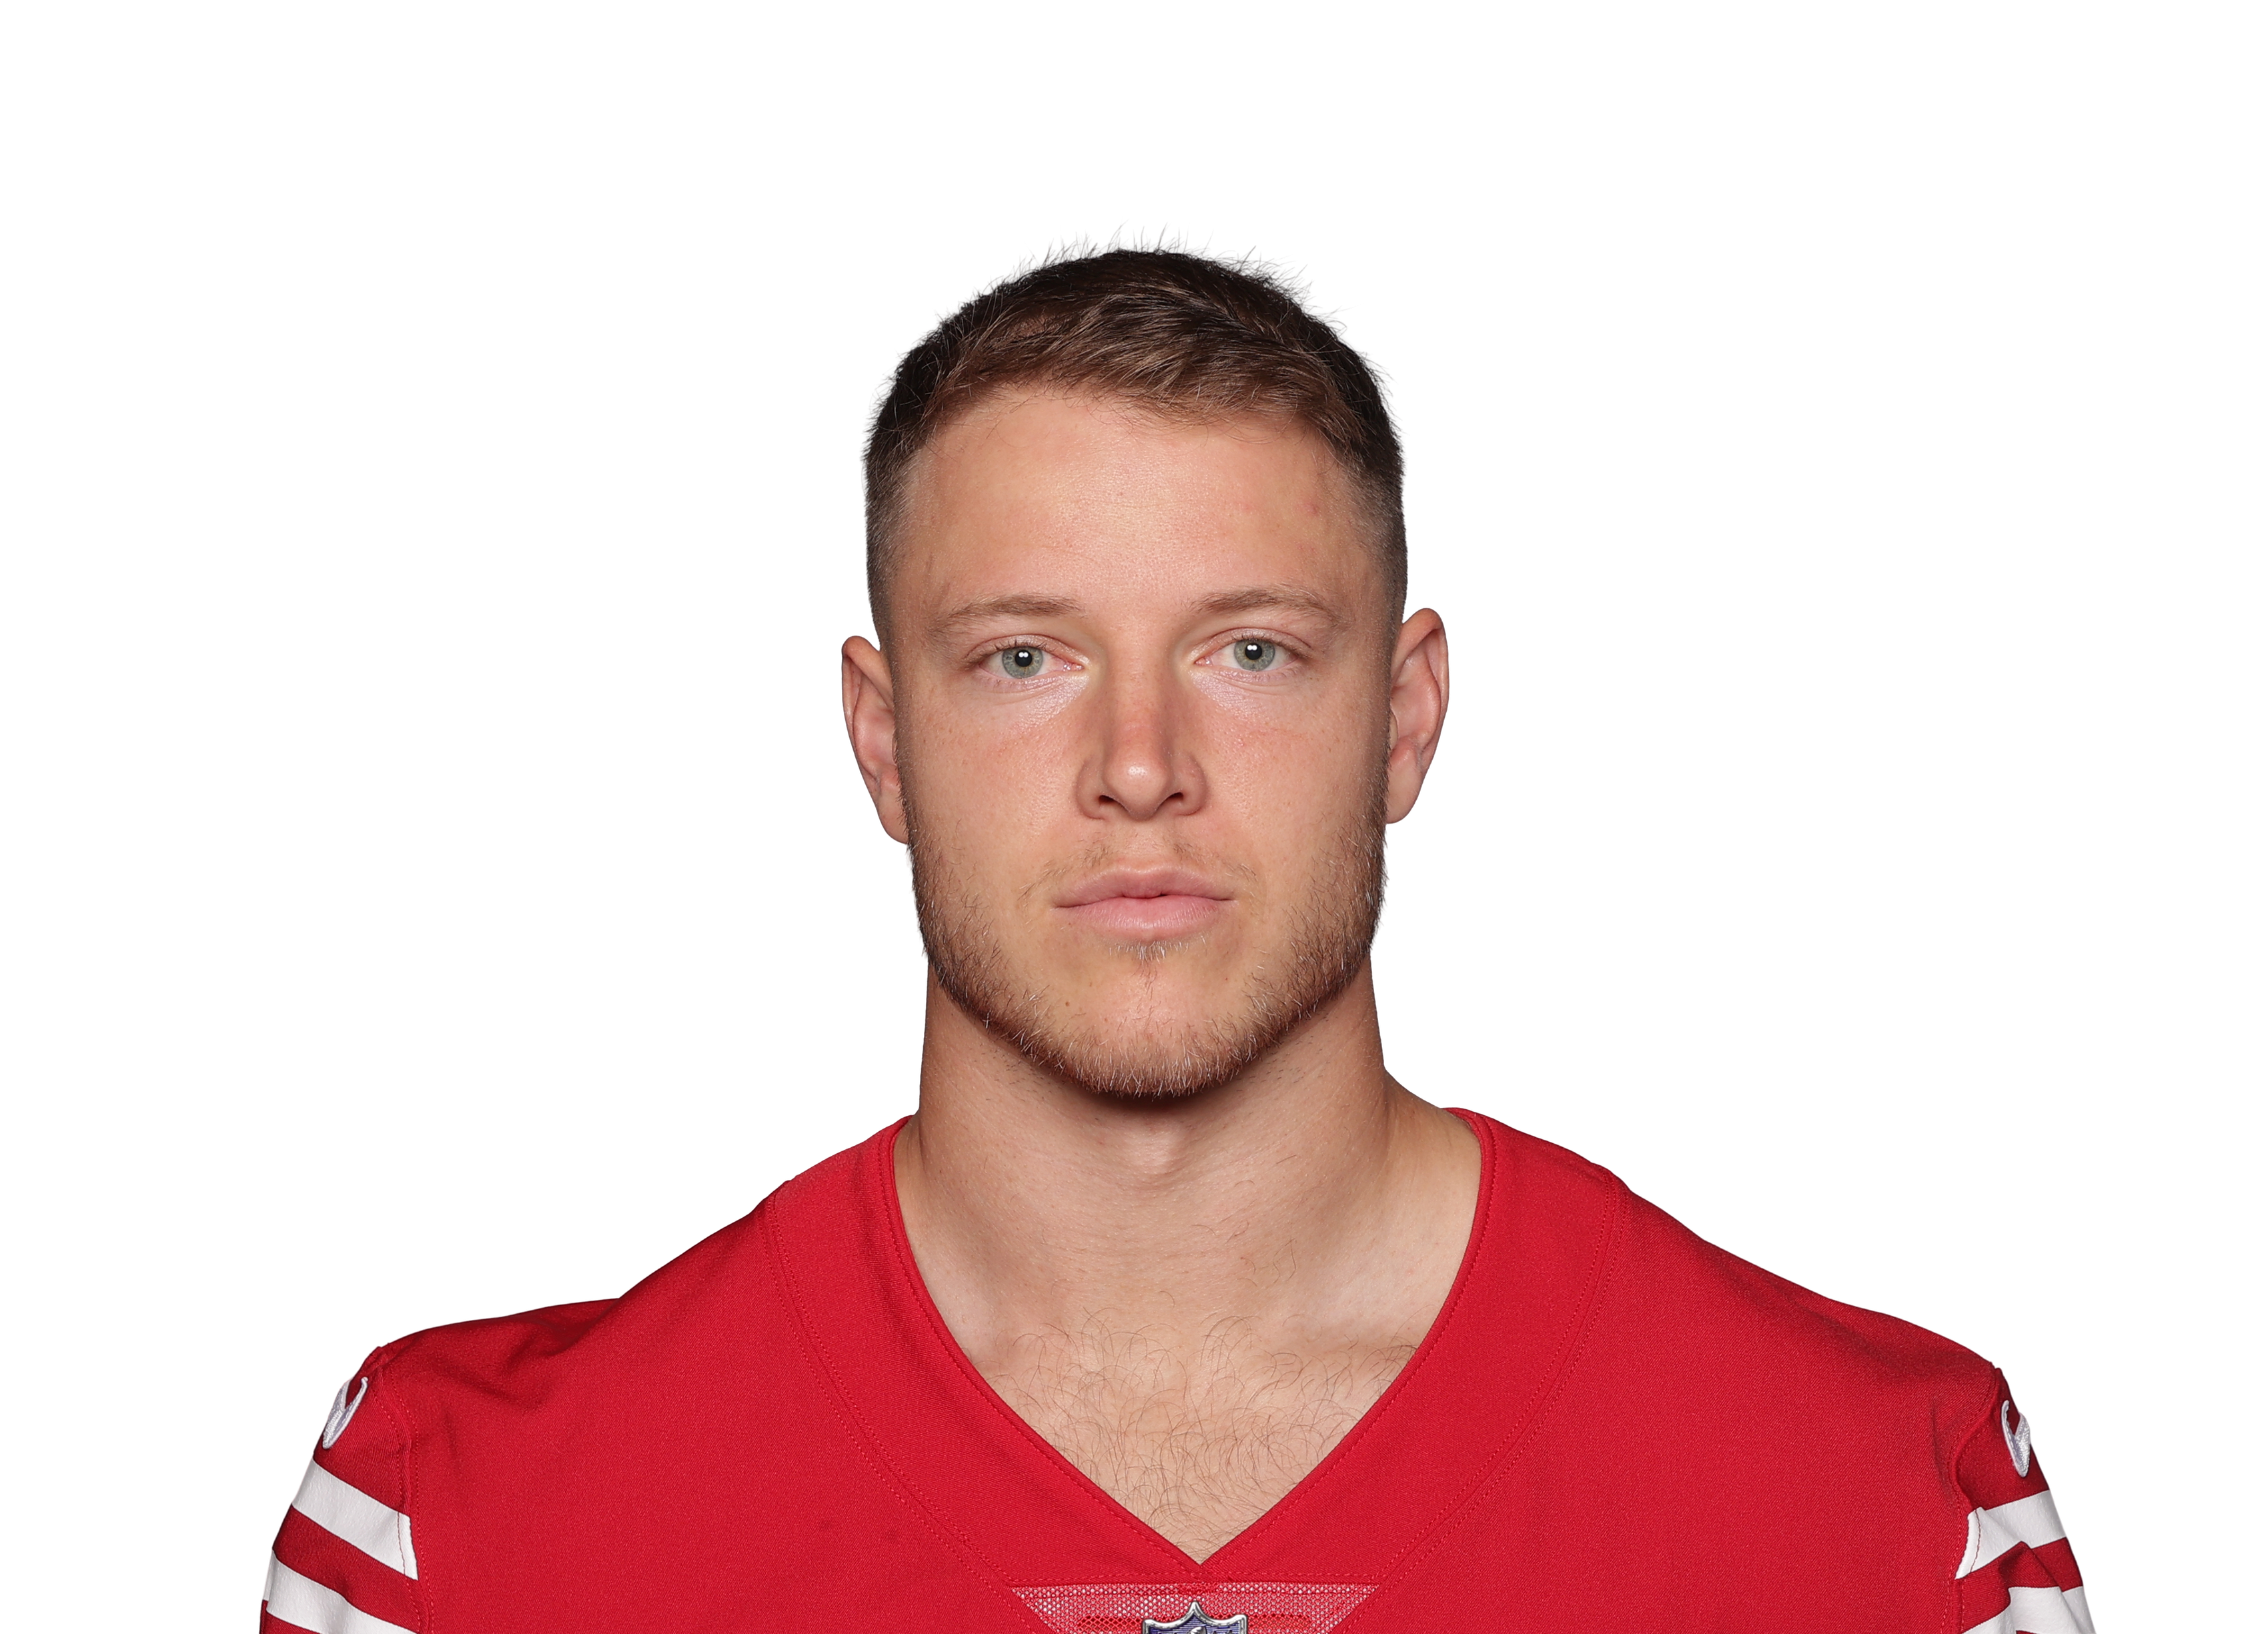 Christian McCaffrey@ SF • Wk 9 | 22.7 | 18 | 68 | 1 | 2 | 19 |
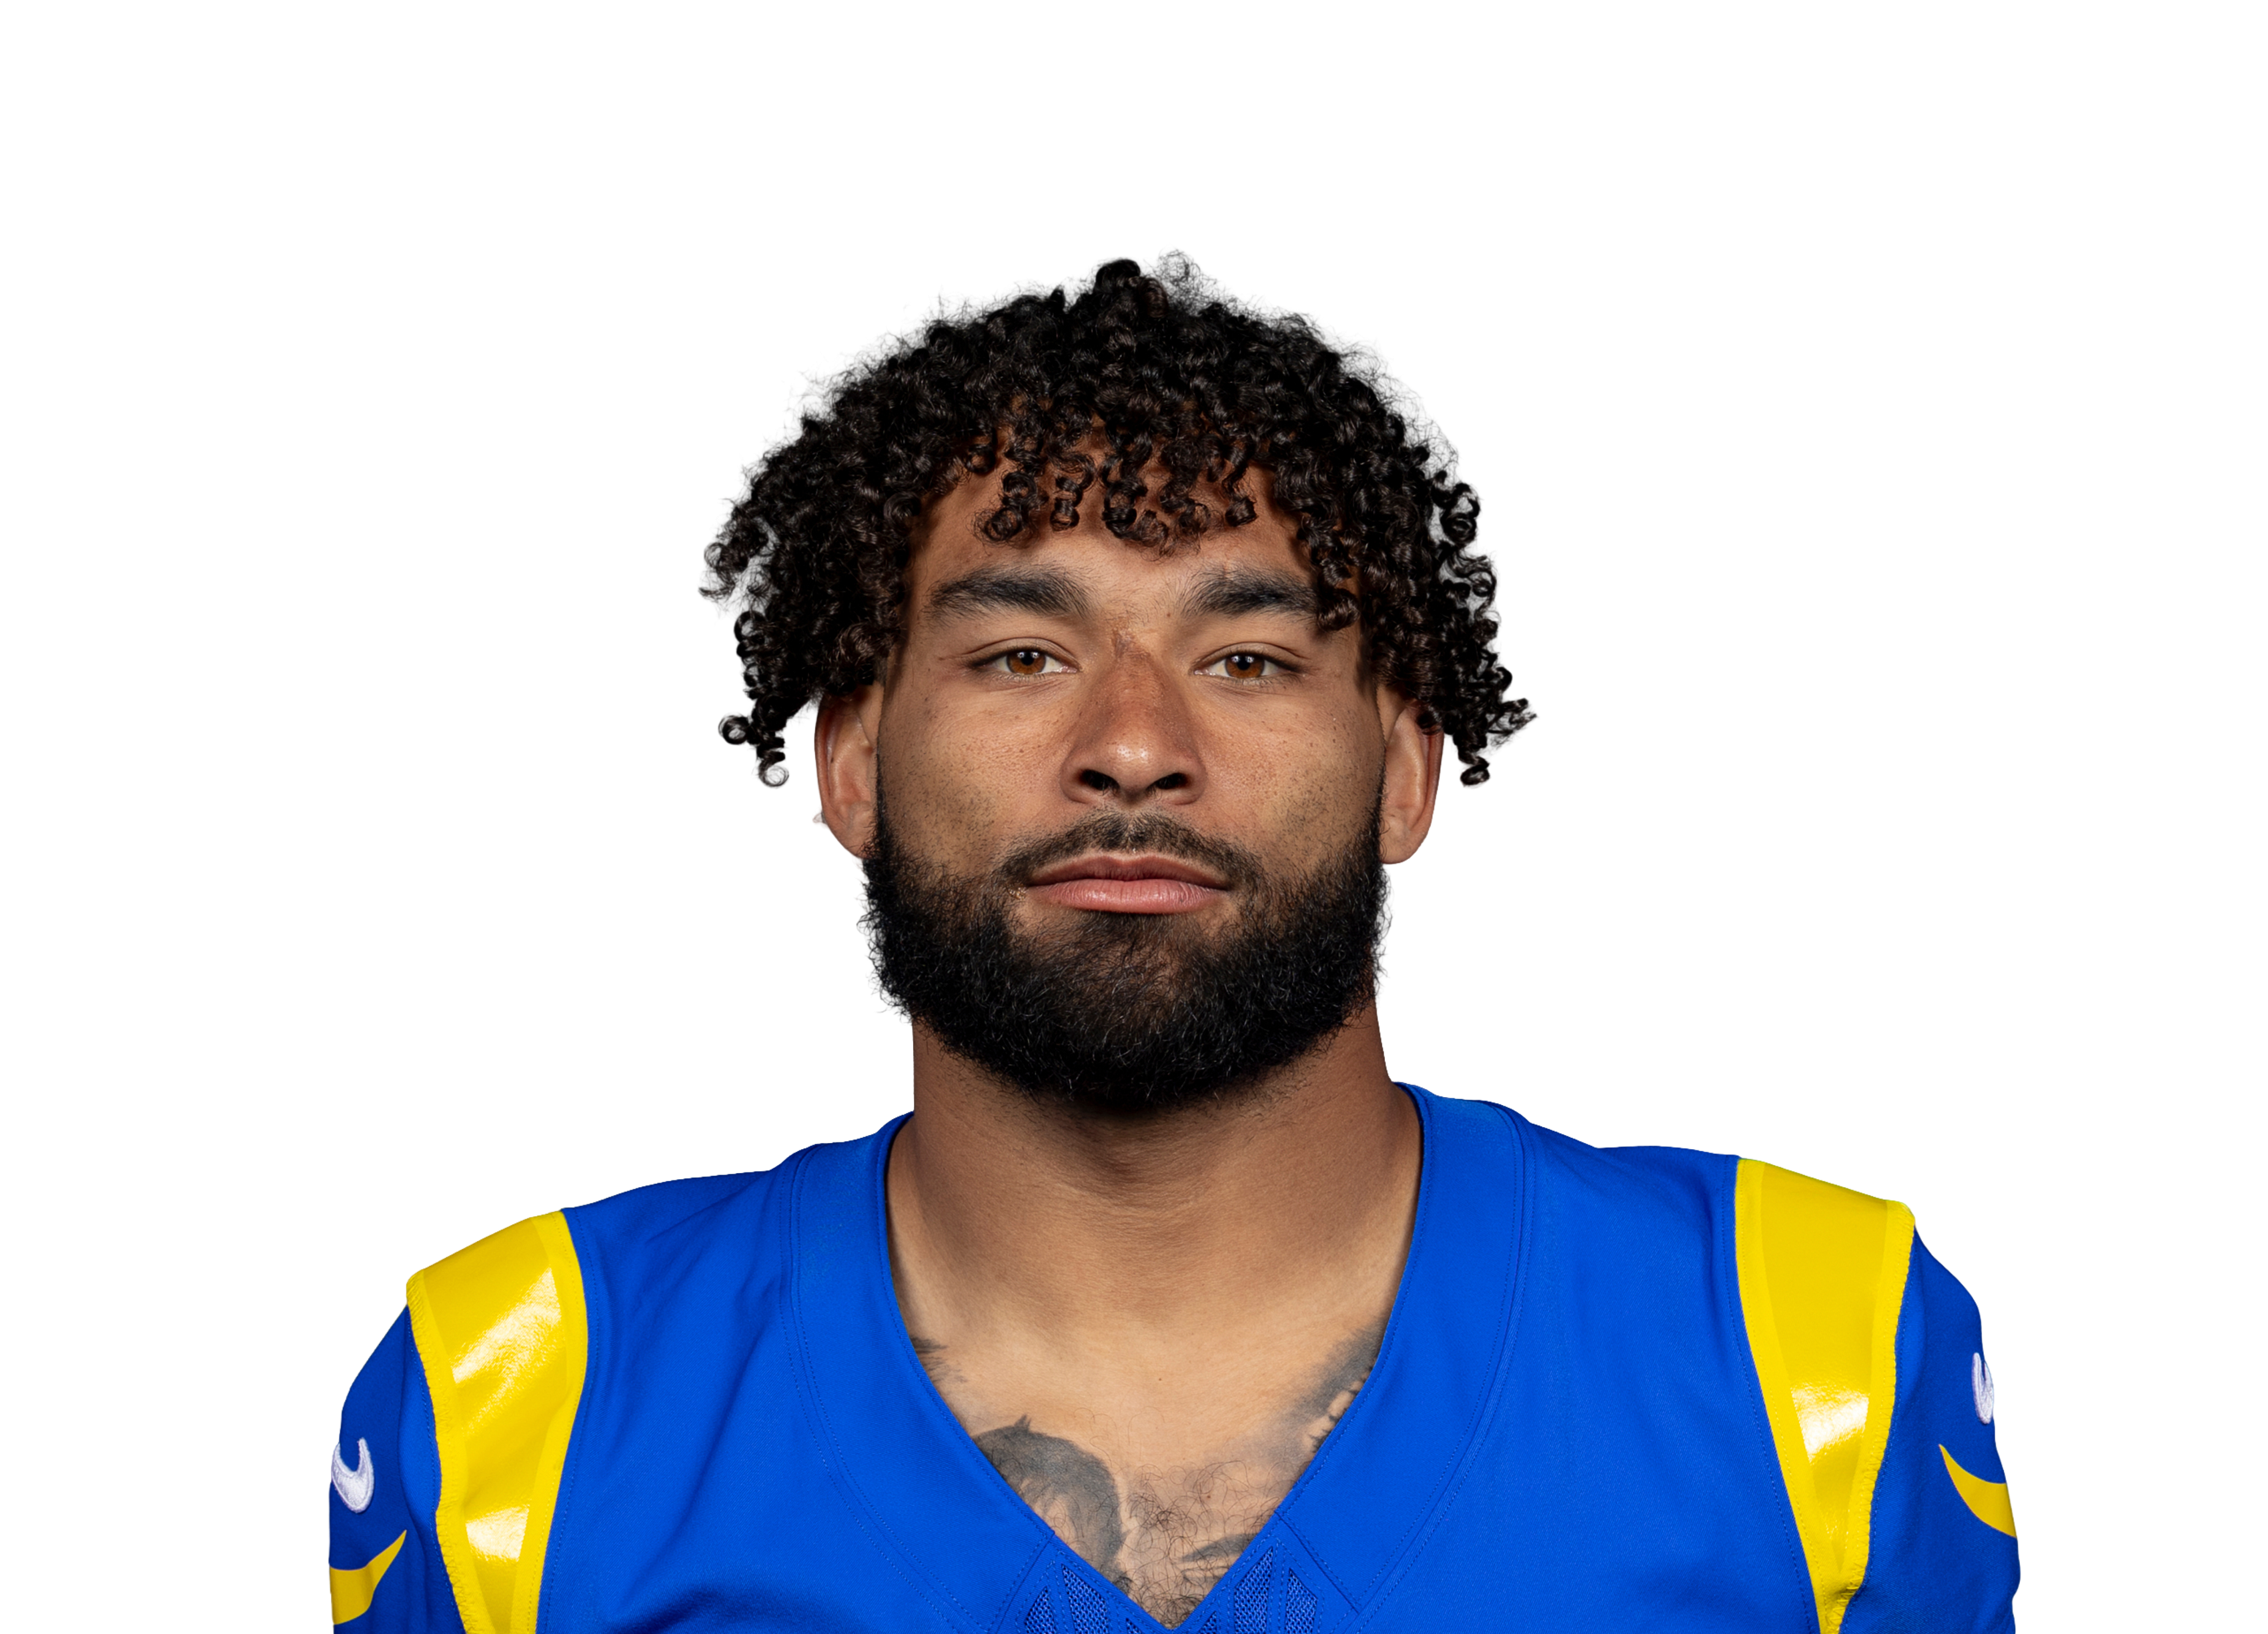 Kyren Williamsvs LA • Wk 7 | 18.1 | 16 | 99 | 1 | 2 | 22 |
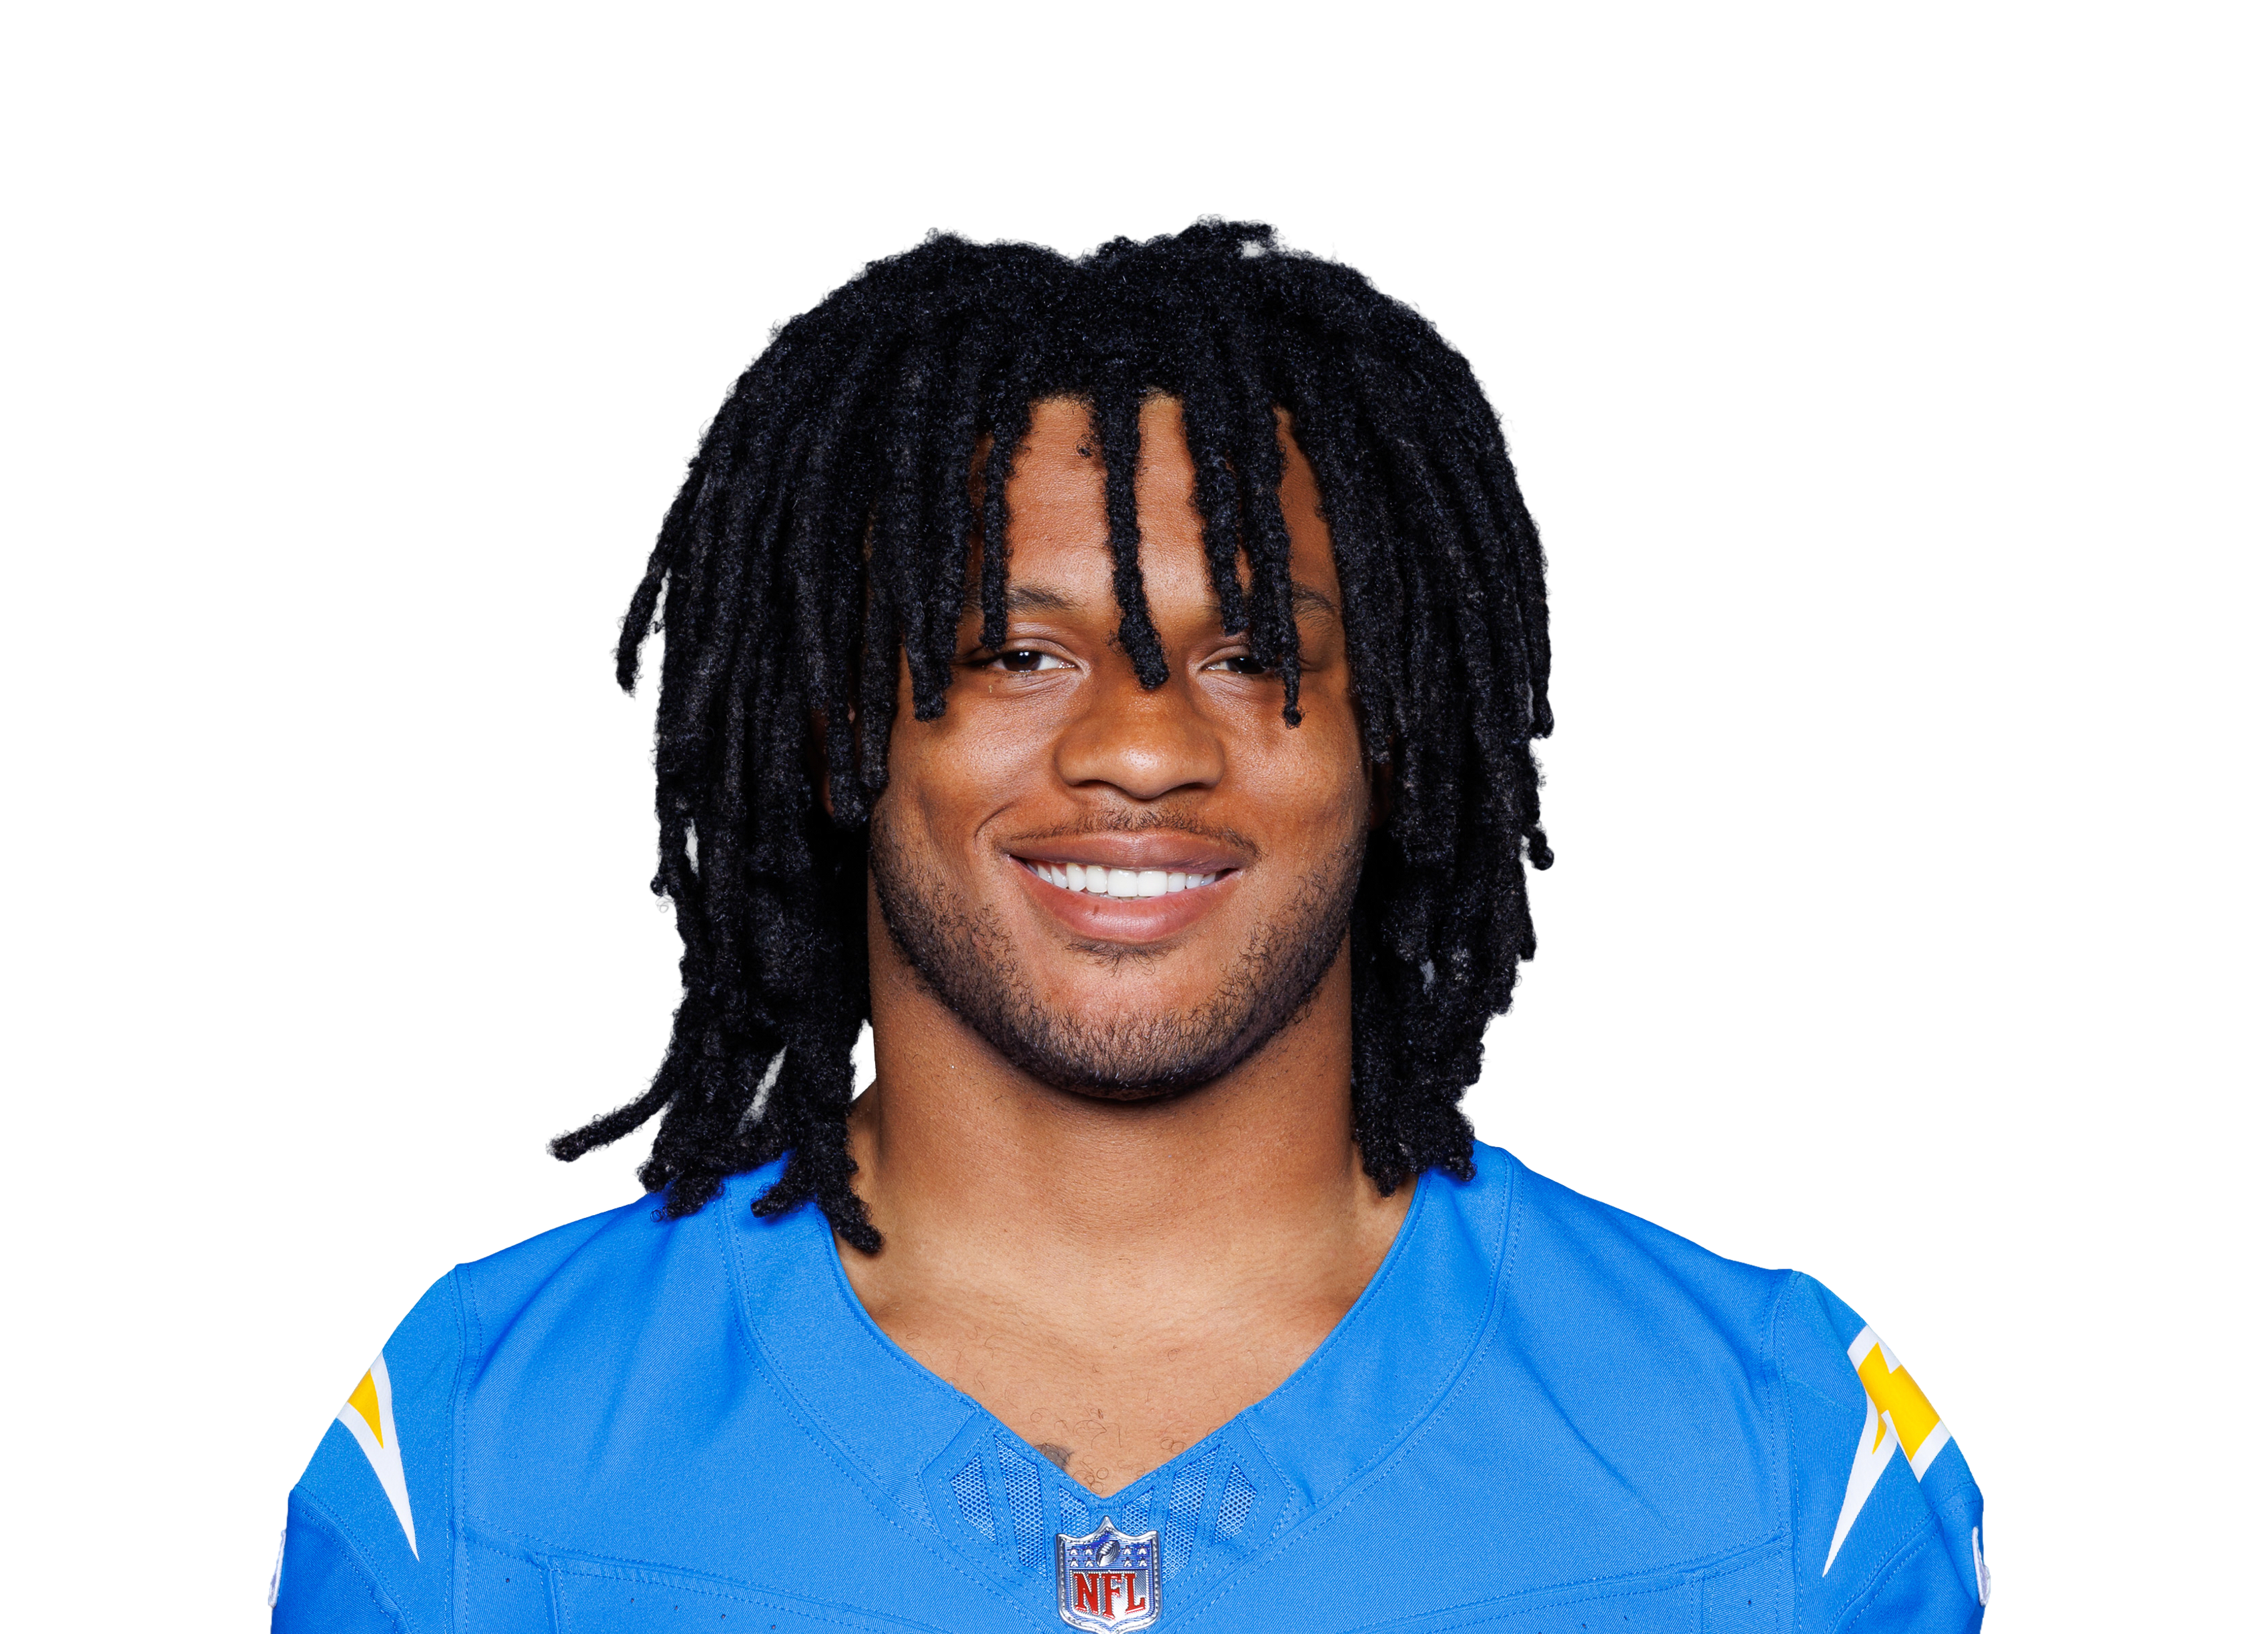 Omarion Hampton@ LAC • Wk 2 | 17.5 | 23 | 94 | 1 | 2 | 21 |
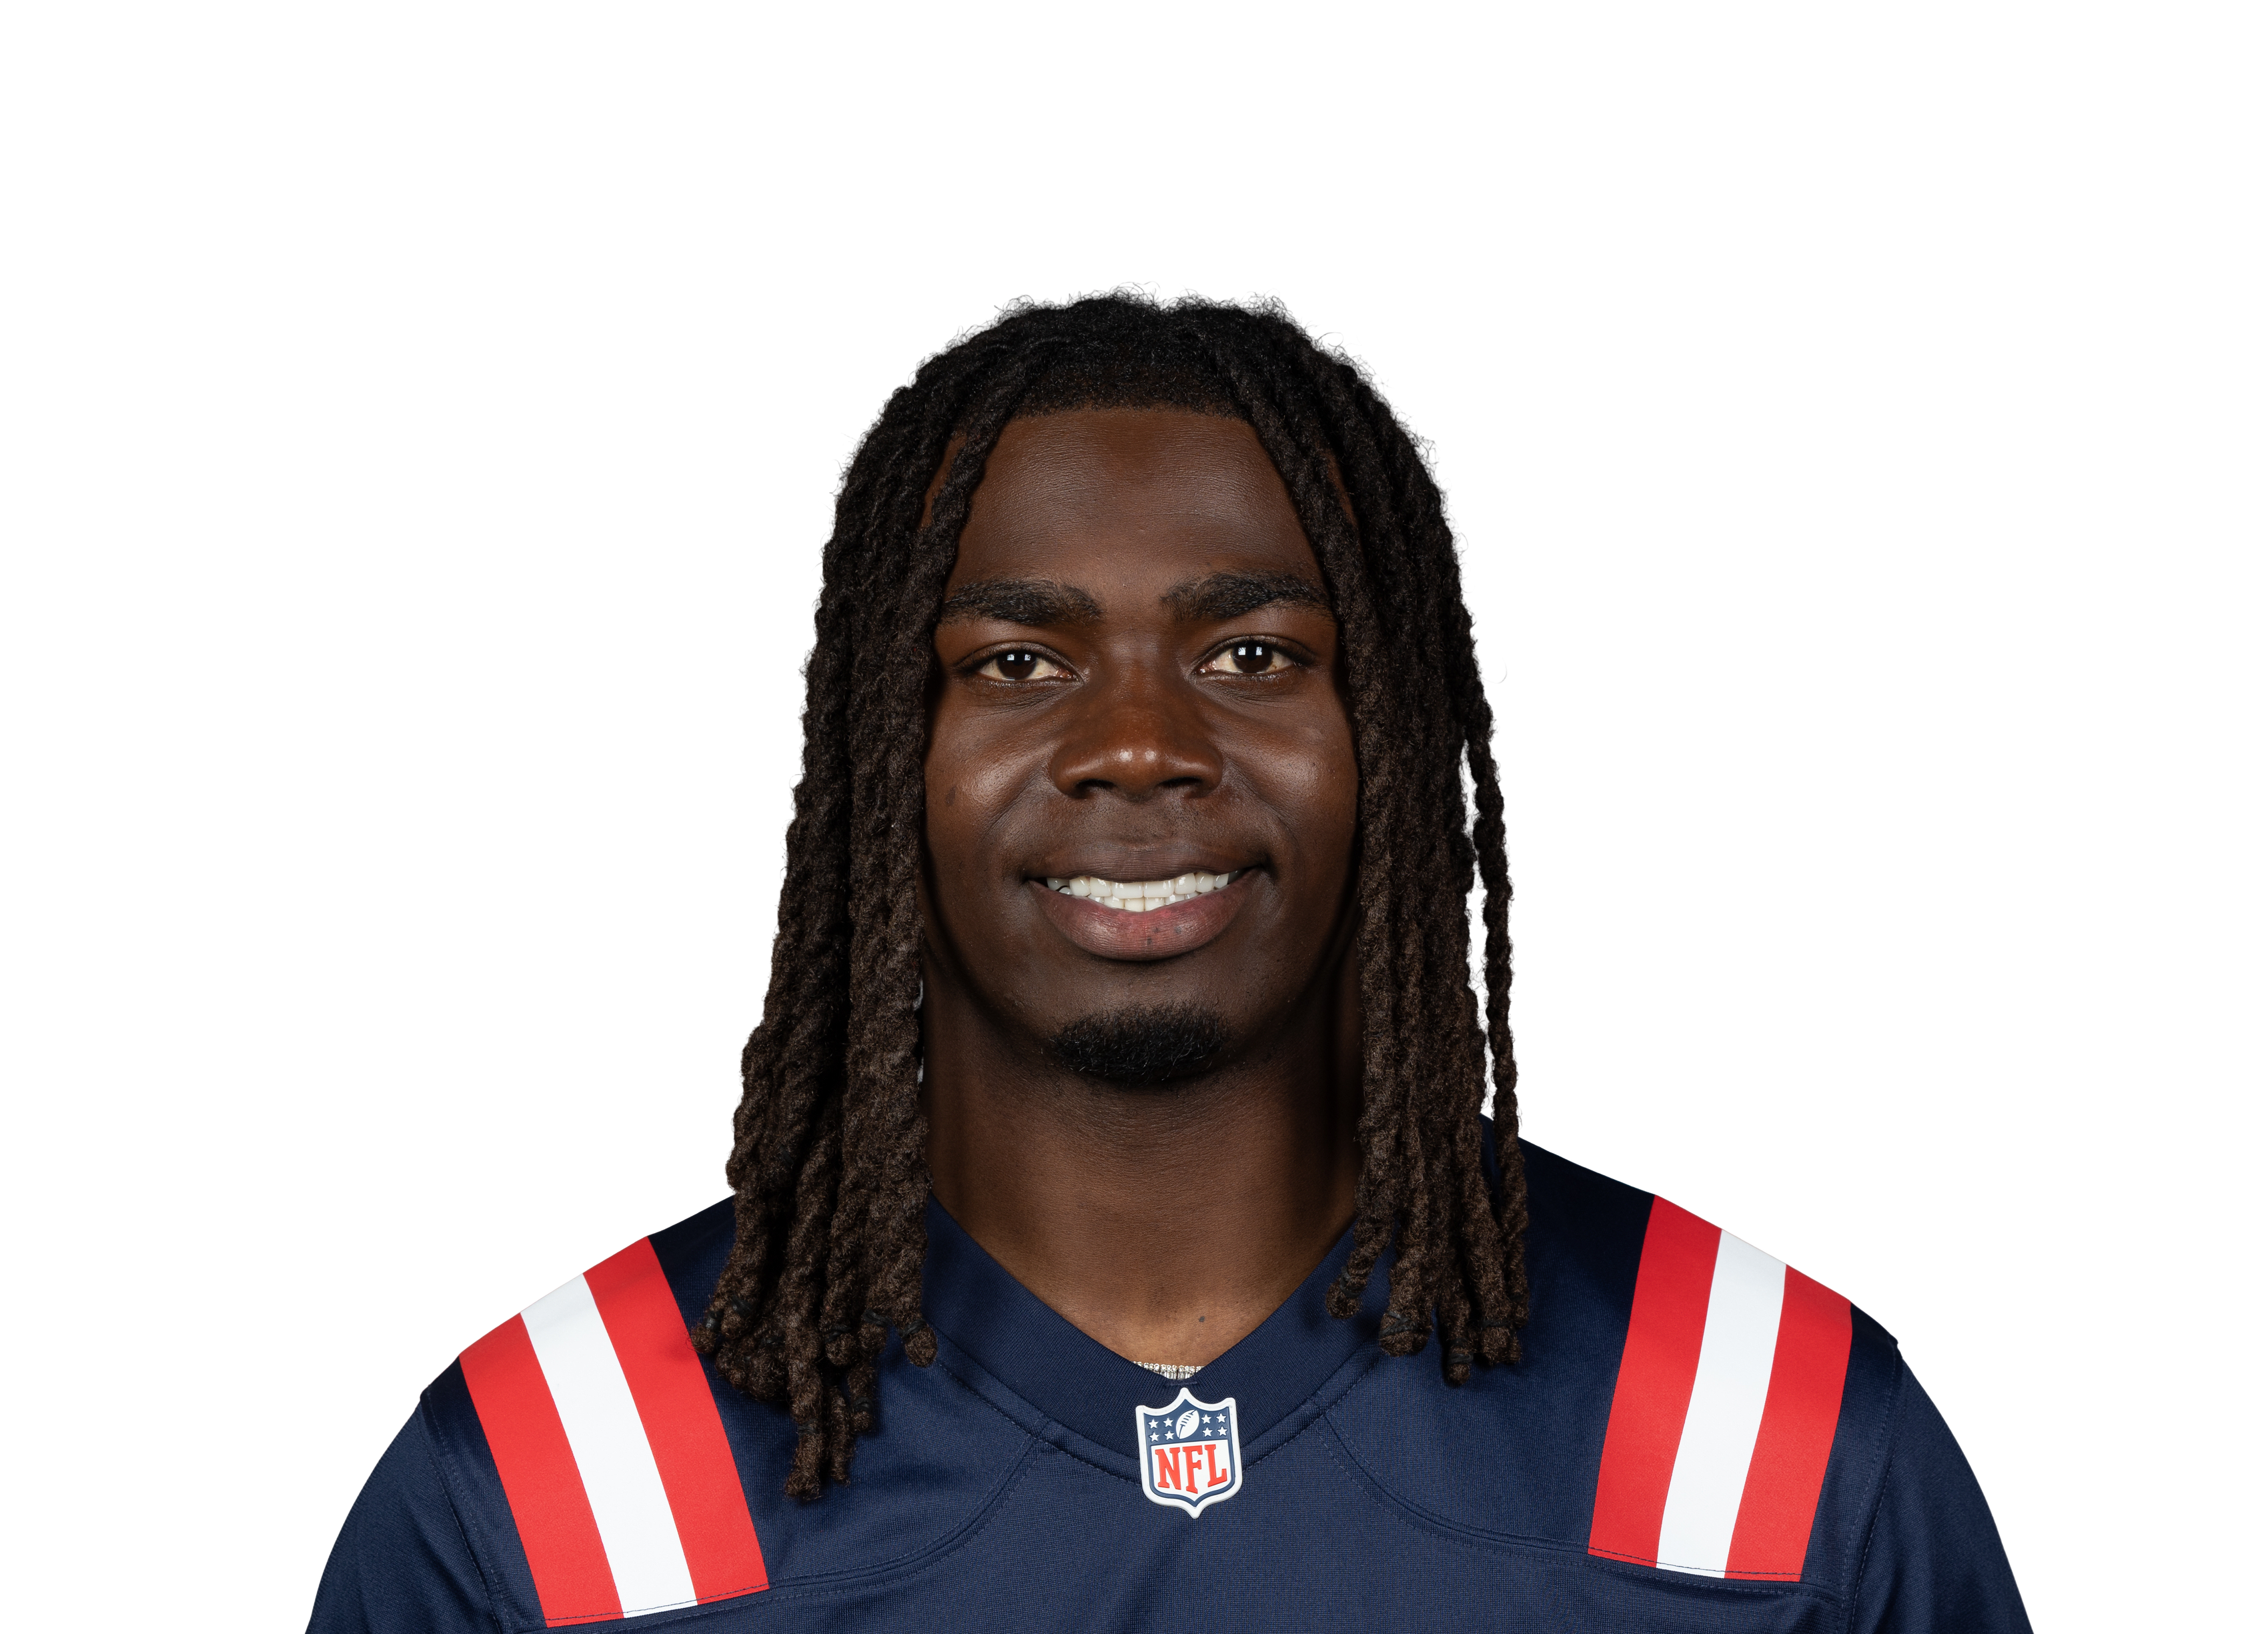 Rhamondre Stevenson@ NE • Wk 5 | 17.5 | 13 | 64 | 1 | 3 | 21 |
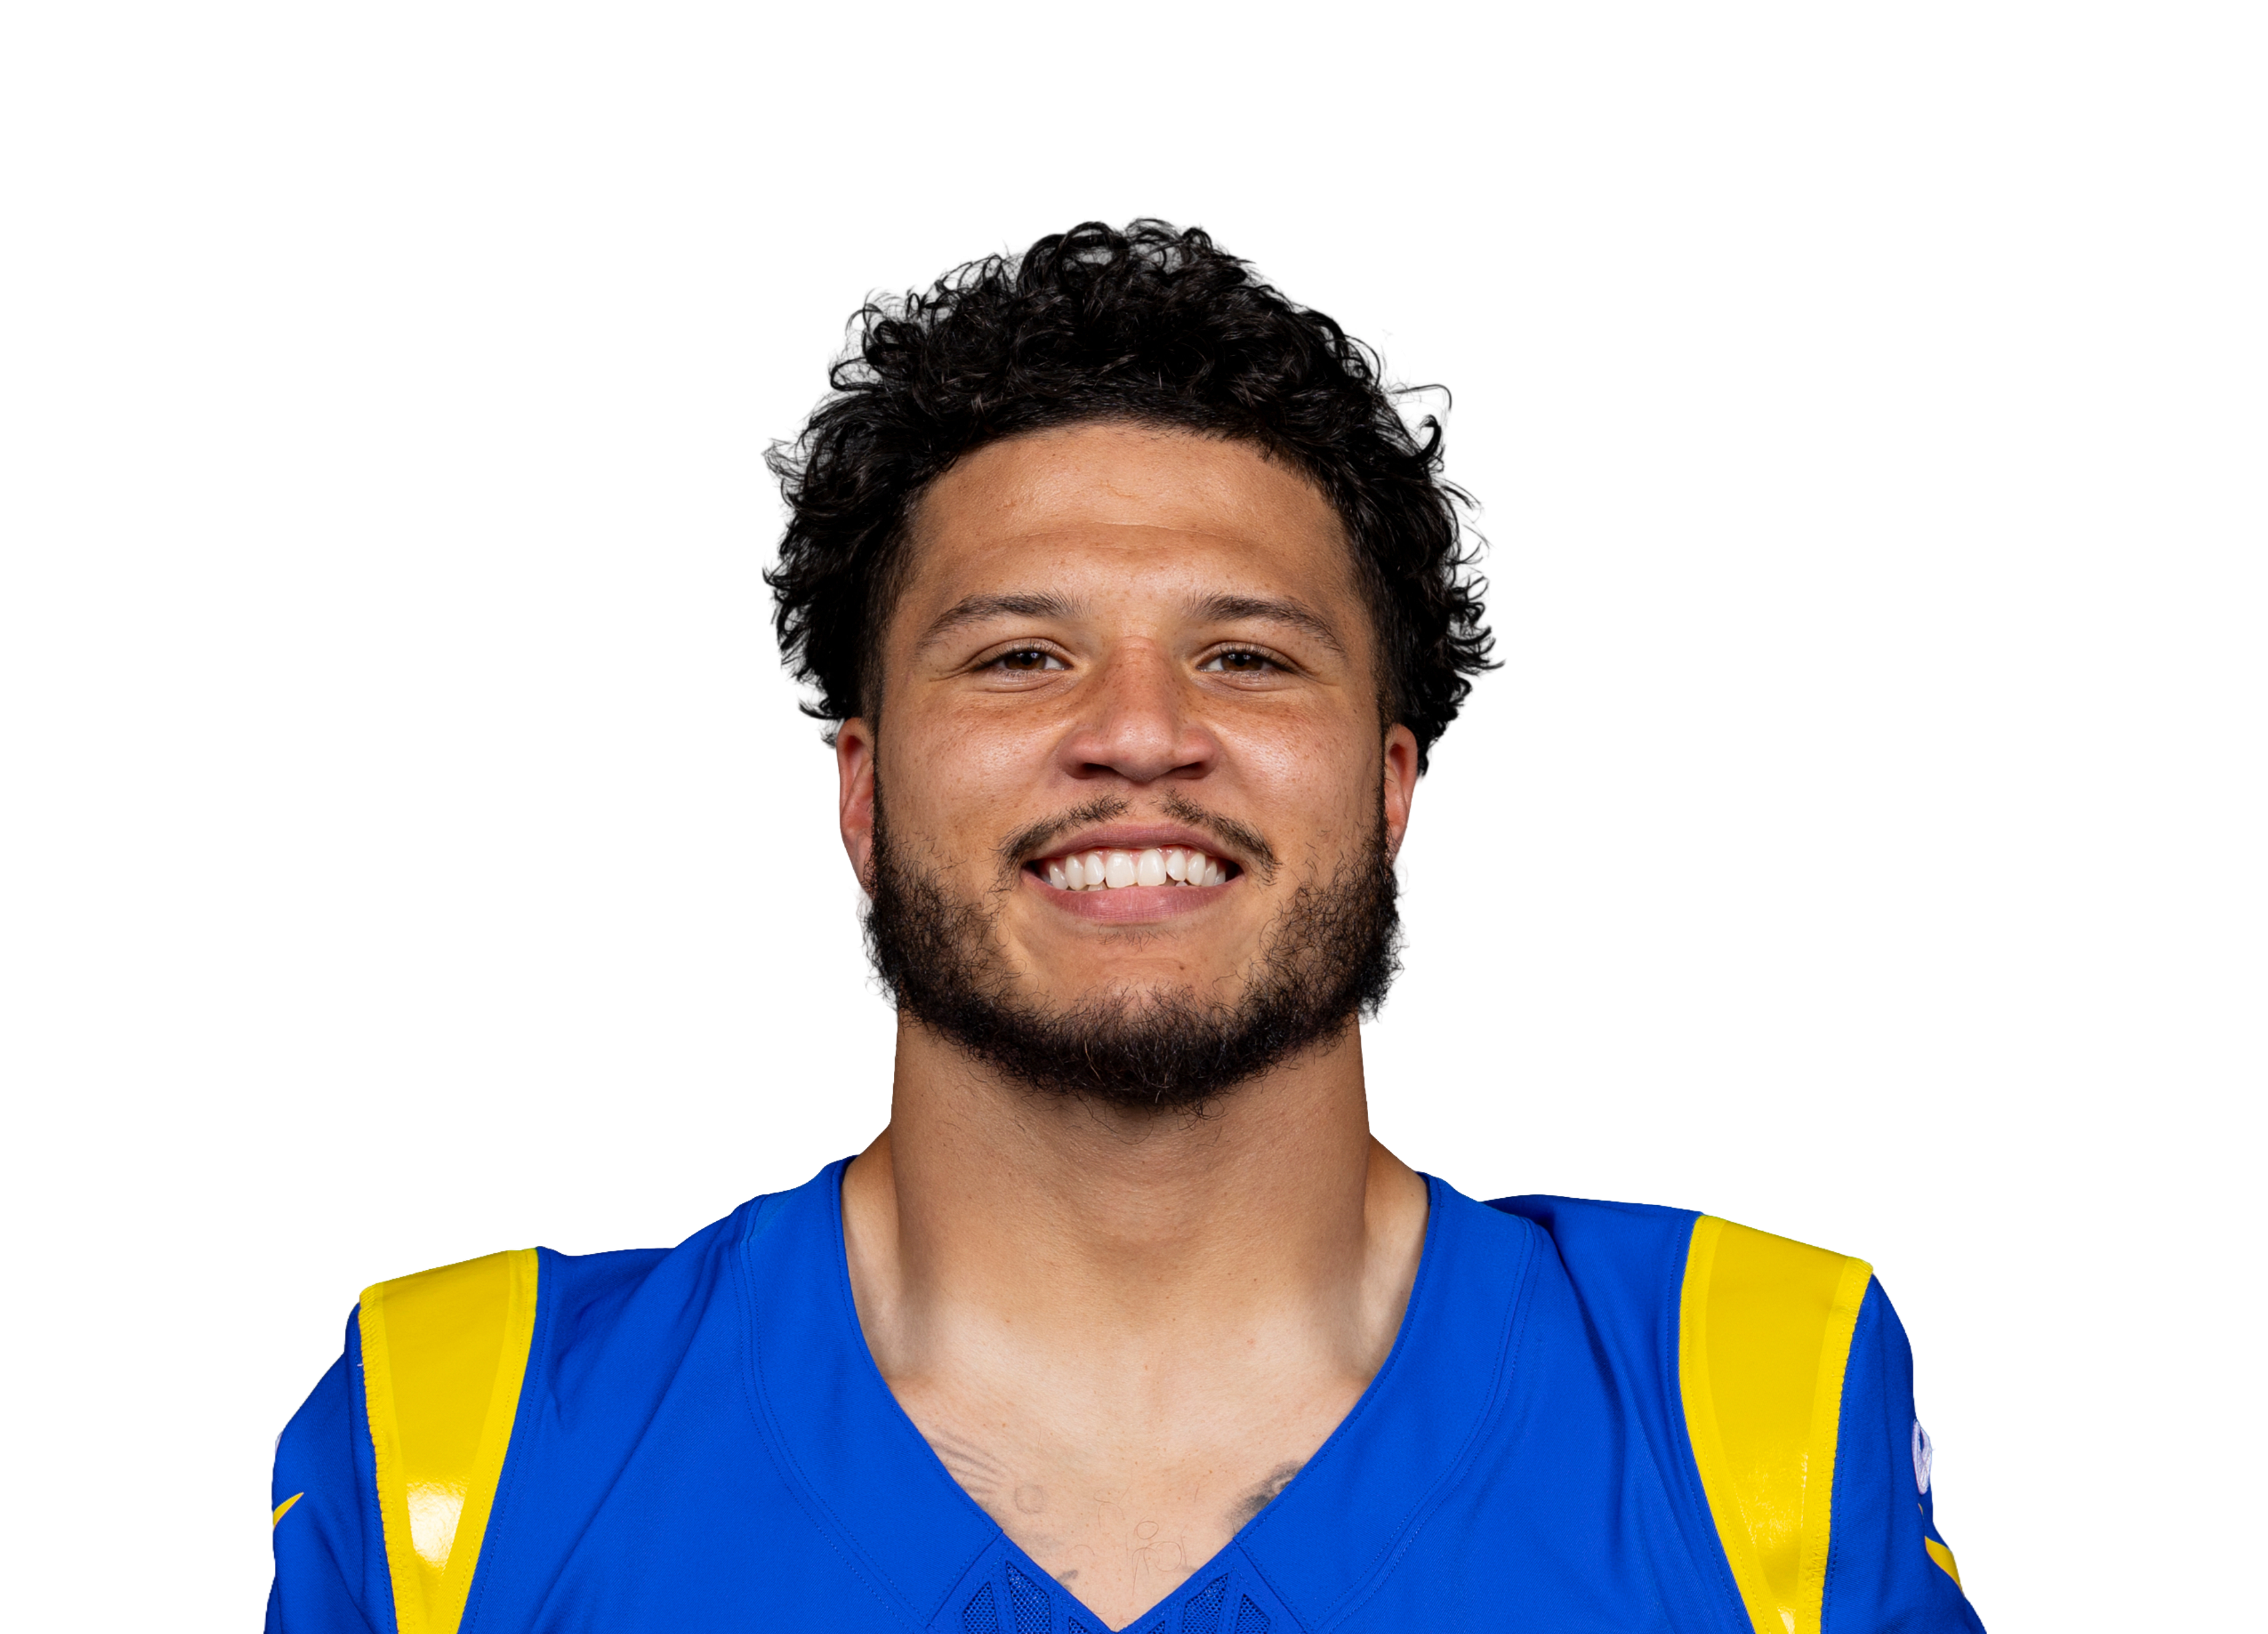 Blake Corumvs LA • Wk 7 | 17.1 | 17 | 93 | 1 | 1 | 8 |
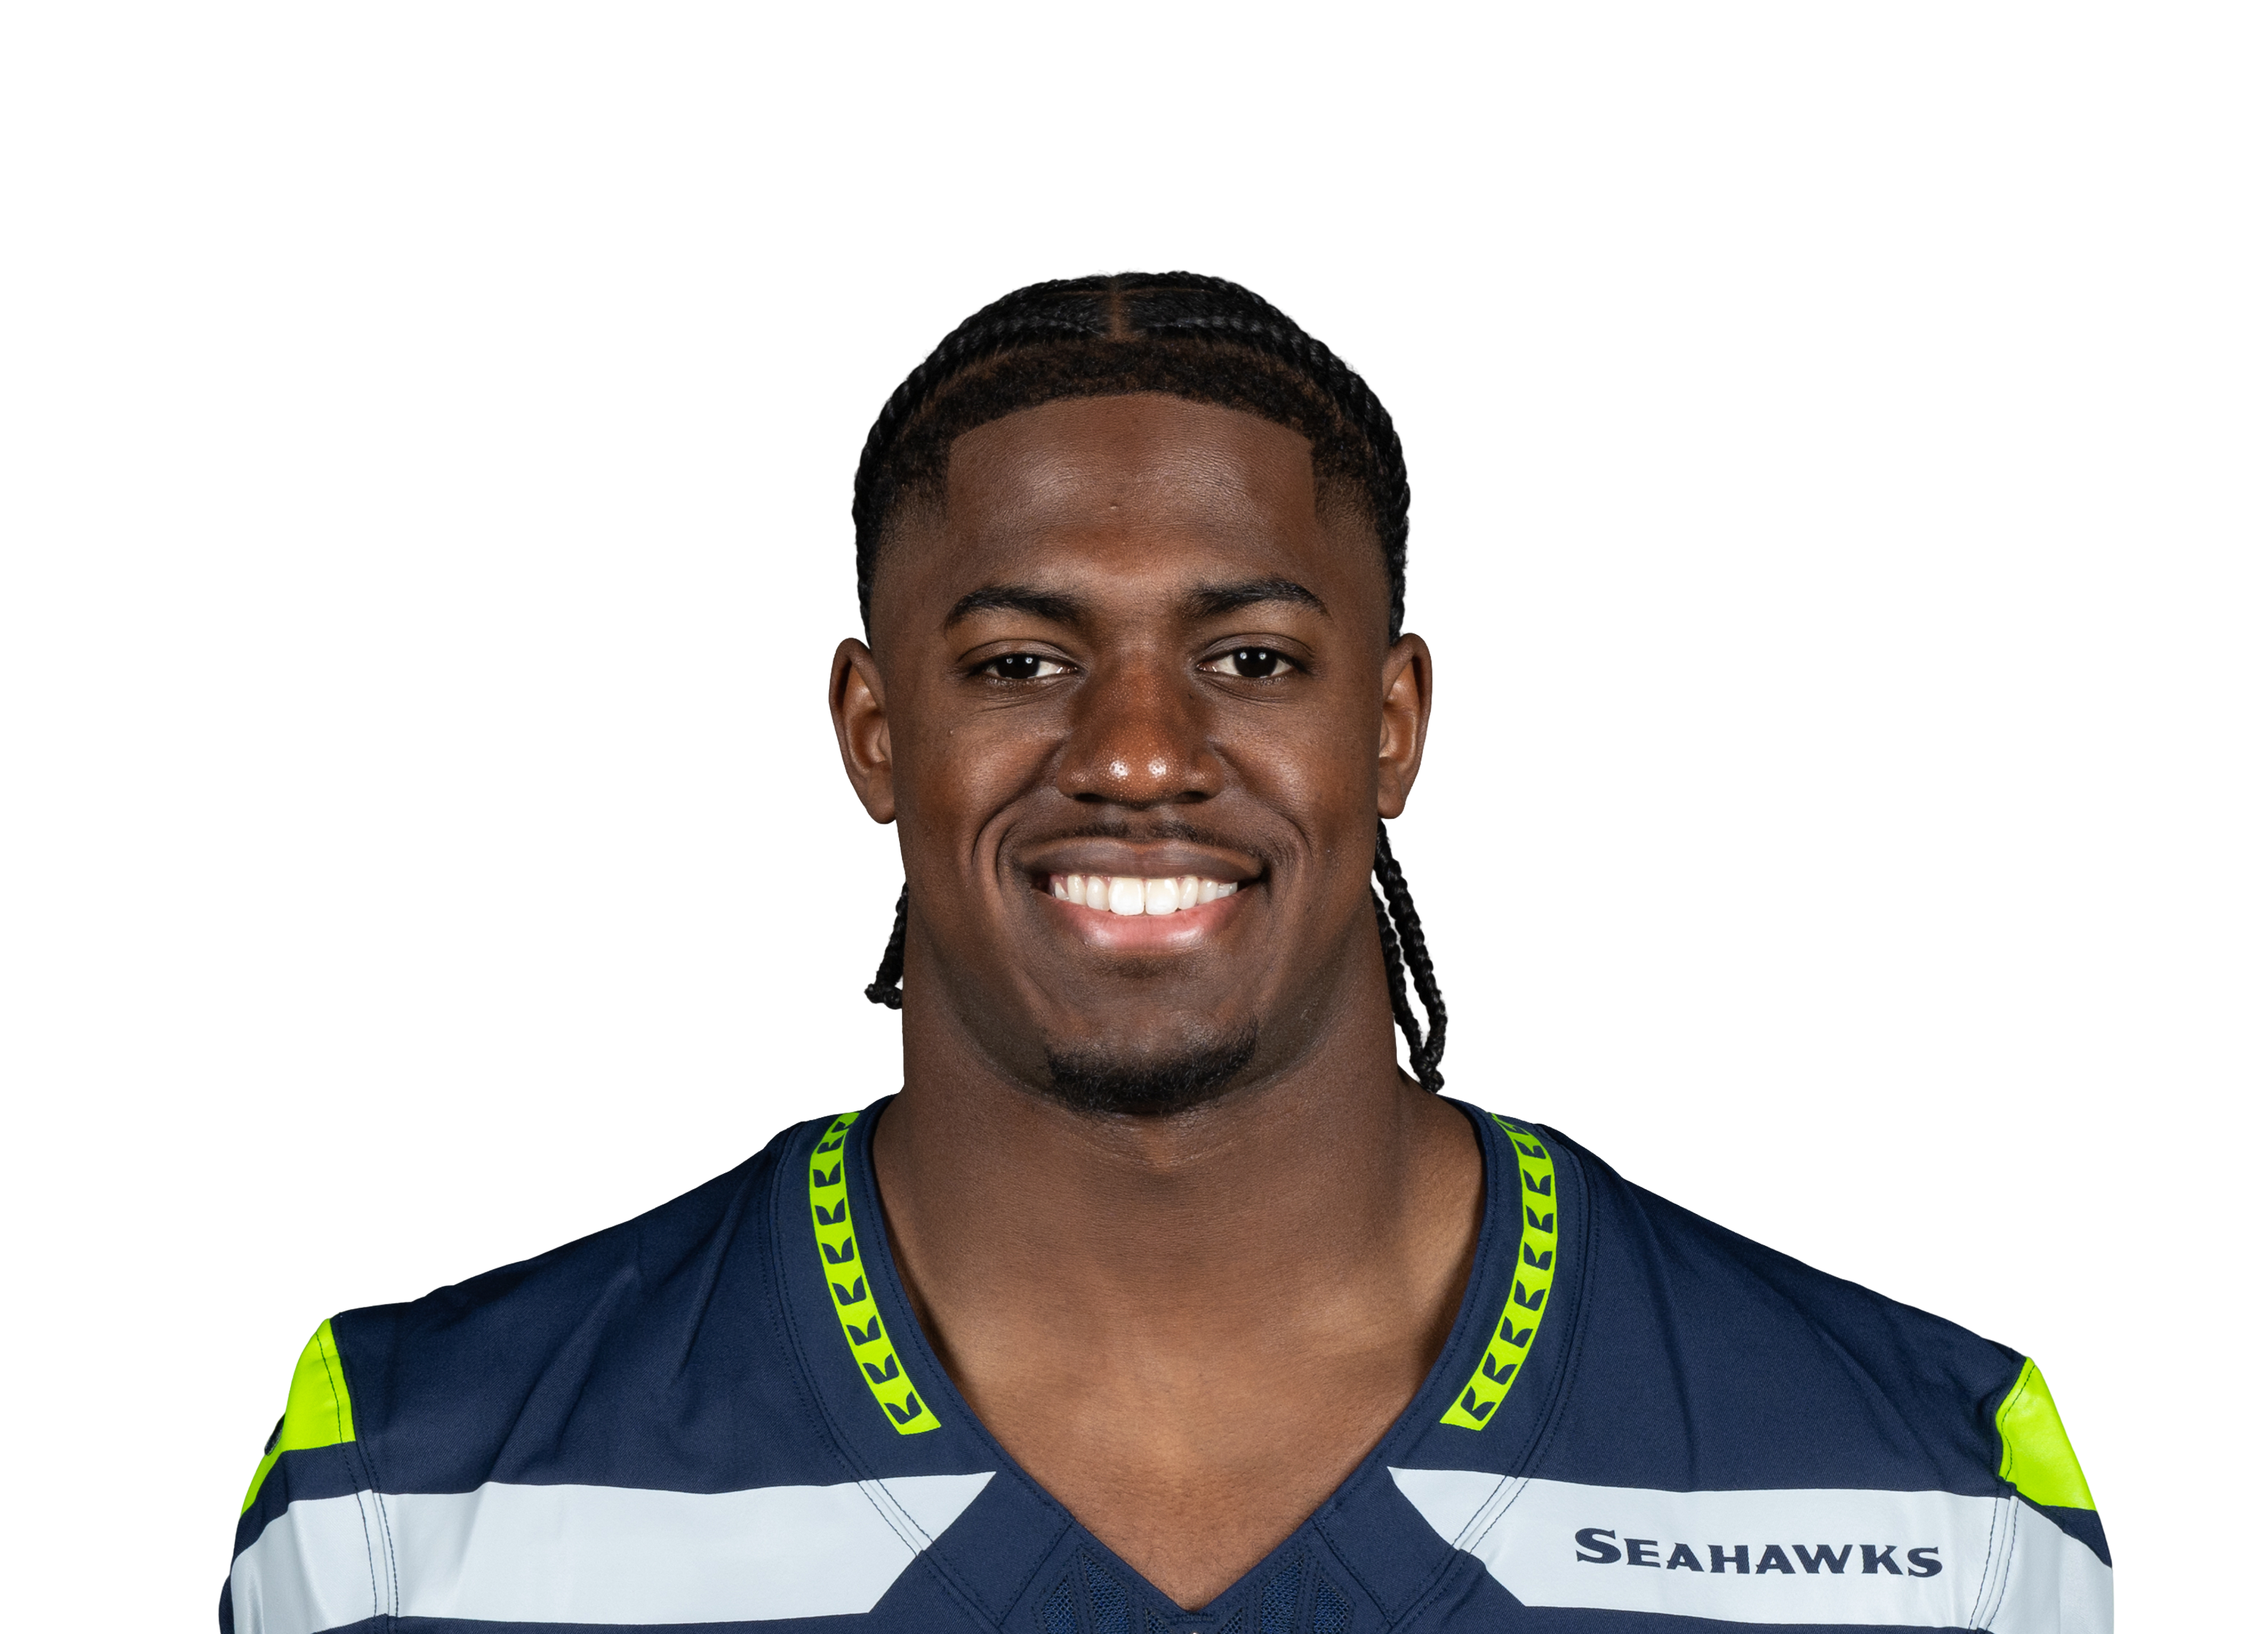 Jadarian Pricevs SEA • Wk 10 | 11.4 | 9 | 36 | 1 | 1 | 8 |
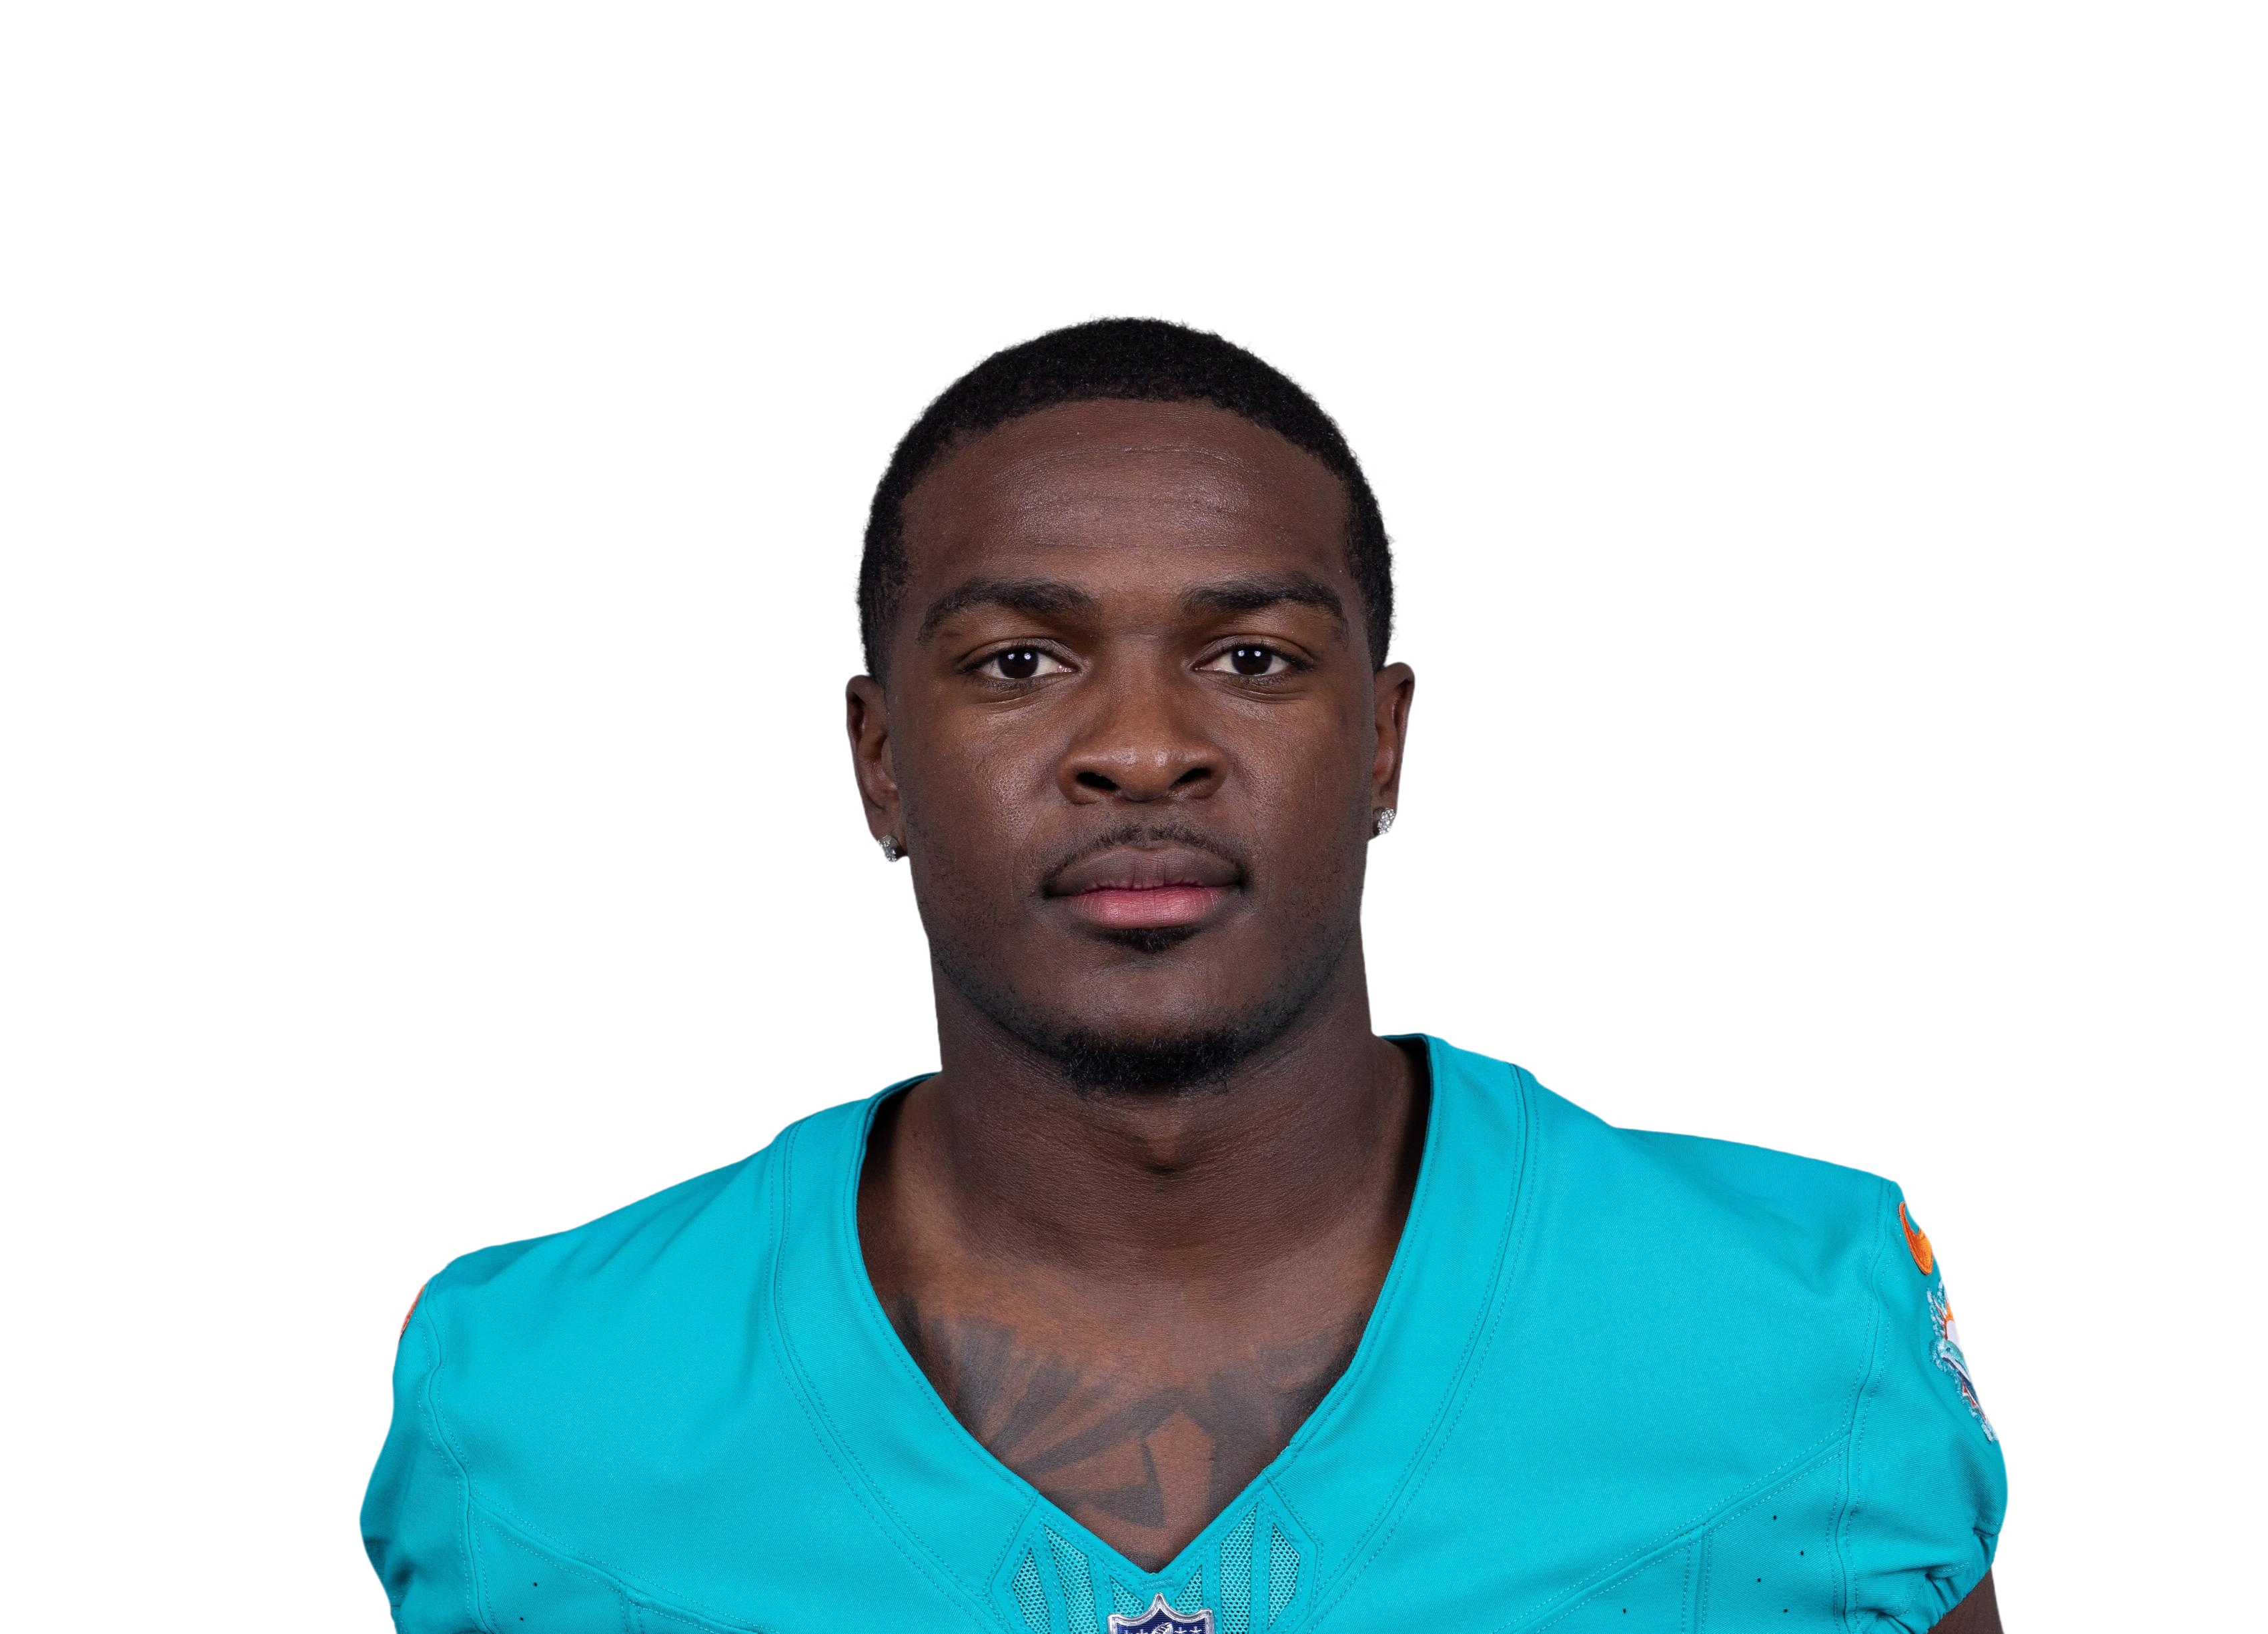 De'Von Achanevs MIA • Wk 1 | 10.6 | 11 | 36 | 0 | 4 | 30 |
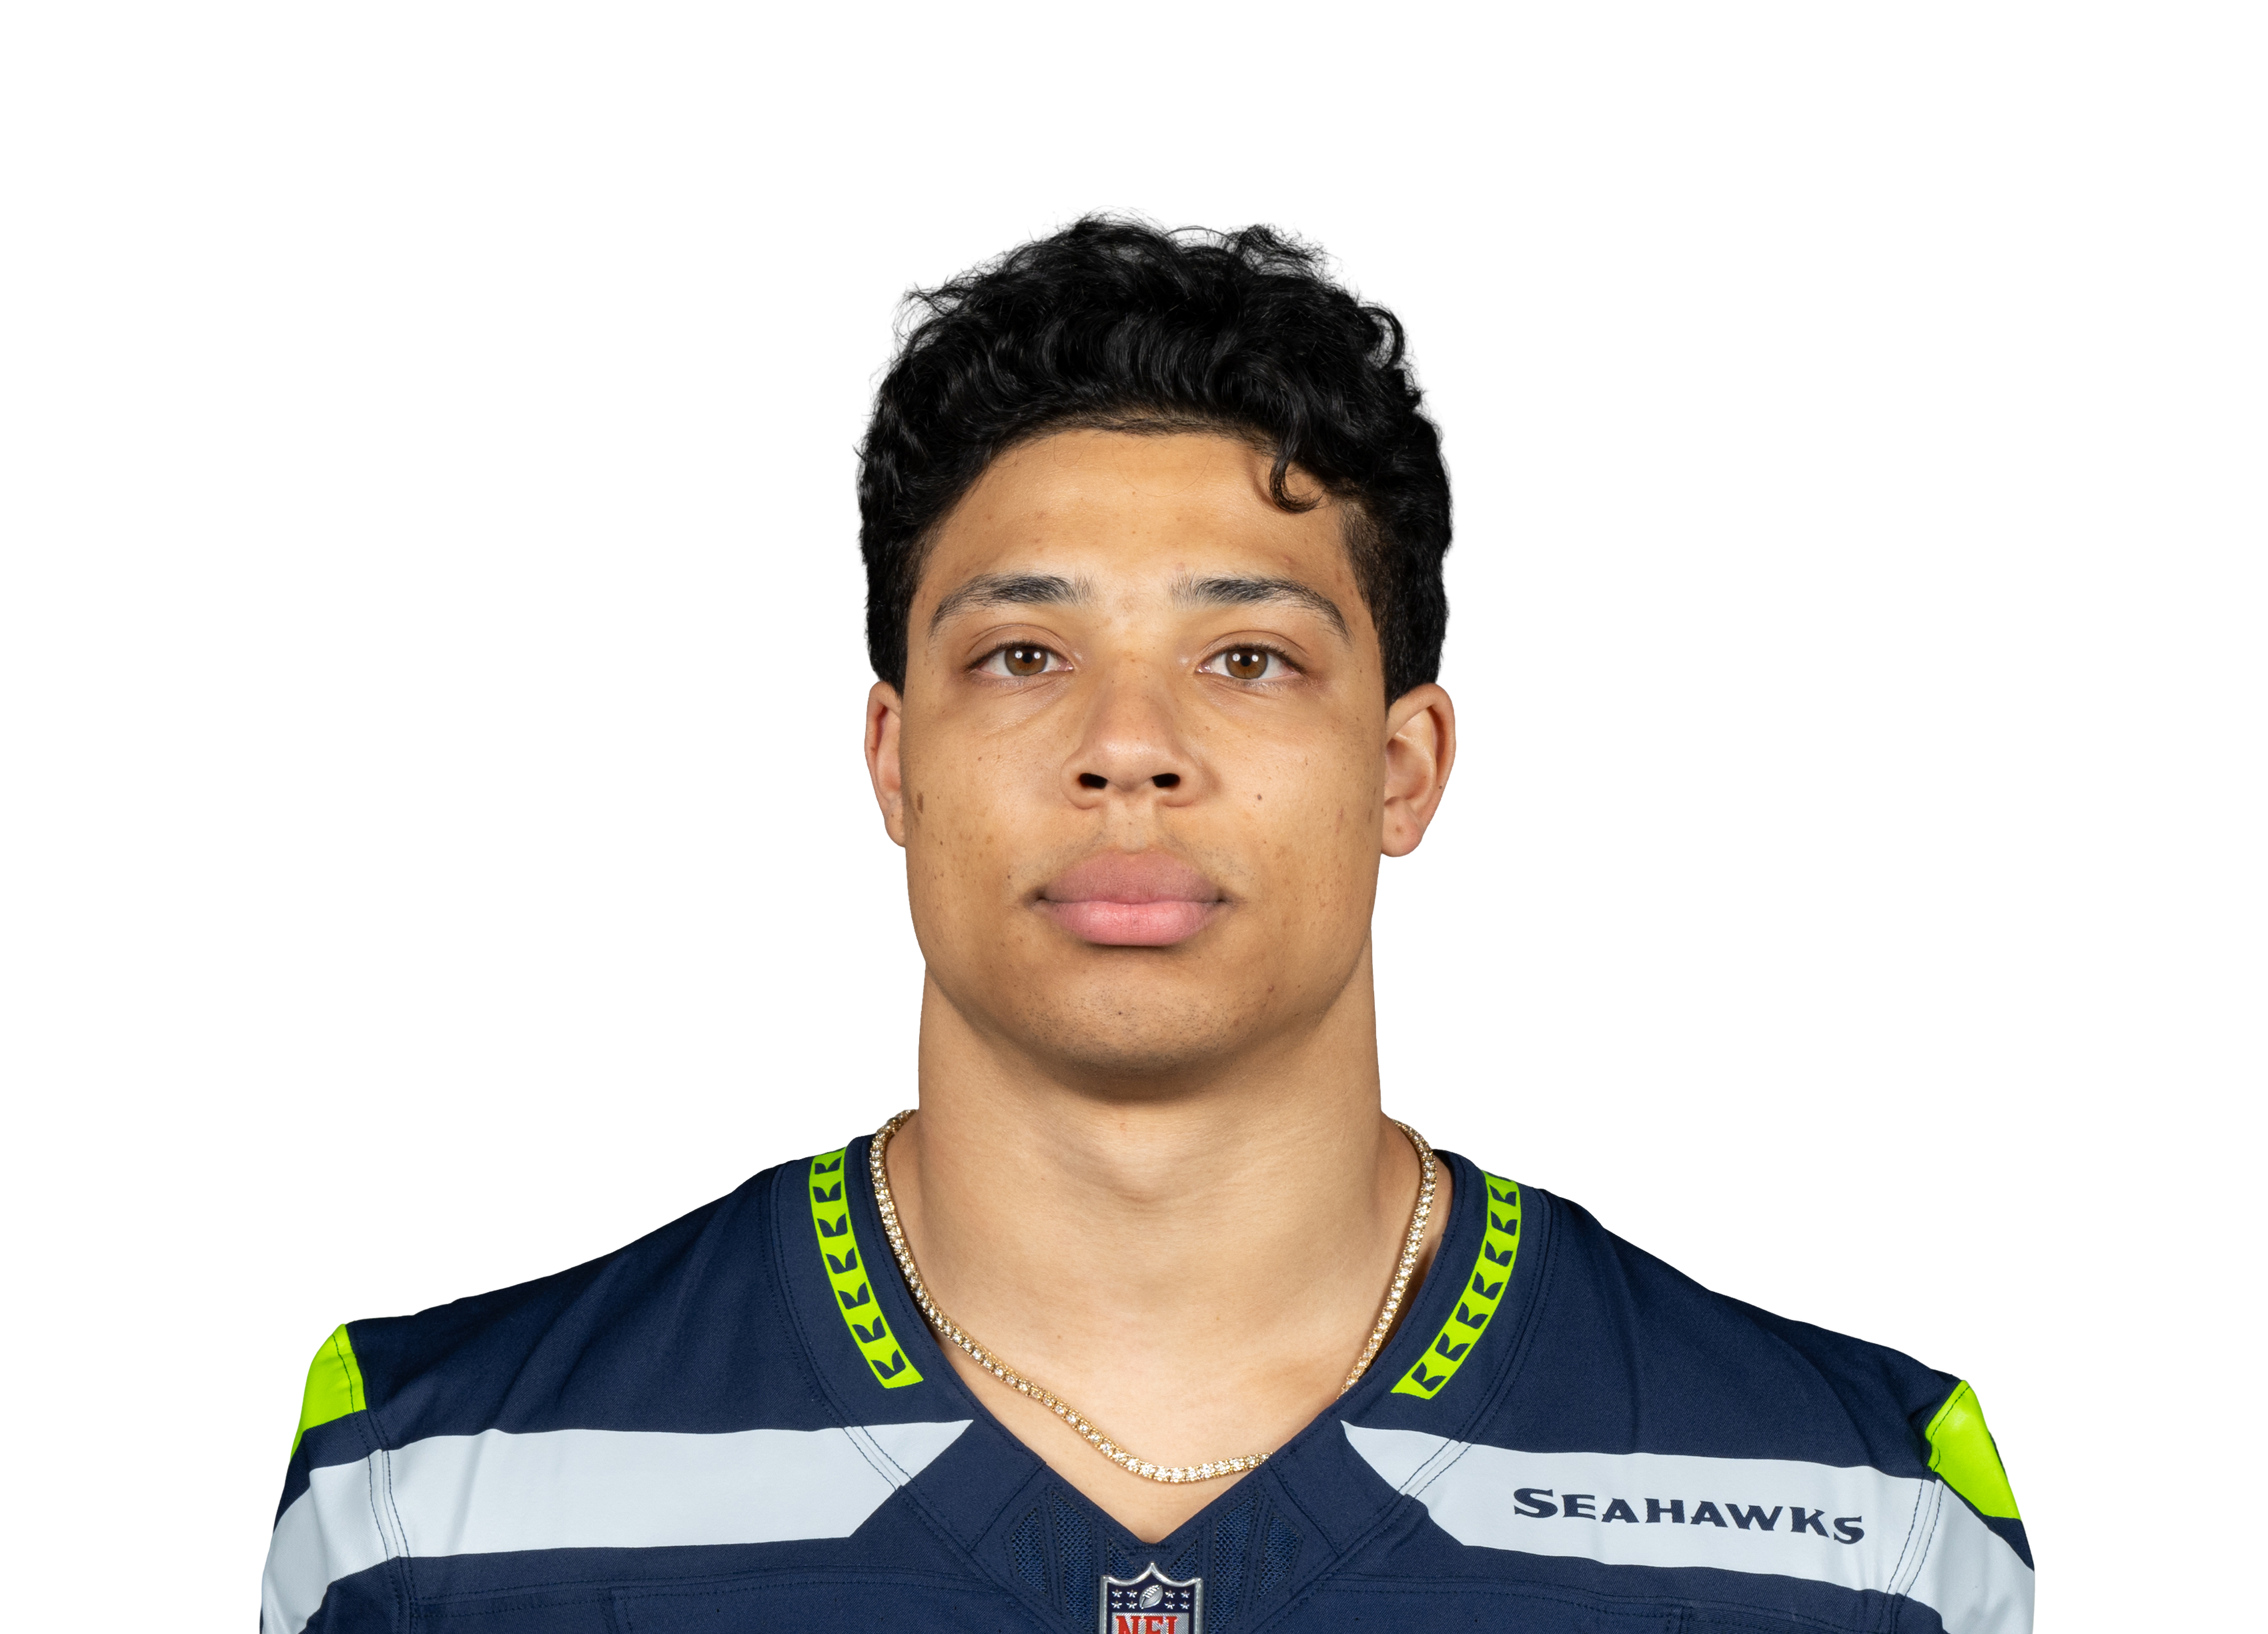 Zach Charbonnetvs SEA • Wk 10 | 9.4 | 20 | 94 | 0 | 0 | 0 |
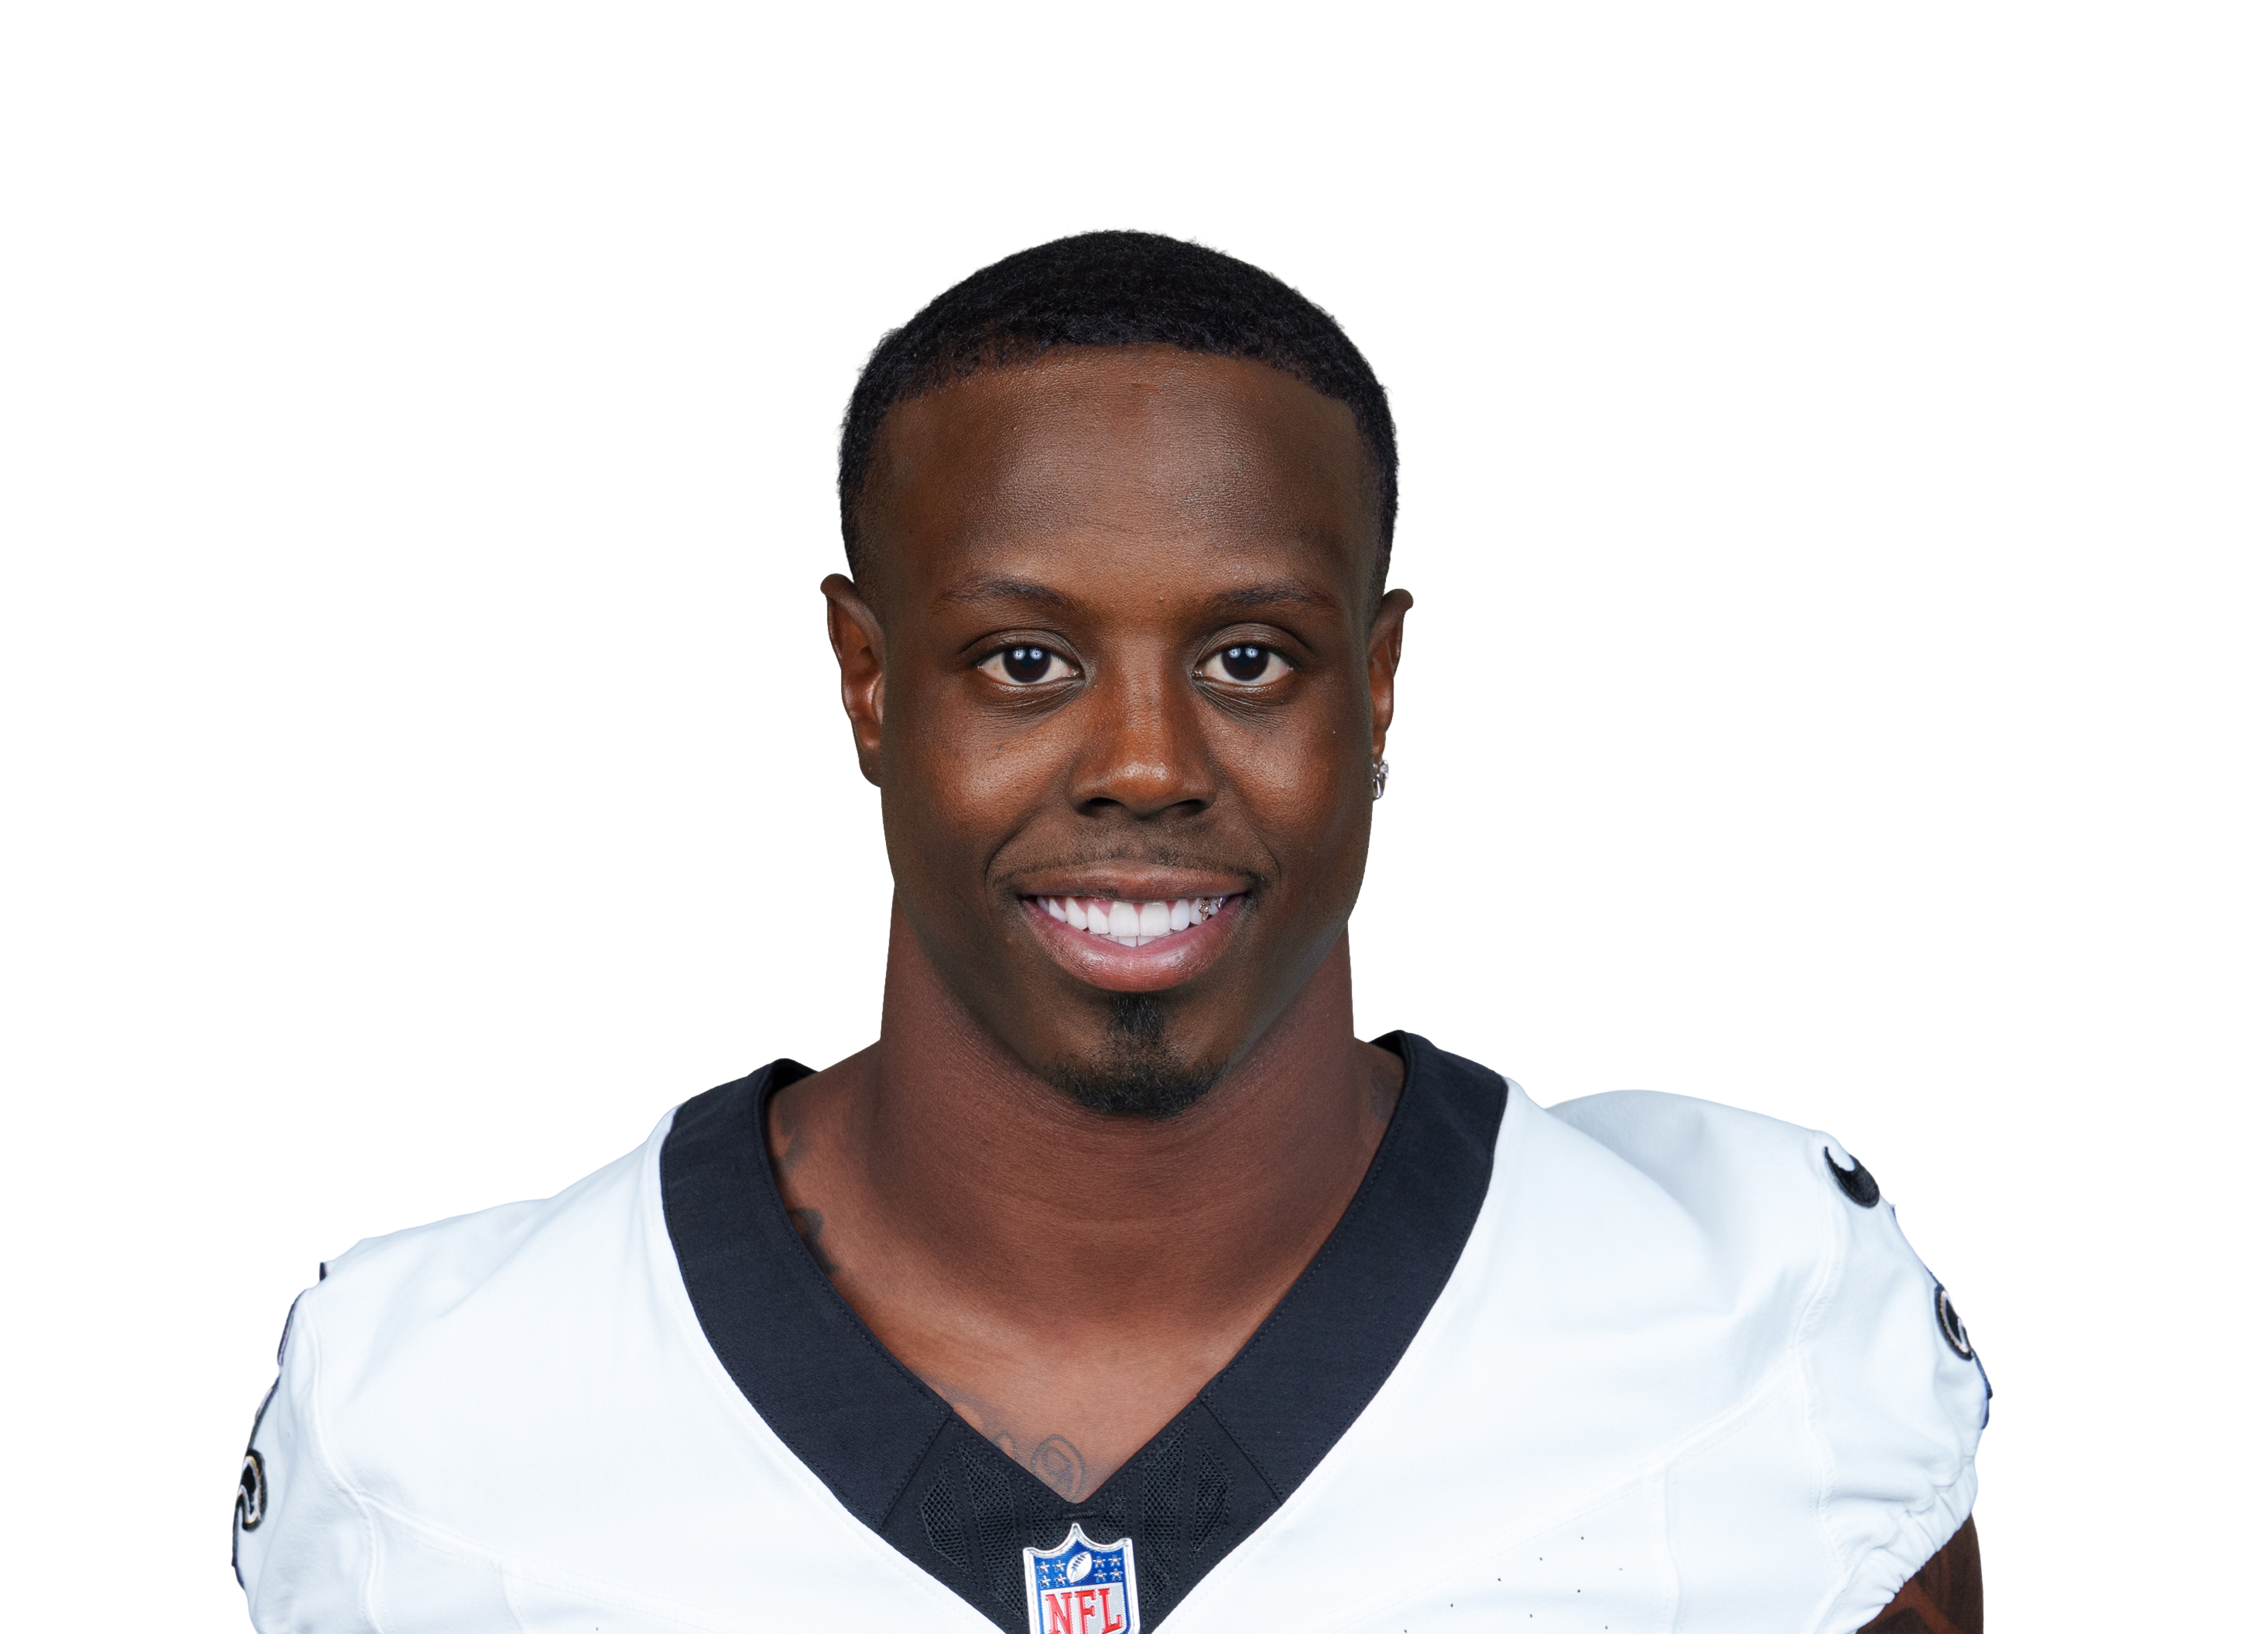 Travis Etienne@ NO • Wk 3 | 9.0 | 13 | 57 | 0 | 2 | 13 |
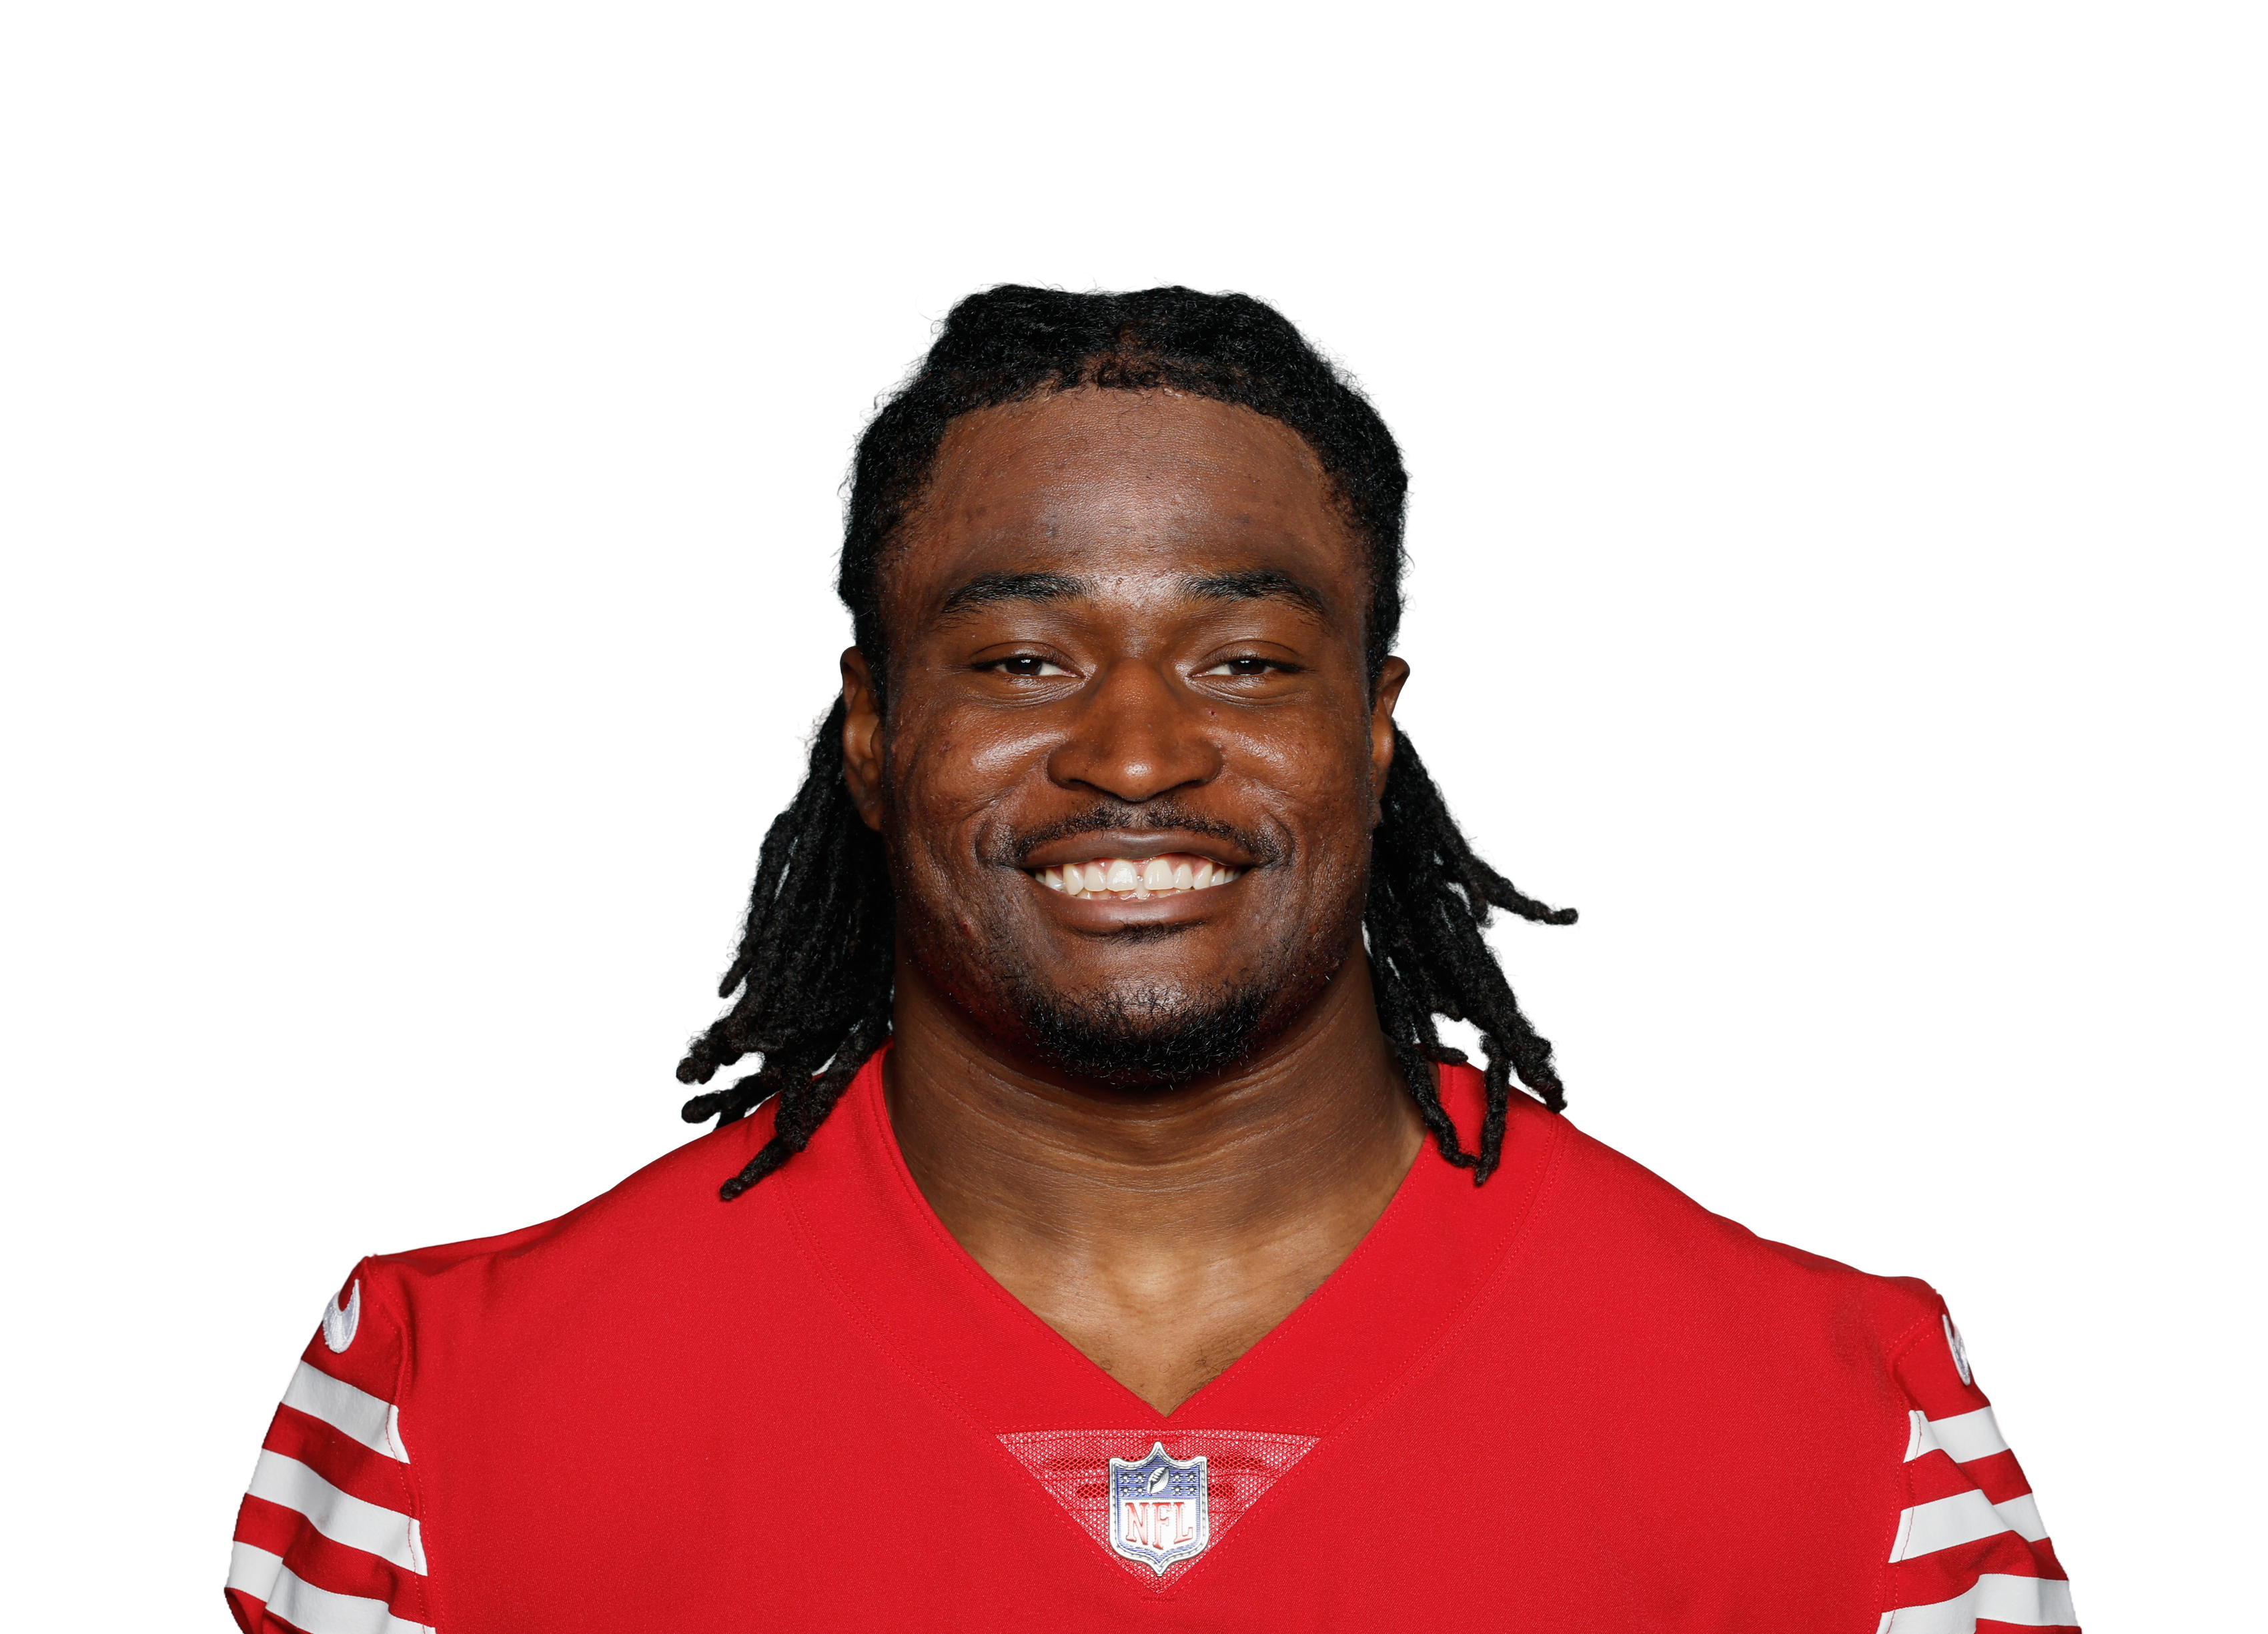 Kaelon Black@ SF • Wk 9 | 7.0 | 11 | 70 | 0 | 0 | 0 |
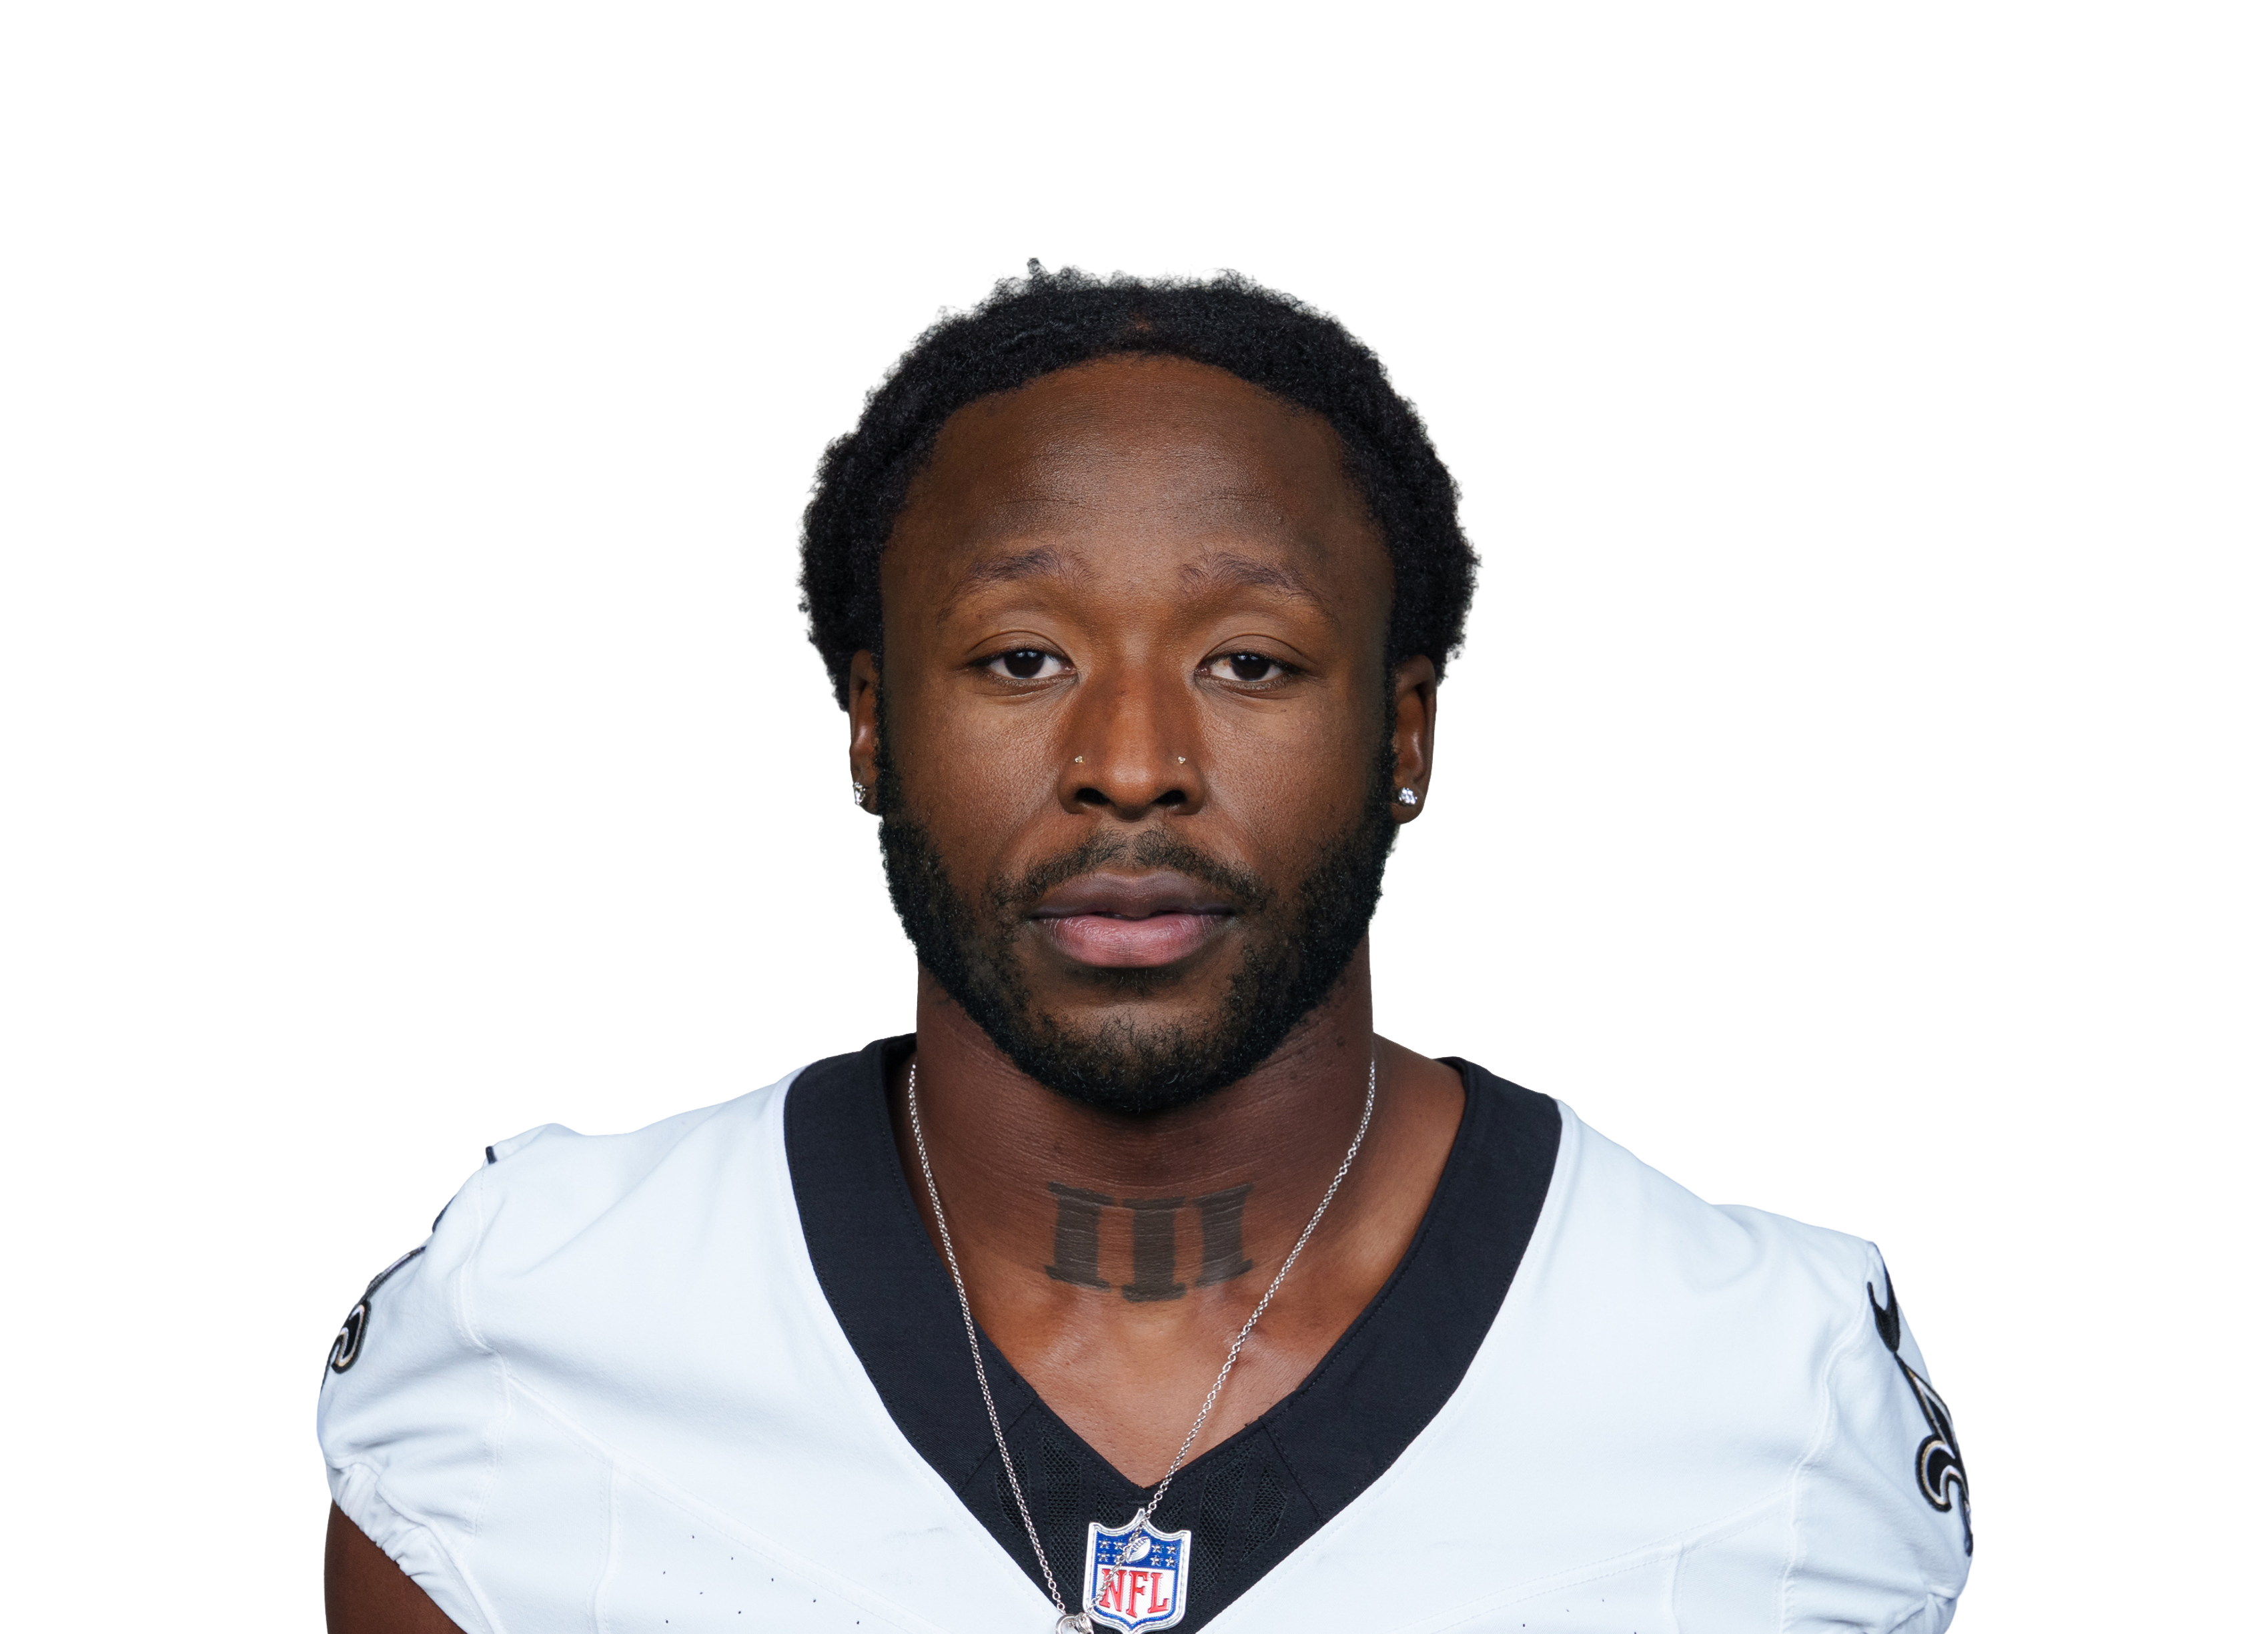 Alvin Kamara@ NO • Wk 3 | 5.1 | 9 | 36 | 0 | 1 | 5 |
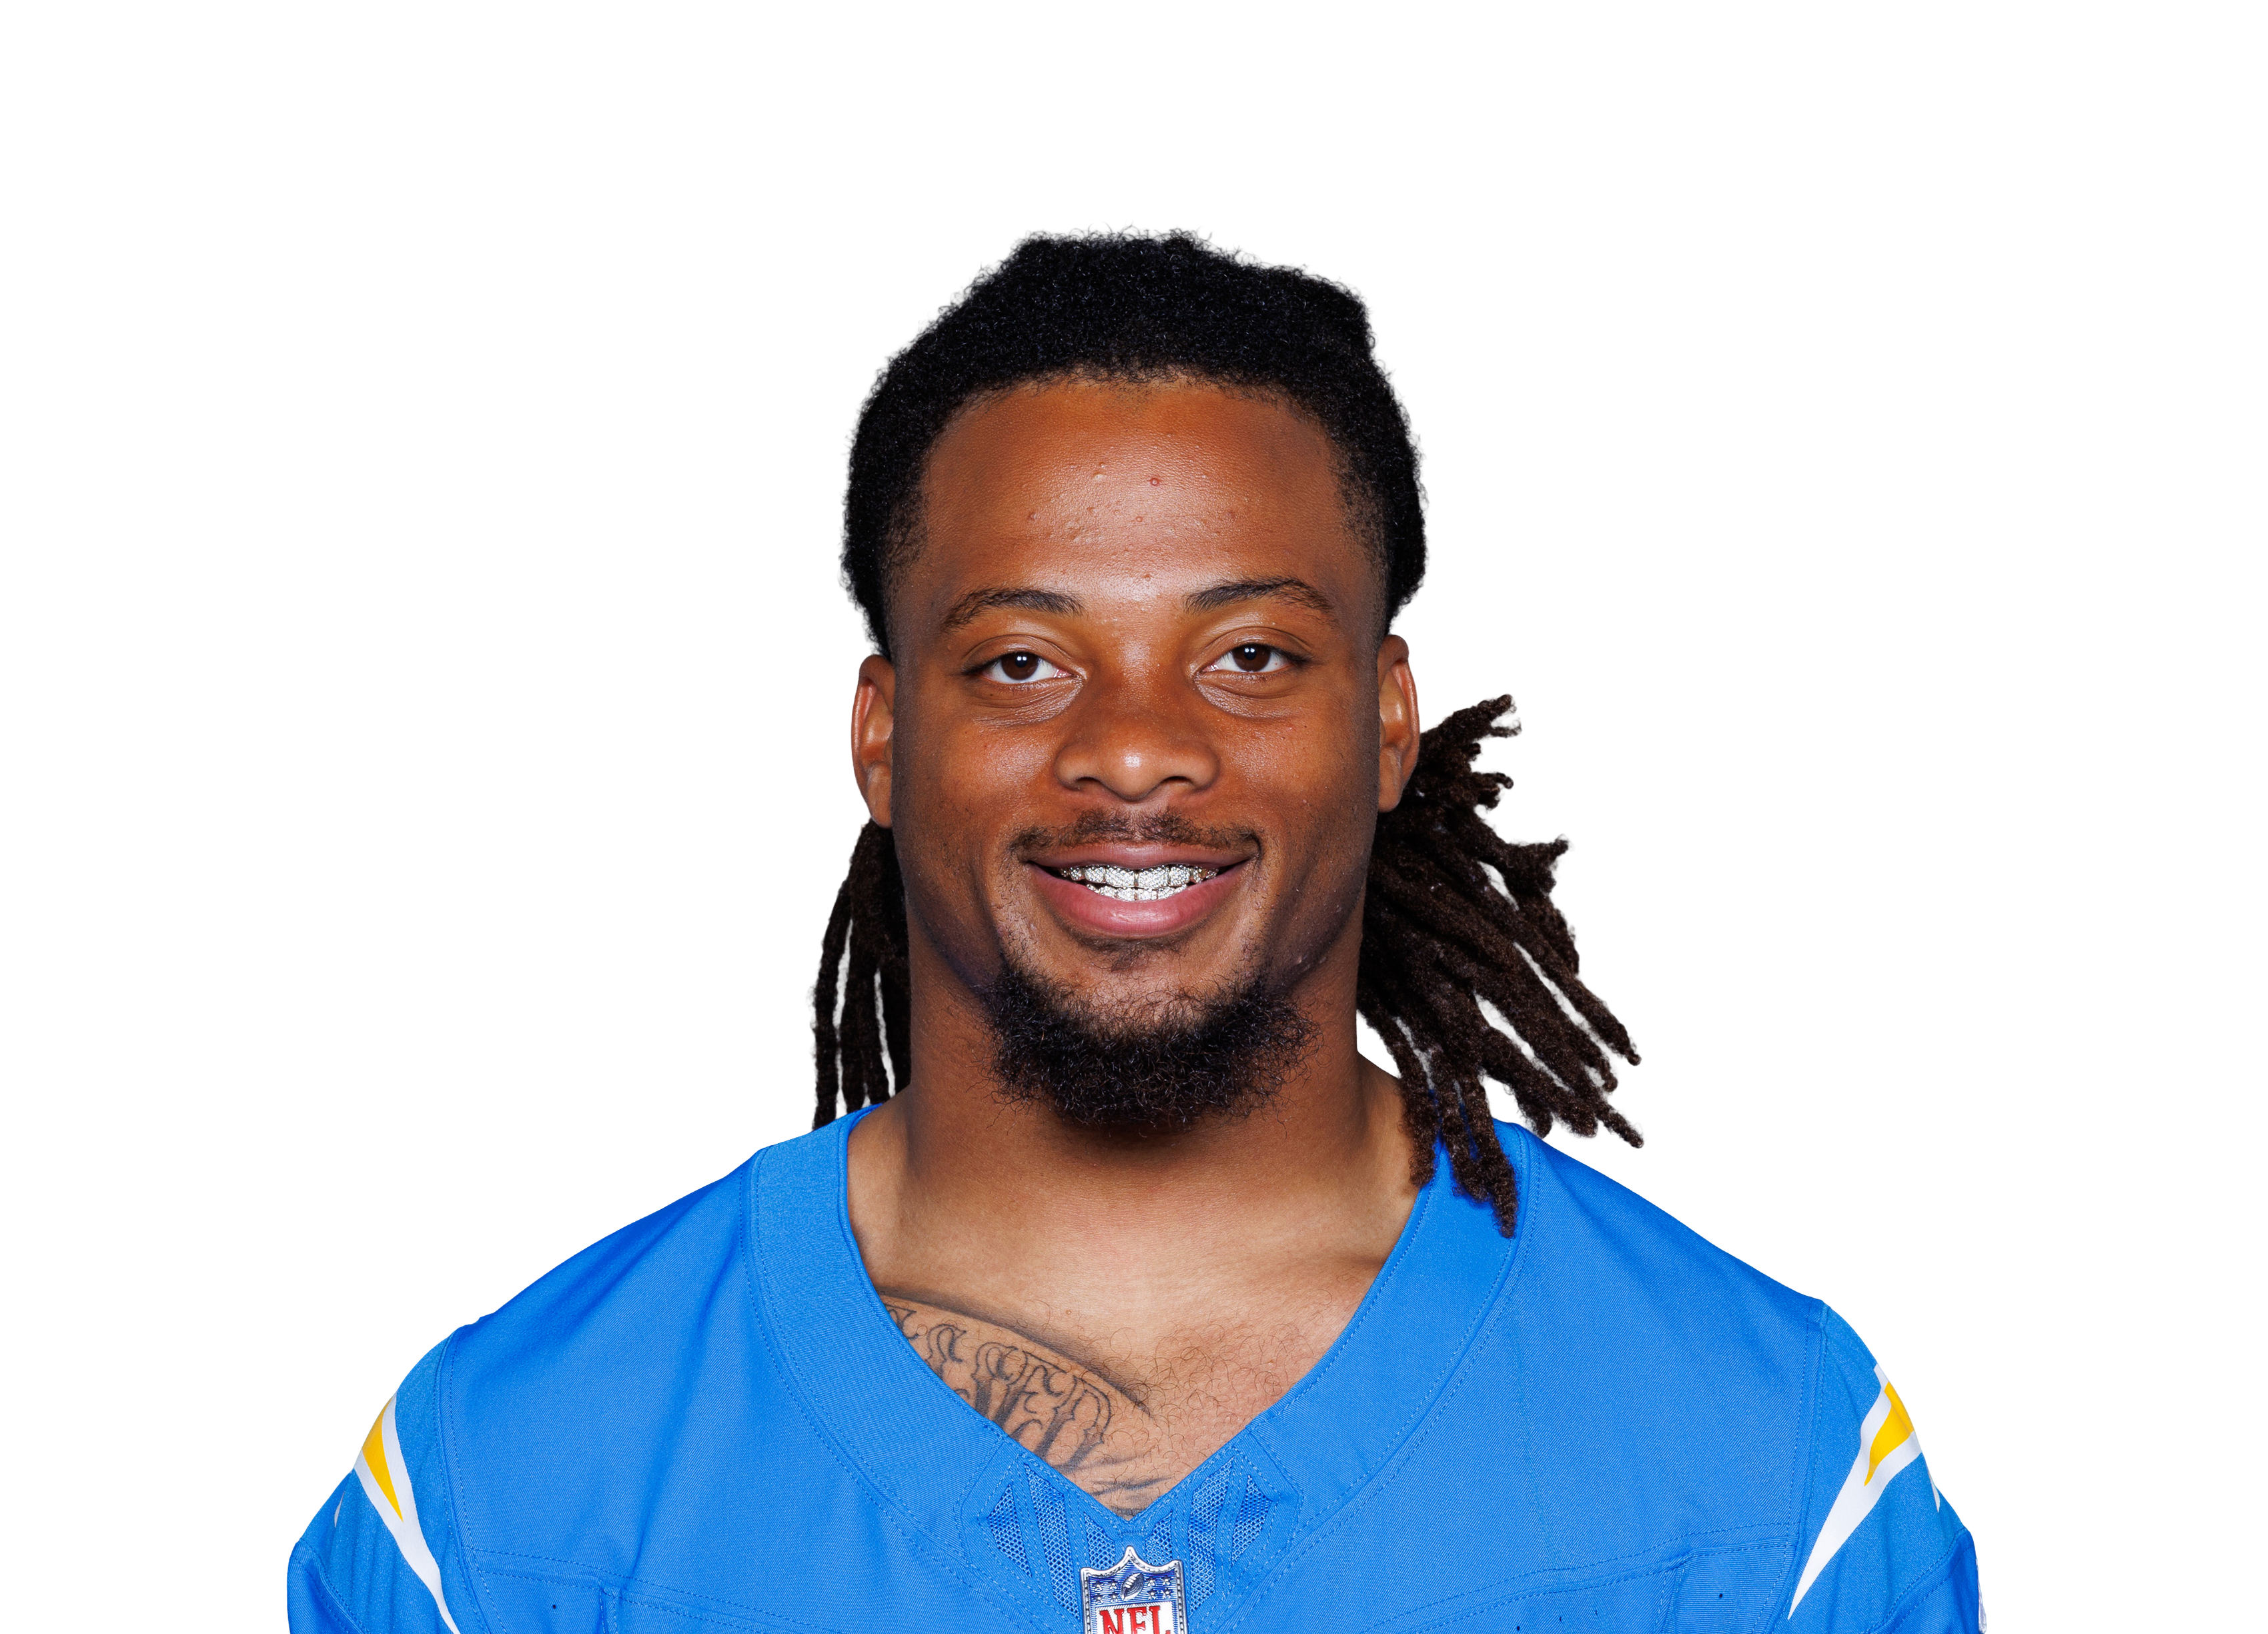 Keaton Mitchell@ LAC • Wk 2 | 4.9 | 5 | 24 | 0 | 1 | 15 |
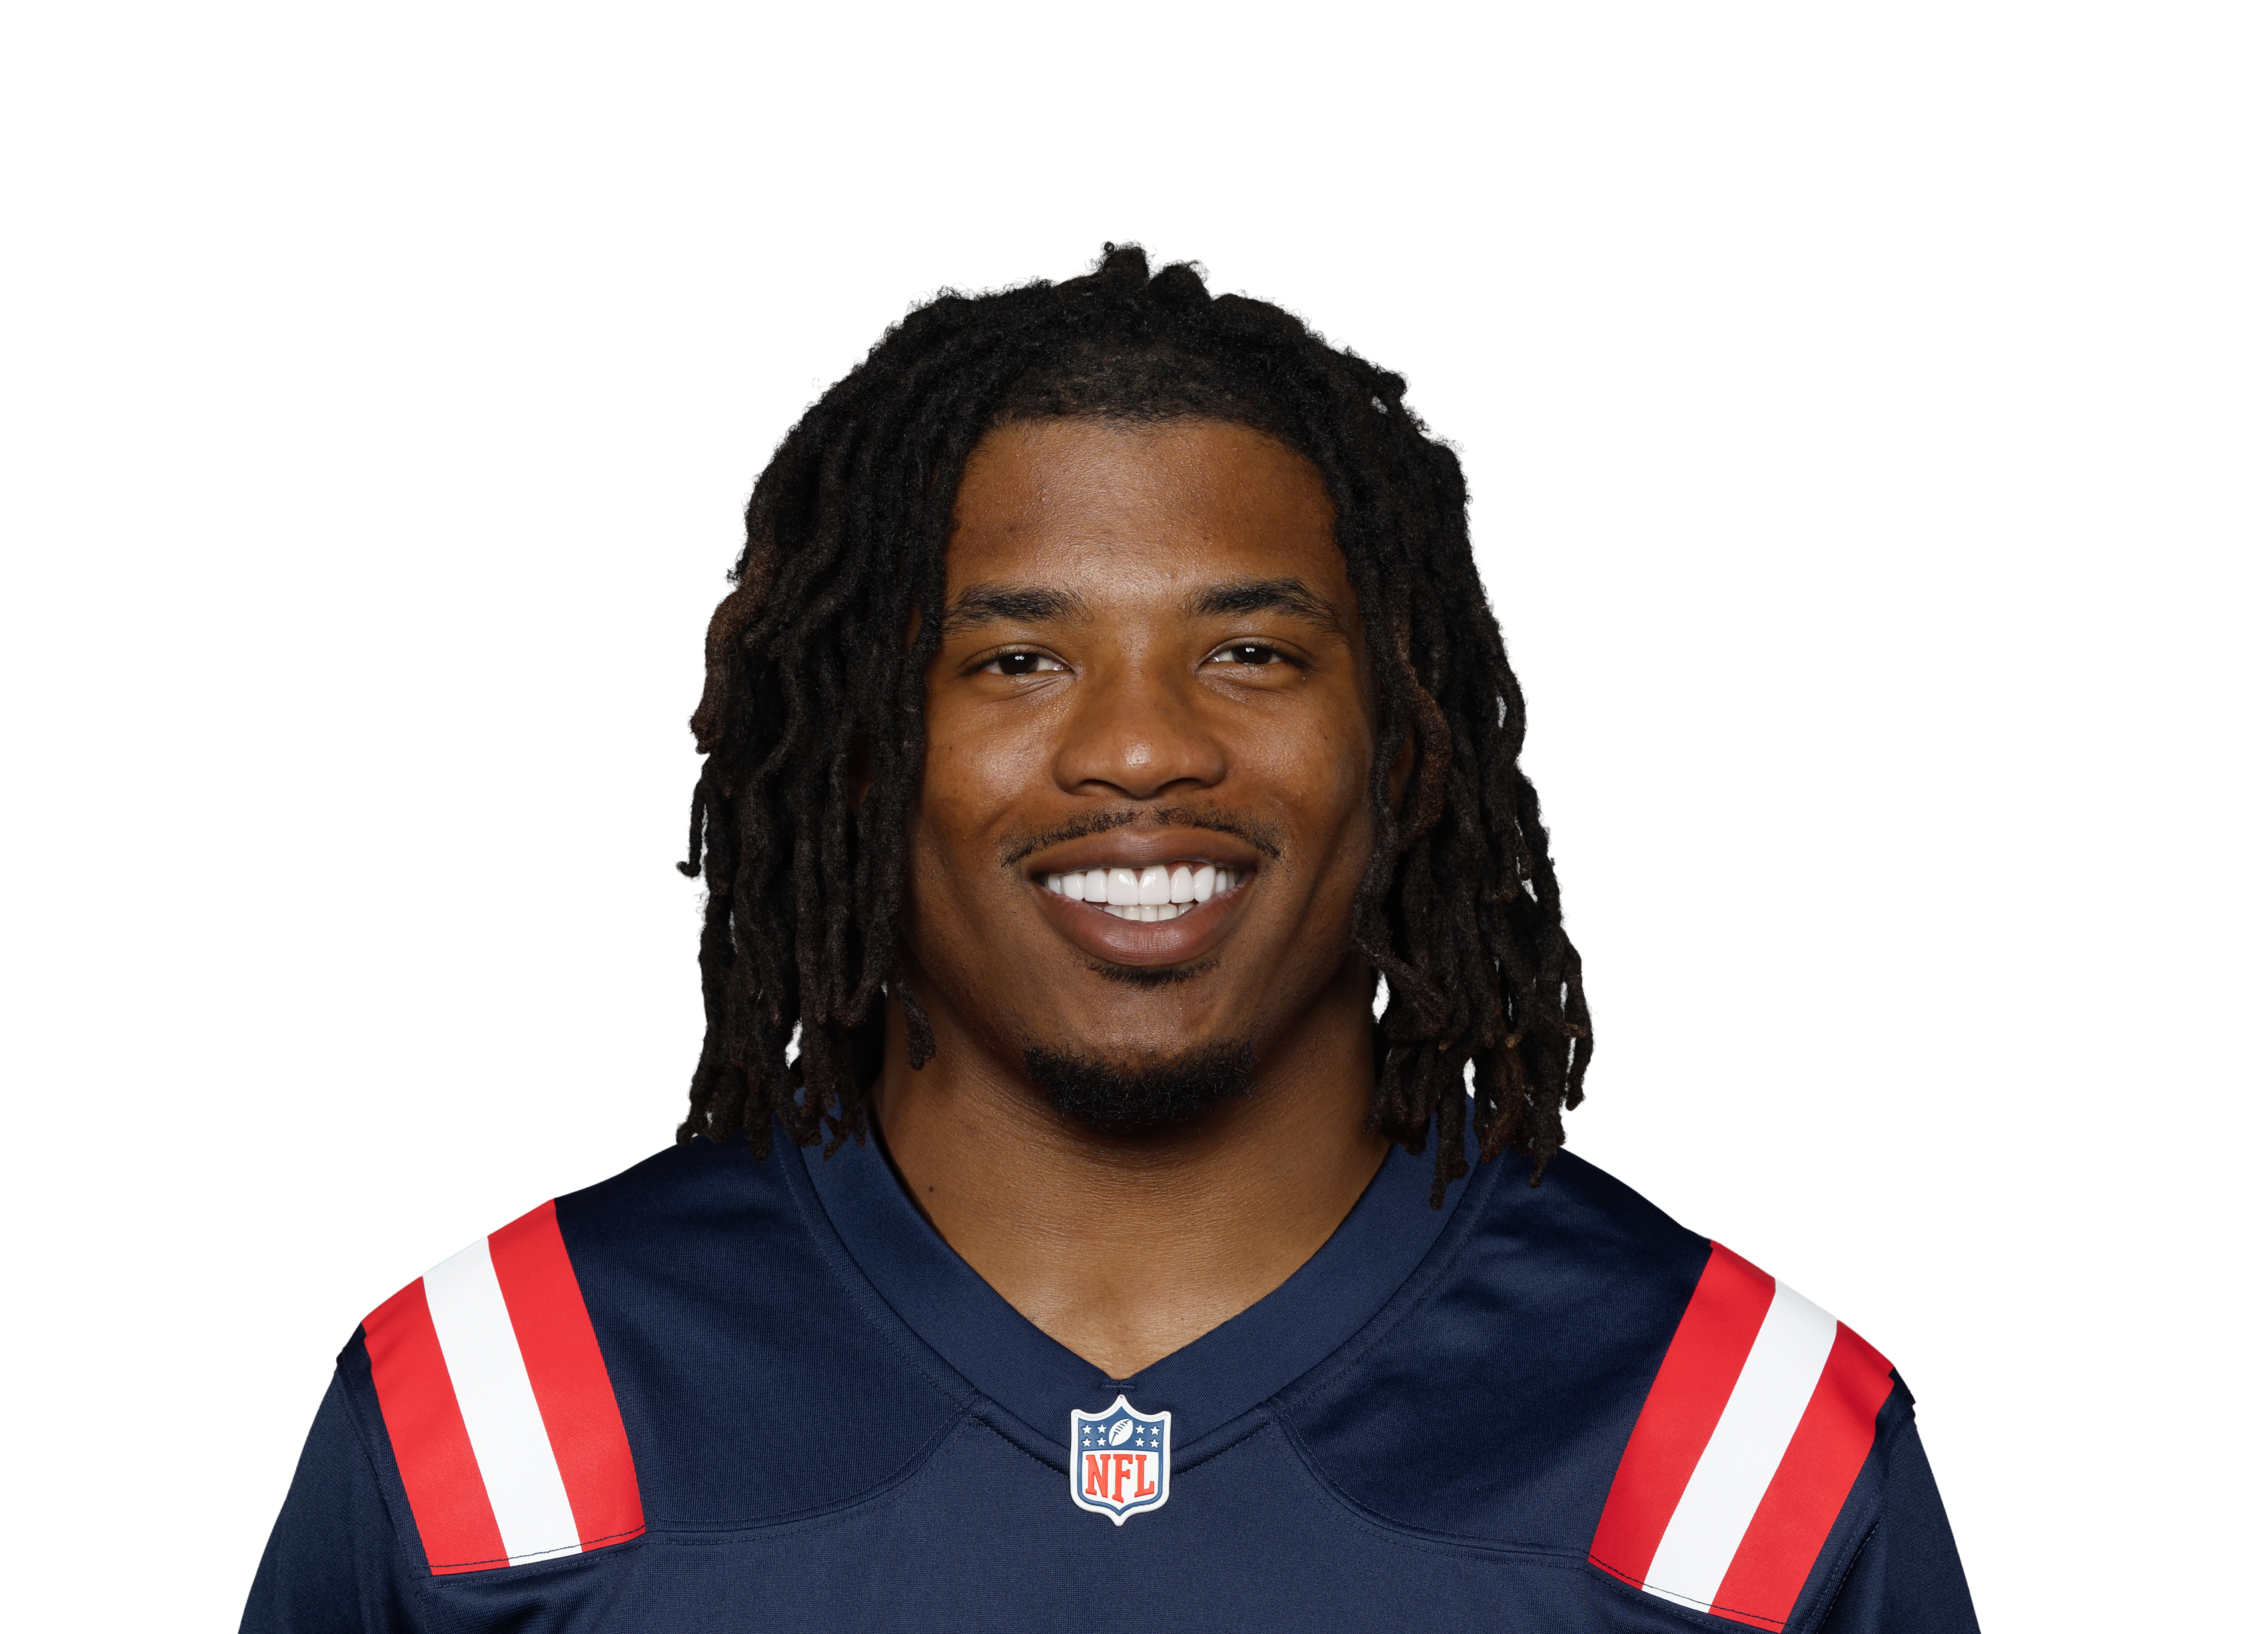 Corey Kiner@ NE • Wk 5 | 4.9 | 6 | 52 | 0 | 1 | 7 |
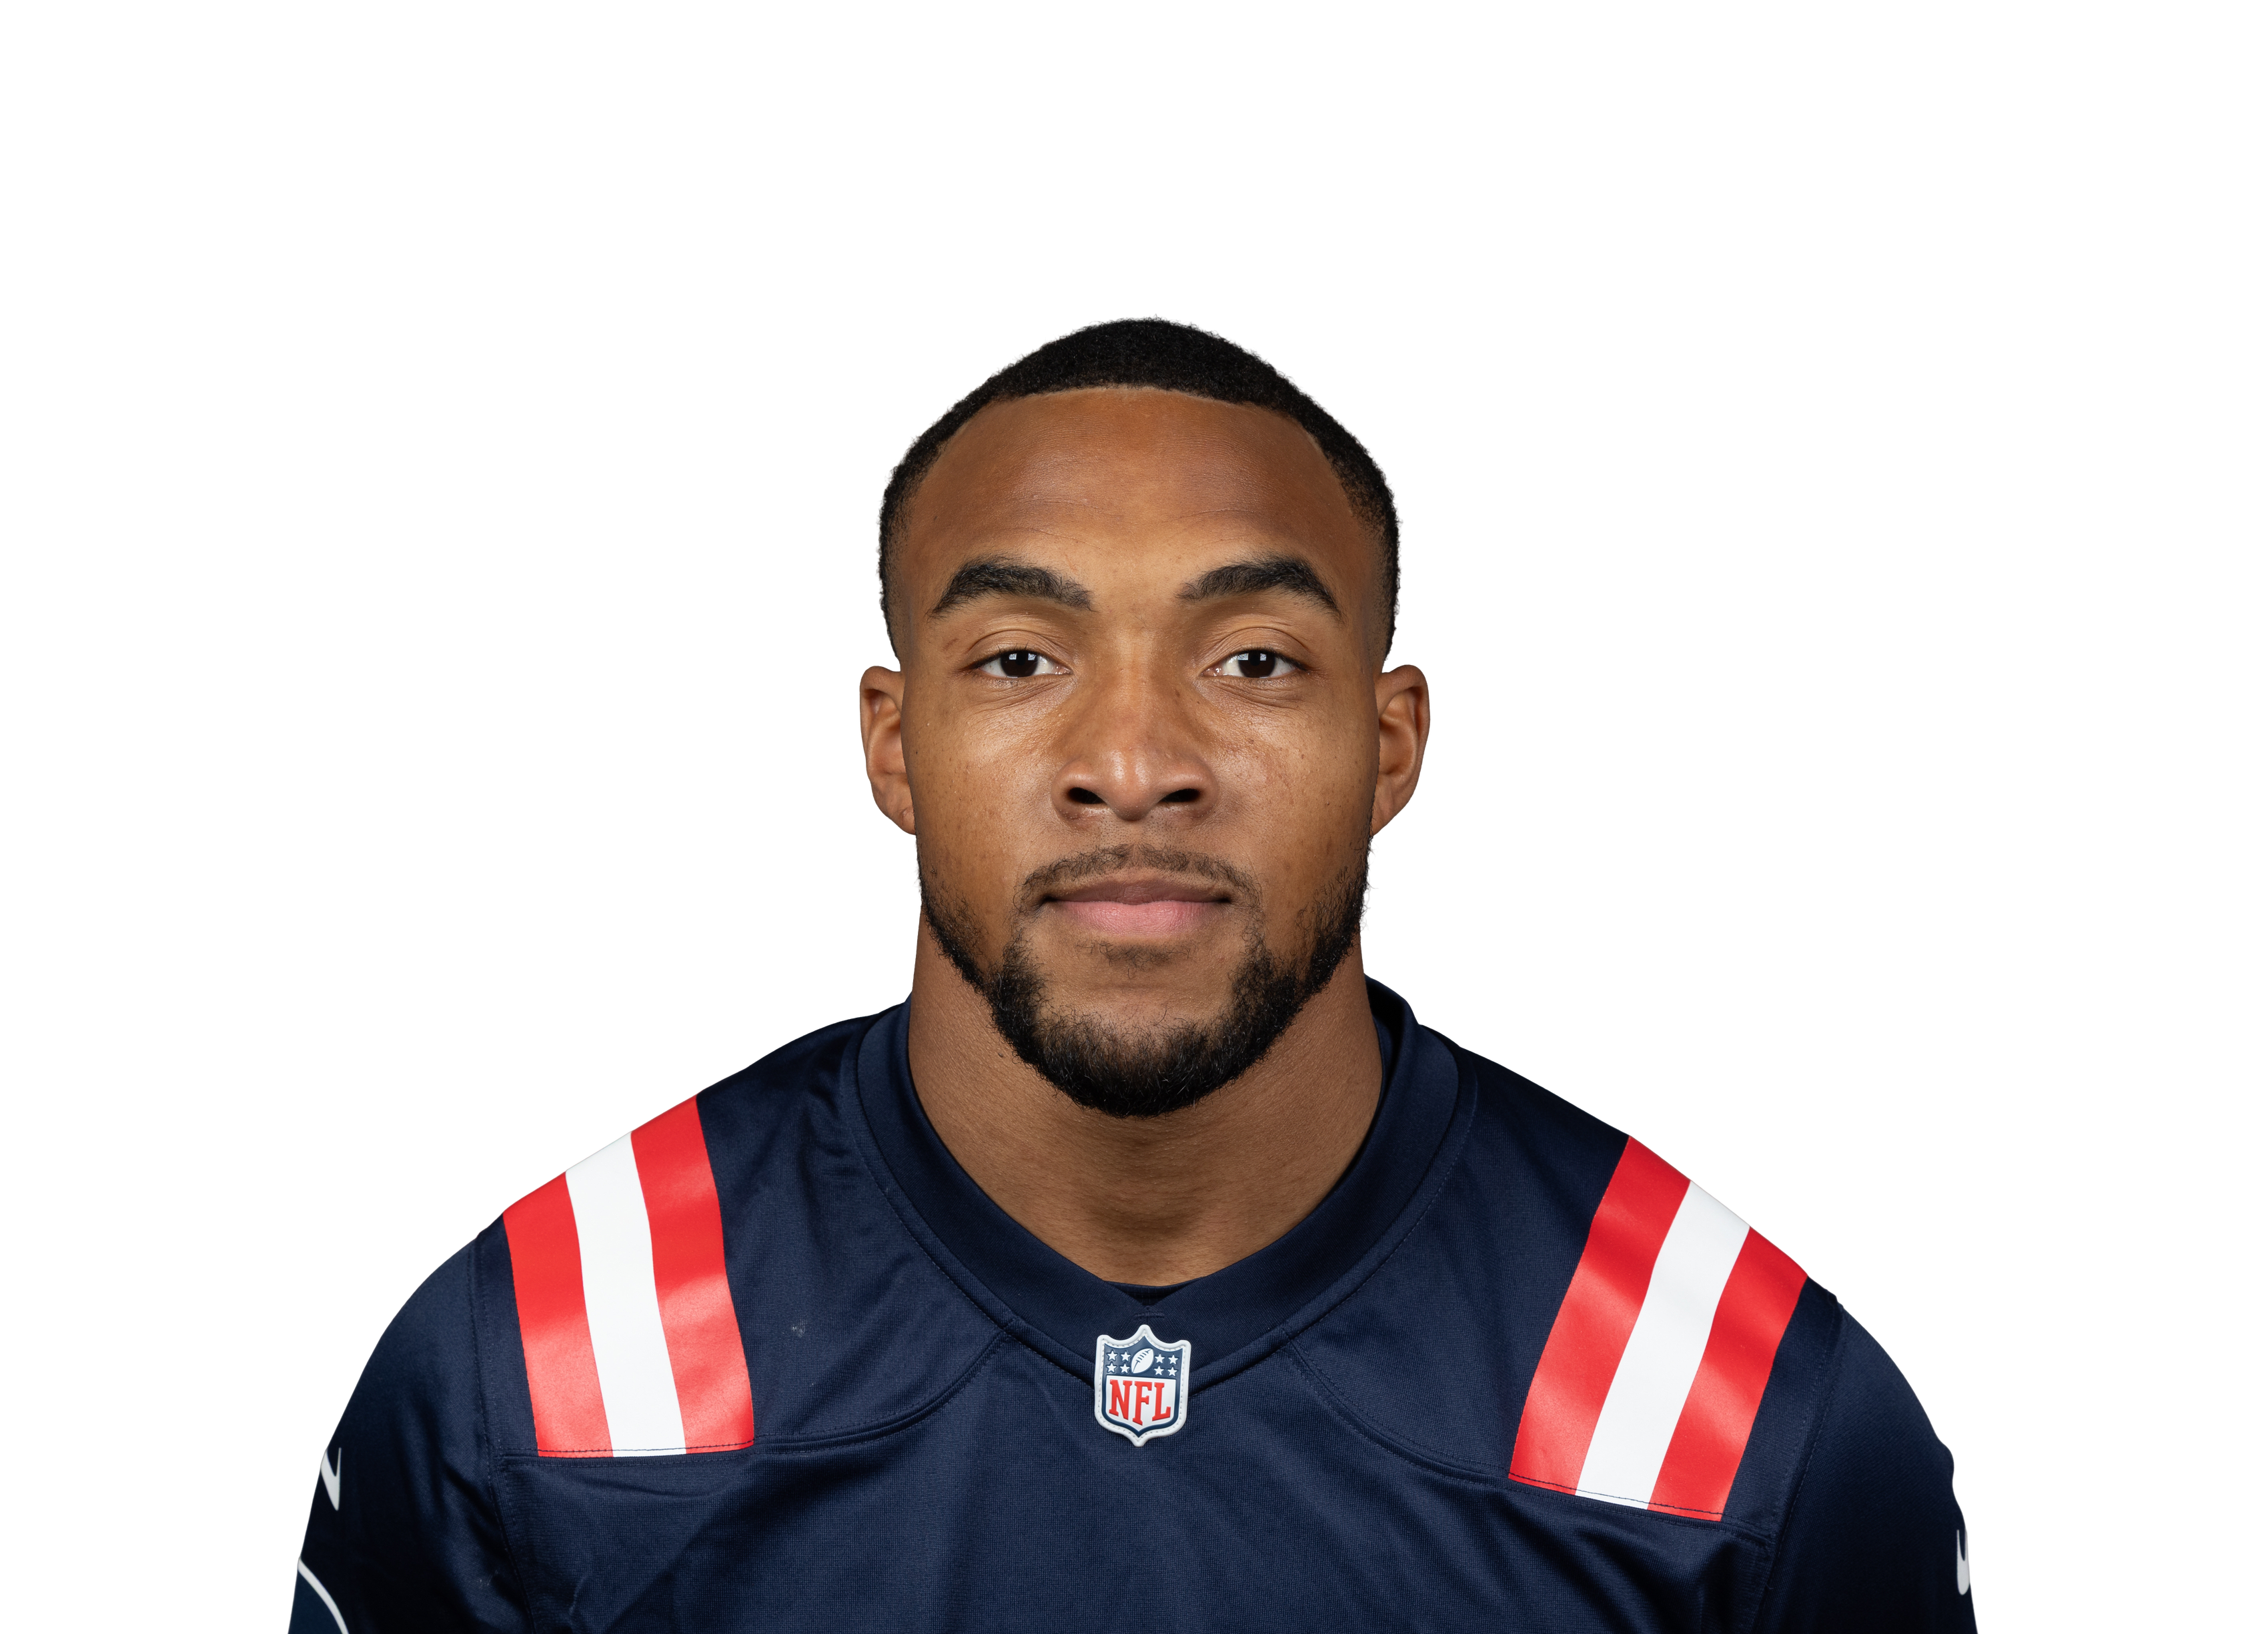 TreVeyon Henderson@ NE • Wk 5 | 4.8 | 4 | 22 | 0 | 1 | 16 |
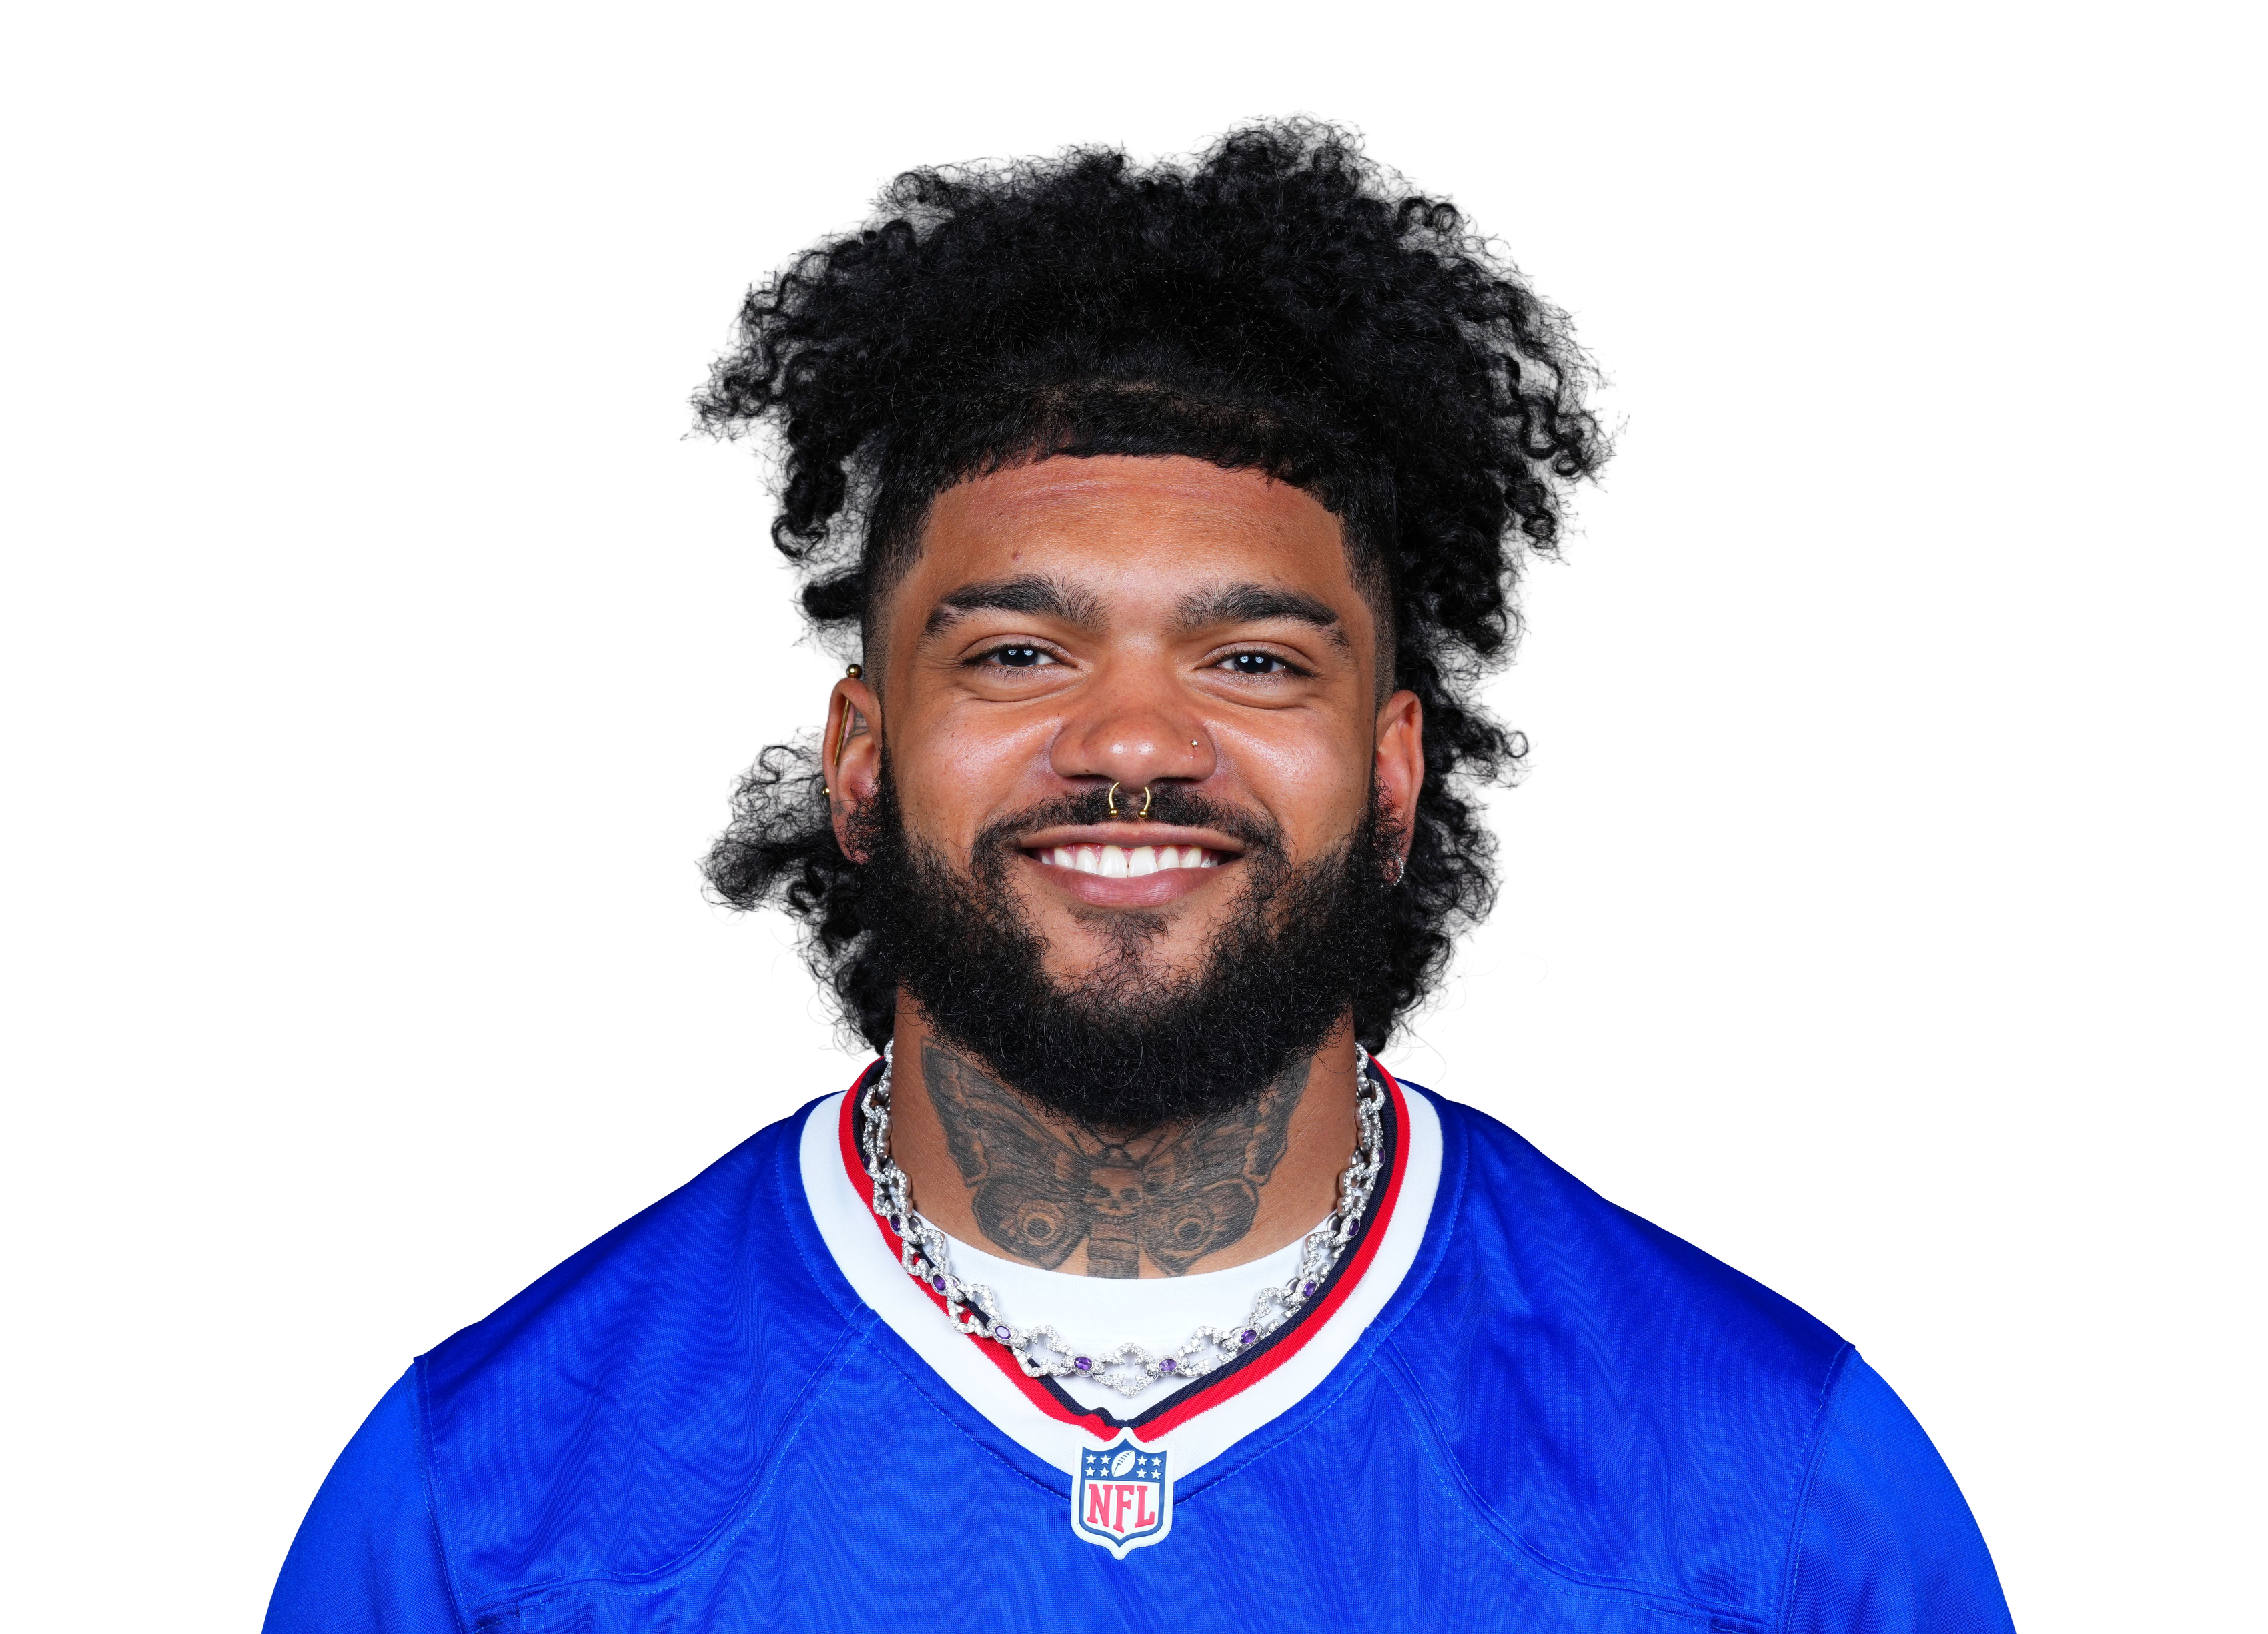 Ty Johnsonvs BUF • Wk 6 | 4.7 | 1 | 3 | 0 | 2 | 24 |
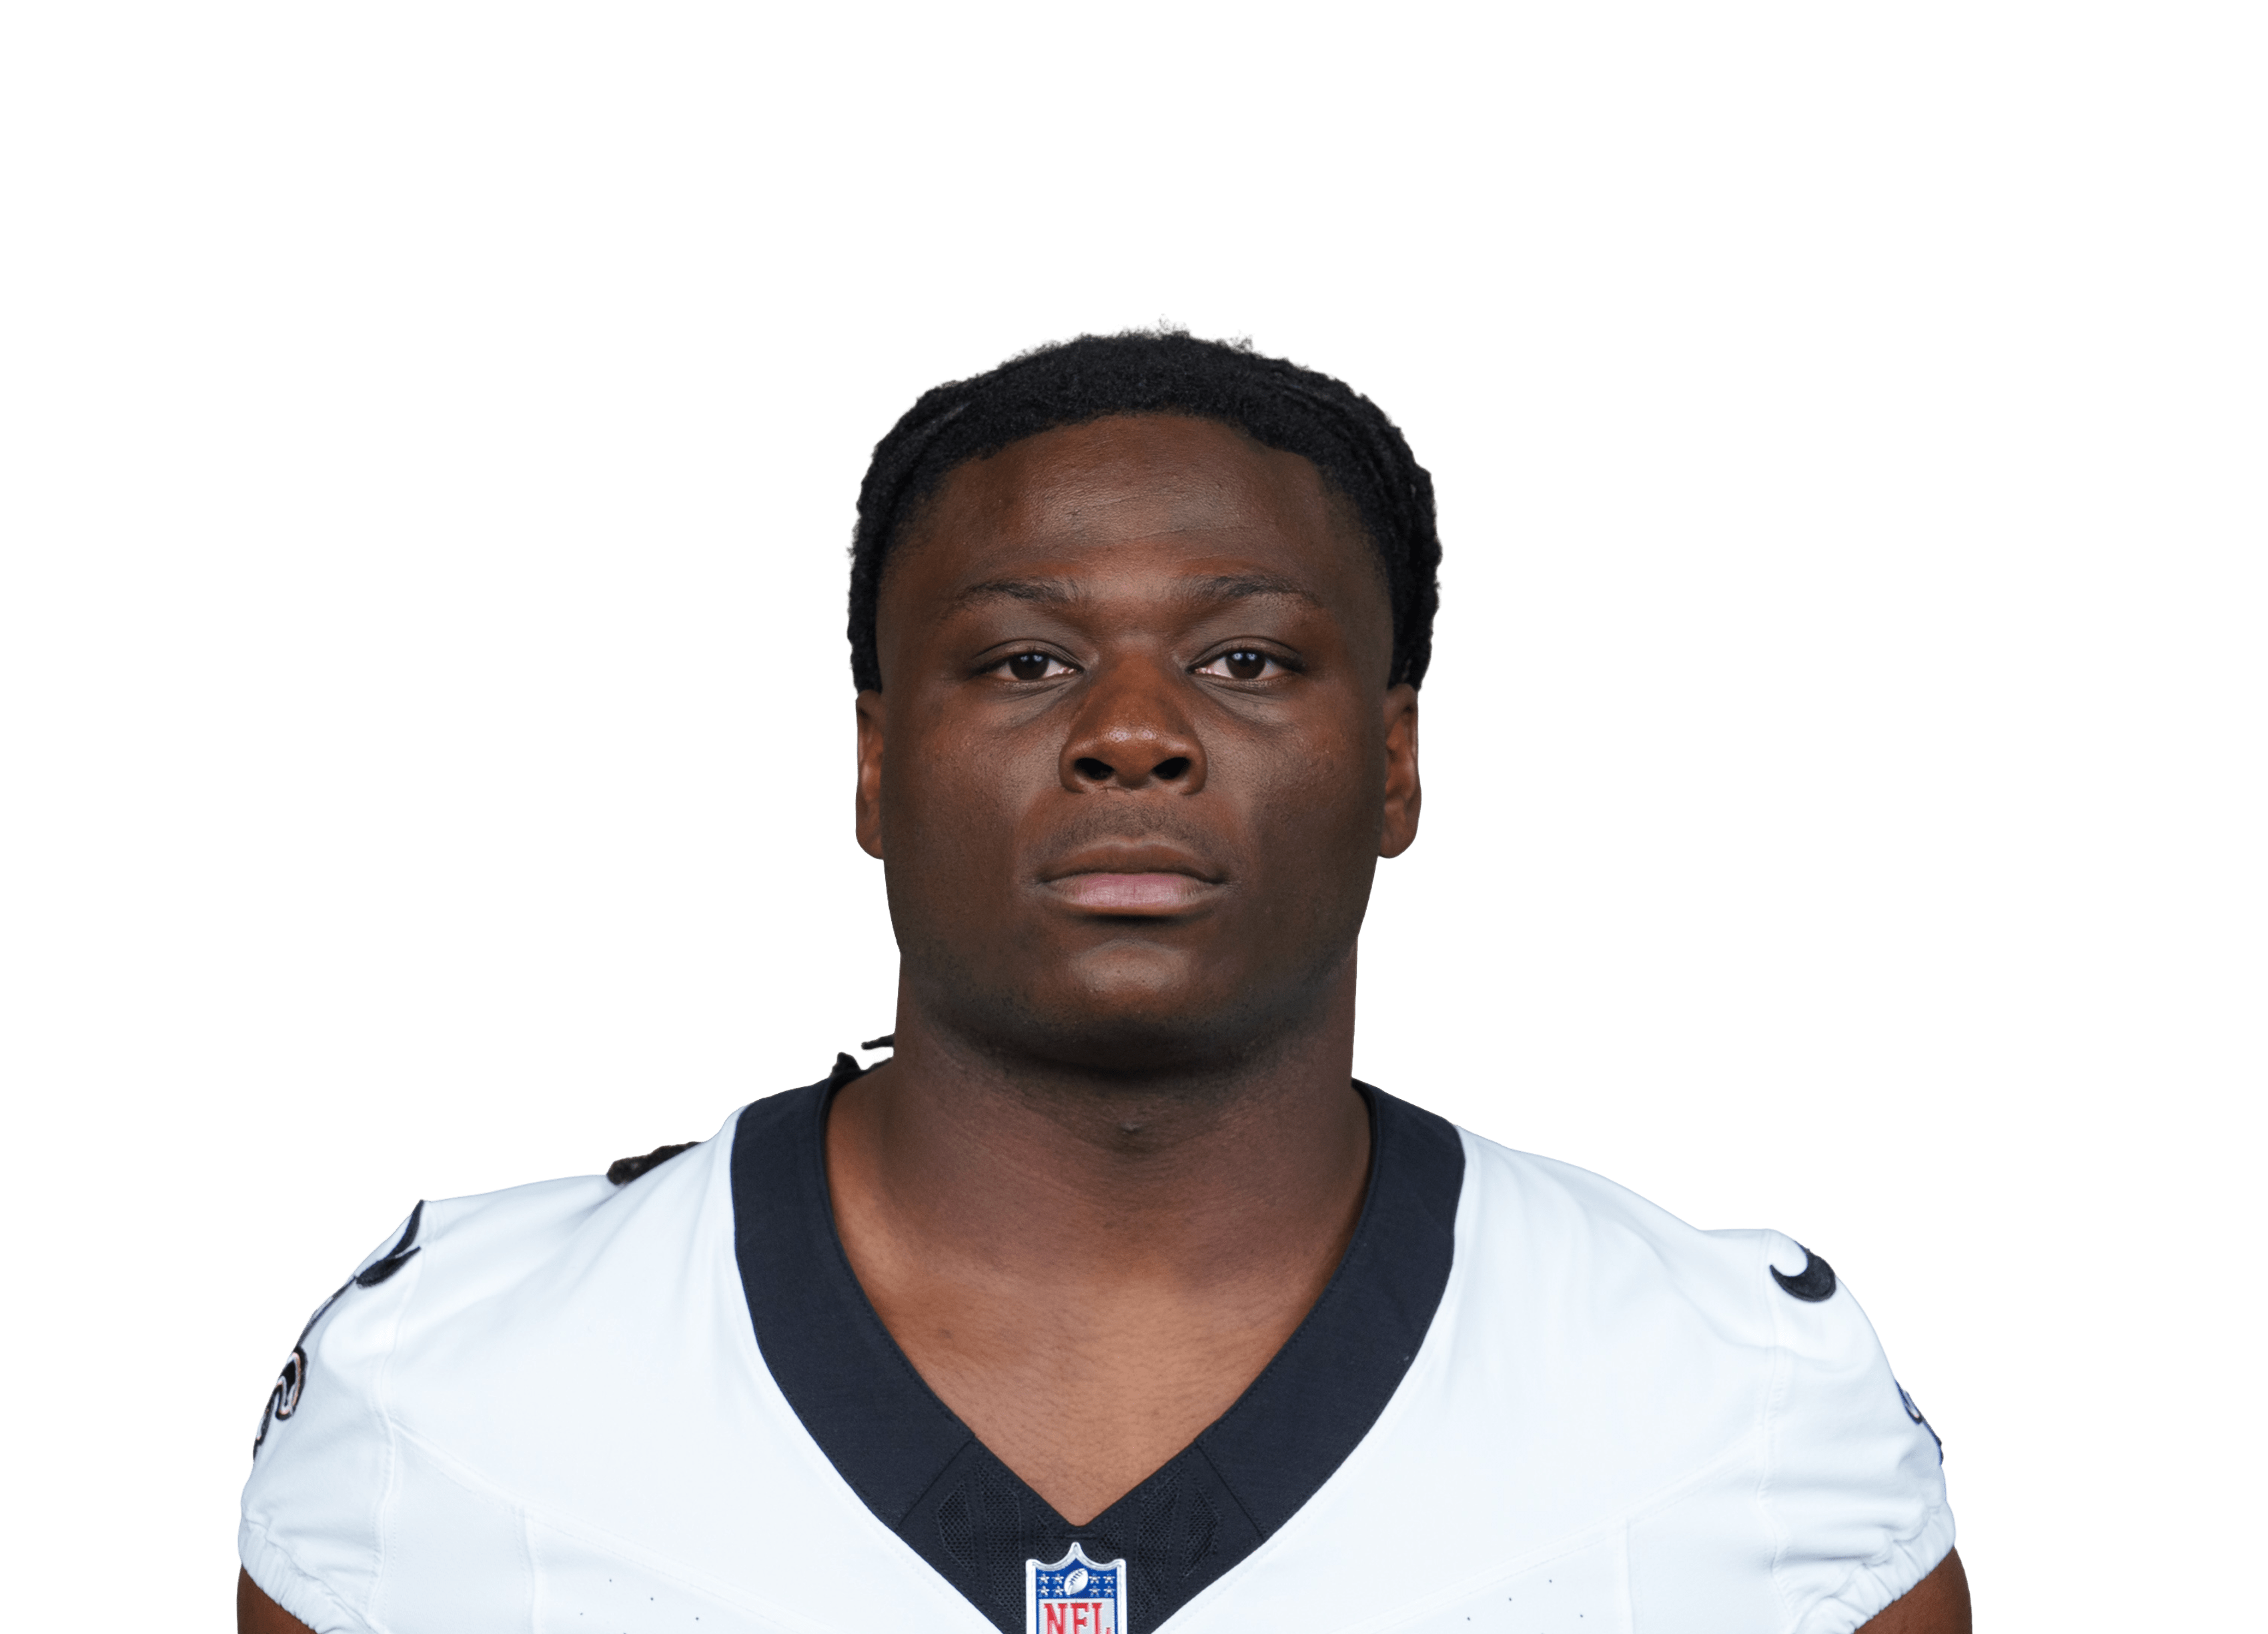 Kendre Miller@ NO • Wk 3 | 3.9 | 4 | 14 | 0 | 2 | 5 |
 Emmett Johnsonvs KC • Wk 4 | 2.0 | 0 | 0 | 0 | 1 | 10 |
 Ray Davisvs BUF • Wk 6 | 1.9 | 1 | 4 | 0 | 1 | 5 |
 Isaiah Davis@ NYJ • Wk 8 | 1.5 | 5 | 15 | 0 | 0 | 0 |
 Jordan James@ SF • Wk 9 | 1.1 | 3 | 11 | 0 | 0 | 0 |
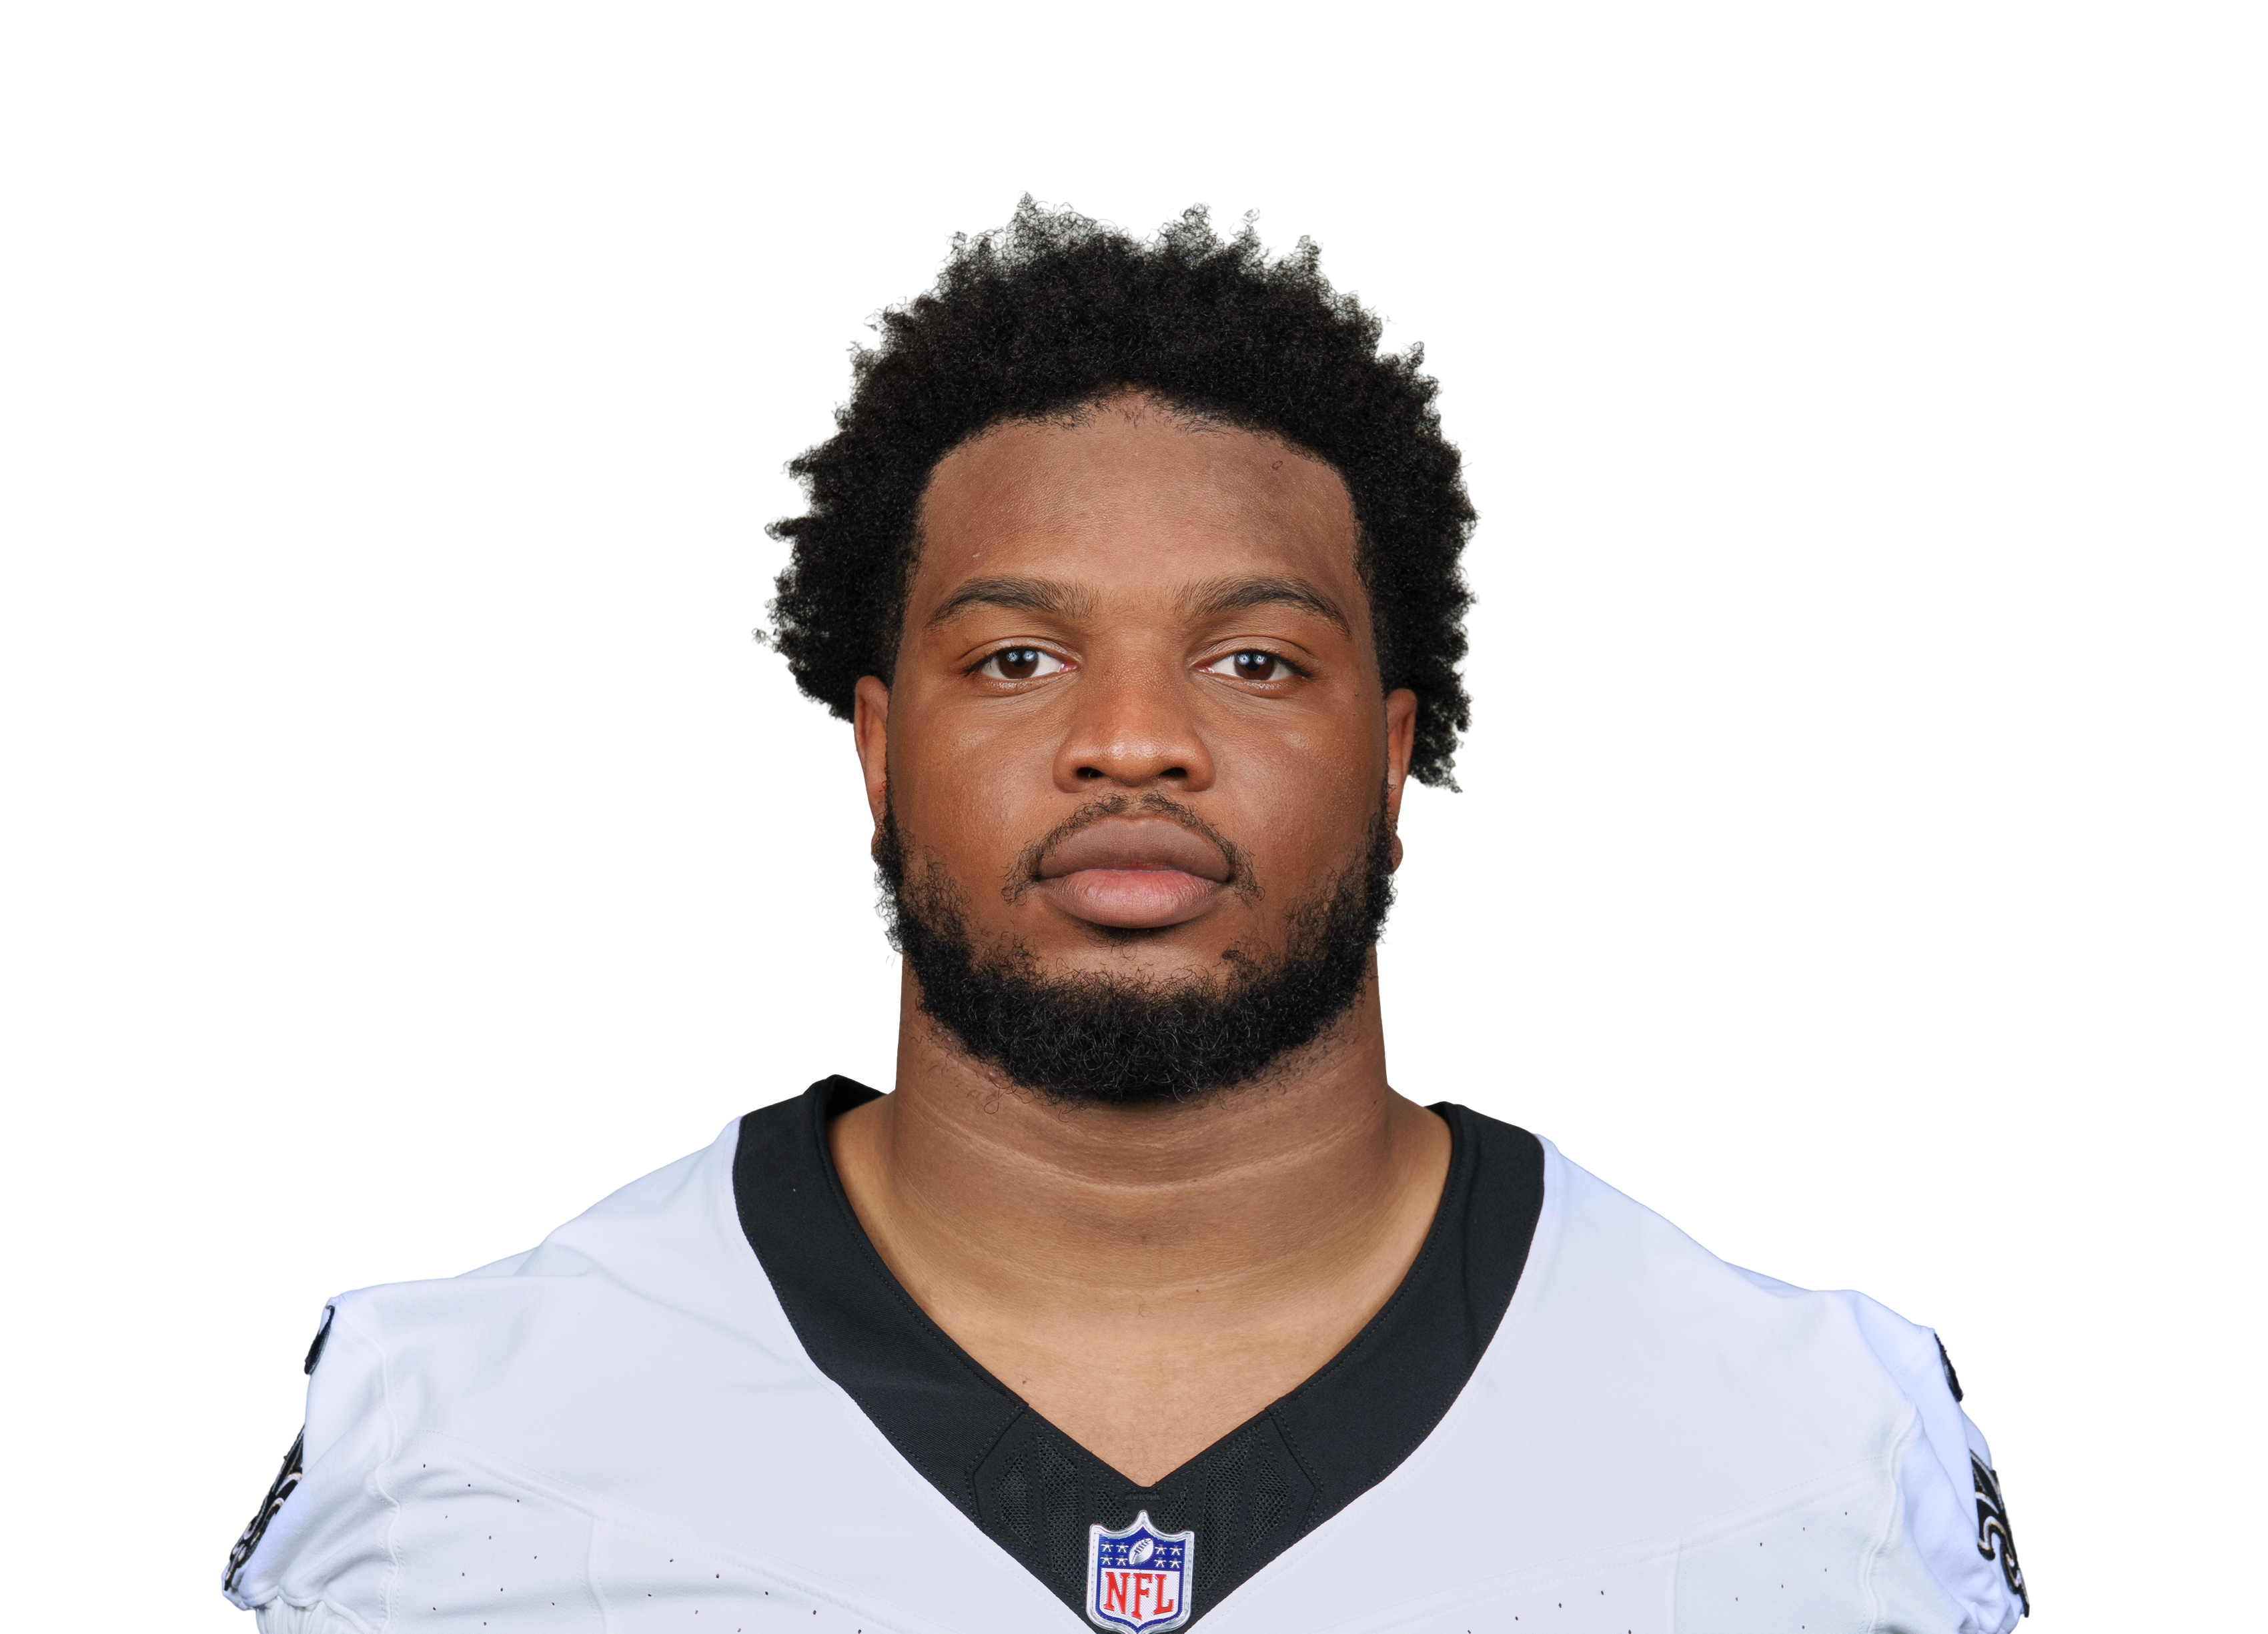 CJ Donaldson@ NO • Wk 3 | 0.5 | 1 | 5 | 0 | 0 | 0 |
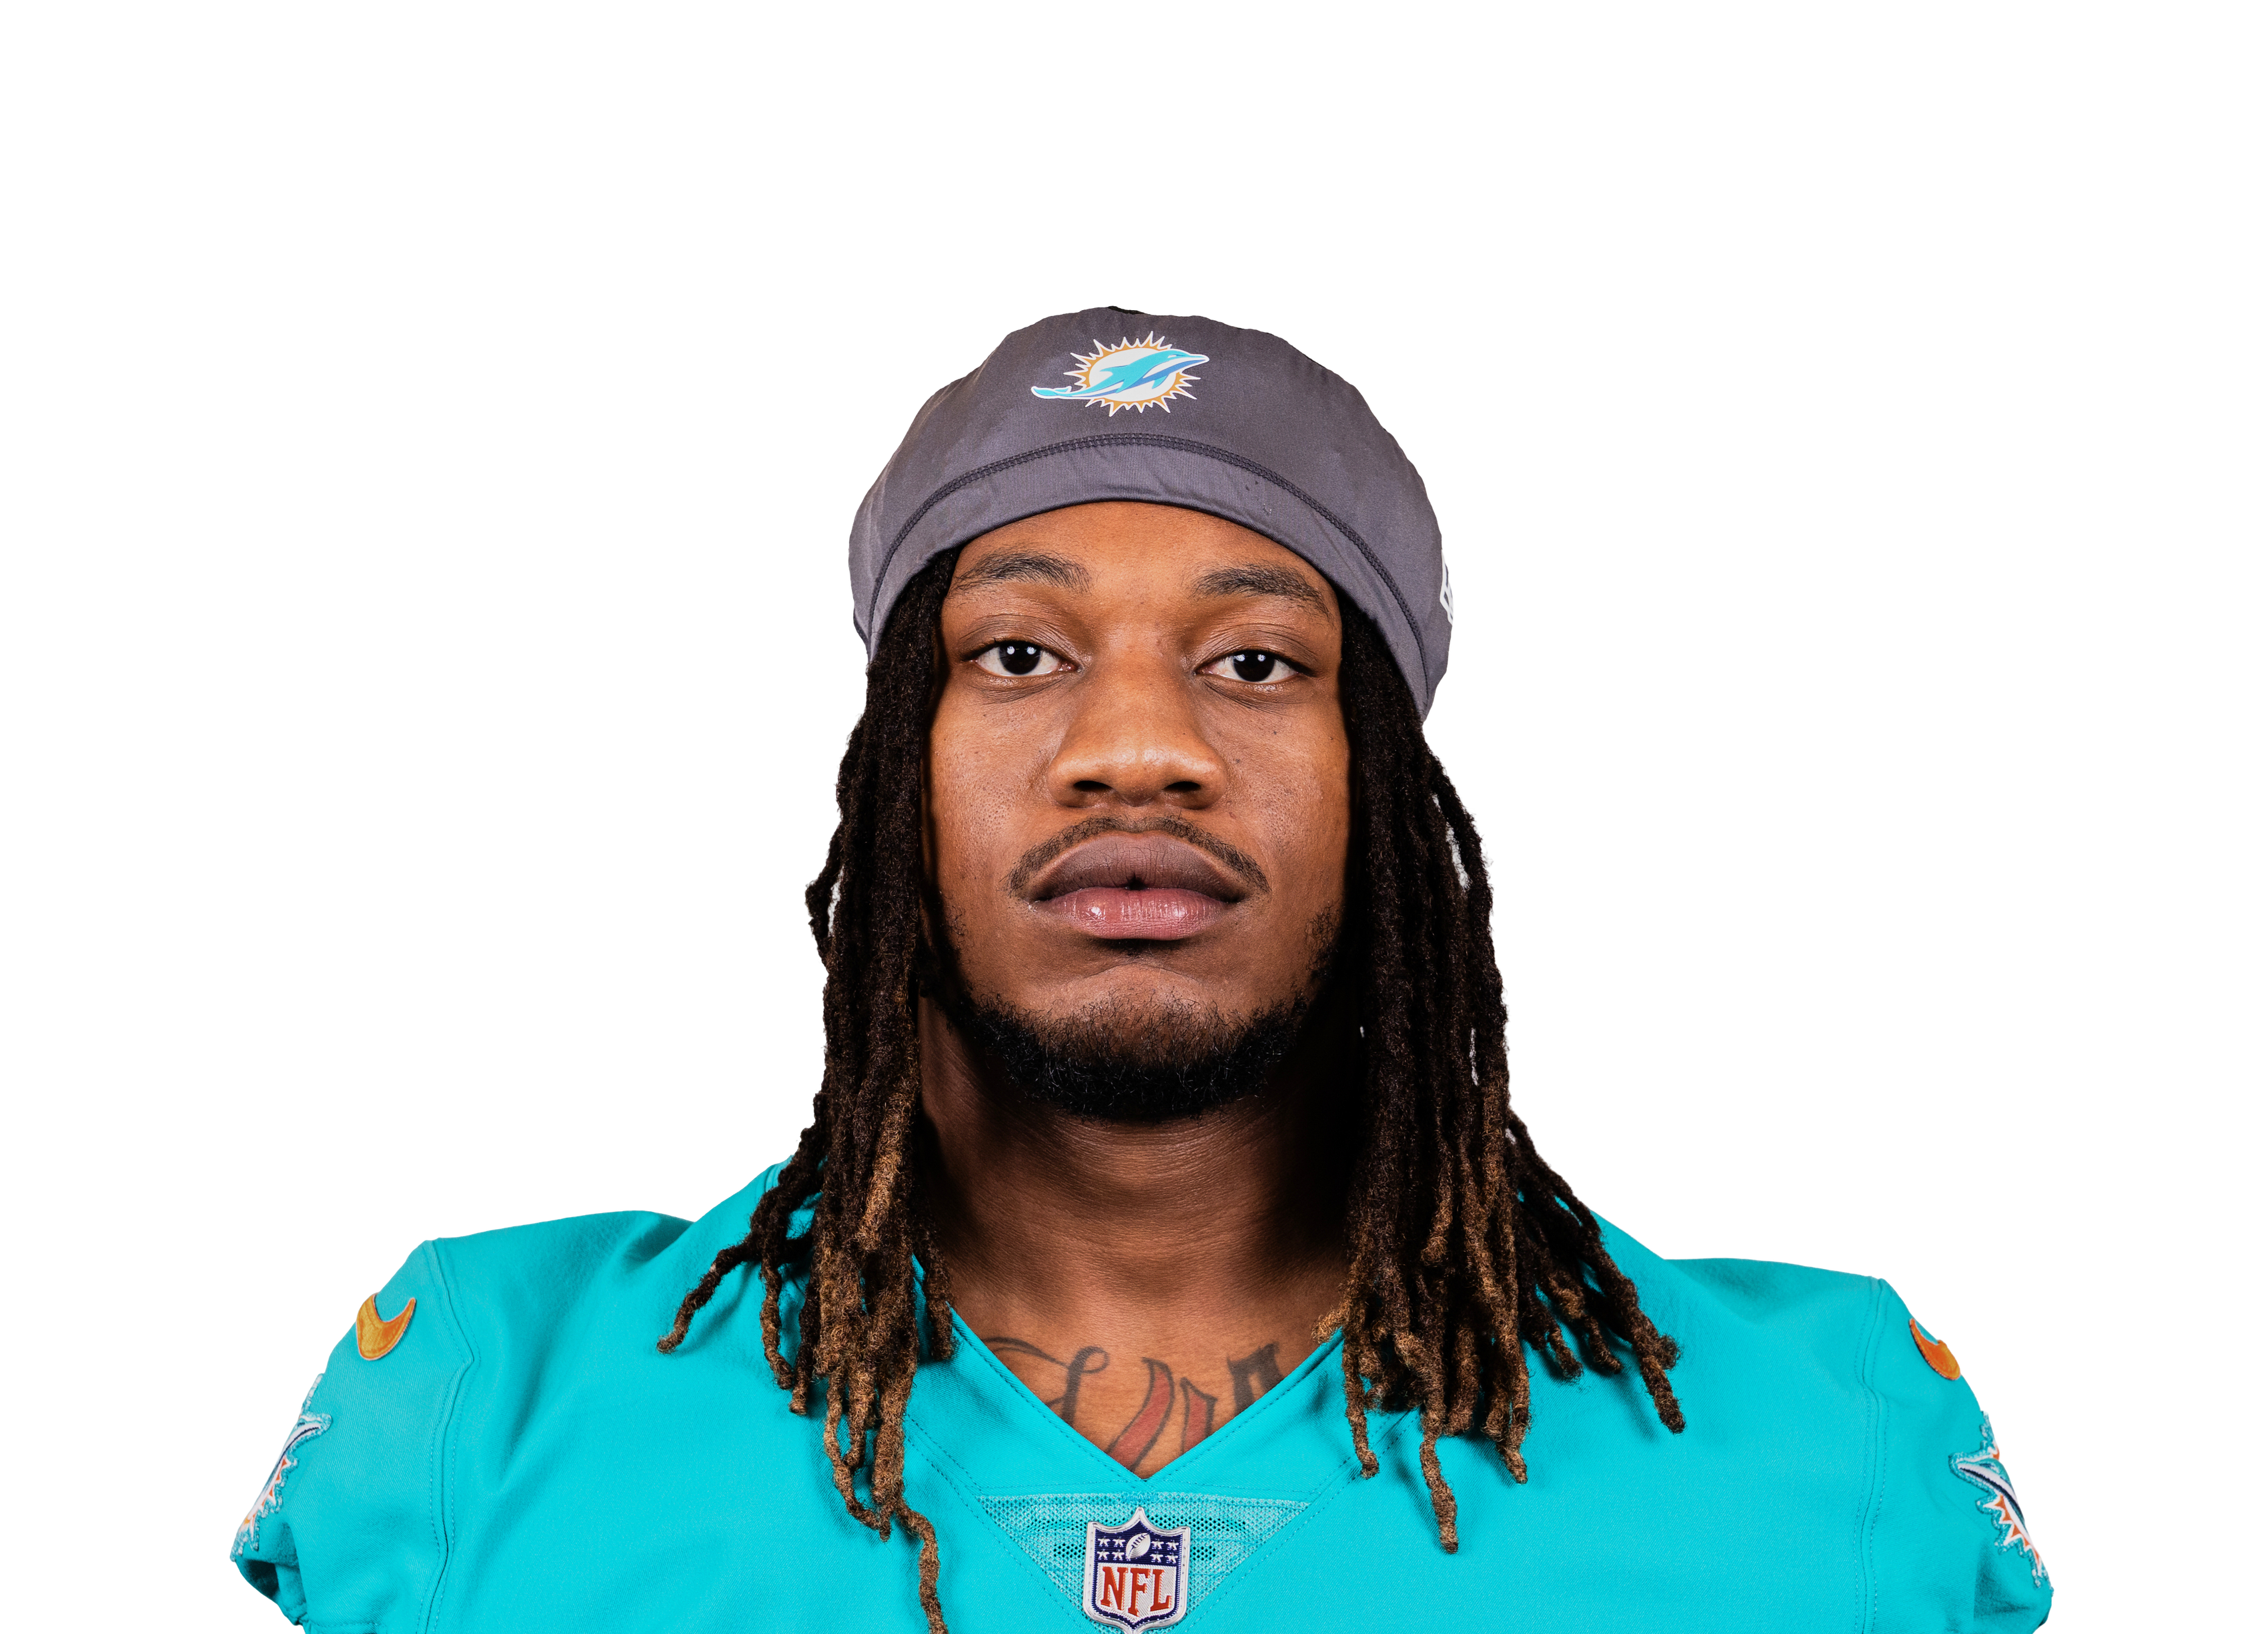 Jaylen Wrightvs MIA • Wk 1 | -0.1 | 1 | -1 | 0 | 0 | 0 |
Fantasy points first, then the stats that matter for his position. Ring around each photo is that player's Mania Rating. Tap a name to open his profile.
| Player | W1 | W2 | W3 | W4 | W5 | W6 | W7 | W8 | W9 | Per game |
|---|---|---|---|---|---|---|---|---|---|---|
| Jonah Coleman | 00 yds0% touches6% snaps | 1358 yds23% touches40% snaps | — | — | — | — | 1169 yds22% touches49% snaps | 16104 yds31% touches66% snaps | 2188 yds34% touches77% snaps | 12.264 yds a game • 5.2 per touch22% touches48% snaps |
| RJ Harvey | 741 yds17% touches51% snaps | — | 947 yds16% touches36% snaps | 1793 yds28% touches44% snaps | 47 yds8% touches37% snaps | 1056 yds19% touches40% snaps | 560 yds10% touches26% snaps | — | — | 8.751 yds a game • 5.8 per touch16% touches39% snaps |
| J.K. Dobbins | 836 yds19% touches43% snaps | 1036 yds18% touches34% snaps | 1953 yds34% touches49% snaps | 1352 yds22% touches32% snaps | 2074 yds39% touches52% snaps | 2046 yds39% touches52% snaps | 623 yds12% touches23% snaps | 713 yds14% touches21% snaps | 522 yds8% touches15% snaps | 12.039 yds a game • 3.3 per touch23% touches36% snaps |
| Tyler Badie | — | 429 yds7% touches26% snaps | 214 yds4% touches18% snaps | 439 yds7% touches18% snaps | 21 yds4% touches11% snaps | 16 yds2% touches7% snaps | — | — | — | 2.618 yds a game • 6.8 per touch5% touches16% snaps |
| Cody Schrader | — | — | — | — | — | — | — | 00 yds0% touches3% snaps | 00 yds0% touches0% snaps | 0.00 yds a game0% touches2% snaps |
| Use | Game | Proj | PPR | Tgt | Rec | Rec Yd | Car | Rush Yd | TD | Snap |
|---|---|---|---|---|---|---|---|---|---|---|
W1 vs KC | 8.8 | 8.1 | 4 | 4 | 23 | 3 | 18 | 0 | 51% | |
W3 vs LA | 10.1 | 10.7 | 7 | 6 | 41 | 2 | 6 | 0 | 36% | |
W4 vs SF | 9.7 | 19.3 | 10 | 10 | 68 | 7 | 25 | 0 | 44% | |
W5 vs LAC | 11.7 | 0.7 | 1 | 0 | 0 | 3 | 7 | 0 | 37% | |
W6 vs SEA | 8.7 | 14.6 | 4 | 3 | 31 | 6 | 25 | 1 | 40% | |
W7 vs ARI | 10.0 | 14 | 2 | 2 | 54 | 3 | 6 | 1 | 26% |
Too few plays to rank yet (needs 60 carries, he has 24). Here are his raw numbers so far.
RJ Harvey
DEN • RB • 6 gamesPick a teammate with or without. Pick more than one to combine them, like a game without the QB and without the other back.
| Player | W1 | W2 | W3 | W4 | W5 | W6 | W7 | W8 | W9 | Per game |
|---|---|---|---|---|---|---|---|---|---|---|
| Jonah Coleman | 00 yds0% touches6% snaps | 1358 yds23% touches40% snaps | — | — | — | — | 1169 yds22% touches49% snaps | 16104 yds31% touches66% snaps | 2188 yds34% touches77% snaps | 12.264 yds a game • 5.2 per touch22% touches48% snaps |
| RJ Harvey | 741 yds17% touches51% snaps | — | 947 yds16% touches36% snaps | 1793 yds28% touches44% snaps | 47 yds8% touches37% snaps | 1056 yds19% touches40% snaps | 560 yds10% touches26% snaps | — | — | 8.751 yds a game • 5.8 per touch16% touches39% snaps |
| J.K. Dobbins | 836 yds19% touches43% snaps | 1036 yds18% touches34% snaps | 1953 yds34% touches49% snaps | 1352 yds22% touches32% snaps | 2074 yds39% touches52% snaps | 2046 yds39% touches52% snaps | 623 yds12% touches23% snaps | 713 yds14% touches21% snaps | 522 yds8% touches15% snaps | 12.039 yds a game • 3.3 per touch23% touches36% snaps |
| Tyler Badie | — | 429 yds7% touches26% snaps | 214 yds4% touches18% snaps | 439 yds7% touches18% snaps | 21 yds4% touches11% snaps | 16 yds2% touches7% snaps | — | — | — | 2.618 yds a game • 6.8 per touch5% touches16% snaps |
| Cody Schrader | — | — | — | — | — | — | — | 00 yds0% touches3% snaps | 00 yds0% touches0% snaps | 0.00 yds a game0% touches2% snaps |
| Use | Game | Proj | PPR | Tgt | Rec | Rec Yd | Car | Rush Yd | TD | Snap |
|---|---|---|---|---|---|---|---|---|---|---|
| W1vs KC | 8.8 | 8.1 | 4 | 4 | 23 | 3 | 18 | 0 | 51% | |
| W3vs LA | 10.1 | 10.7 | 7 | 6 | 41 | 2 | 6 | 0 | 36% | |
| W4vs SF | 9.7 | 19.3 | 10 | 10 | 68 | 7 | 25 | 0 | 44% | |
| W5vs LAC | 11.7 | 0.7 | 1 | 0 | 0 | 3 | 7 | 0 | 37% | |
| W6vs SEA | 8.7 | 14.6 | 4 | 3 | 31 | 6 | 25 | 1 | 40% | |
| W7vs ARI | 10.0 | 14 | 2 | 2 | 54 | 3 | 6 | 1 | 26% |
Too few plays to rank yet (needs 60 carries, he has 24). Here are his raw numbers so far.
25.4 PPR points a game allowed to running backs, 5th most of 32 defenses.
| Player | PPR | Rush | Rush Yd | Rush TD | Rec | Rec Yd |
|---|---|---|---|---|---|---|
| Kenneth Walker IIIvs KC • Wk 4 | 30.9 | 22 | 177 | 2 | 1 | 2 |
| James Cookvs BUF • Wk 6 | 24.3 | 22 | 95 | 1 | 3 | 58 |
| Braelon Allen@ NYJ • Wk 8 | 23.3 | 21 | 147 | 1 | 2 | 6 |
| Christian McCaffrey@ SF • Wk 9 | 22.7 | 18 | 68 | 1 | 2 | 19 |
| Kyren Williamsvs LA • Wk 7 | 18.1 | 16 | 99 | 1 | 2 | 22 |
| Omarion Hampton@ LAC • Wk 2 | 17.5 | 23 | 94 | 1 | 2 | 21 |
| Rhamondre Stevenson@ NE • Wk 5 | 17.5 | 13 | 64 | 1 | 3 | 21 |
| Blake Corumvs LA • Wk 7 | 17.1 | 17 | 93 | 1 | 1 | 8 |
| Jadarian Pricevs SEA • Wk 10 | 11.4 | 9 | 36 | 1 | 1 | 8 |
| De'Von Achanevs MIA • Wk 1 | 10.6 | 11 | 36 | 0 | 4 | 30 |
| Zach Charbonnetvs SEA • Wk 10 | 9.4 | 20 | 94 | 0 | 0 | 0 |
| Travis Etienne@ NO • Wk 3 | 9.0 | 13 | 57 | 0 | 2 | 13 |
| Kaelon Black@ SF • Wk 9 | 7.0 | 11 | 70 | 0 | 0 | 0 |
| Alvin Kamara@ NO • Wk 3 | 5.1 | 9 | 36 | 0 | 1 | 5 |
| Keaton Mitchell@ LAC • Wk 2 | 4.9 | 5 | 24 | 0 | 1 | 15 |
| Corey Kiner@ NE • Wk 5 | 4.9 | 6 | 52 | 0 | 1 | 7 |
| TreVeyon Henderson@ NE • Wk 5 | 4.8 | 4 | 22 | 0 | 1 | 16 |
| Ty Johnsonvs BUF • Wk 6 | 4.7 | 1 | 3 | 0 | 2 | 24 |
| Kendre Miller@ NO • Wk 3 | 3.9 | 4 | 14 | 0 | 2 | 5 |
| Emmett Johnsonvs KC • Wk 4 | 2.0 | 0 | 0 | 0 | 1 | 10 |
| Ray Davisvs BUF • Wk 6 | 1.9 | 1 | 4 | 0 | 1 | 5 |
| Isaiah Davis@ NYJ • Wk 8 | 1.5 | 5 | 15 | 0 | 0 | 0 |
| Jordan James@ SF • Wk 9 | 1.1 | 3 | 11 | 0 | 0 | 0 |
| CJ Donaldson@ NO • Wk 3 | 0.5 | 1 | 5 | 0 | 0 | 0 |
| Jaylen Wrightvs MIA • Wk 1 | -0.1 | 1 | -1 | 0 | 0 | 0 |
Fantasy points first, then the stats that matter for his position. Ring around each photo is that player's Mania Rating. Tap a name to open his profile.