
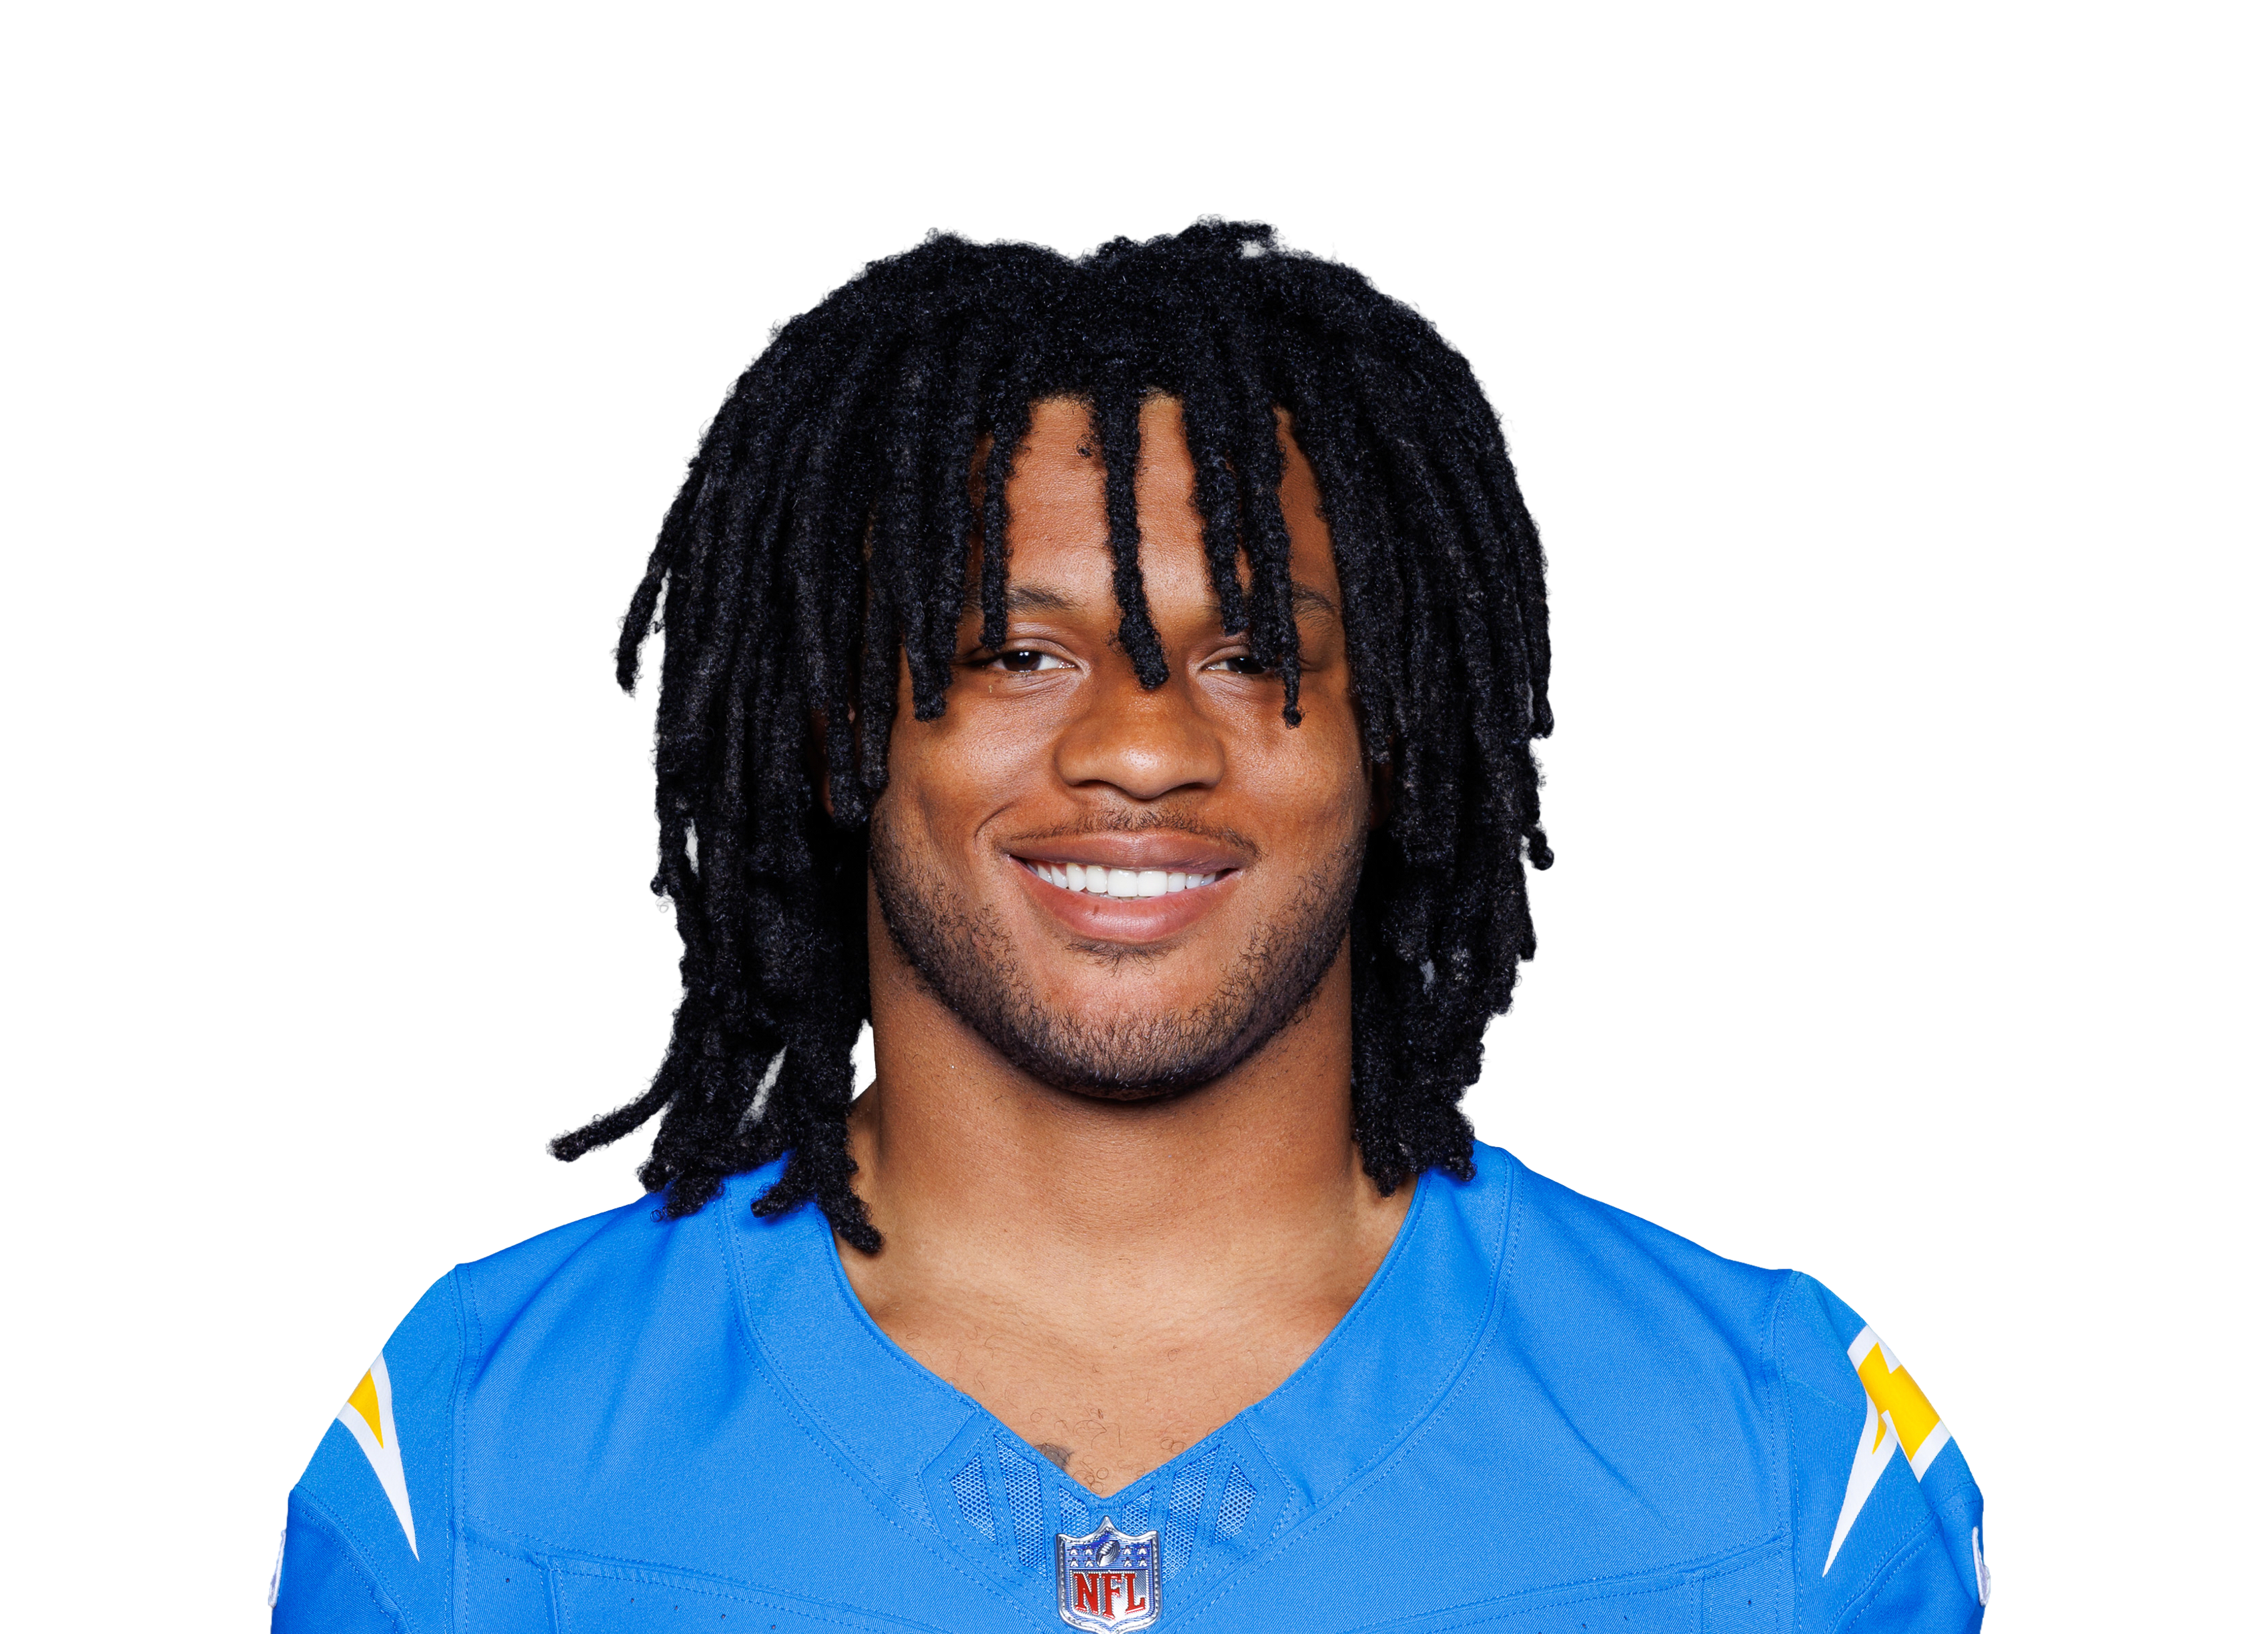
Omarion Hampton
 LAC • RB • 9 games
Pick a teammate with or without. Pick more than one to combine them, like a game without the QB and without the other back.
LAC NYJ
How this is built
24.0 PPR points a game allowed to running backs, 10th most of 32 defenses.
| Player | PPR | Rush | Rush Yd | Rush TD | Rec | Rec Yd |
|---|---|---|---|---|---|---|
 Jahmyr Gibbs@ DET • Wk 3 | 41.4 | 20 | 99 | 2 | 7 | 65 |
 Kenneth Walker III@ KC • Wk 9 | 36.3 | 18 | 102 | 1 | 4 | 41 |
 Kyle Monangai@ CHI • Wk 4 | 28.0 | 30 | 146 | 2 | 1 | 4 |
 James Cookvs BUF • Wk 10 | 21.7 | 18 | 157 | 1 | 0 | 0 |
 Ollie Gordon IIvs MIA • Wk 7 | 17.3 | 25 | 103 | 1 | 1 | 0 |
 Ashton Jeantyvs LV • Wk 8 | 10.3 | 2 | 9 | 0 | 3 | 64 |
 Emmett Johnson@ KC • Wk 9 | 9.4 | 6 | 34 | 1 | 0 | 0 |
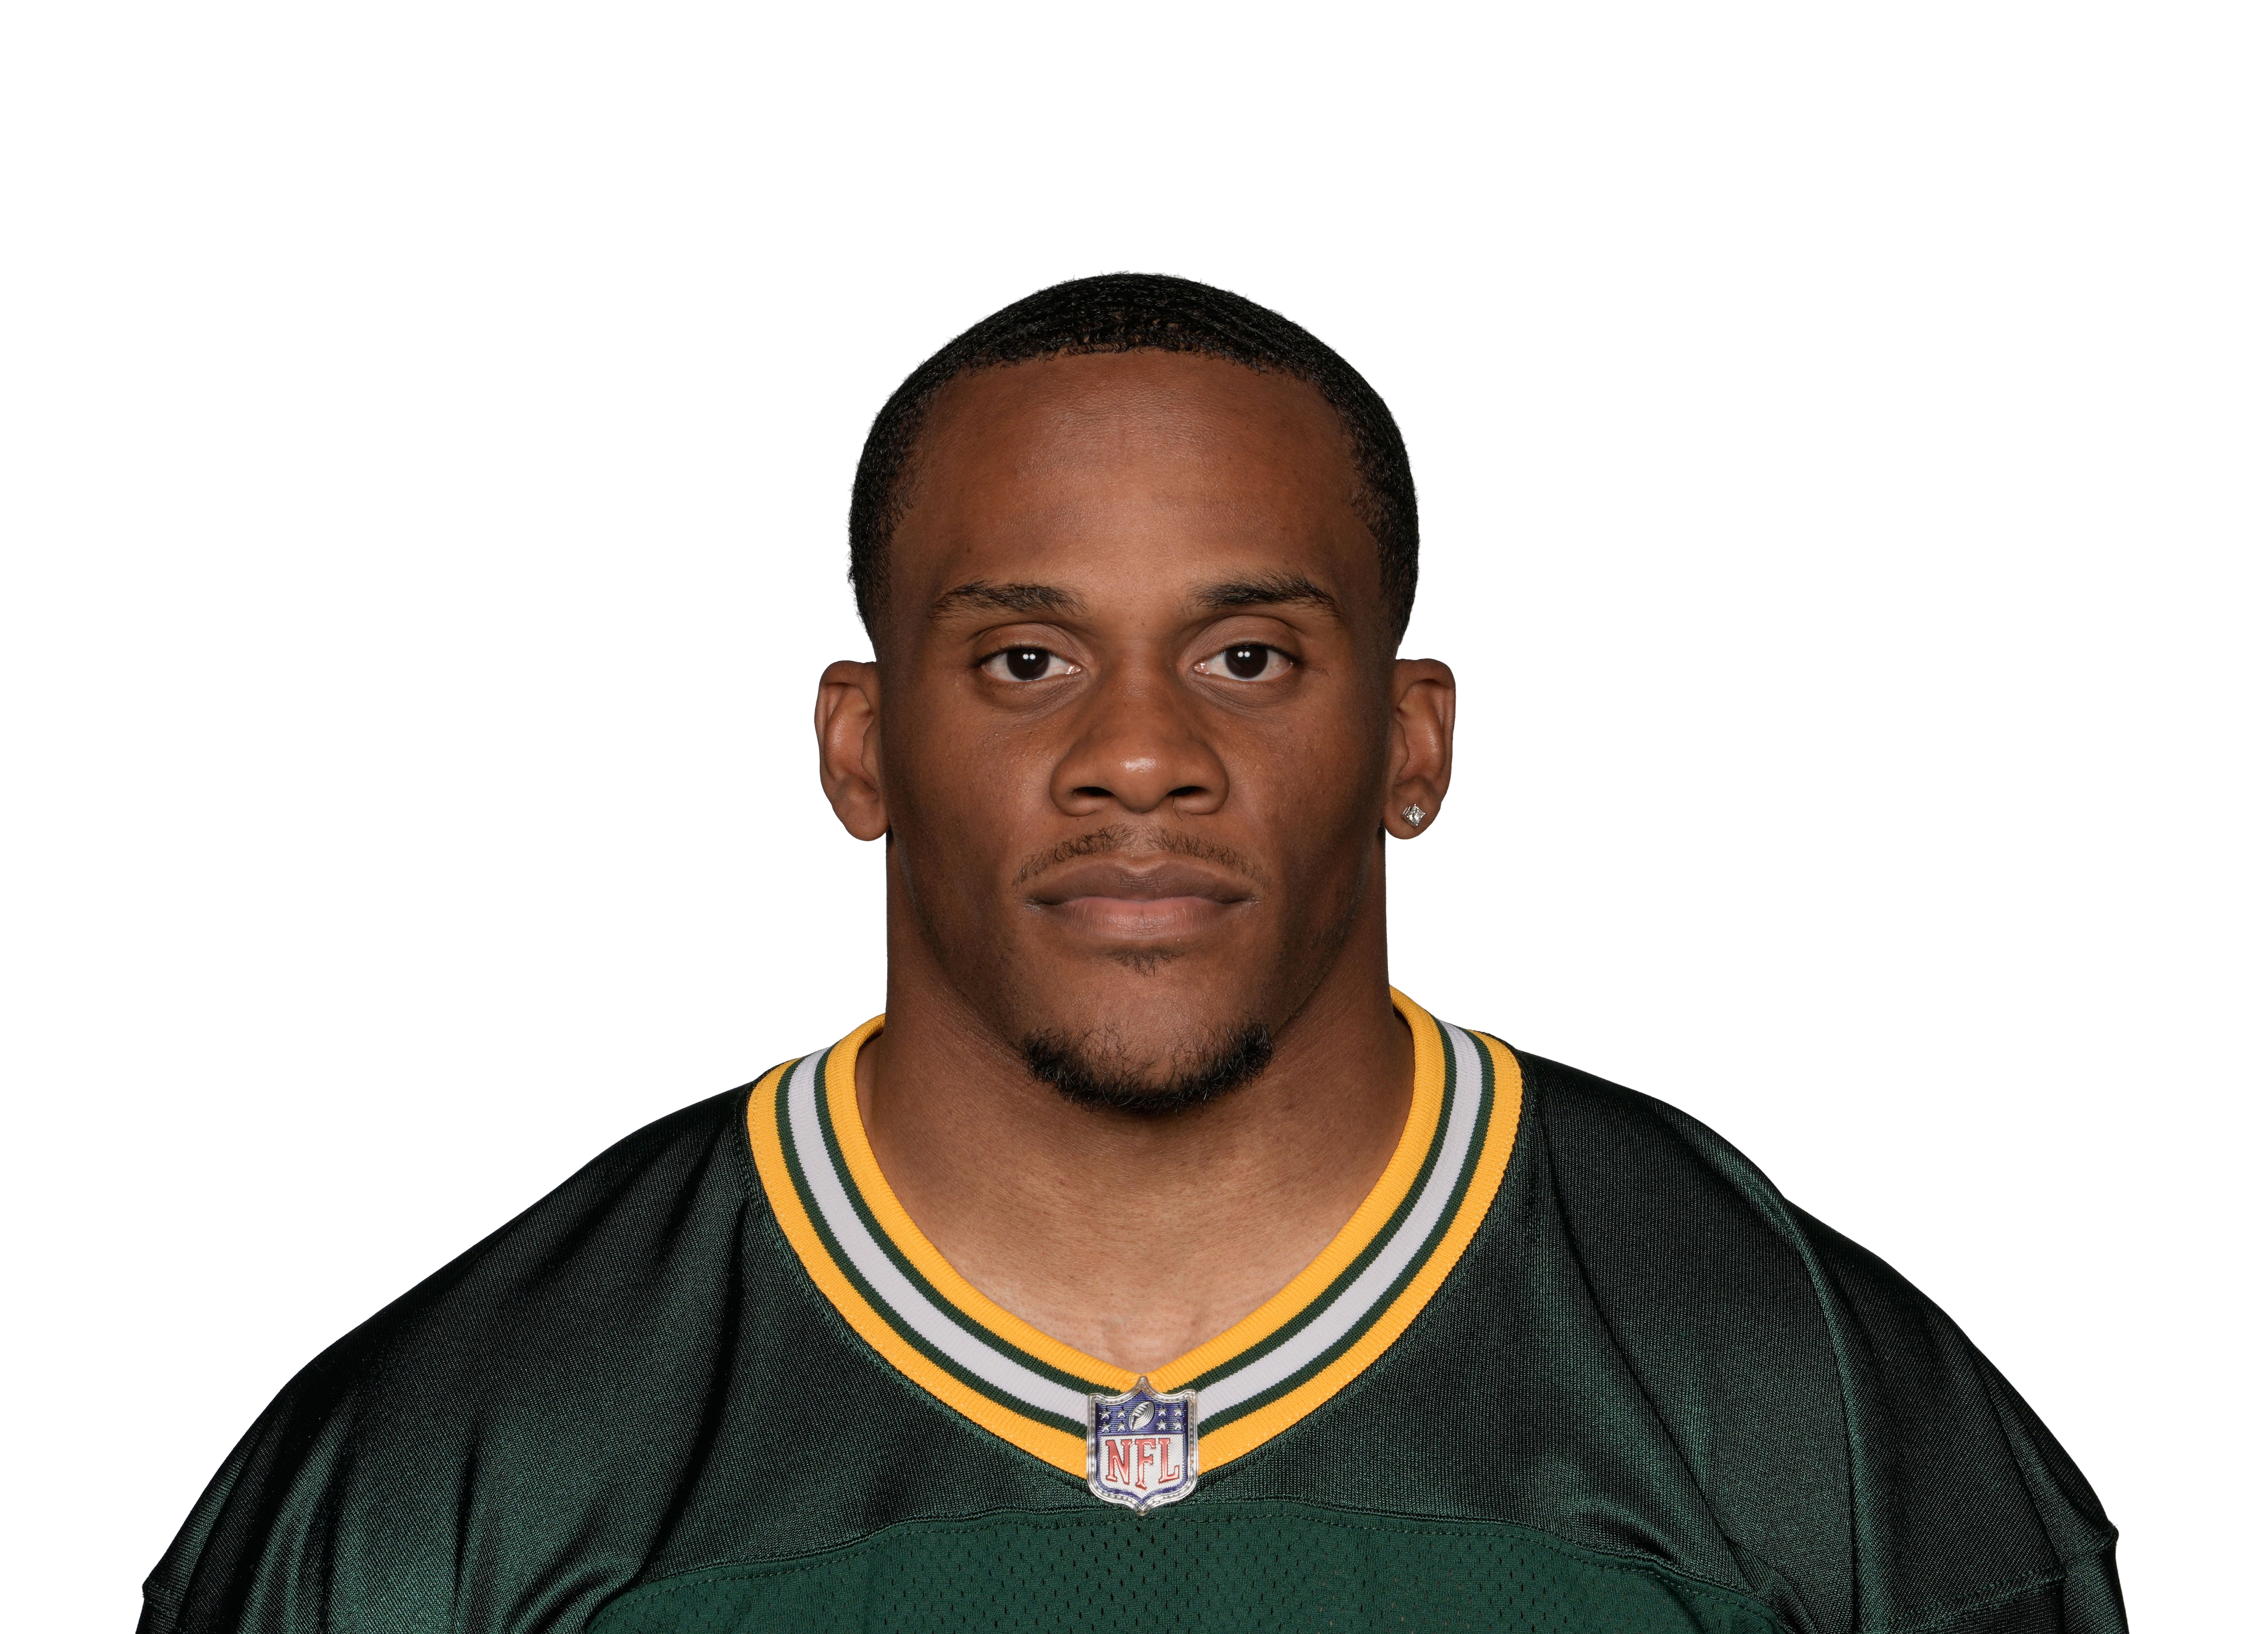 MarShawn Lloydvs GB • Wk 2 | 8.6 | 6 | 20 | 0 | 2 | 6 |
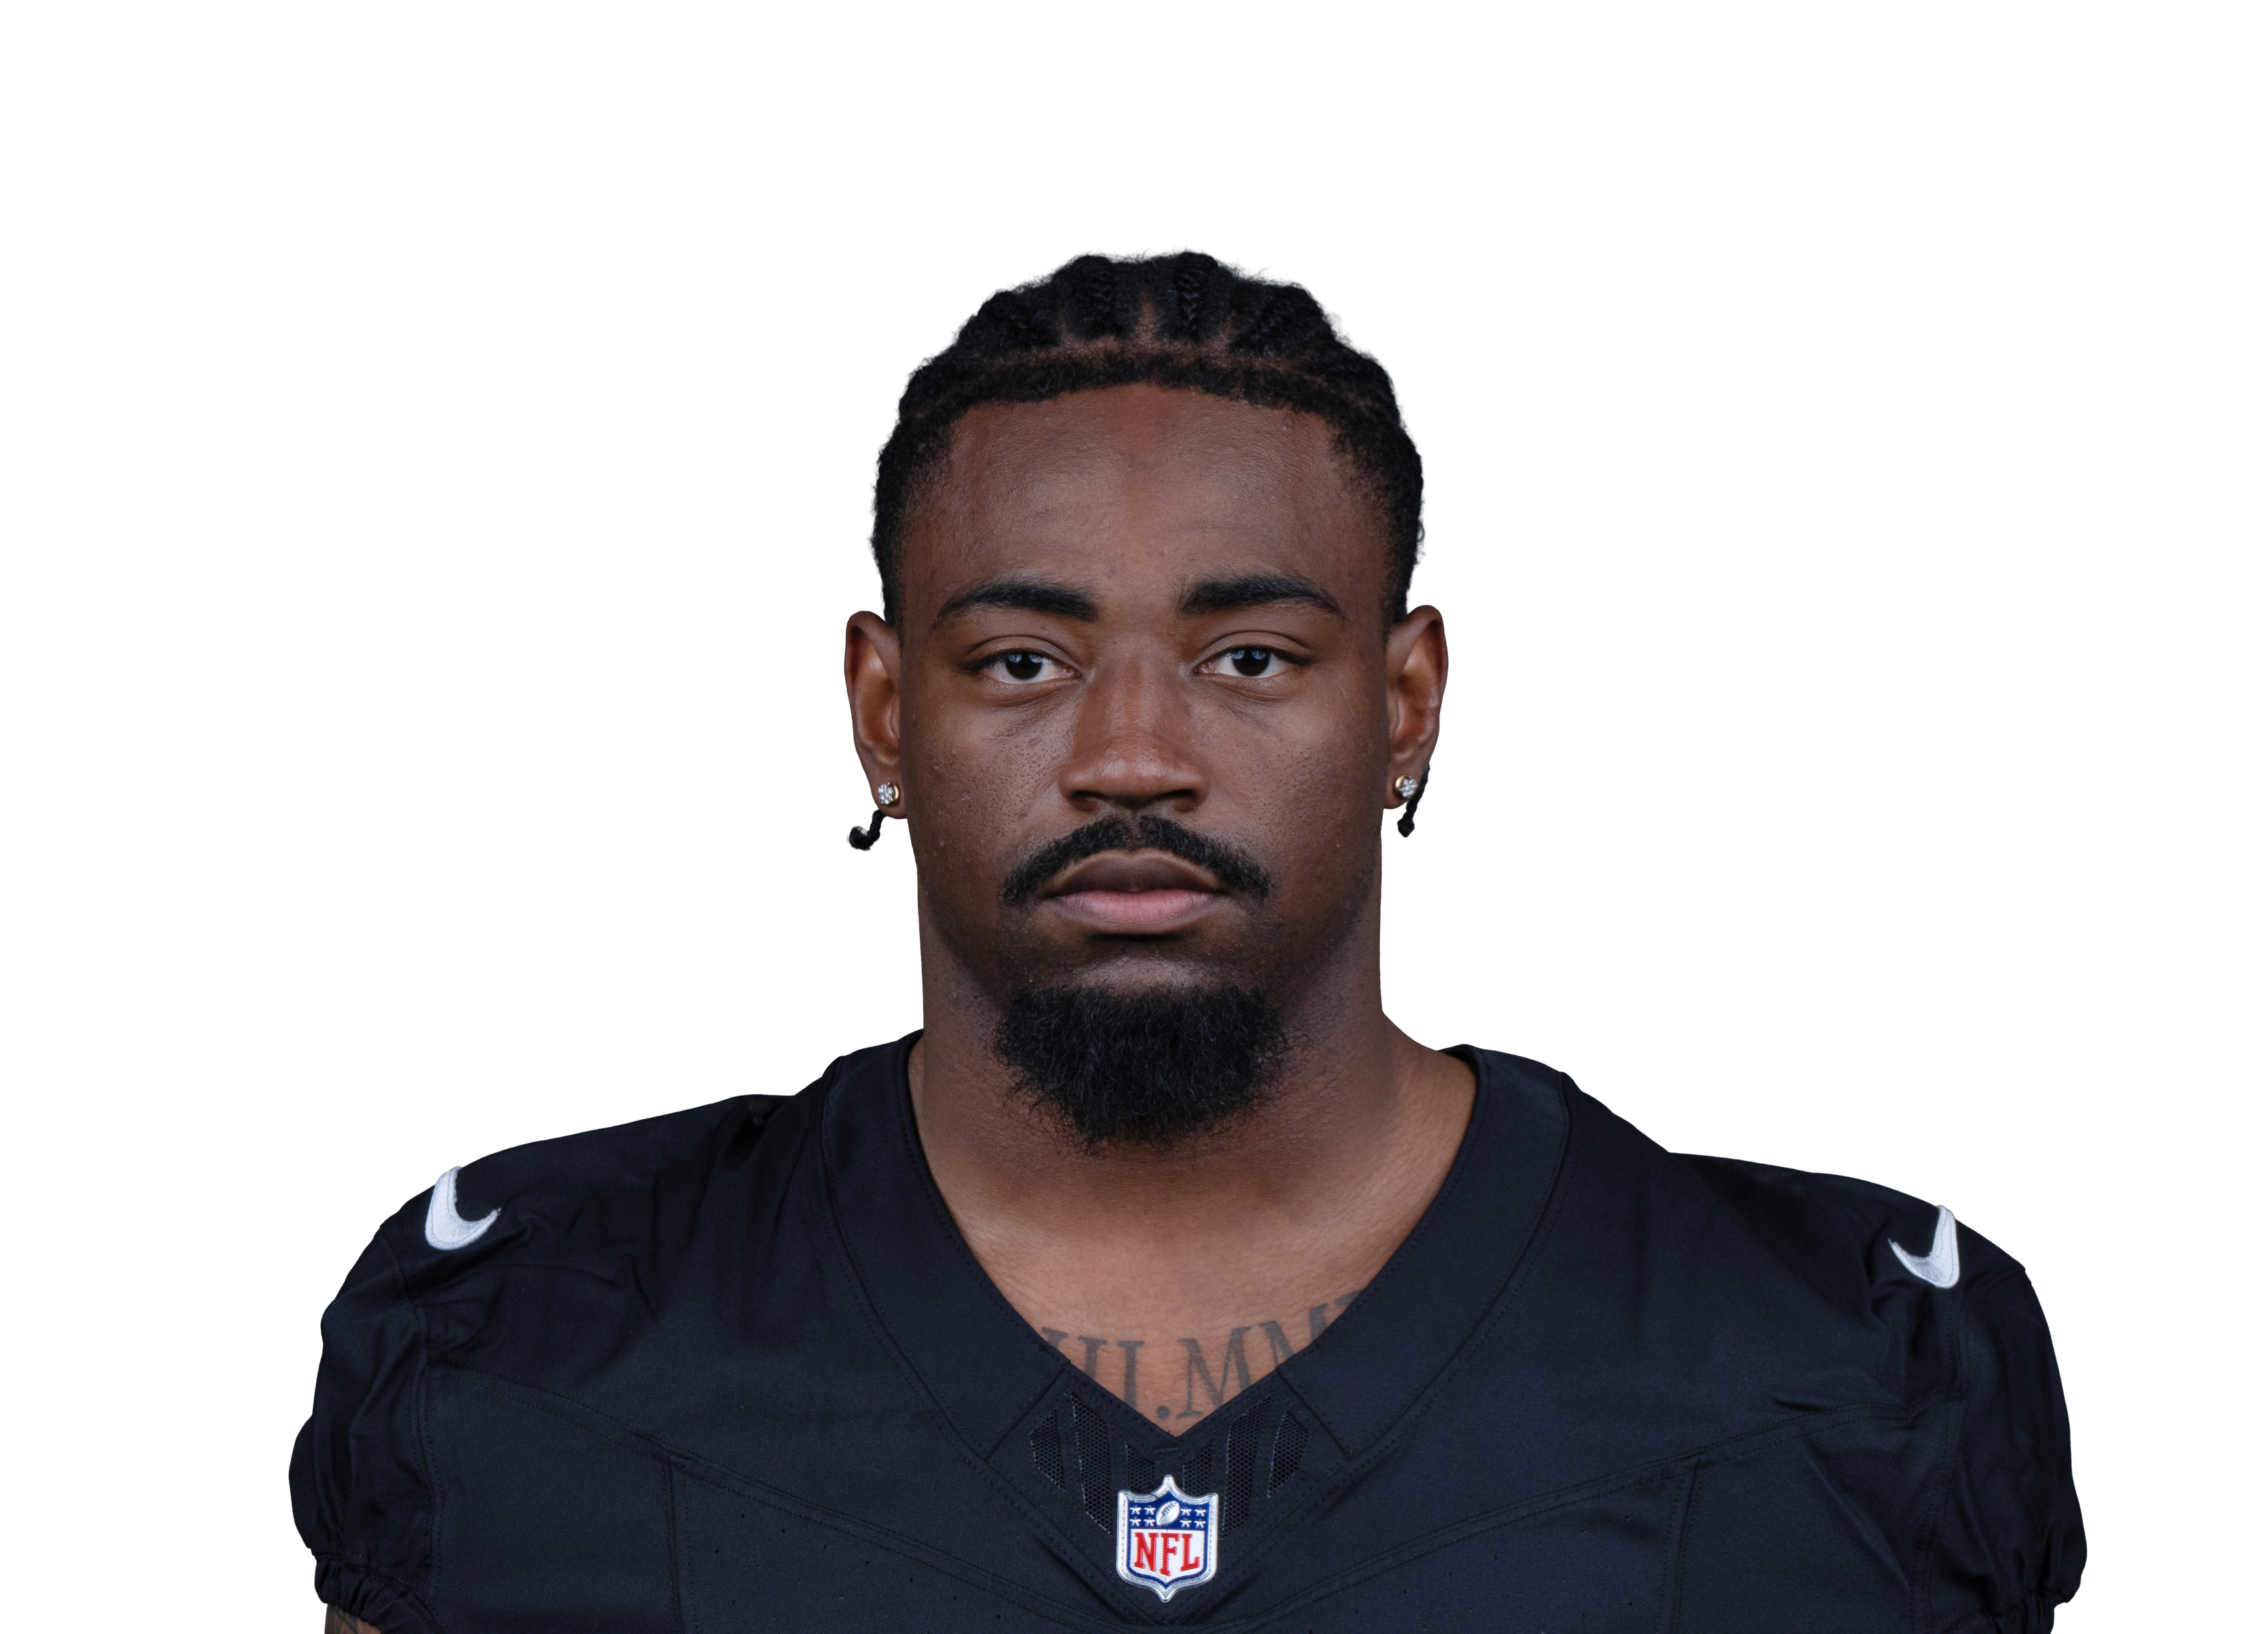 Mike Washington Jr.vs LV • Wk 8 | 8.3 | 25 | 83 | 0 | 0 | 0 |
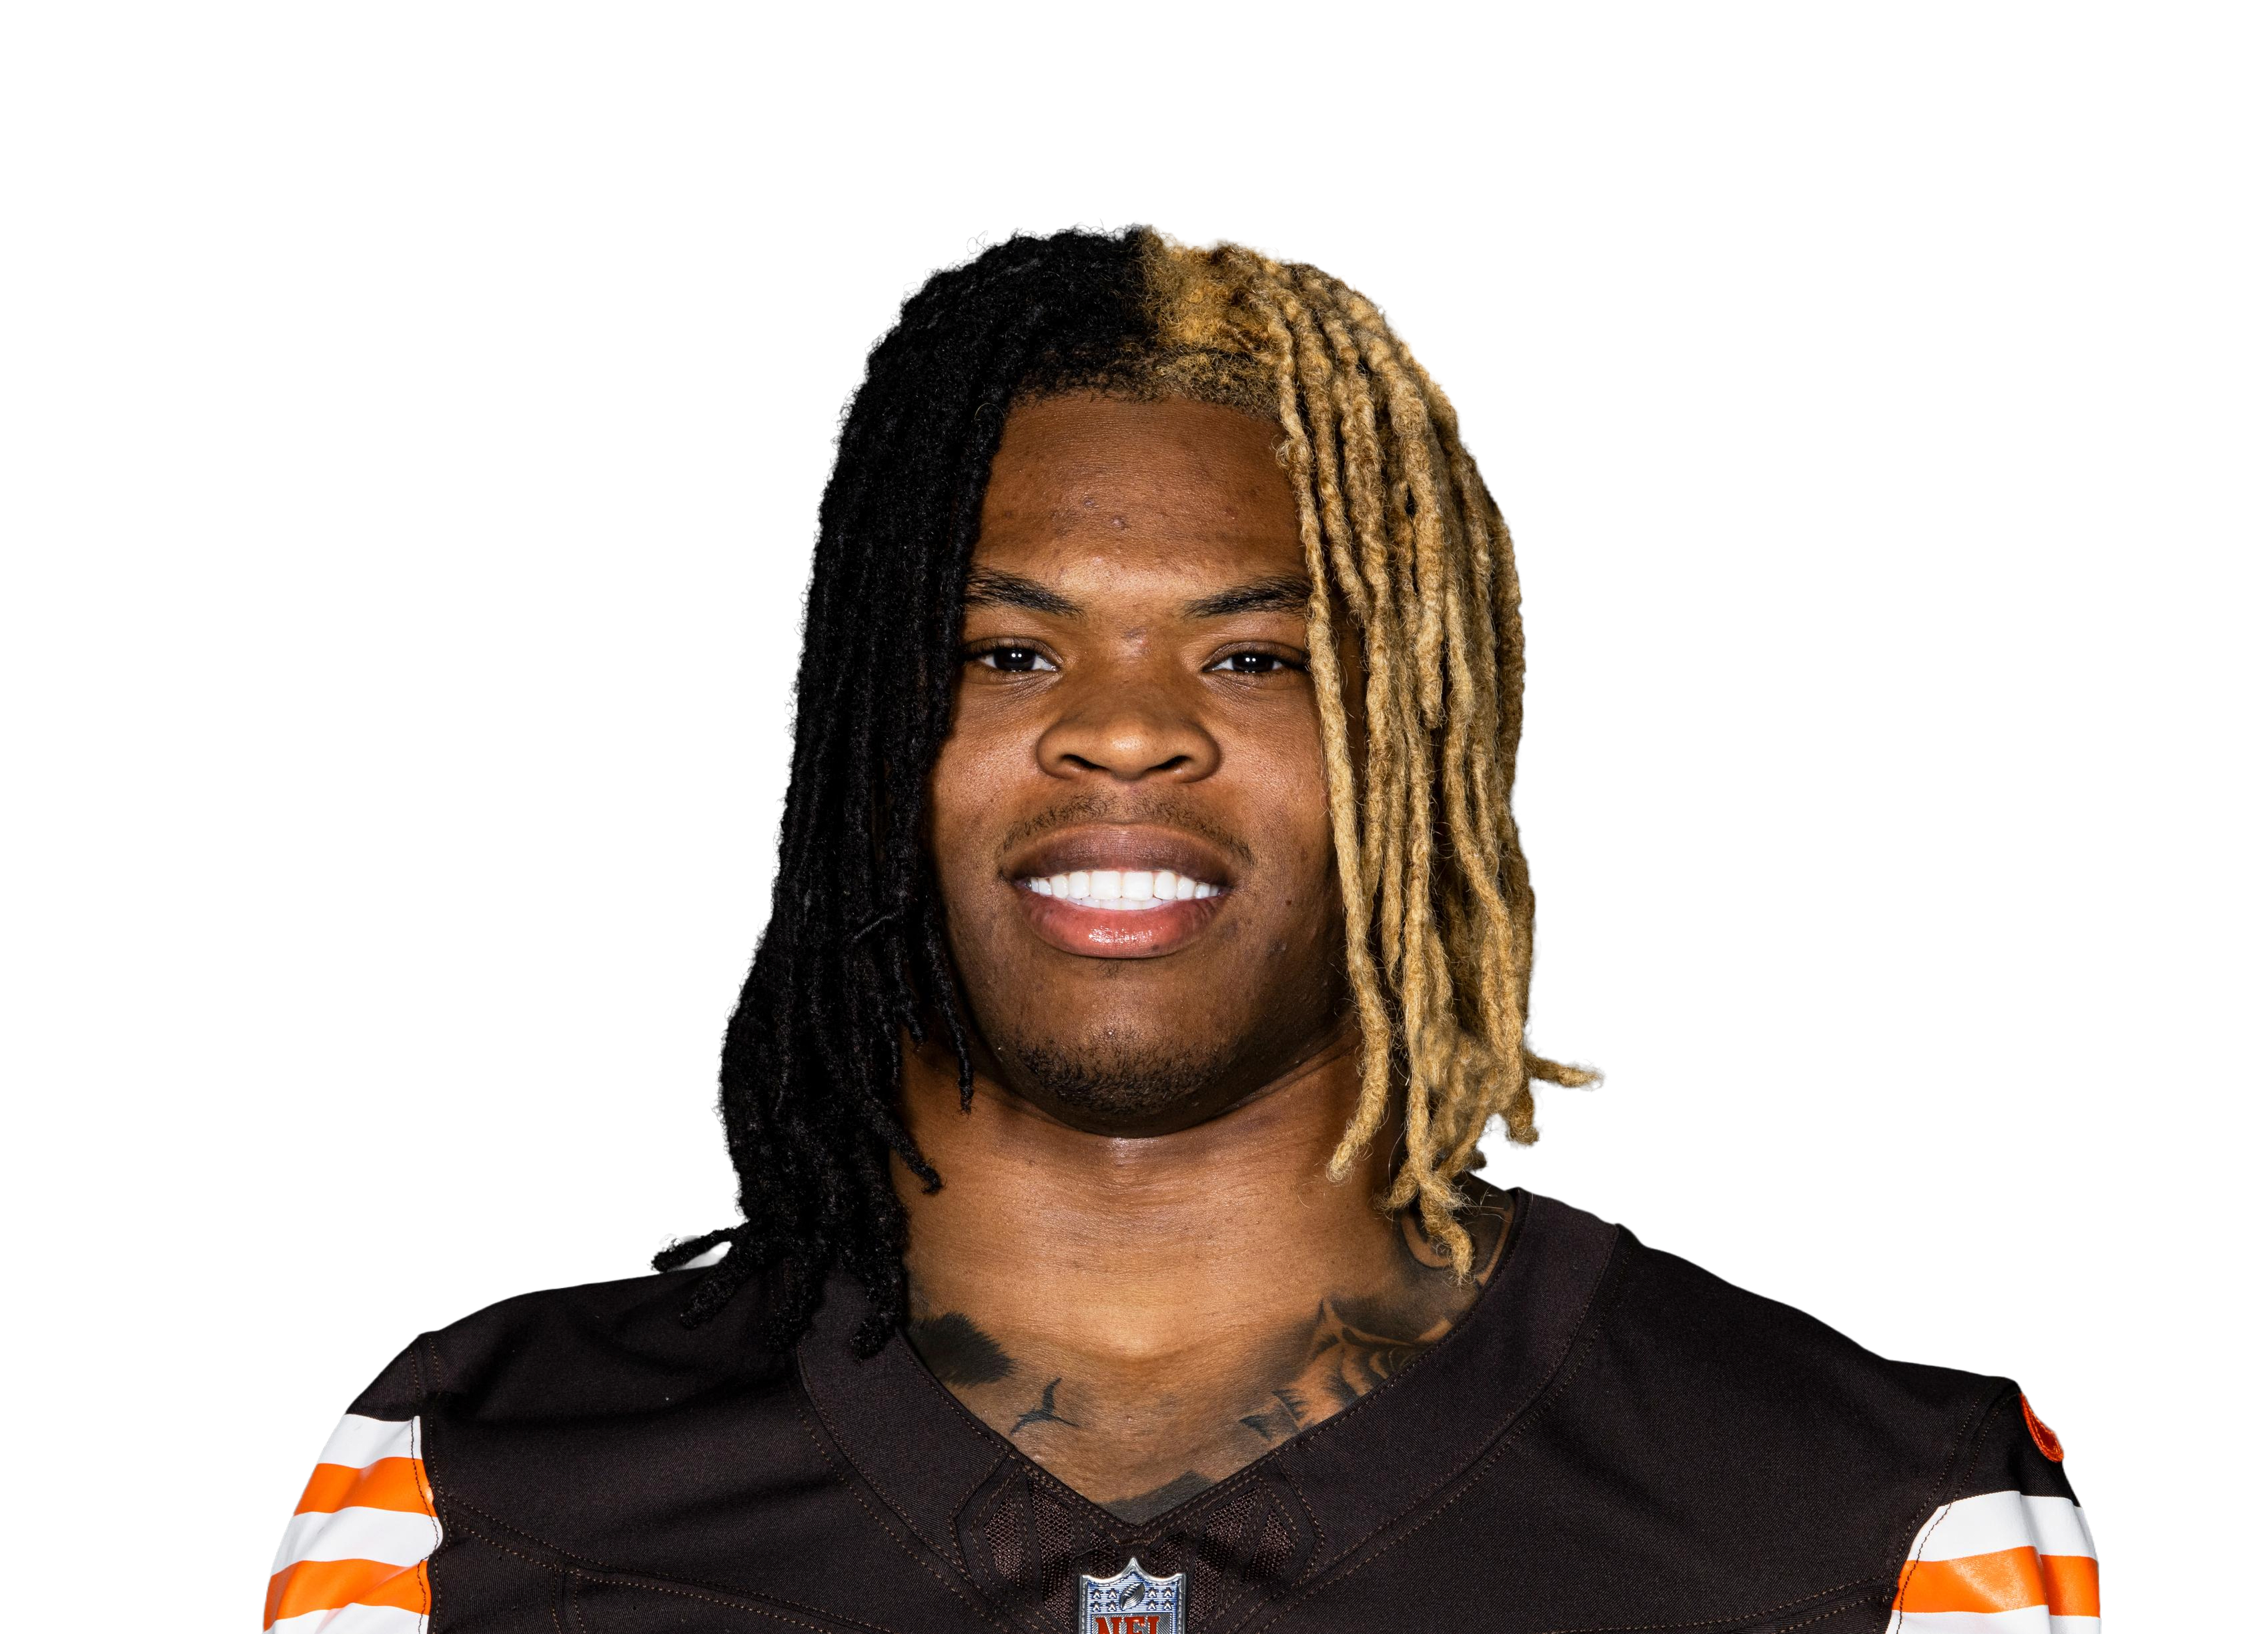 Quinshon Judkinsvs CLE • Wk 5 | 8.0 | 14 | 44 | 0 | 3 | 6 |
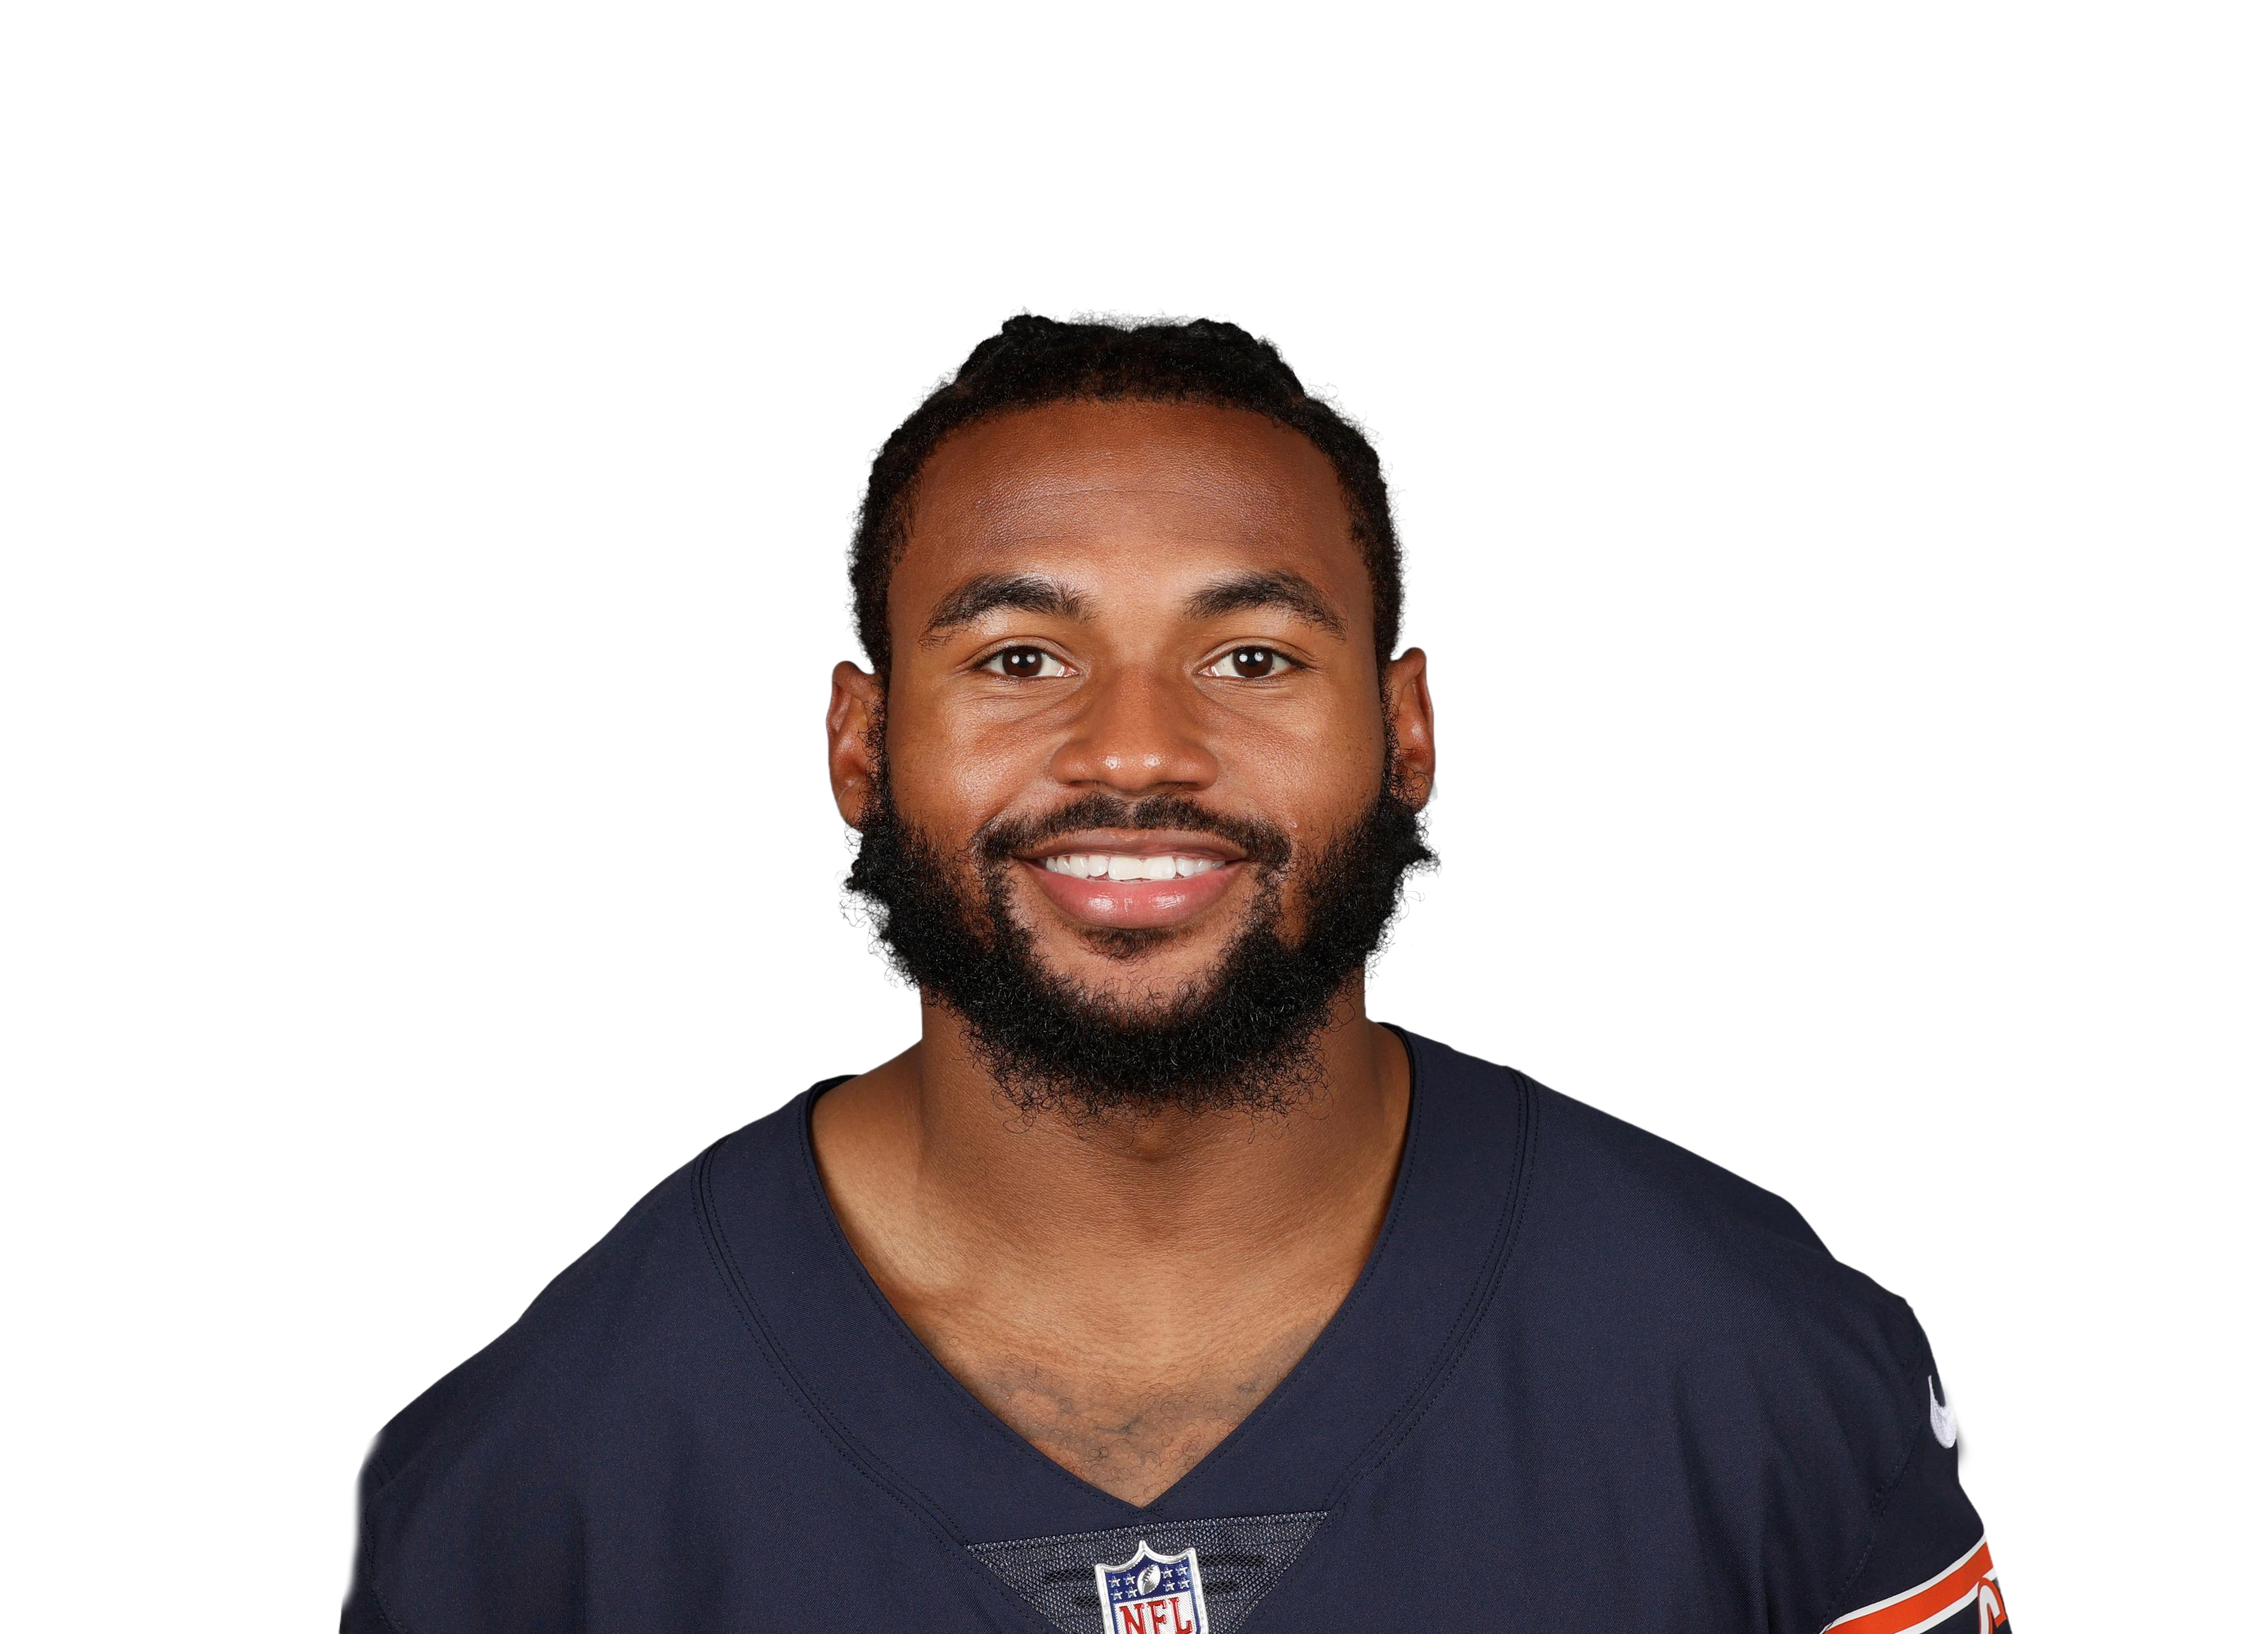 D'Andre Swift@ CHI • Wk 4 | 7.4 | 15 | 58 | 0 | 2 | 16 |
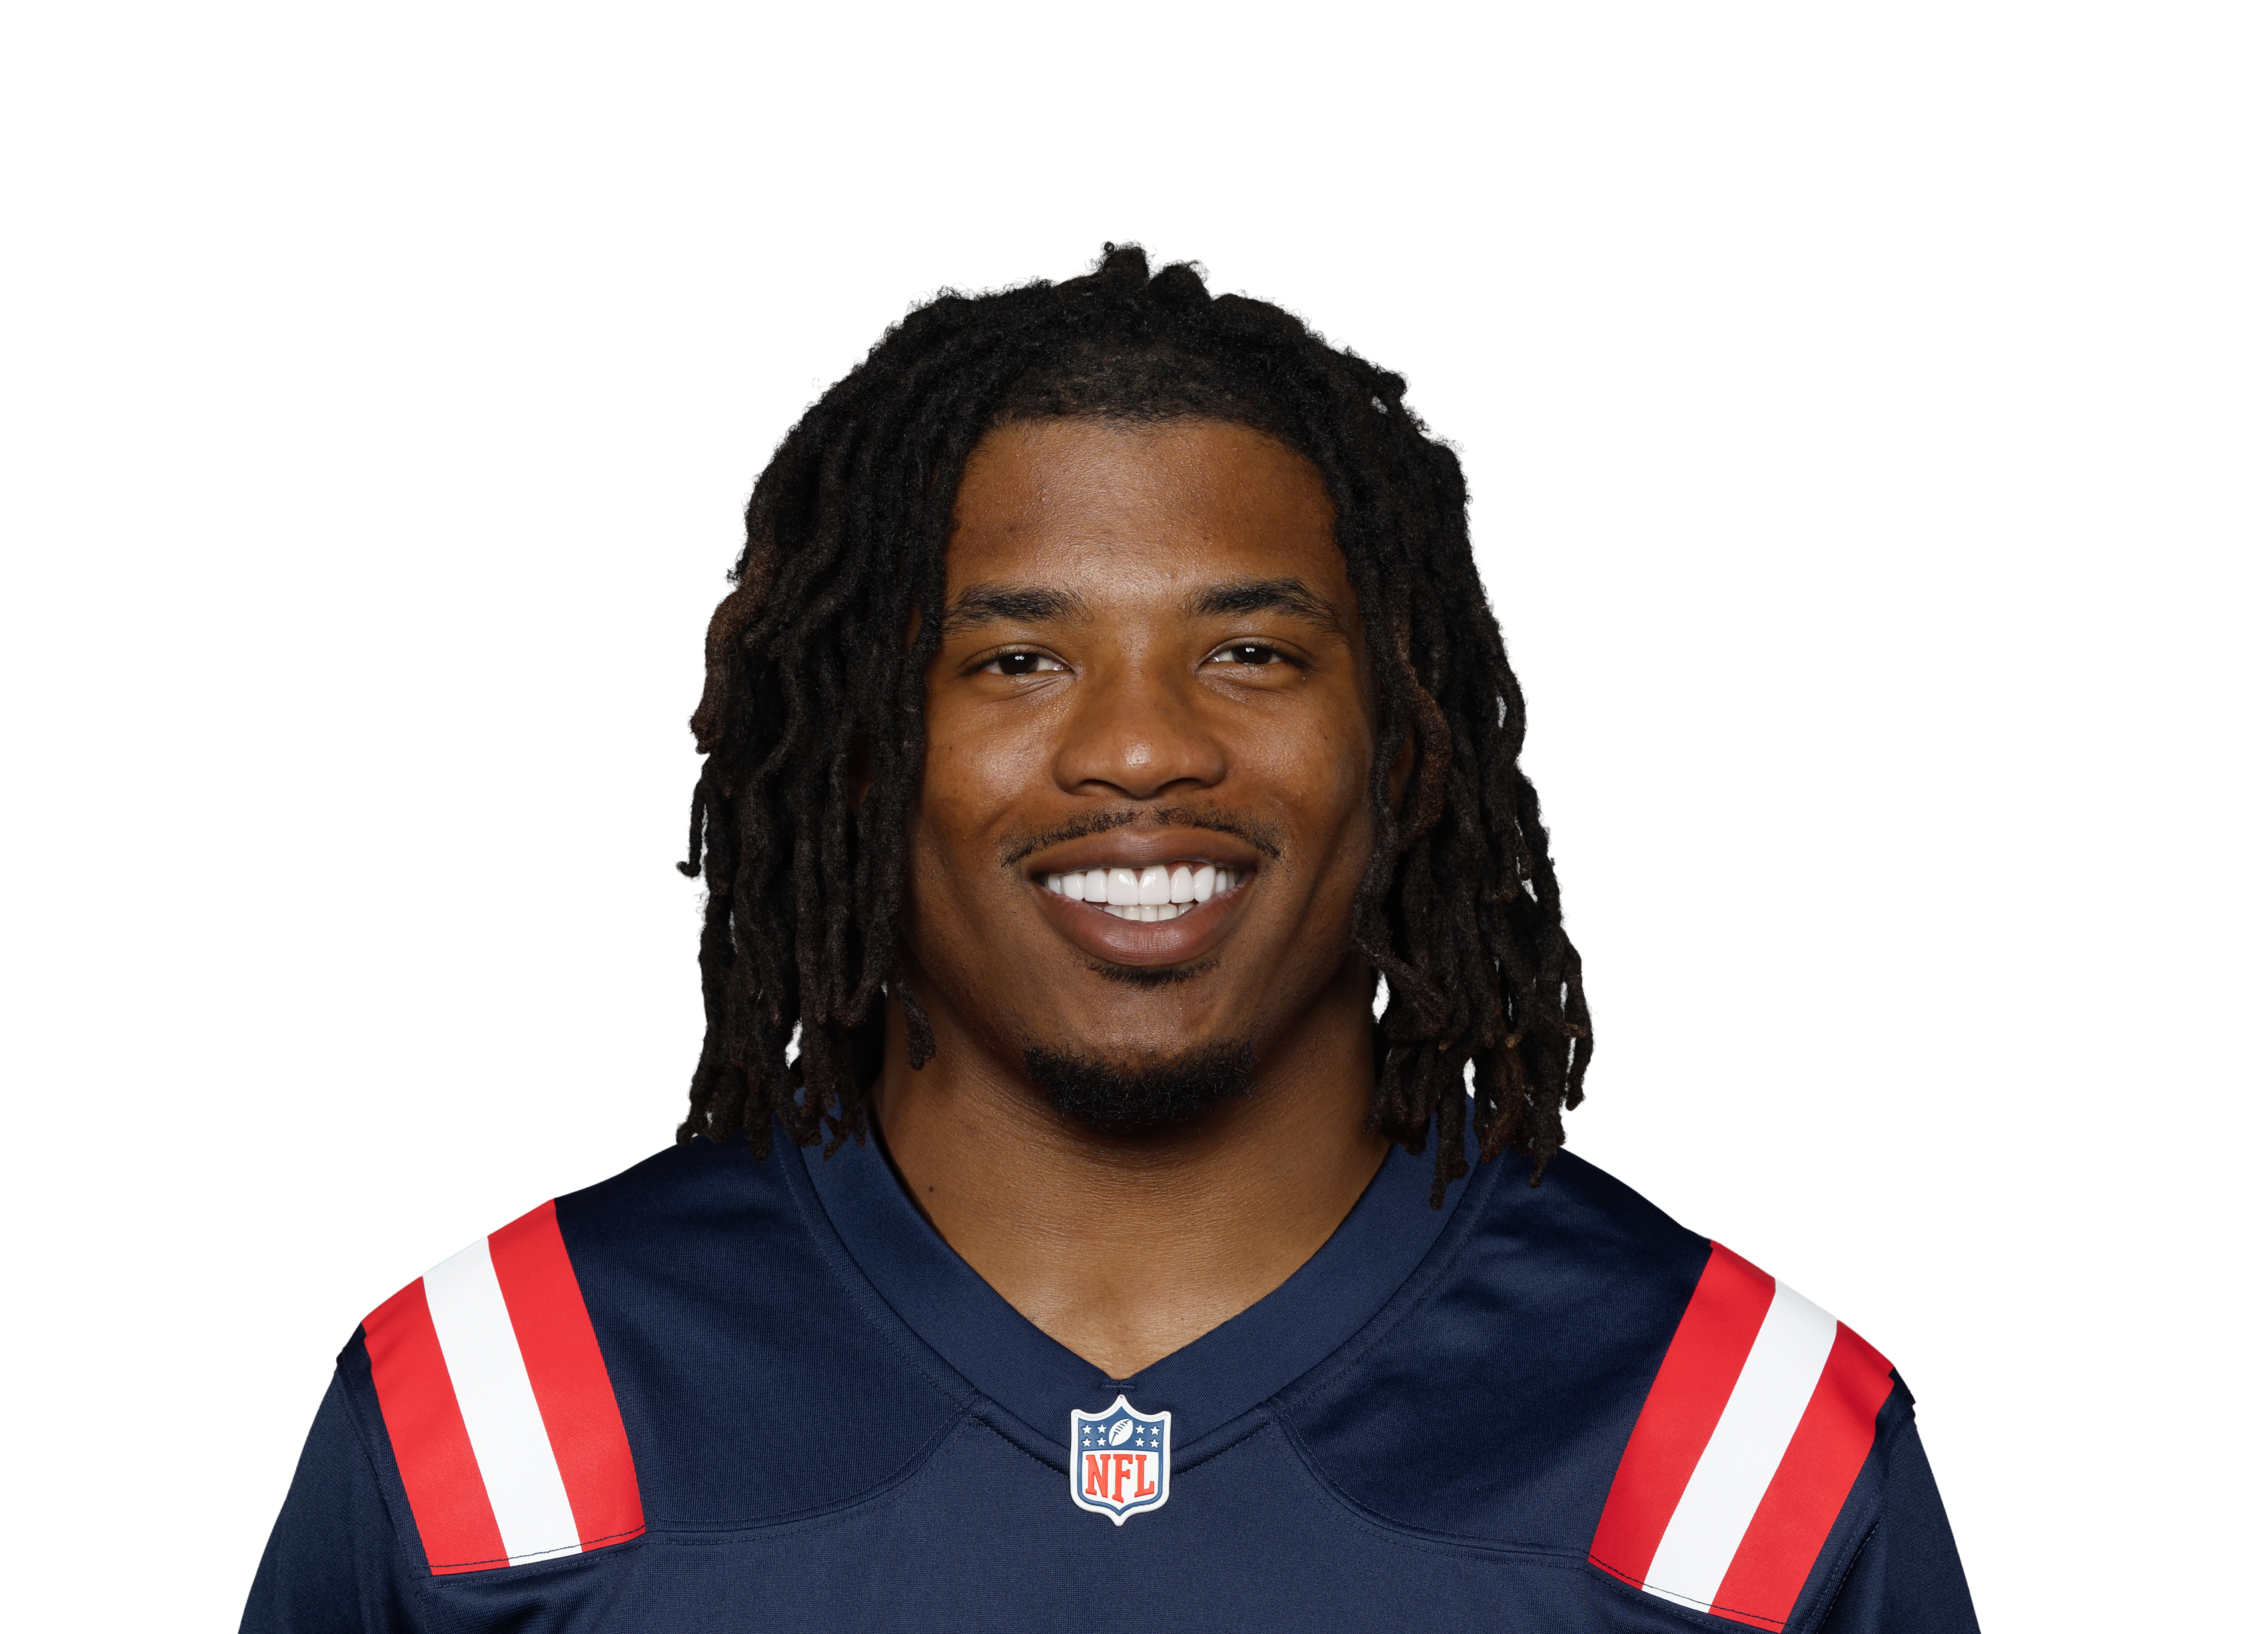 Corey Kiner@ NE • Wk 6 | 5.7 | 11 | 57 | 0 | 0 | 0 |
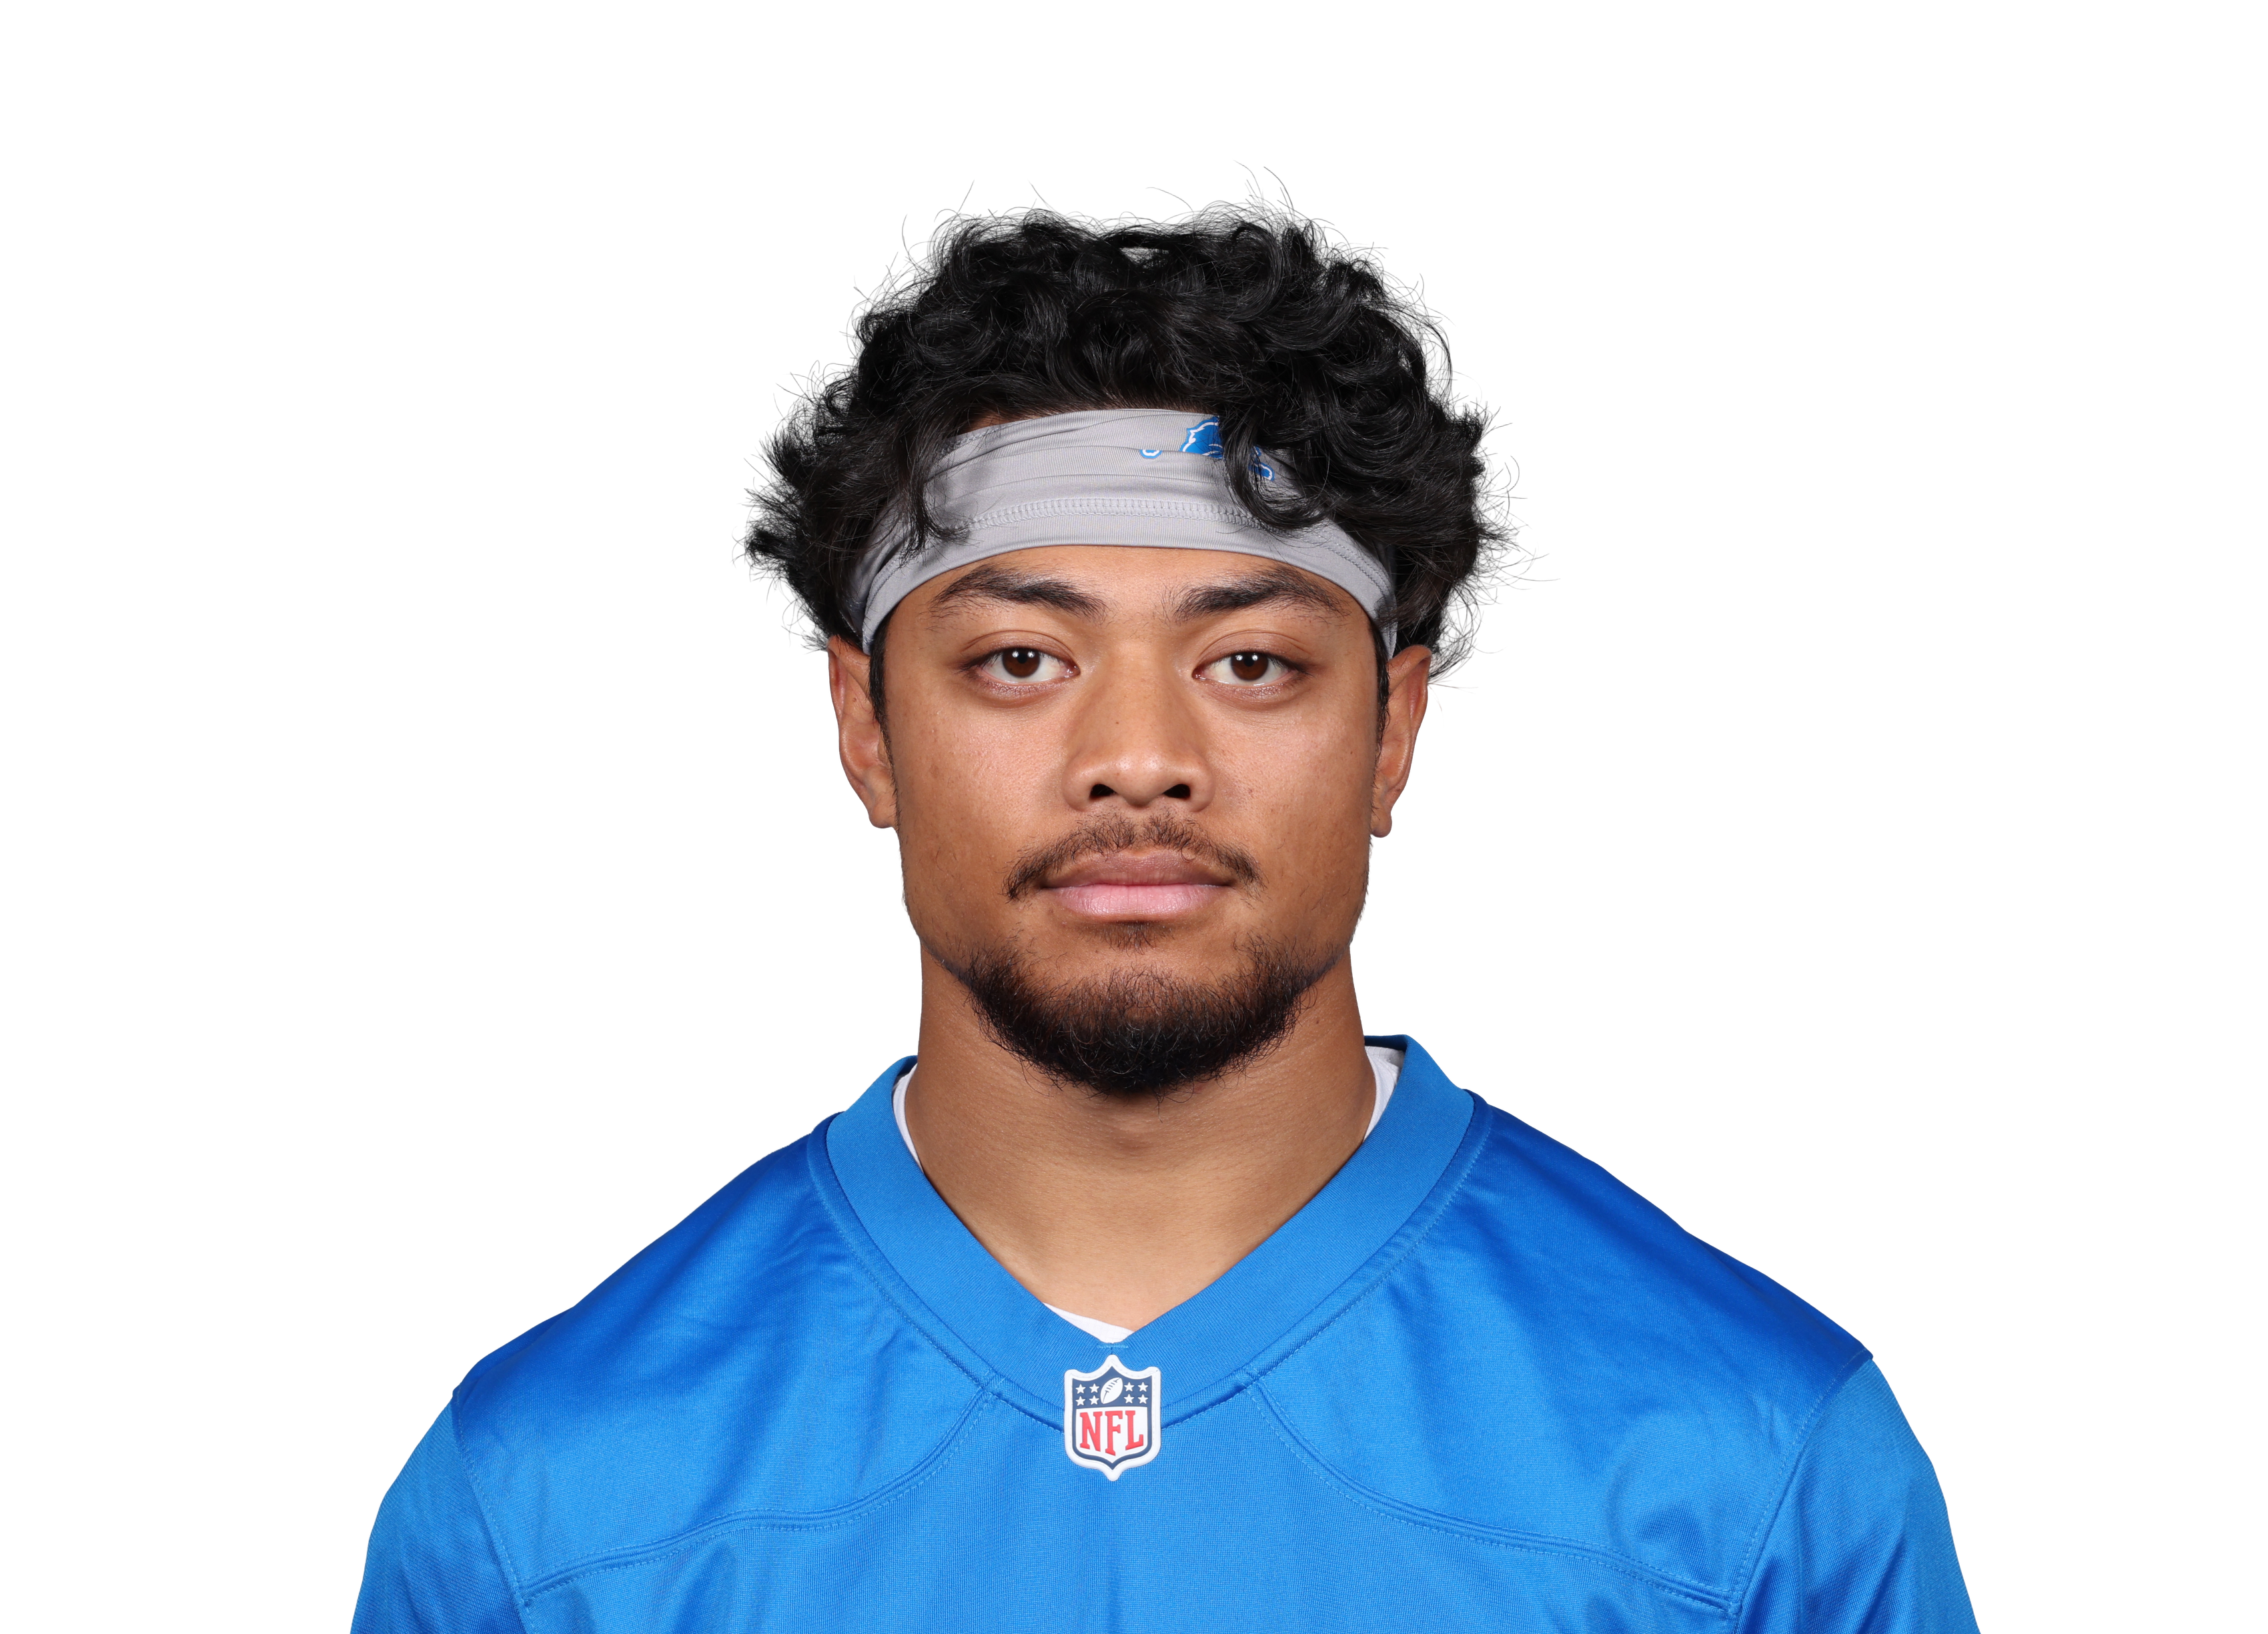 Sione Vaki@ DET • Wk 3 | 4.7 | 6 | 26 | 0 | 1 | 11 |
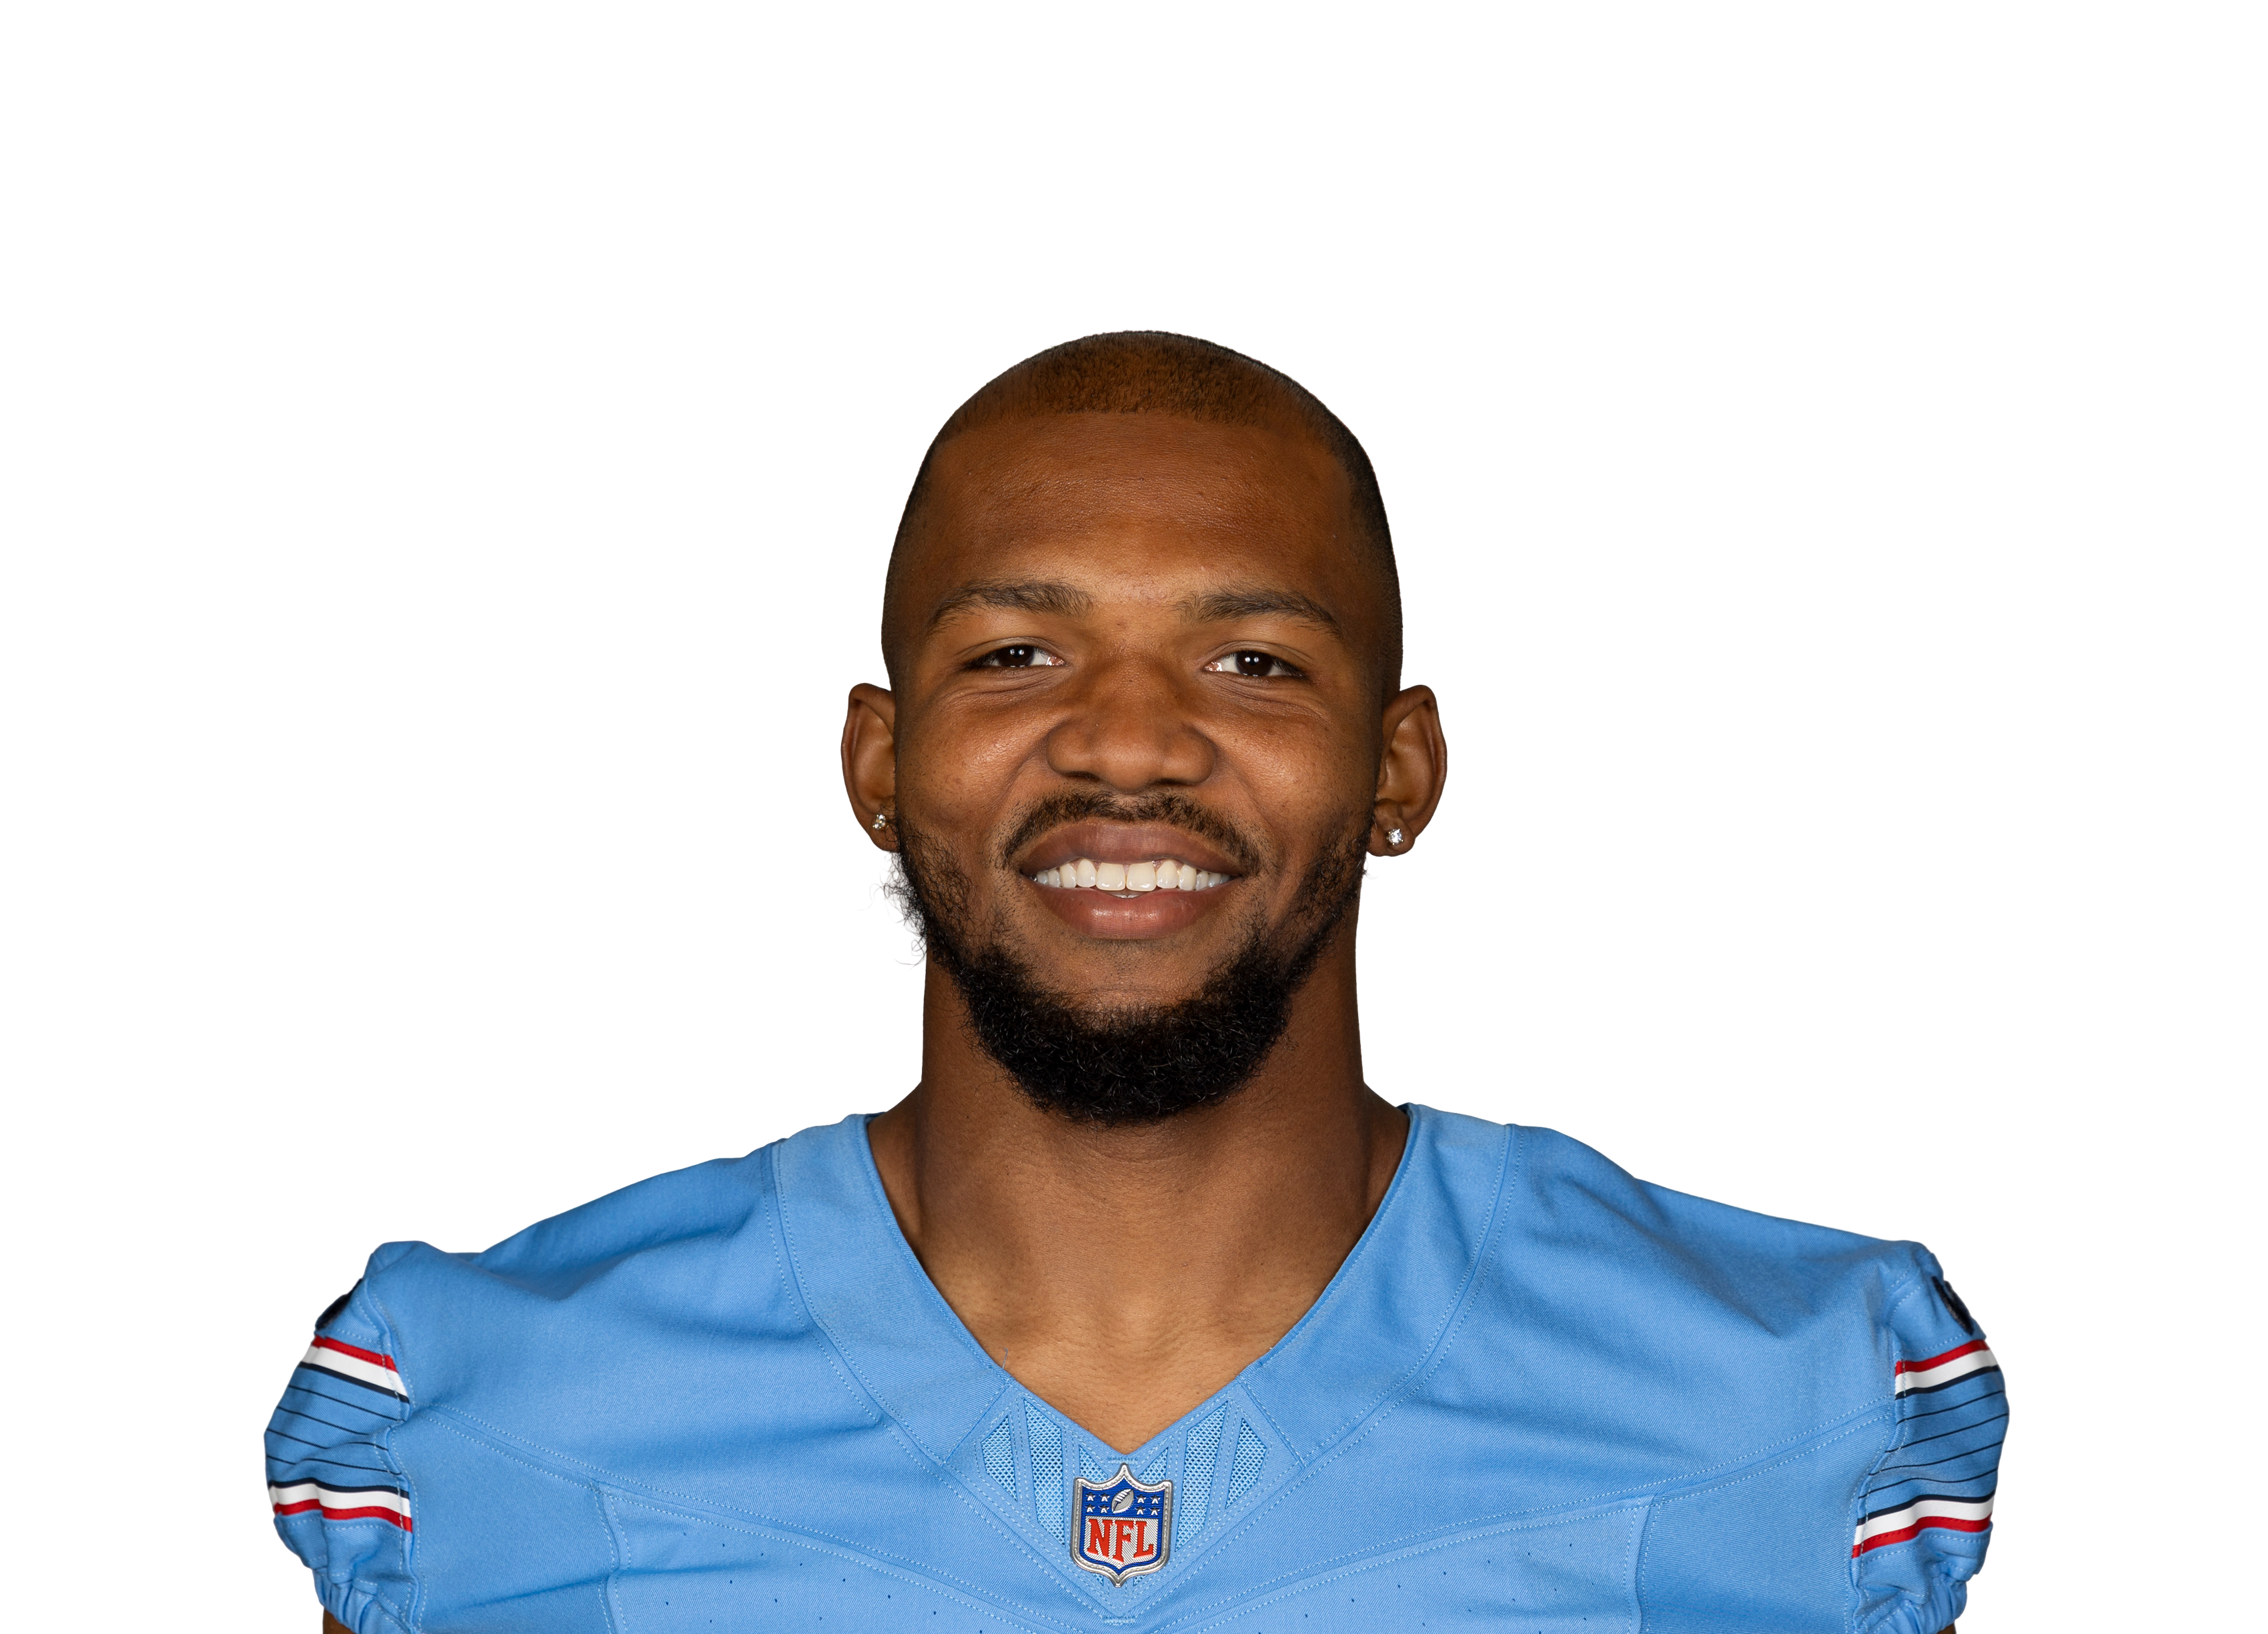 Tony Pollard@ TEN • Wk 1 | 4.4 | 7 | 35 | 0 | 1 | -1 |
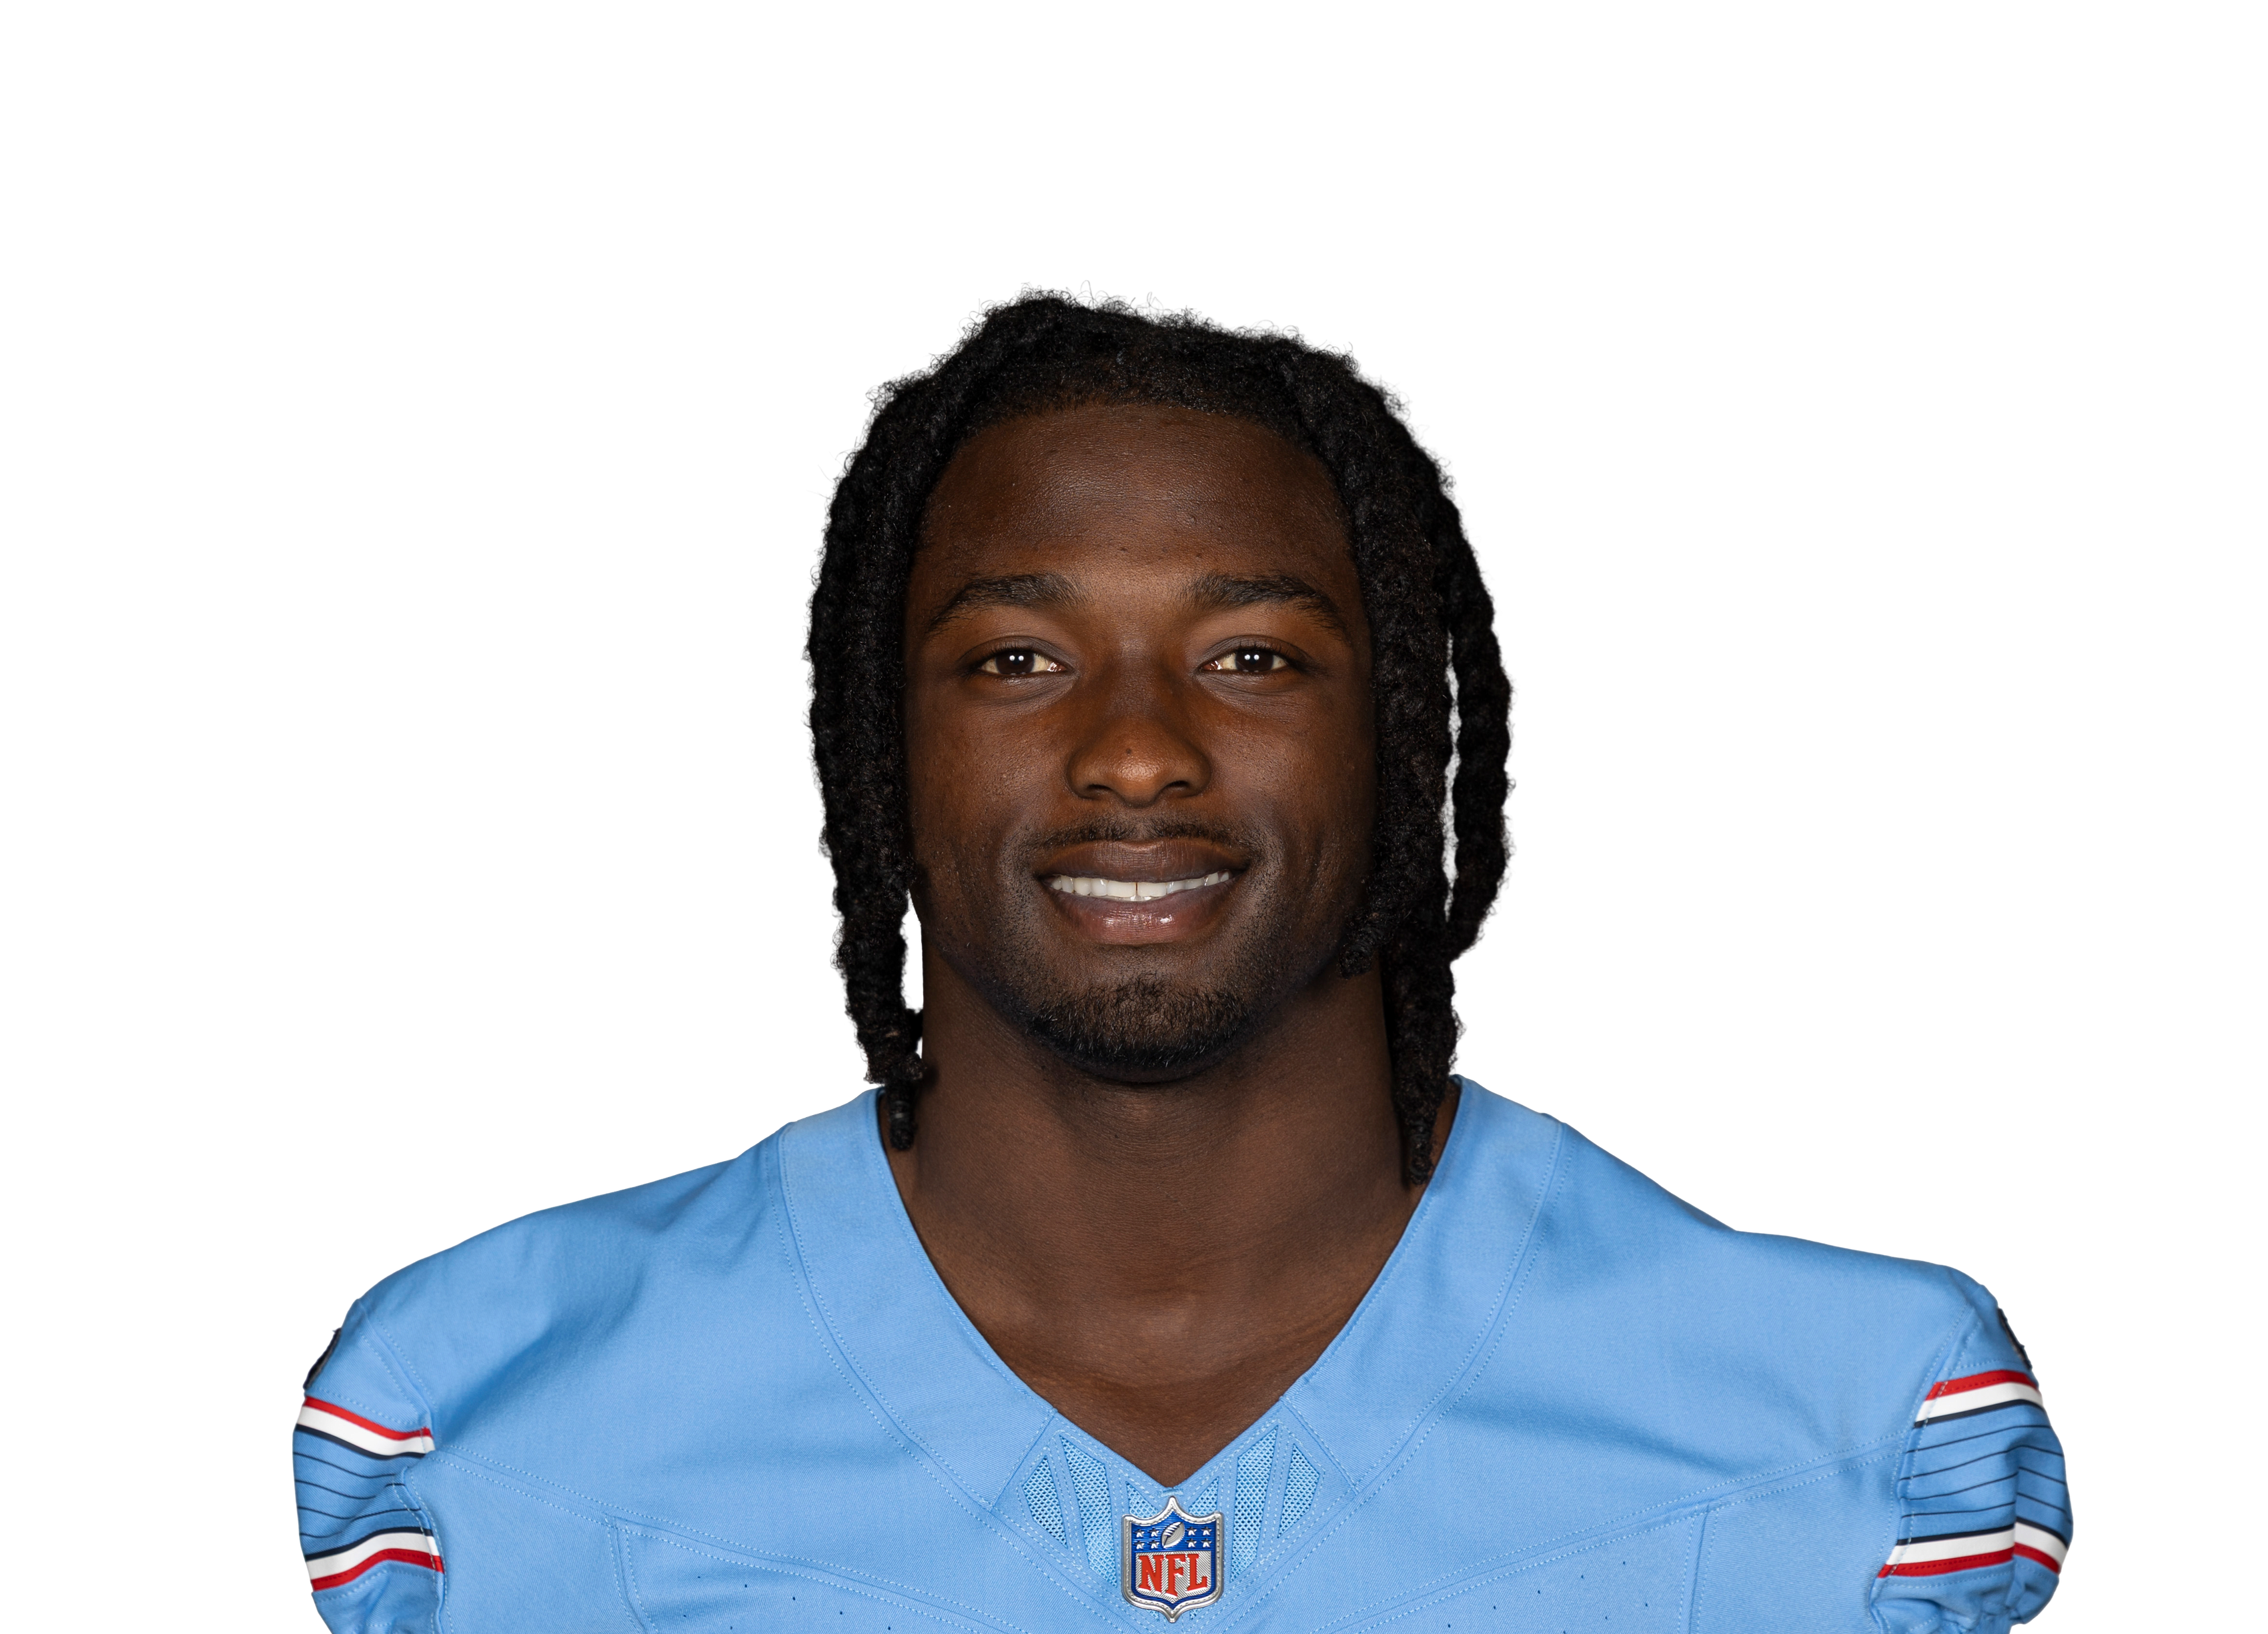 Tyjae Spears@ TEN • Wk 1 | 4.4 | 3 | 12 | 0 | 2 | 12 |
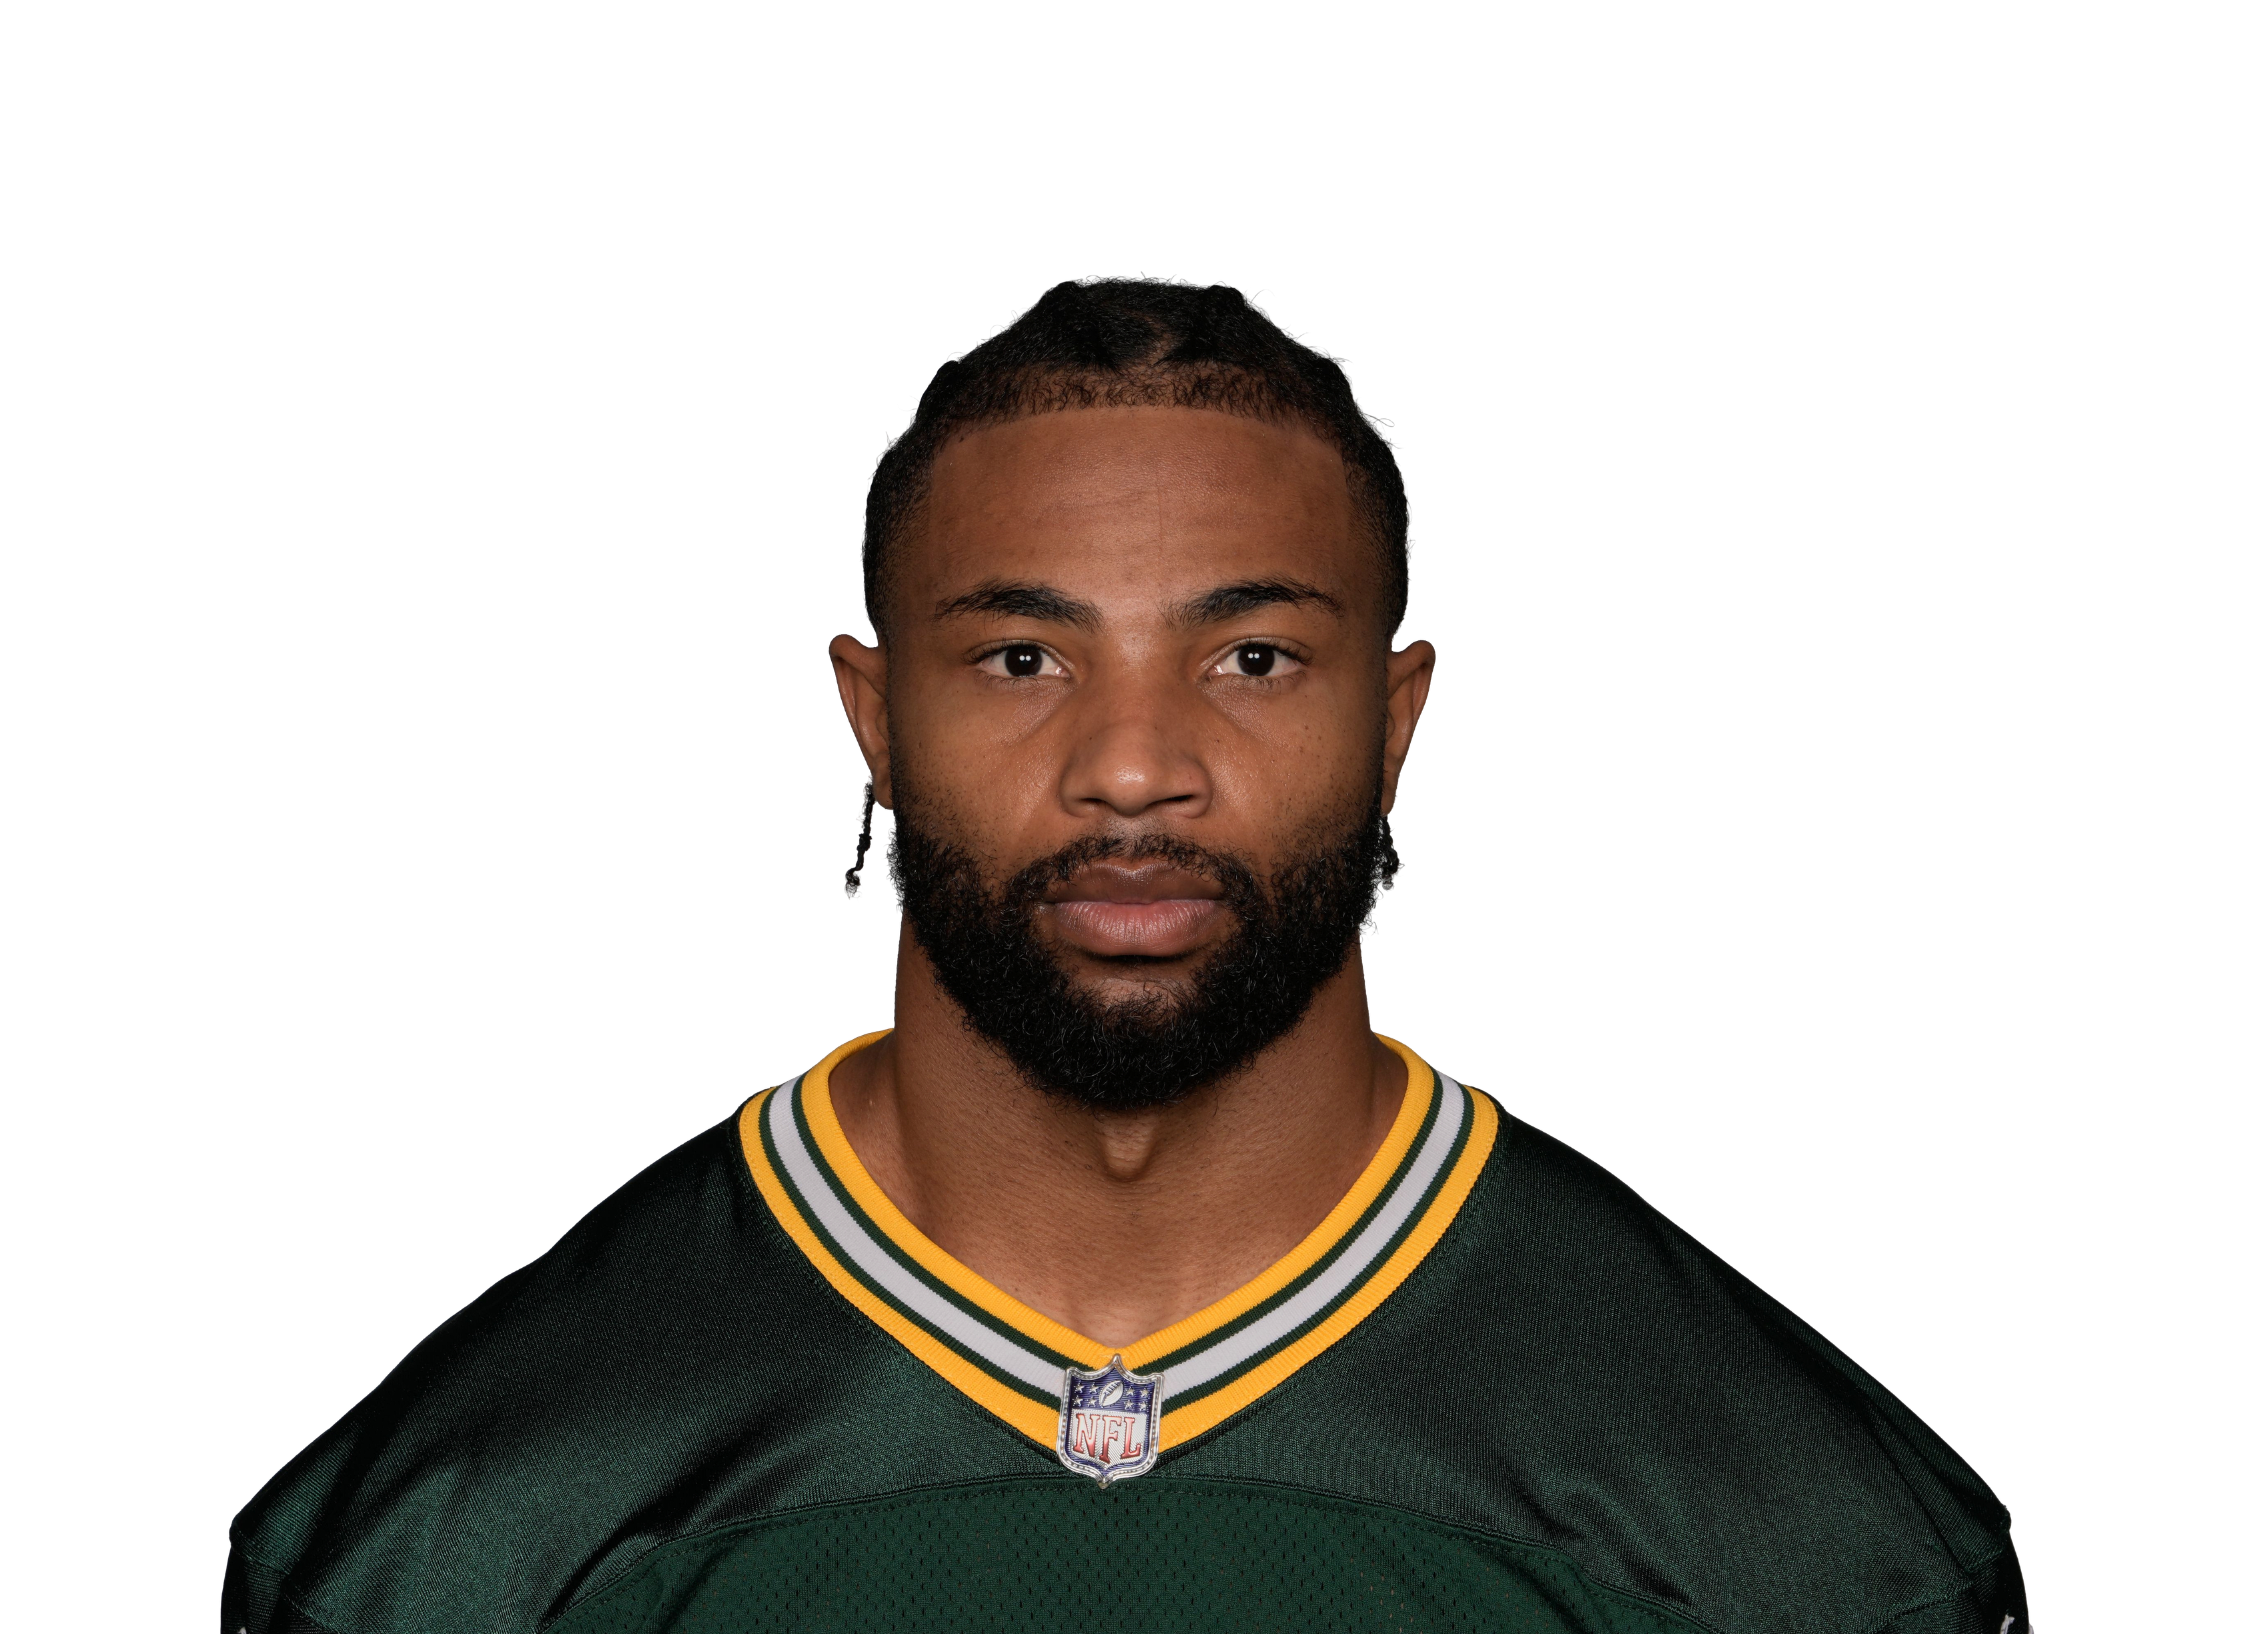 Chris Brooksvs GB • Wk 2 | 3.6 | 4 | 11 | 0 | 1 | 15 |
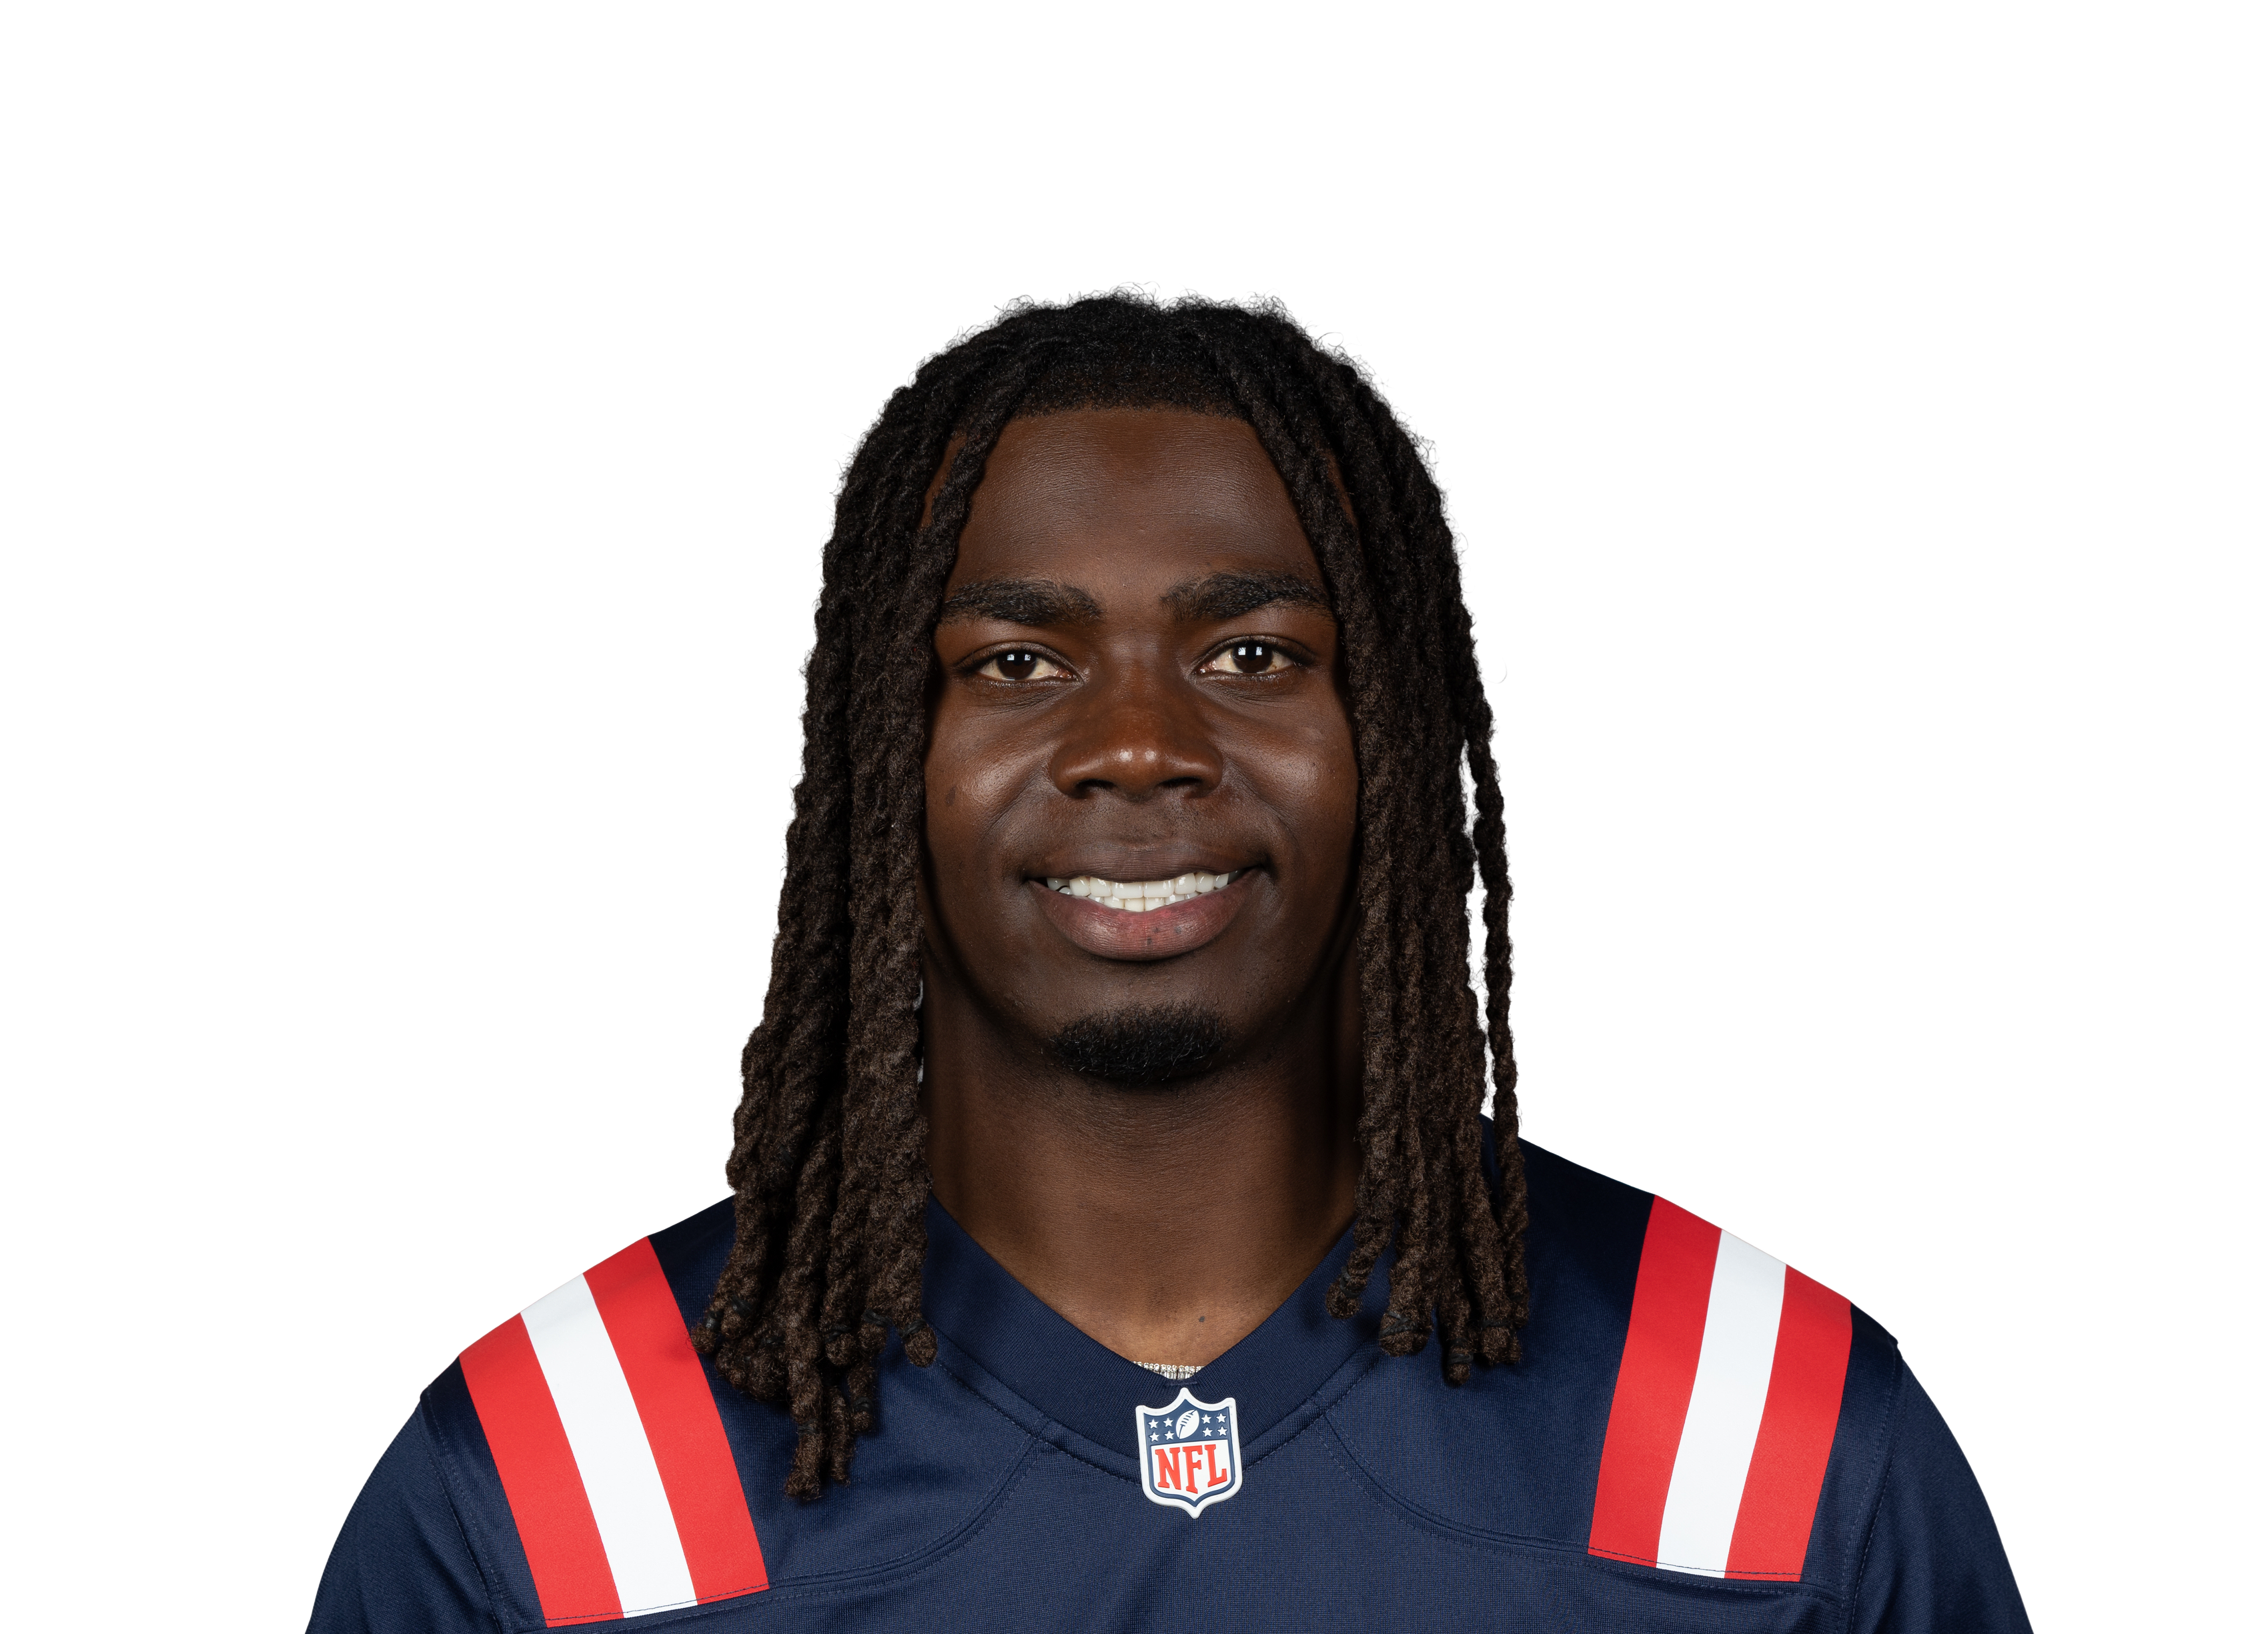 Rhamondre Stevenson@ NE • Wk 6 | 3.6 | 14 | 36 | 0 | 0 | 0 |
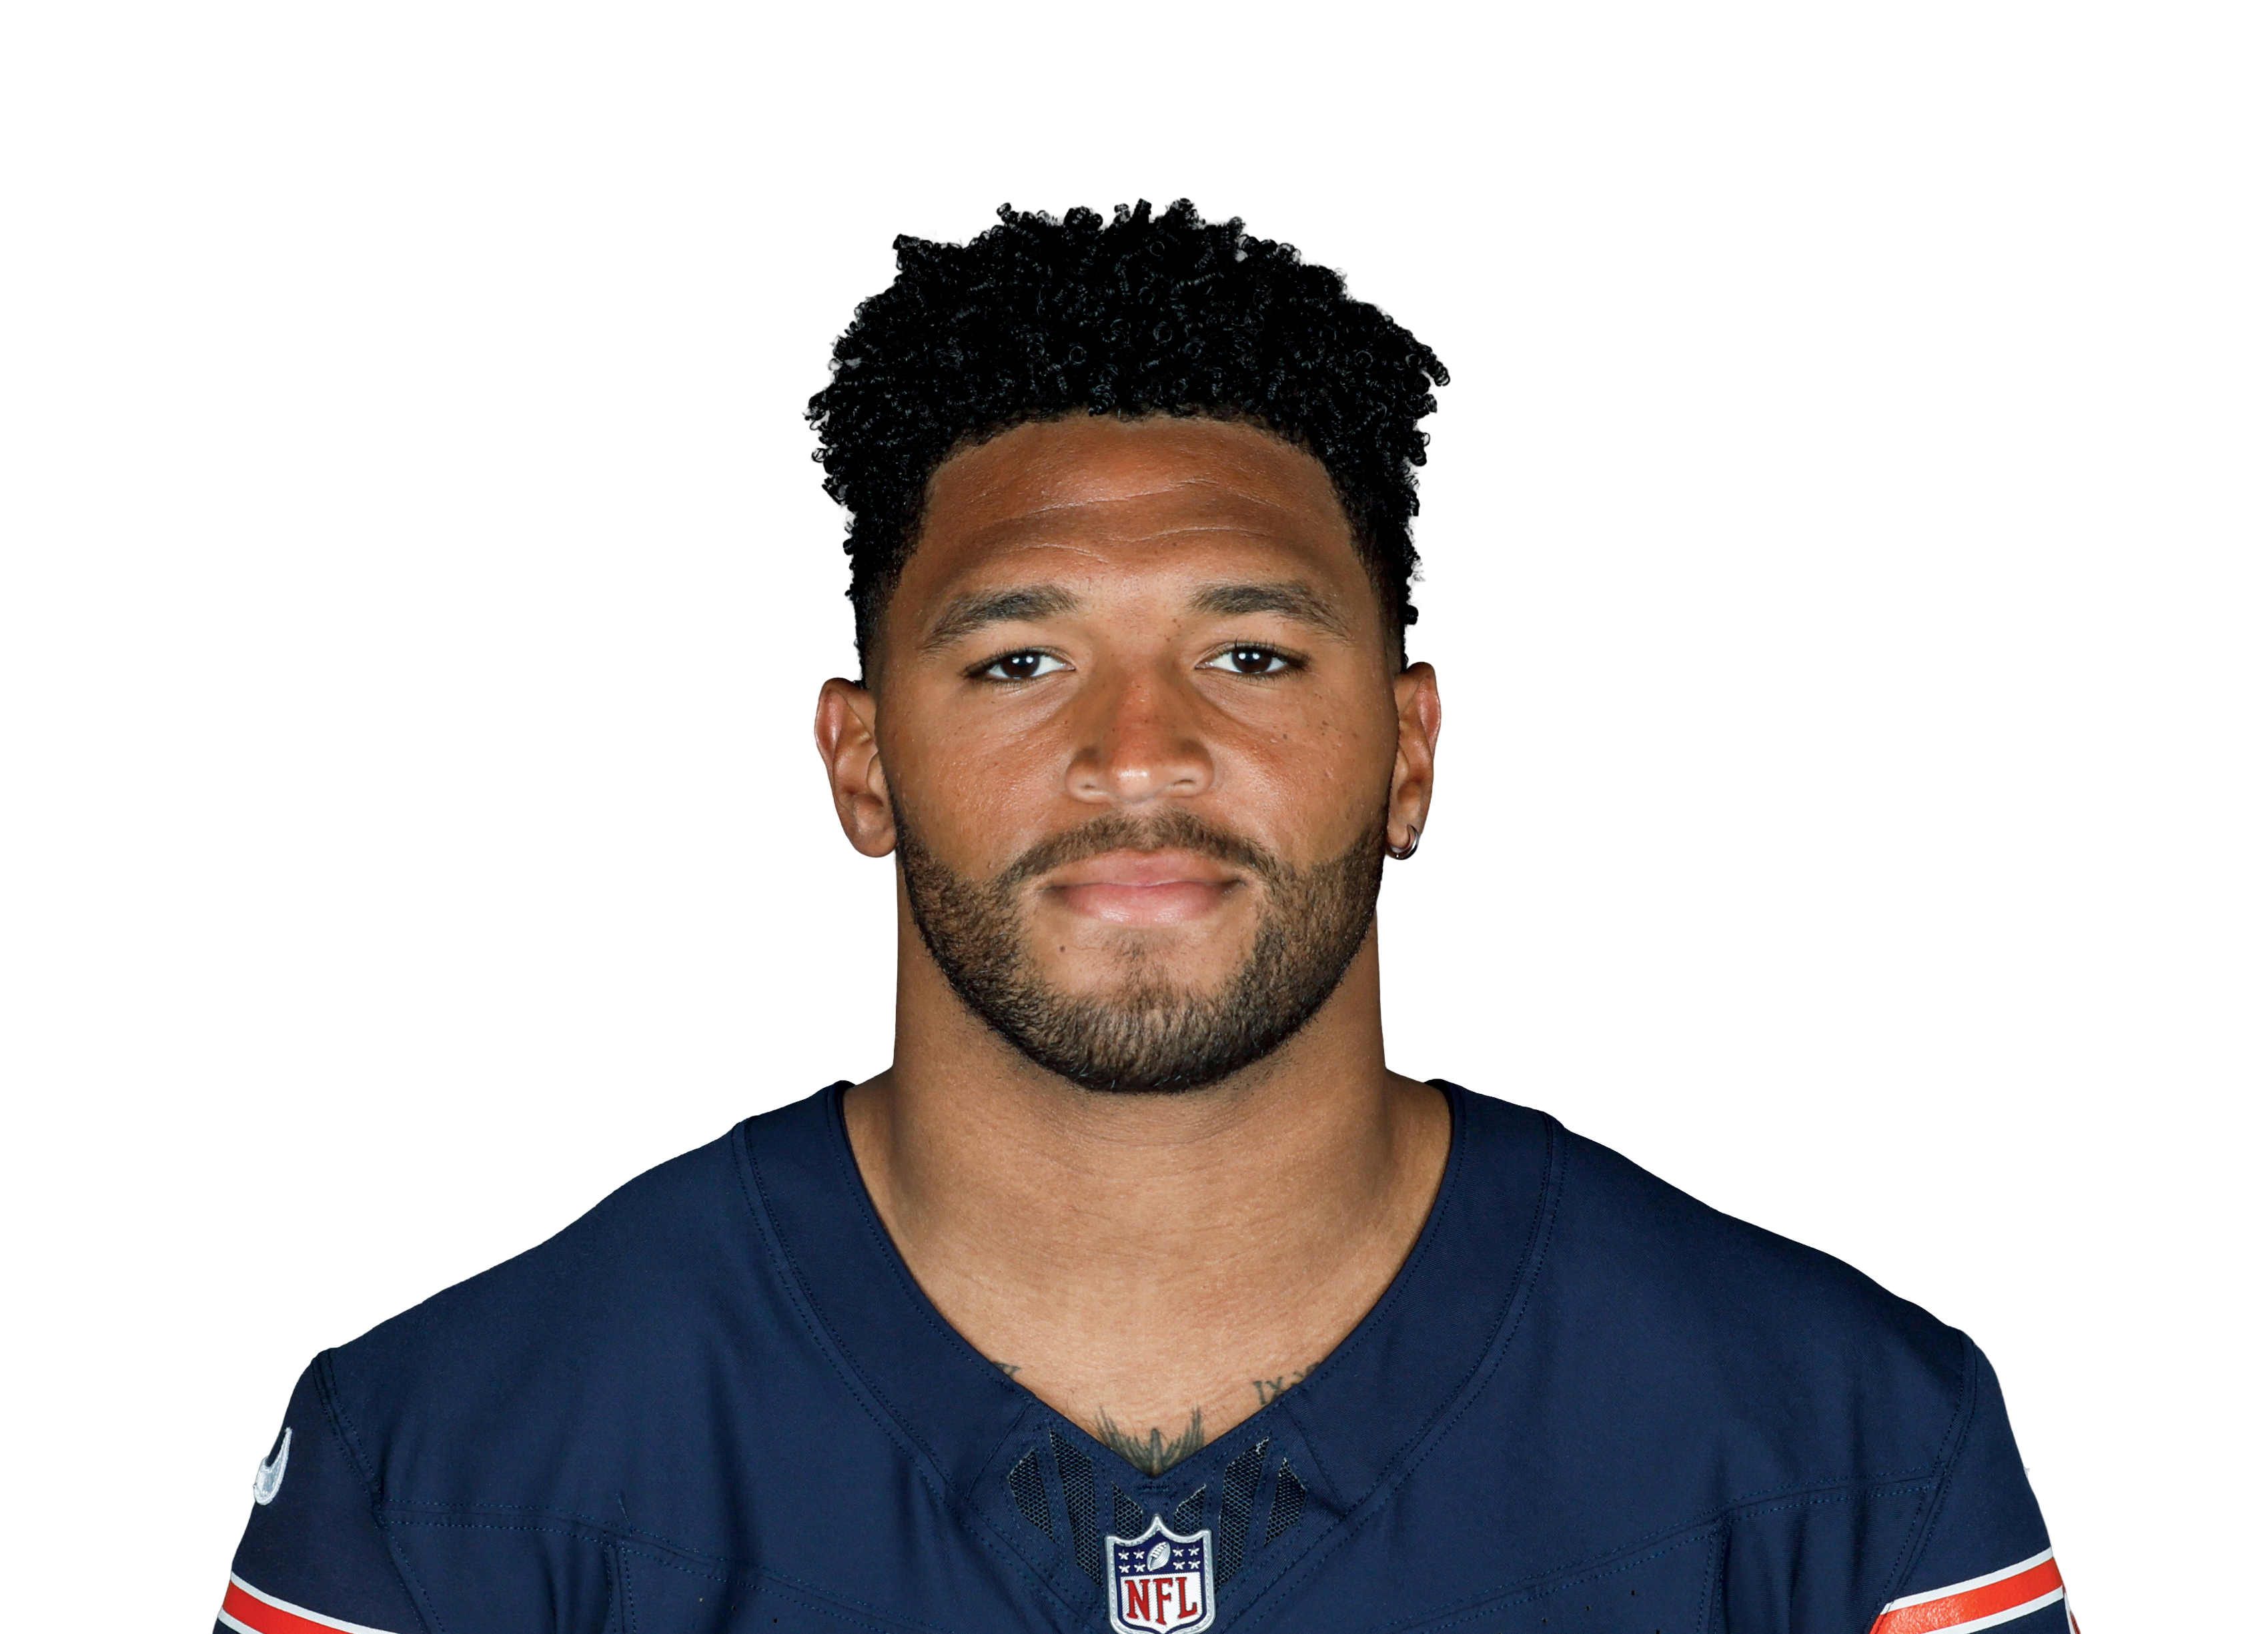 Roschon Johnson@ CHI • Wk 4 | 3.3 | 4 | 16 | 0 | 1 | 7 |
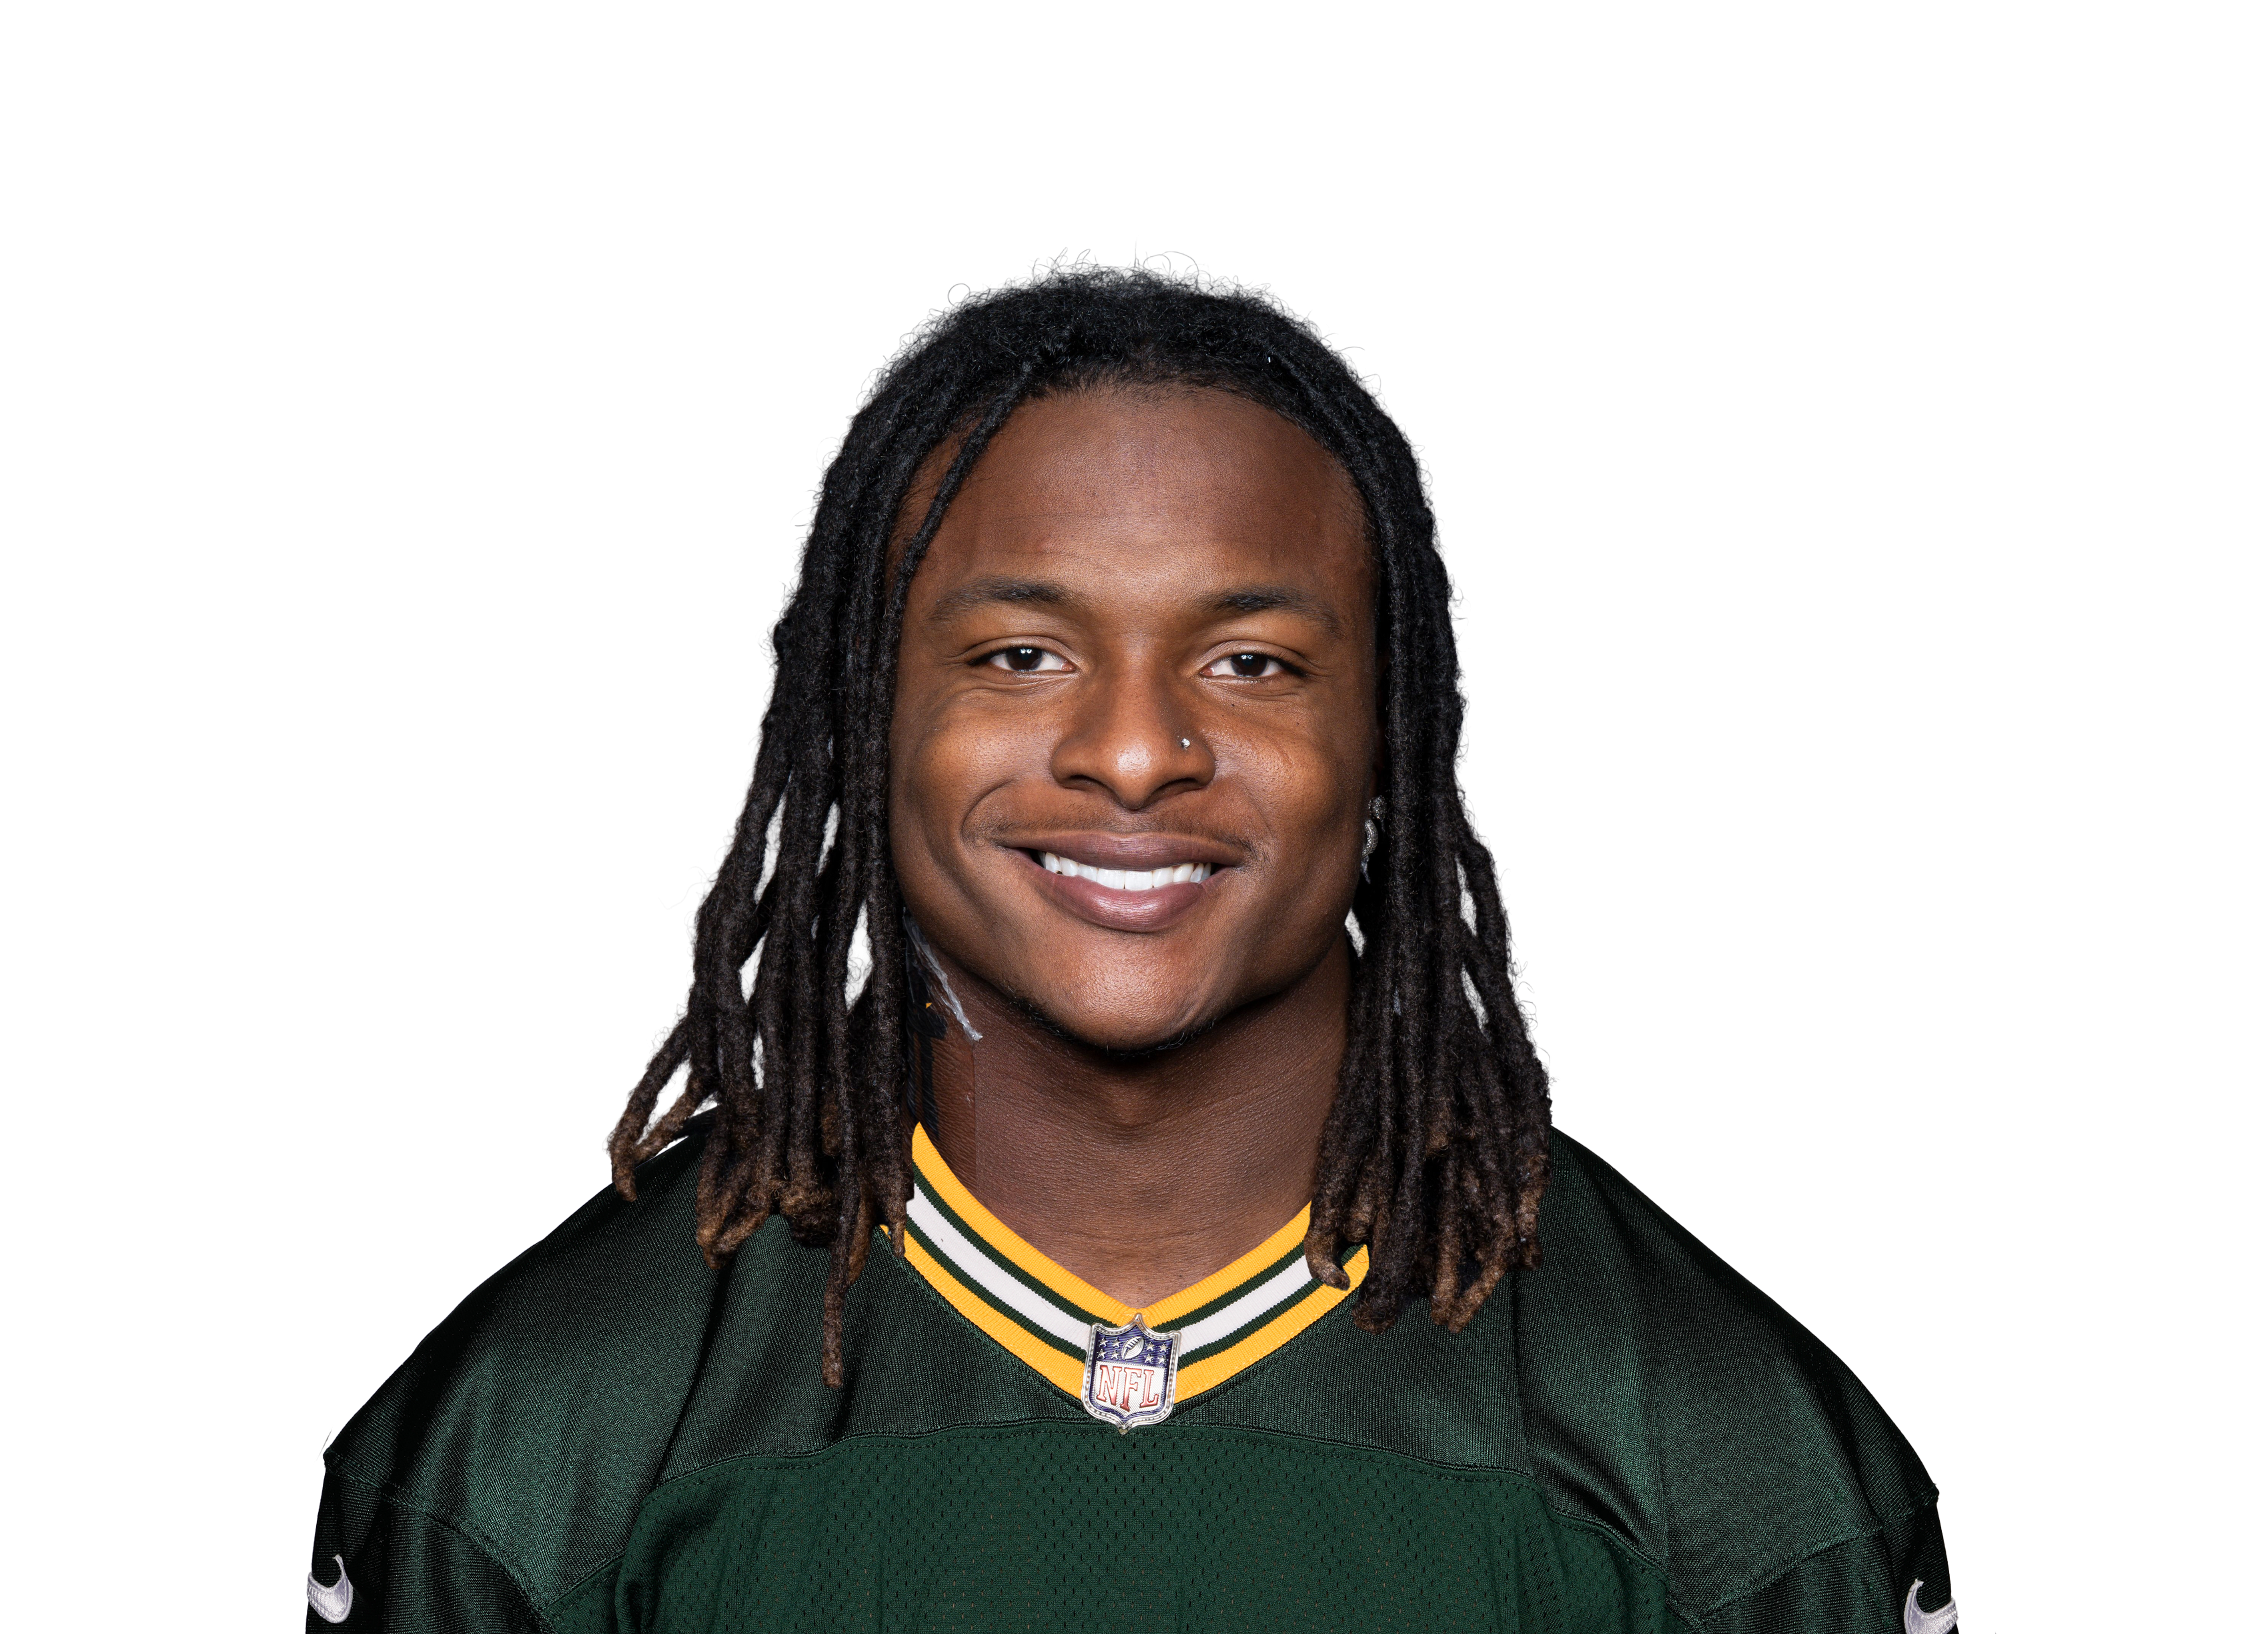 Kaleb Johnsonvs GB • Wk 2 | 3.2 | 8 | 32 | 0 | 0 | 0 |
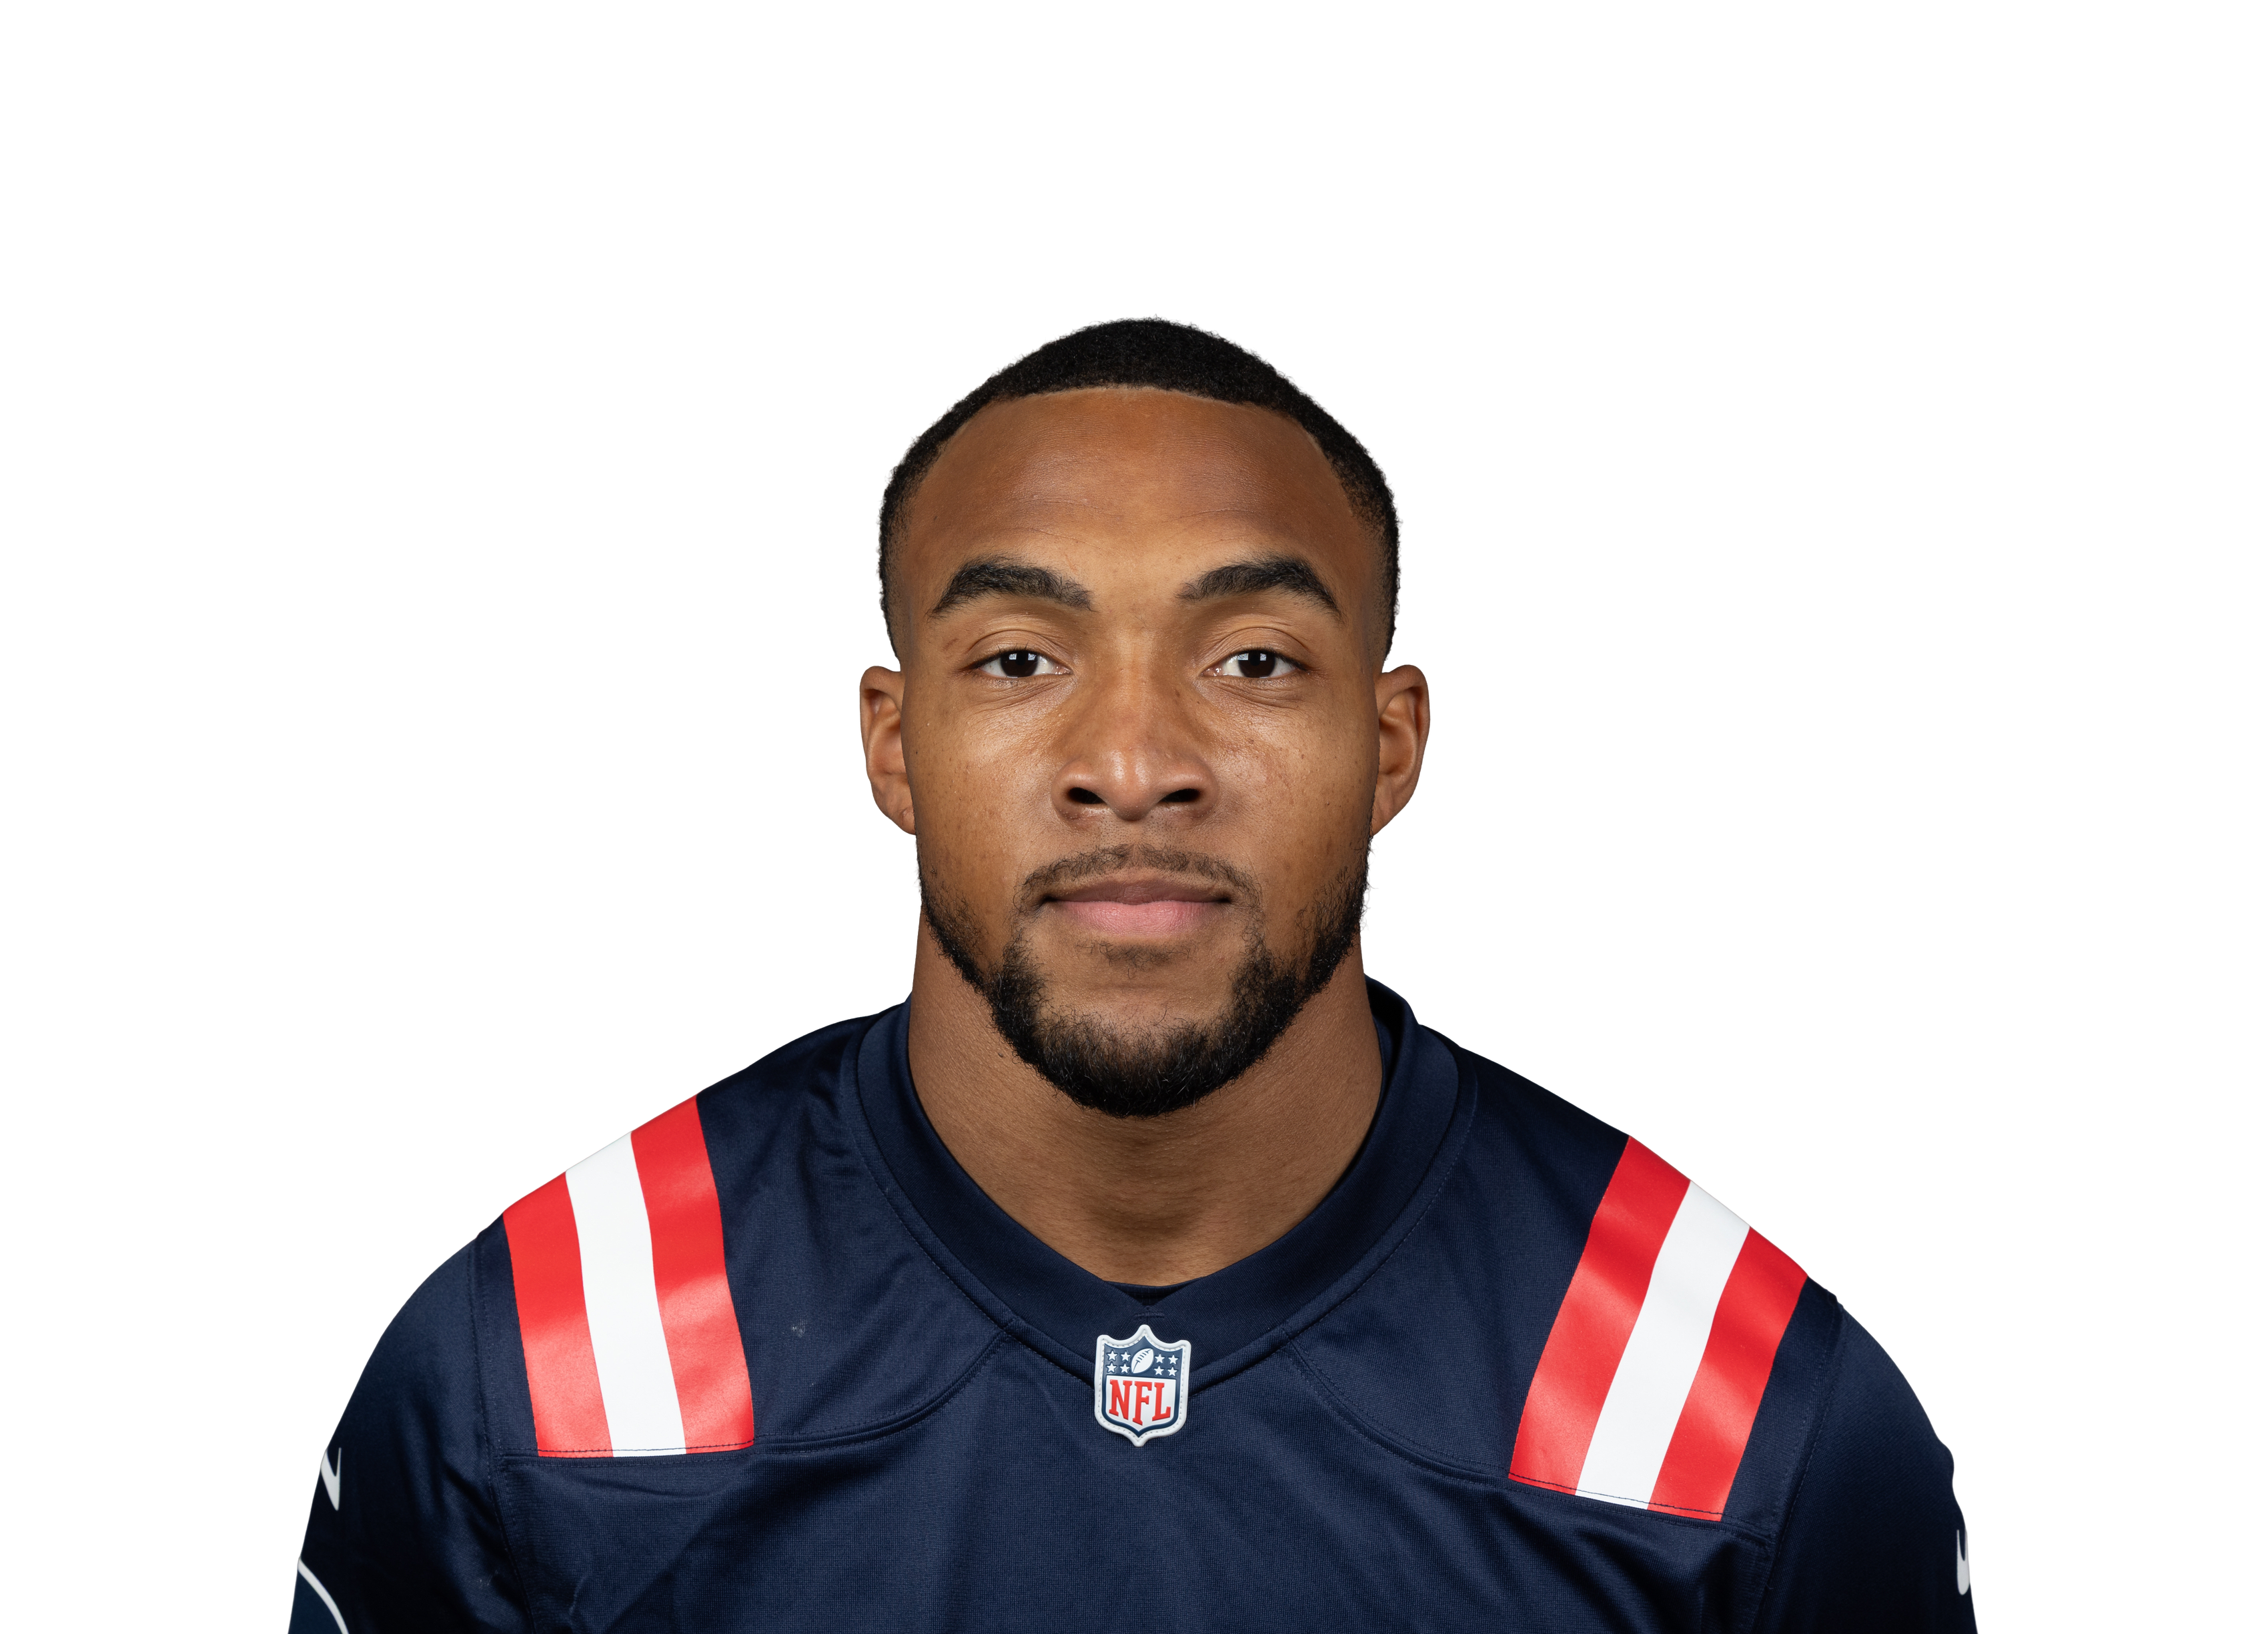 TreVeyon Henderson@ NE • Wk 6 | 3.0 | 7 | 31 | 0 | 1 | 9 |
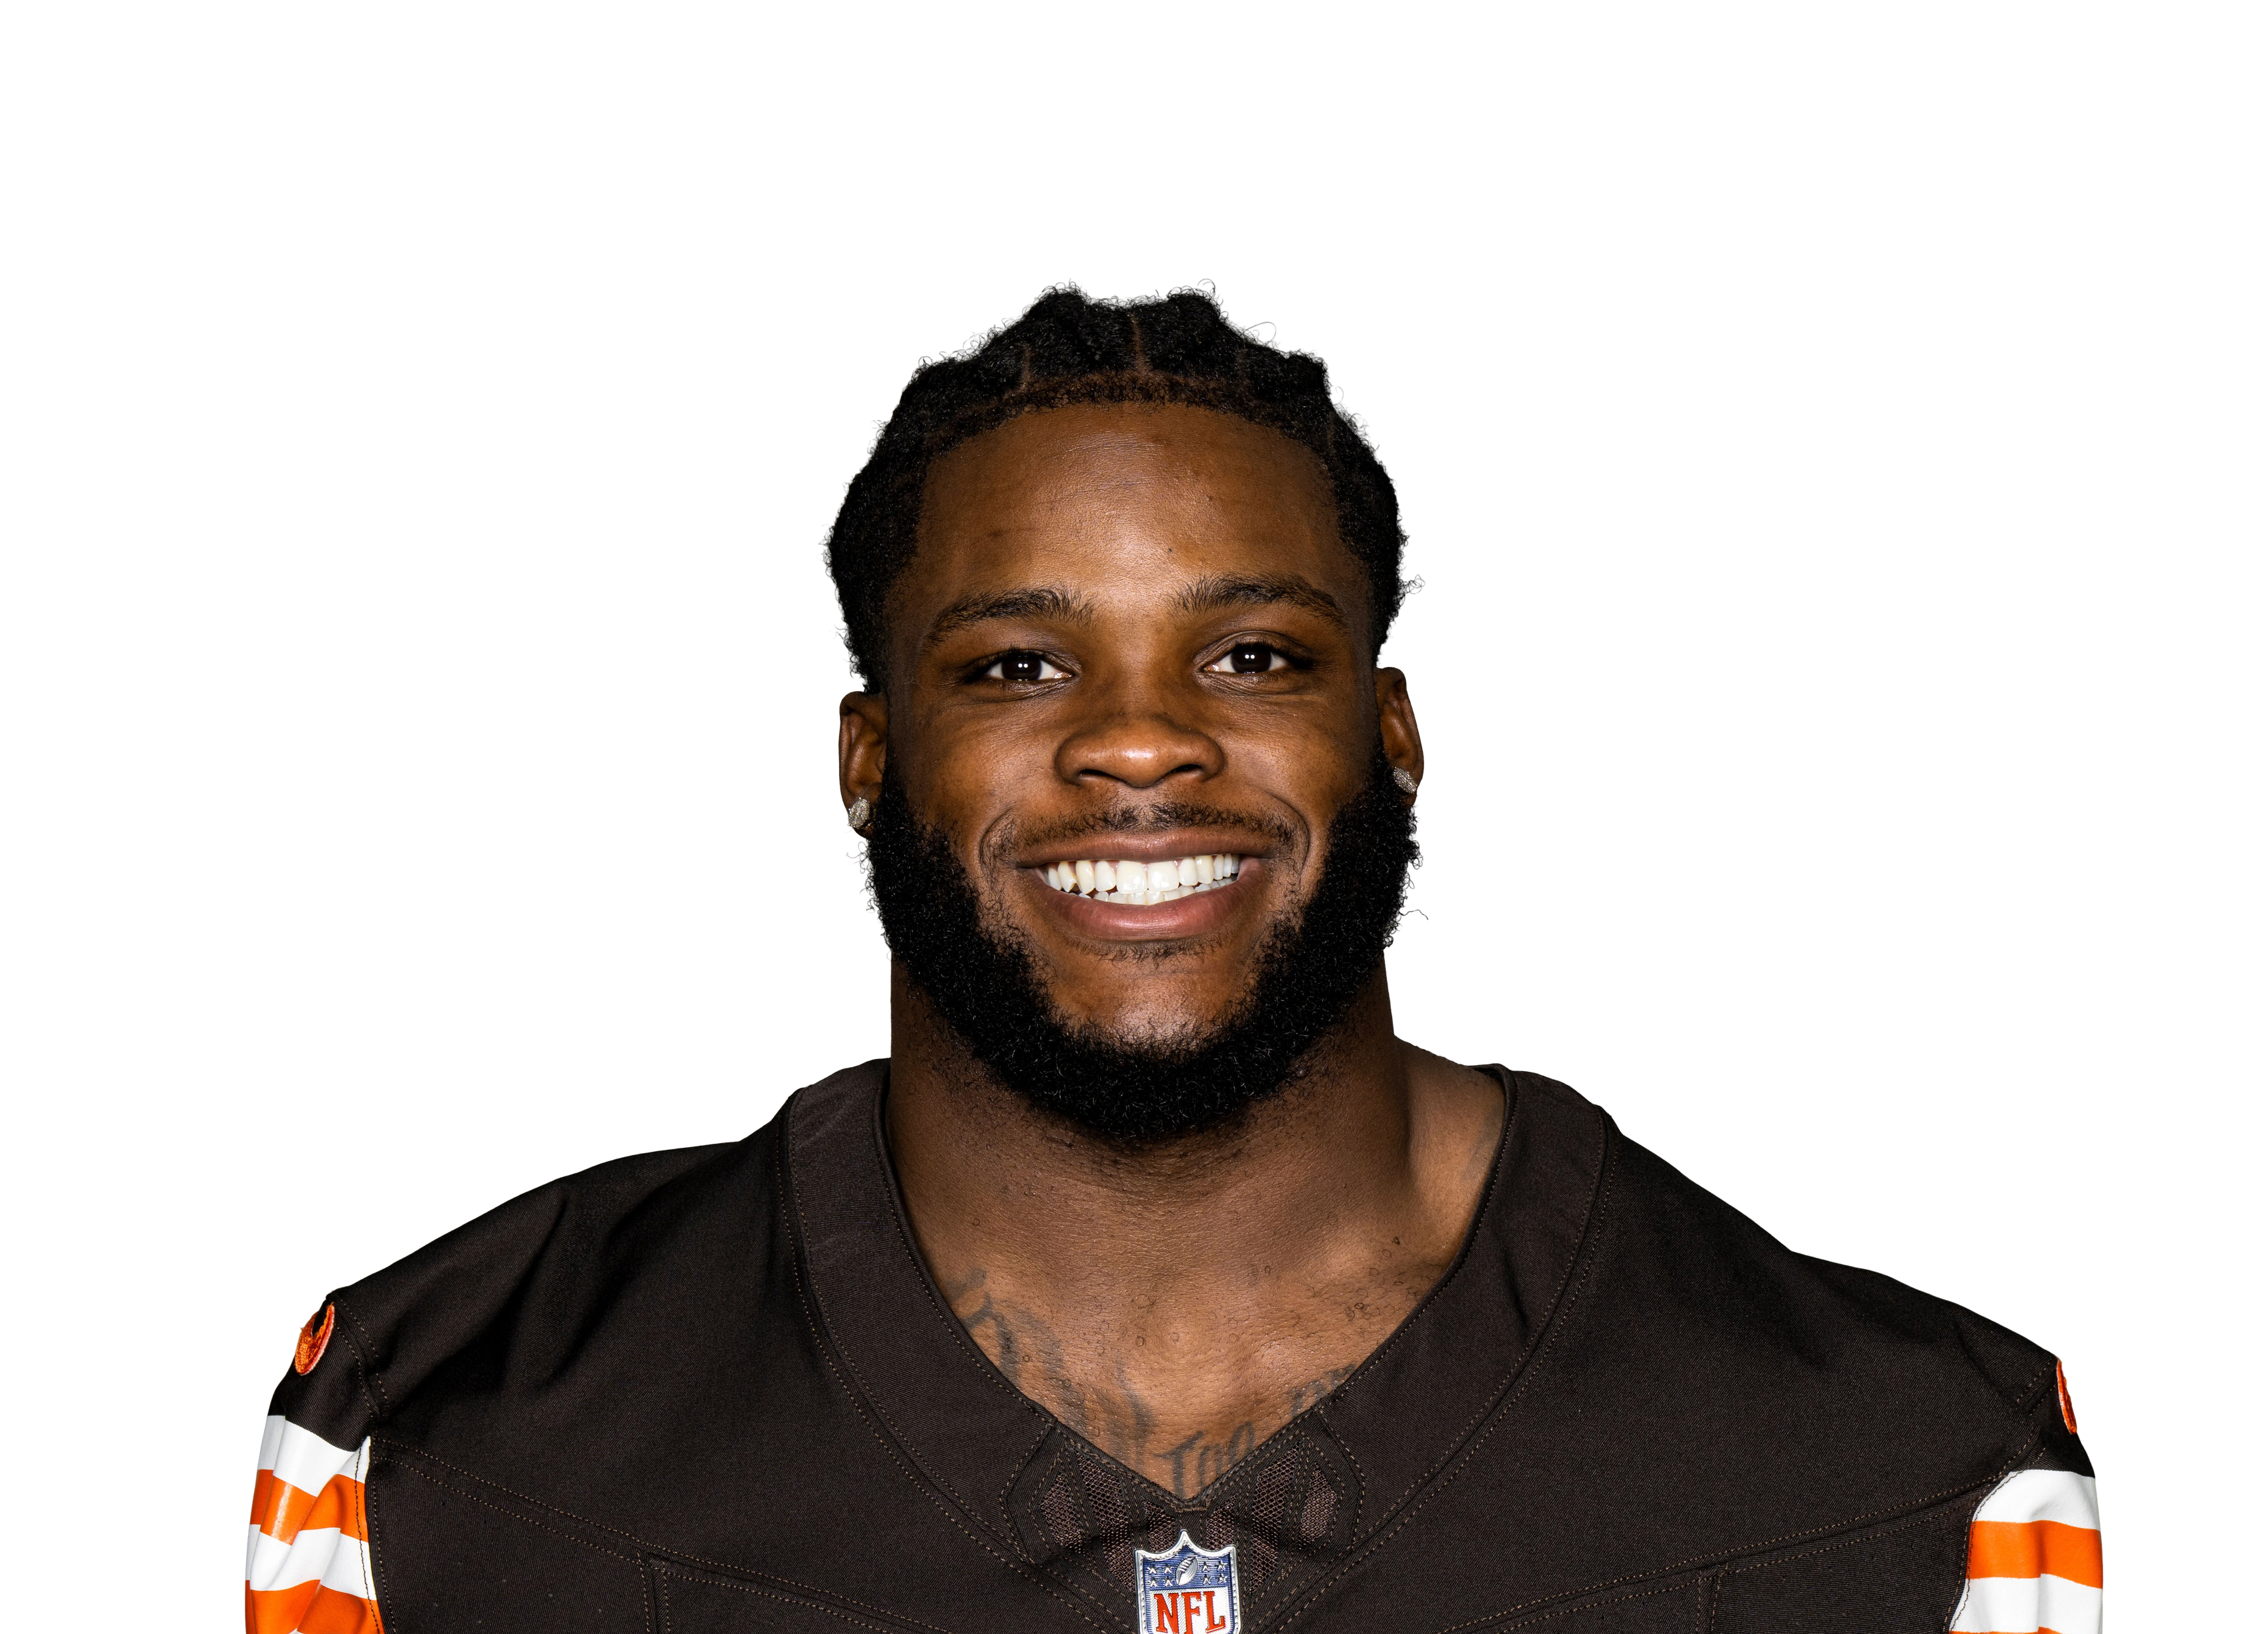 Raheim Sandersvs CLE • Wk 5 | 2.3 | 3 | 12 | 0 | 1 | 1 |
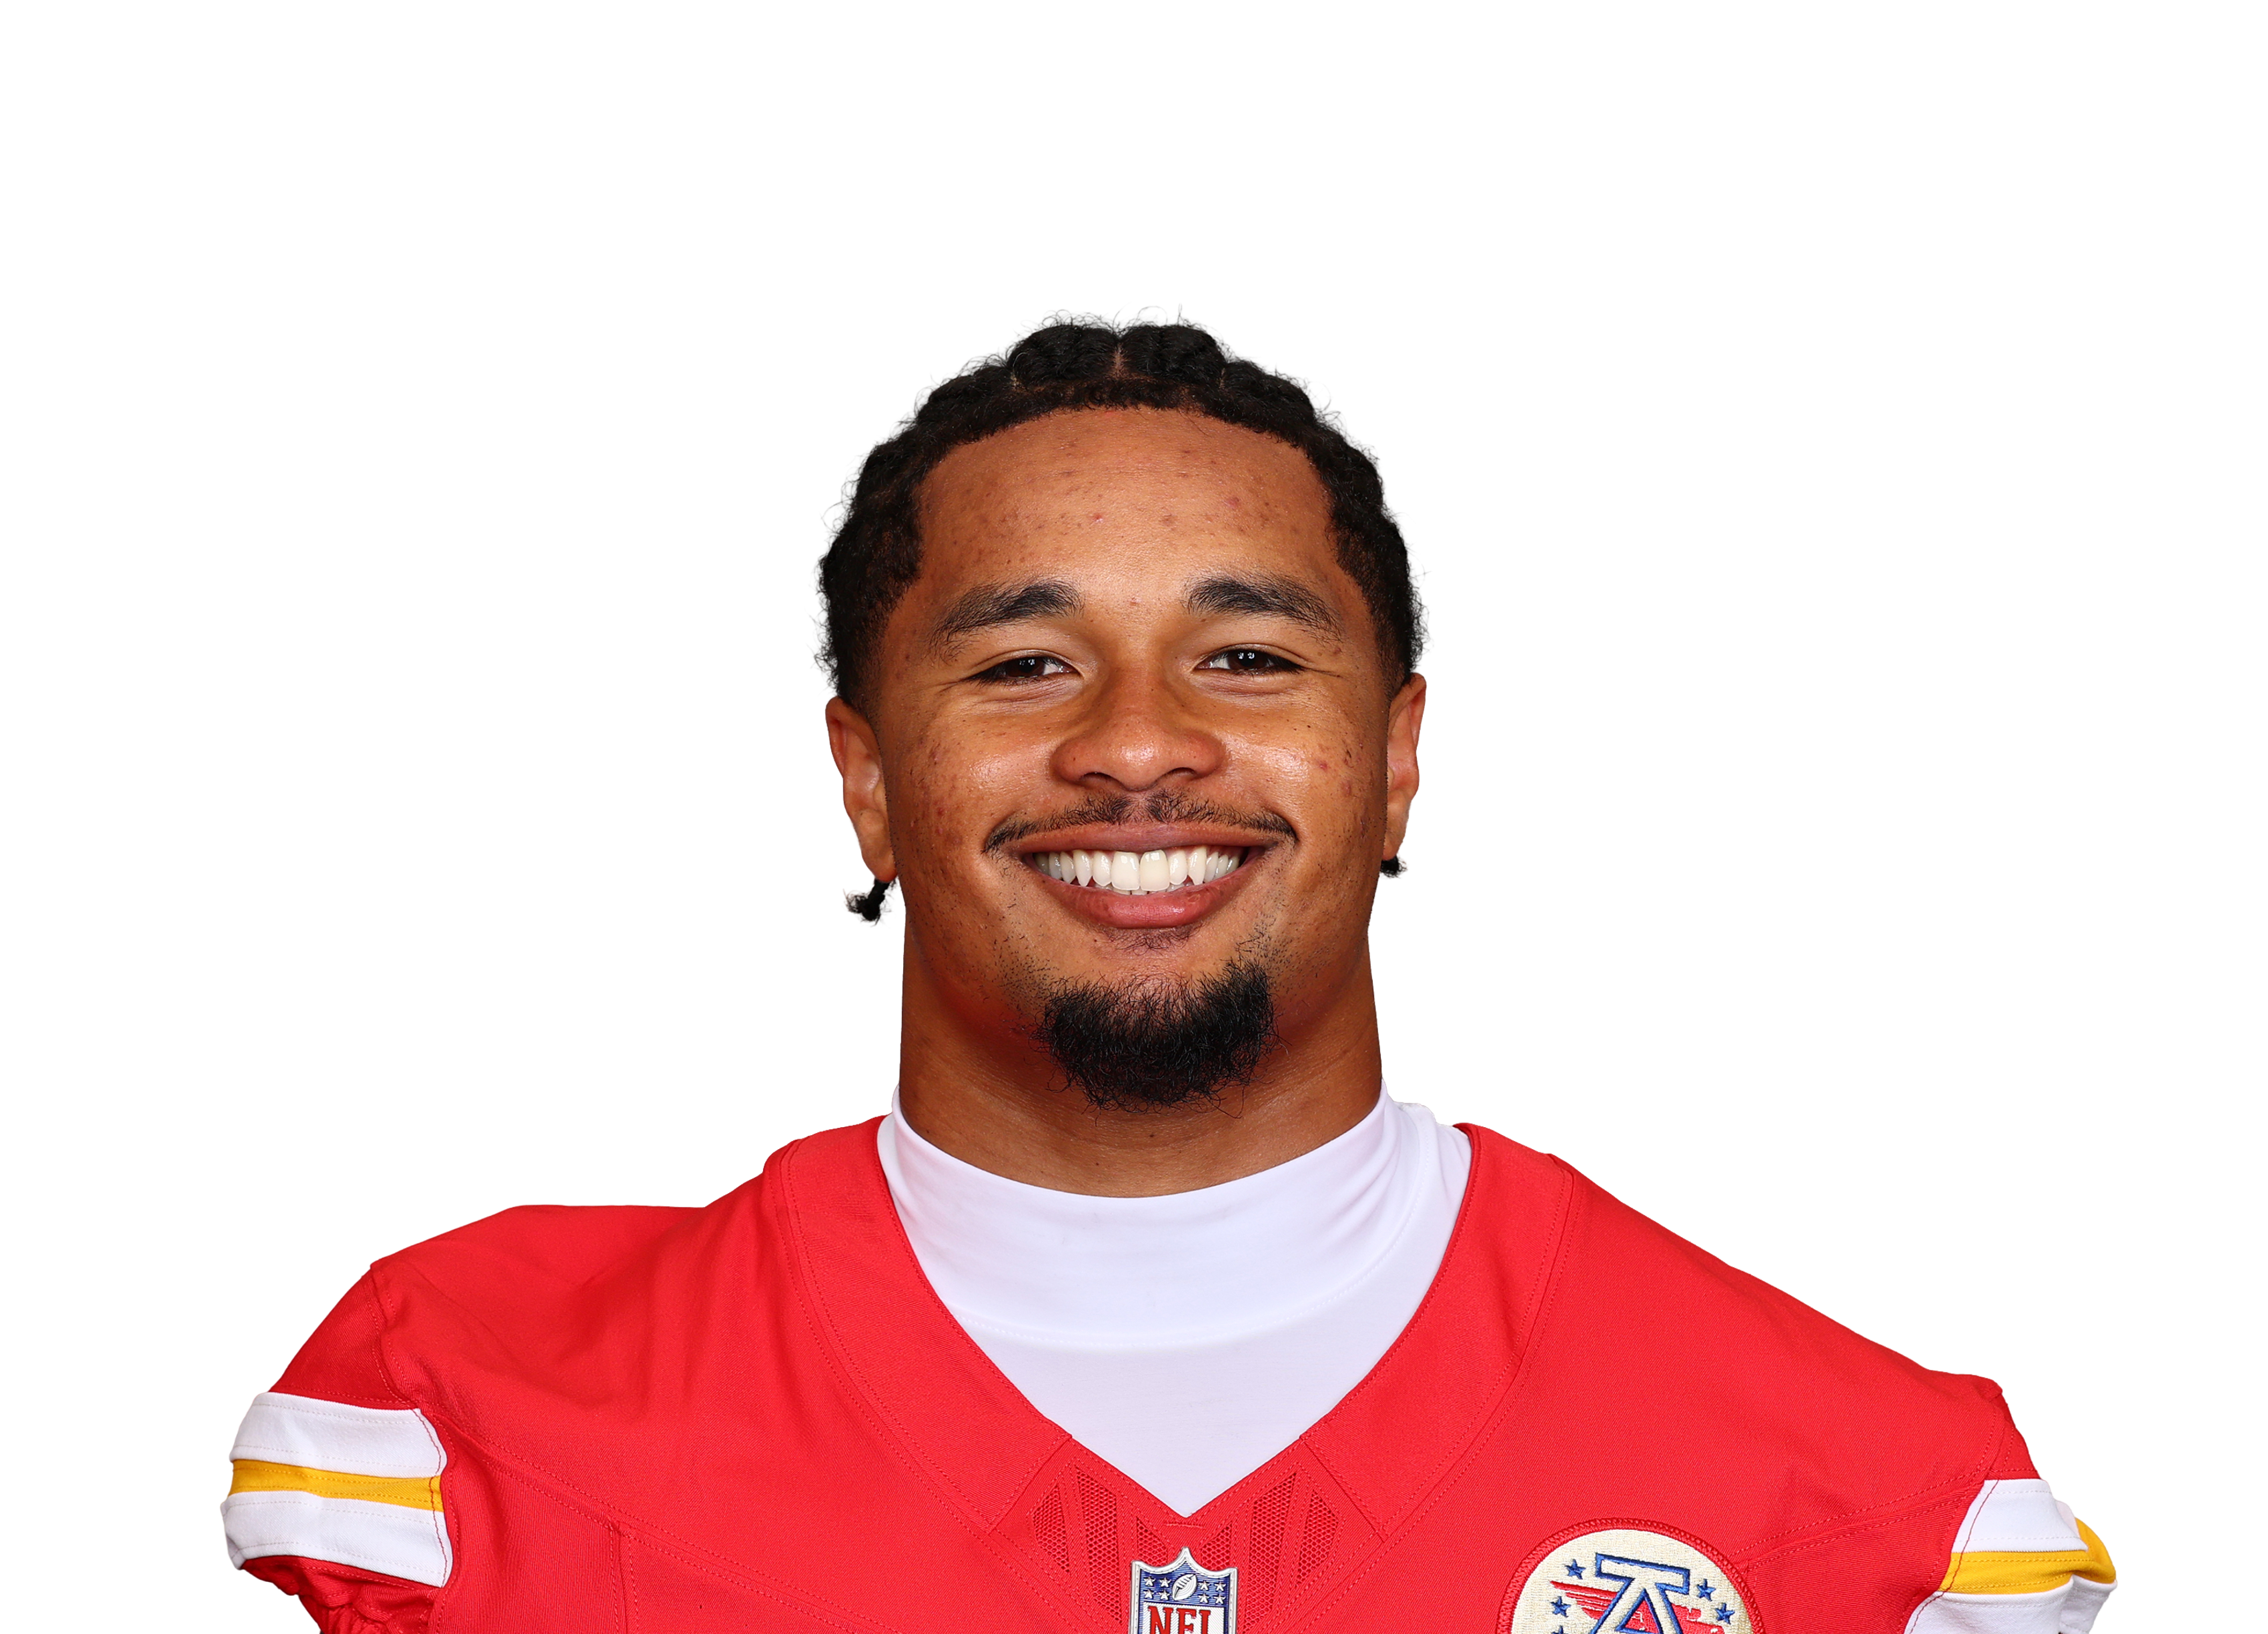 Jaydn Ott@ KC • Wk 9 | 1.9 | 3 | 19 | 0 | 0 | 0 |
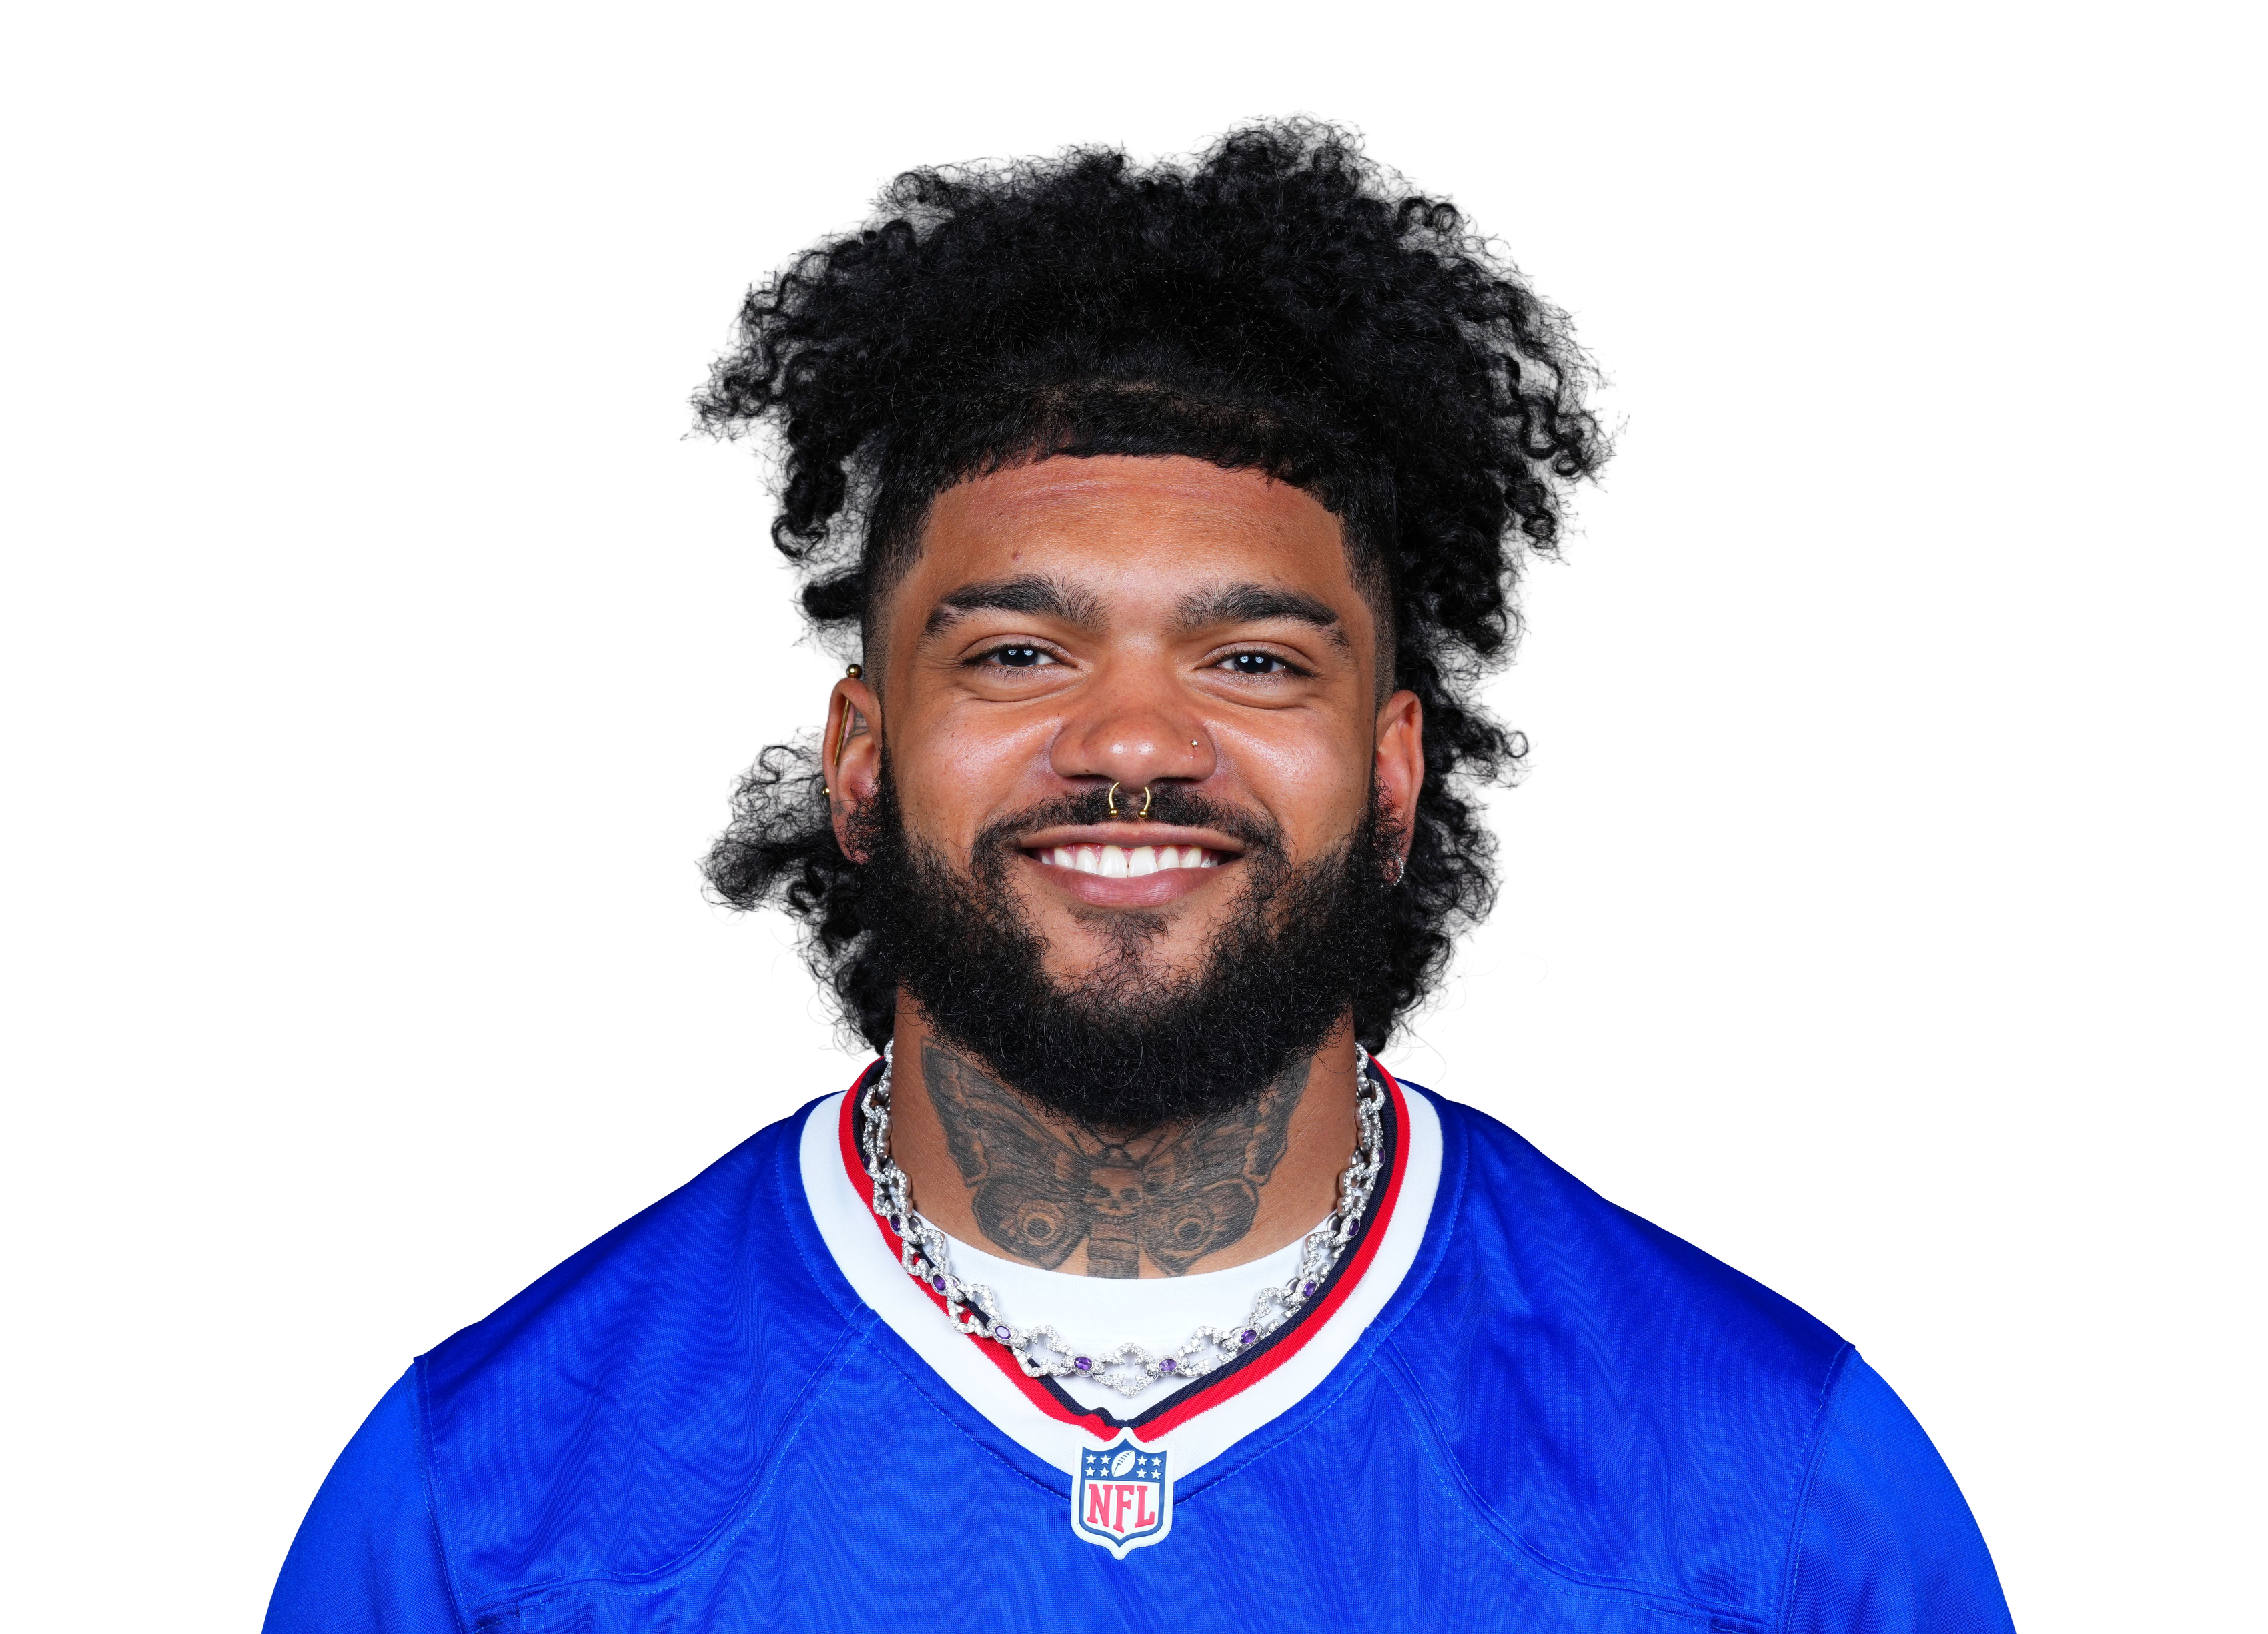 Ty Johnsonvs BUF • Wk 10 | 1.4 | 0 | 0 | 0 | 1 | 4 |
 Jaylen Wrightvs MIA • Wk 7 | 0.8 | 6 | 8 | 0 | 0 | 0 |
 Ray Davisvs BUF • Wk 10 | 0.8 | 3 | 8 | 0 | 0 | 0 |
 Jaleel McLaughlinvs CLE • Wk 5 | 0.0 | 0 | 0 | 0 | 0 | 0 |
Fantasy points first, then the stats that matter for his position. Ring around each photo is that player's Mania Rating. Tap a name to open his profile.
| Player | W1 | W2 | W3 | W4 | W5 | W6 | W8 | W9 | W10 | Per game |
|---|---|---|---|---|---|---|---|---|---|---|
| Omarion Hampton | 1243 yds25% touches58% snaps | 25115 yds43% touches63% snaps | 1656 yds26% touches42% snaps | 1153 yds18% touches35% snaps | 1539 yds27% touches30% snaps | 1139 yds19% touches50% snaps | 1227 yds22% touches30% snaps | 1360 yds22% touches40% snaps | 24105 yds48% touches63% snaps | 15.460 yds a game • 3.9 per touch28% touches46% snaps |
| Kimani Vidal | — | 00 yds0% touches10% snaps | 420 yds7% touches25% snaps | 836 yds13% touches35% snaps | 1056 yds18% touches42% snaps | 1140 yds19% touches37% snaps | 1030 yds18% touches46% snaps | 1036 yds17% touches39% snaps | 414 yds8% touches26% snaps | 7.129 yds a game • 4.1 per touch12% touches33% snaps |
| Keaton Mitchell | 49 yds8% touches31% snaps | 639 yds10% touches25% snaps | 1147 yds18% touches38% snaps | 1663 yds25% touches37% snaps | 1029 yds18% touches34% snaps | 34 yds5% touches25% snaps | 723 yds13% touches31% snaps | 1167 yds18% touches25% snaps | 44 yds8% touches23% snaps | 8.032 yds a game • 4.0 per touch14% touches30% snaps |
| Scott Matlock | — | — | — | — | — | — | 00 yds0% touches36% snaps | 00 yds0% touches40% snaps | — | 0.00 yds a game0% touches38% snaps |
| Use | Game | Proj | PPR | Tgt | Rec | Rec Yd | Car | Rush Yd | TD | Snap |
|---|---|---|---|---|---|---|---|---|---|---|
W1 vs ARI | 16.8 | 8.3 | 0 | 0 | 0 | 12 | 43 | 1 | 58% | |
W2 vs LV | 12.4 | 17.5 | 2 | 2 | 21 | 23 | 94 | 1 | 63% | |
W3 vs BUF | 13.2 | 5.6 | 1 | 0 | 0 | 15 | 56 | 0 | 42% | |
W4 vs SEA | 10.6 | 13.3 | 2 | 2 | 8 | 9 | 45 | 1 | 35% | |
W5 vs DEN | 10.7 | 4.9 | 1 | 1 | 6 | 14 | 33 | 0 | 30% | |
W6 vs KC | 8.3 | 7.9 | 4 | 4 | 21 | 7 | 18 | 0 | 50% | |
W8 vs LA | 9.0 | 4.7 | 3 | 2 | 7 | 9 | 20 | 0 | 30% | |
W9 vs HOU | 8.4 | 6 | 0 | 0 | 0 | 13 | 60 | 0 | 40% | |
W10 vs BAL | 8.0 | 17.5 | 2 | 1 | 0 | 22 | 105 | 1 | 63% |
Ranked against 41 backs with at least 60 carries. Ranks account for how much work each number is based on, so a perfect record on a few plays does not beat one over a full workload. Tap a stat to see the full ranking.
Omarion Hampton
LAC • RB • 9 gamesPick a teammate with or without. Pick more than one to combine them, like a game without the QB and without the other back.
LACNYJHow this is built
| Player | W1 | W2 | W3 | W4 | W5 | W6 | W8 | W9 | W10 | Per game |
|---|---|---|---|---|---|---|---|---|---|---|
| Omarion Hampton | 1243 yds25% touches58% snaps | 25115 yds43% touches63% snaps | 1656 yds26% touches42% snaps | 1153 yds18% touches35% snaps | 1539 yds27% touches30% snaps | 1139 yds19% touches50% snaps | 1227 yds22% touches30% snaps | 1360 yds22% touches40% snaps | 24105 yds48% touches63% snaps | 15.460 yds a game • 3.9 per touch28% touches46% snaps |
| Kimani Vidal | — | 00 yds0% touches10% snaps | 420 yds7% touches25% snaps | 836 yds13% touches35% snaps | 1056 yds18% touches42% snaps | 1140 yds19% touches37% snaps | 1030 yds18% touches46% snaps | 1036 yds17% touches39% snaps | 414 yds8% touches26% snaps | 7.129 yds a game • 4.1 per touch12% touches33% snaps |
| Keaton Mitchell | 49 yds8% touches31% snaps | 639 yds10% touches25% snaps | 1147 yds18% touches38% snaps | 1663 yds25% touches37% snaps | 1029 yds18% touches34% snaps | 34 yds5% touches25% snaps | 723 yds13% touches31% snaps | 1167 yds18% touches25% snaps | 44 yds8% touches23% snaps | 8.032 yds a game • 4.0 per touch14% touches30% snaps |
| Scott Matlock | — | — | — | — | — | — | 00 yds0% touches36% snaps | 00 yds0% touches40% snaps | — | 0.00 yds a game0% touches38% snaps |
| Use | Game | Proj | PPR | Tgt | Rec | Rec Yd | Car | Rush Yd | TD | Snap |
|---|---|---|---|---|---|---|---|---|---|---|
| W1vs ARI | 16.8 | 8.3 | 0 | 0 | 0 | 12 | 43 | 1 | 58% | |
| W2vs LV | 12.4 | 17.5 | 2 | 2 | 21 | 23 | 94 | 1 | 63% | |
| W3vs BUF | 13.2 | 5.6 | 1 | 0 | 0 | 15 | 56 | 0 | 42% | |
| W4vs SEA | 10.6 | 13.3 | 2 | 2 | 8 | 9 | 45 | 1 | 35% | |
| W5vs DEN | 10.7 | 4.9 | 1 | 1 | 6 | 14 | 33 | 0 | 30% | |
| W6vs KC | 8.3 | 7.9 | 4 | 4 | 21 | 7 | 18 | 0 | 50% | |
| W8vs LA | 9.0 | 4.7 | 3 | 2 | 7 | 9 | 20 | 0 | 30% | |
| W9vs HOU | 8.4 | 6 | 0 | 0 | 0 | 13 | 60 | 0 | 40% | |
| W10vs BAL | 8.0 | 17.5 | 2 | 1 | 0 | 22 | 105 | 1 | 63% |
Ranked against 41 backs with at least 60 carries. Ranks account for how much work each number is based on, so a perfect record on a few plays does not beat one over a full workload. Tap a stat to see the full ranking.
24.0 PPR points a game allowed to running backs, 10th most of 32 defenses.
| Player | PPR | Rush | Rush Yd | Rush TD | Rec | Rec Yd |
|---|---|---|---|---|---|---|
| Jahmyr Gibbs@ DET • Wk 3 | 41.4 | 20 | 99 | 2 | 7 | 65 |
| Kenneth Walker III@ KC • Wk 9 | 36.3 | 18 | 102 | 1 | 4 | 41 |
| Kyle Monangai@ CHI • Wk 4 | 28.0 | 30 | 146 | 2 | 1 | 4 |
| James Cookvs BUF • Wk 10 | 21.7 | 18 | 157 | 1 | 0 | 0 |
| Ollie Gordon IIvs MIA • Wk 7 | 17.3 | 25 | 103 | 1 | 1 | 0 |
| Ashton Jeantyvs LV • Wk 8 | 10.3 | 2 | 9 | 0 | 3 | 64 |
| Emmett Johnson@ KC • Wk 9 | 9.4 | 6 | 34 | 1 | 0 | 0 |
| MarShawn Lloydvs GB • Wk 2 | 8.6 | 6 | 20 | 0 | 2 | 6 |
| Mike Washington Jr.vs LV • Wk 8 | 8.3 | 25 | 83 | 0 | 0 | 0 |
| Quinshon Judkinsvs CLE • Wk 5 | 8.0 | 14 | 44 | 0 | 3 | 6 |
| D'Andre Swift@ CHI • Wk 4 | 7.4 | 15 | 58 | 0 | 2 | 16 |
| Corey Kiner@ NE • Wk 6 | 5.7 | 11 | 57 | 0 | 0 | 0 |
| Sione Vaki@ DET • Wk 3 | 4.7 | 6 | 26 | 0 | 1 | 11 |
| Tony Pollard@ TEN • Wk 1 | 4.4 | 7 | 35 | 0 | 1 | -1 |
| Tyjae Spears@ TEN • Wk 1 | 4.4 | 3 | 12 | 0 | 2 | 12 |
| Chris Brooksvs GB • Wk 2 | 3.6 | 4 | 11 | 0 | 1 | 15 |
| Rhamondre Stevenson@ NE • Wk 6 | 3.6 | 14 | 36 | 0 | 0 | 0 |
| Roschon Johnson@ CHI • Wk 4 | 3.3 | 4 | 16 | 0 | 1 | 7 |
| Kaleb Johnsonvs GB • Wk 2 | 3.2 | 8 | 32 | 0 | 0 | 0 |
| TreVeyon Henderson@ NE • Wk 6 | 3.0 | 7 | 31 | 0 | 1 | 9 |
| Raheim Sandersvs CLE • Wk 5 | 2.3 | 3 | 12 | 0 | 1 | 1 |
| Jaydn Ott@ KC • Wk 9 | 1.9 | 3 | 19 | 0 | 0 | 0 |
| Ty Johnsonvs BUF • Wk 10 | 1.4 | 0 | 0 | 0 | 1 | 4 |
| Jaylen Wrightvs MIA • Wk 7 | 0.8 | 6 | 8 | 0 | 0 | 0 |
| Ray Davisvs BUF • Wk 10 | 0.8 | 3 | 8 | 0 | 0 | 0 |
| Jaleel McLaughlinvs CLE • Wk 5 | 0.0 | 0 | 0 | 0 | 0 | 0 |
Fantasy points first, then the stats that matter for his position. Ring around each photo is that player's Mania Rating. Tap a name to open his profile.