
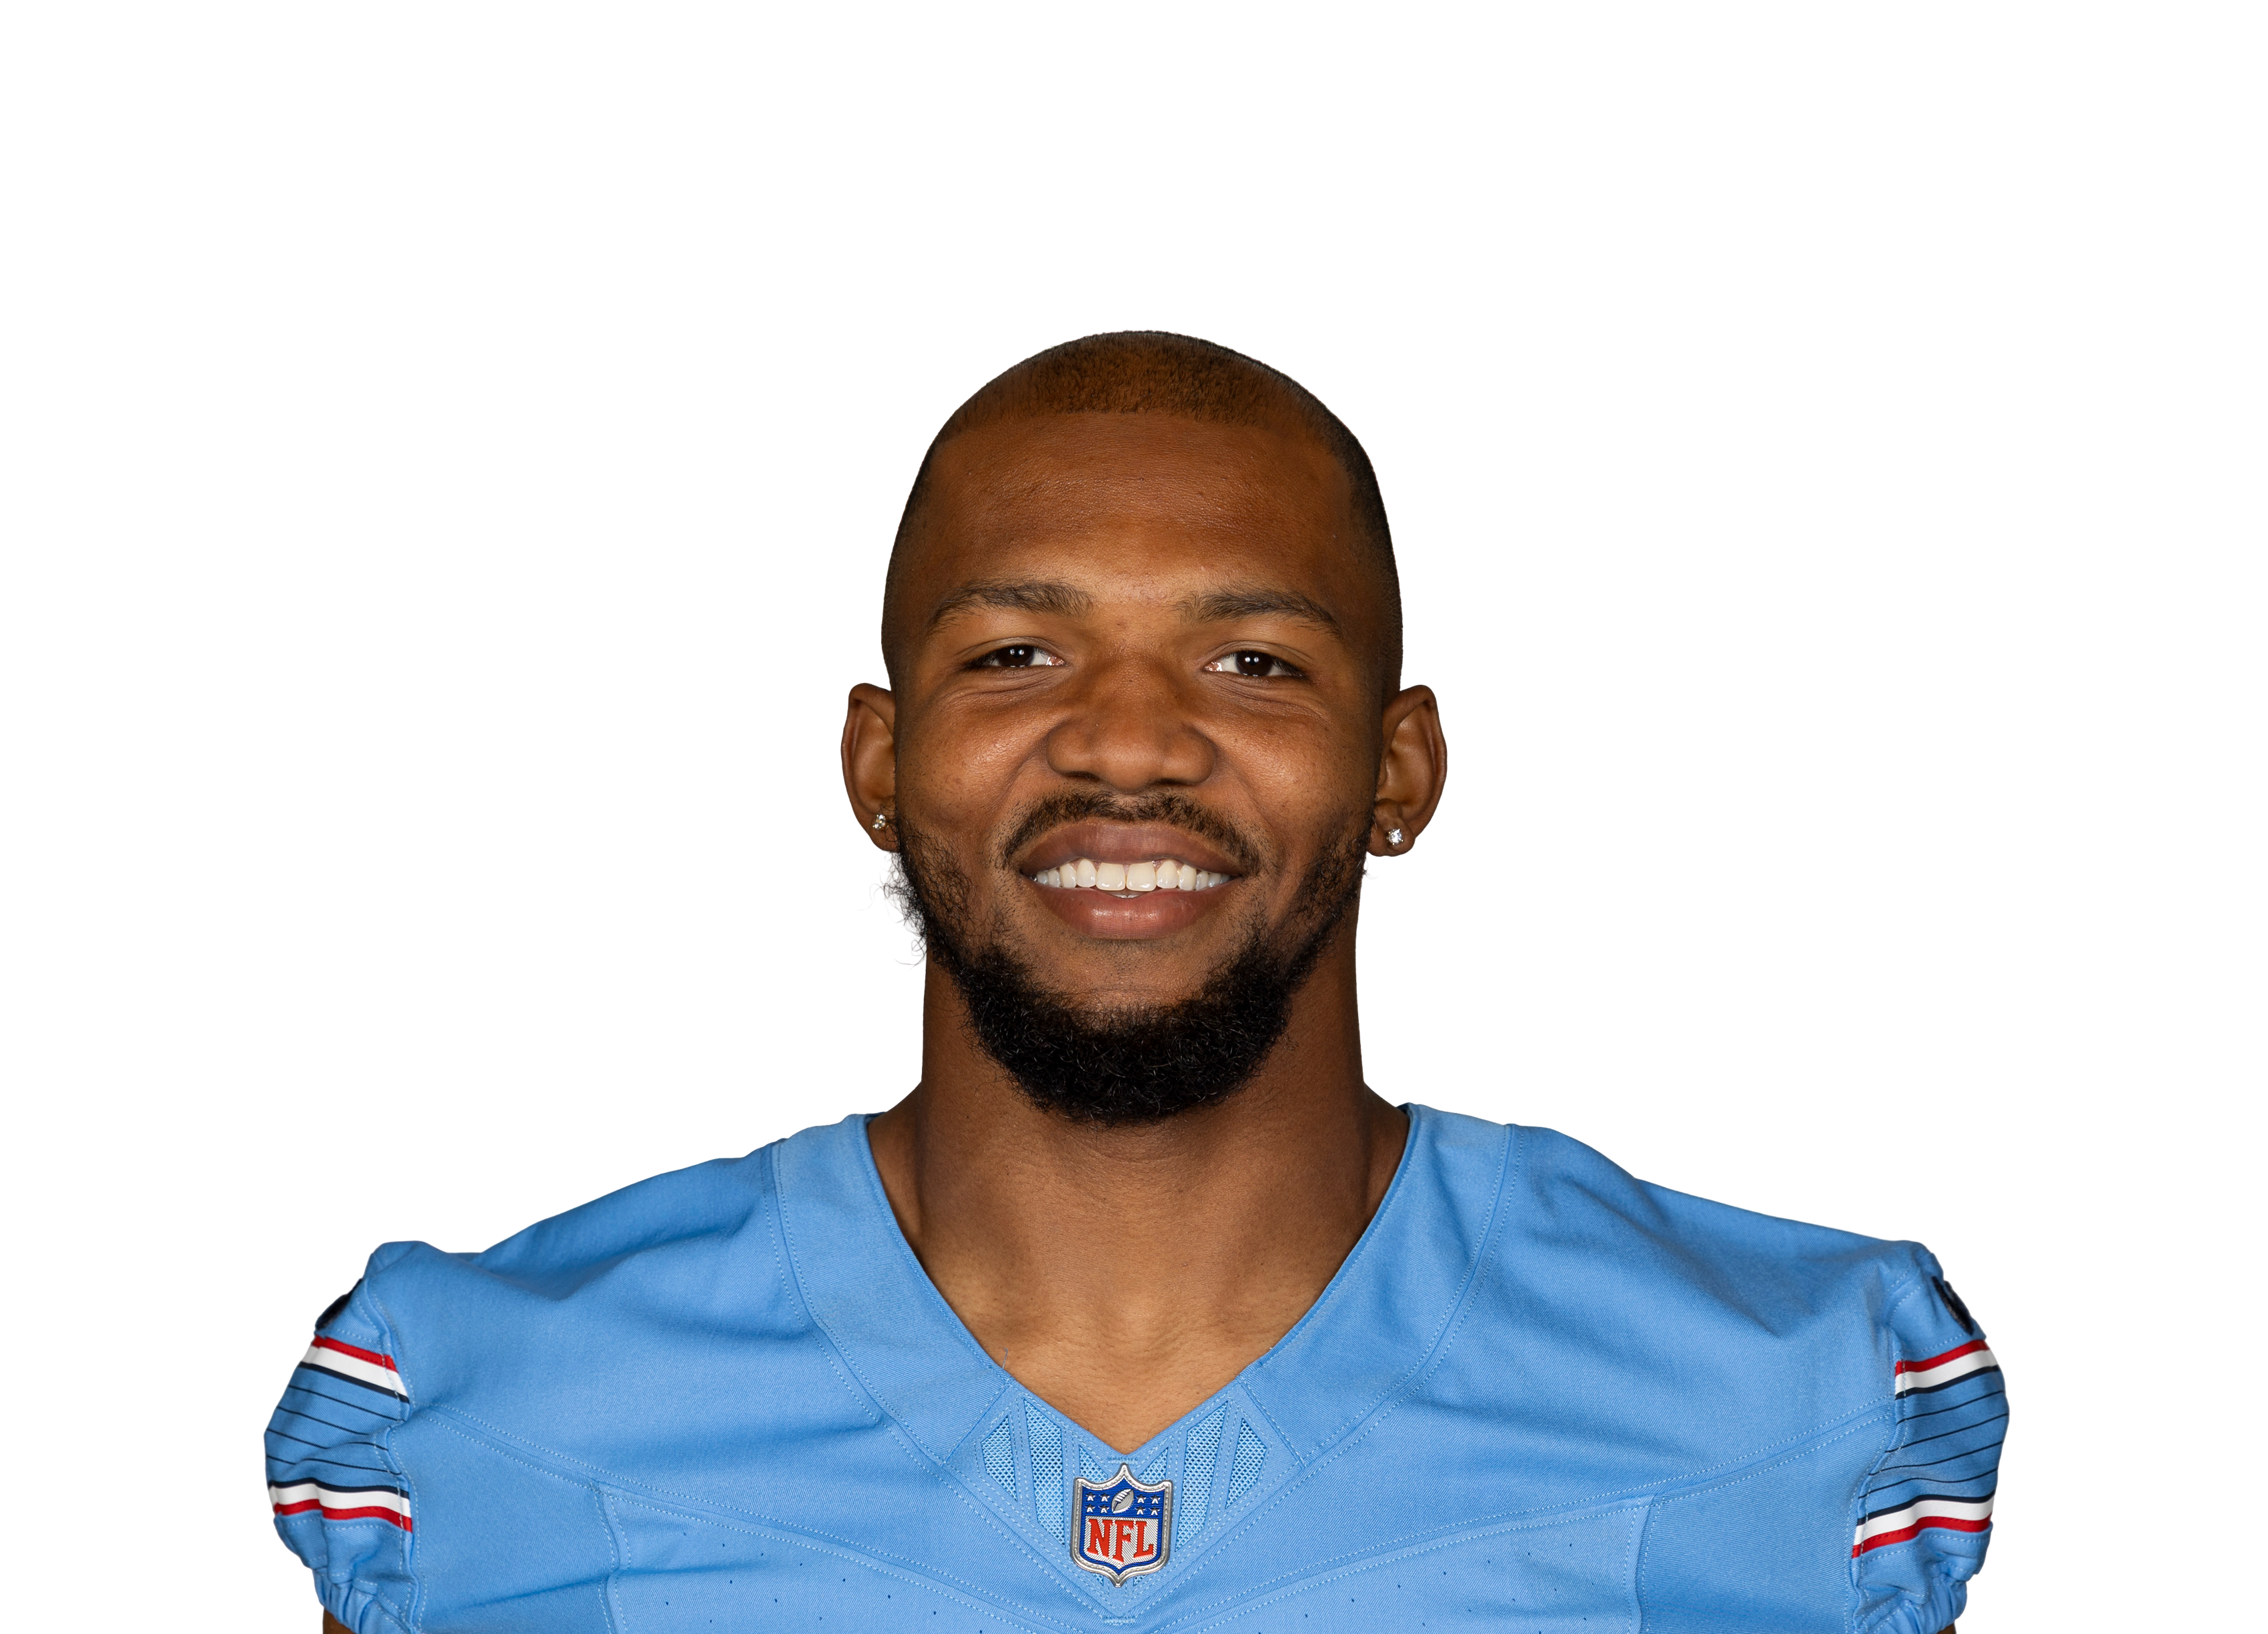
Tony Pollard
 TEN • RB • 9 games
Pick a teammate with or without. Pick more than one to combine them, like a game without the QB and without the other back.
Teammate injuries shift his Week 11 Rating3 teammate notes ▾
TEN DAL
How this is built
29.3 PPR points a game allowed to running backs, 1st most of 32 defenses.
| Player | PPR | Rush | Rush Yd | Rush TD | Rec | Rec Yd |
|---|---|---|---|---|---|---|
 Christian McCaffreyvs SF • Wk 10 | 46.3 | 13 | 62 | 1 | 4 | 161 |
 Tyler Allgeiervs ARI • Wk 8 | 36.1 | 11 | 147 | 1 | 5 | 44 |
 Bucky Irvingvs TB • Wk 5 | 31.5 | 21 | 165 | 1 | 2 | 10 |
 Derrick Henryvs BAL • Wk 3 | 21.9 | 26 | 89 | 2 | 1 | 0 |
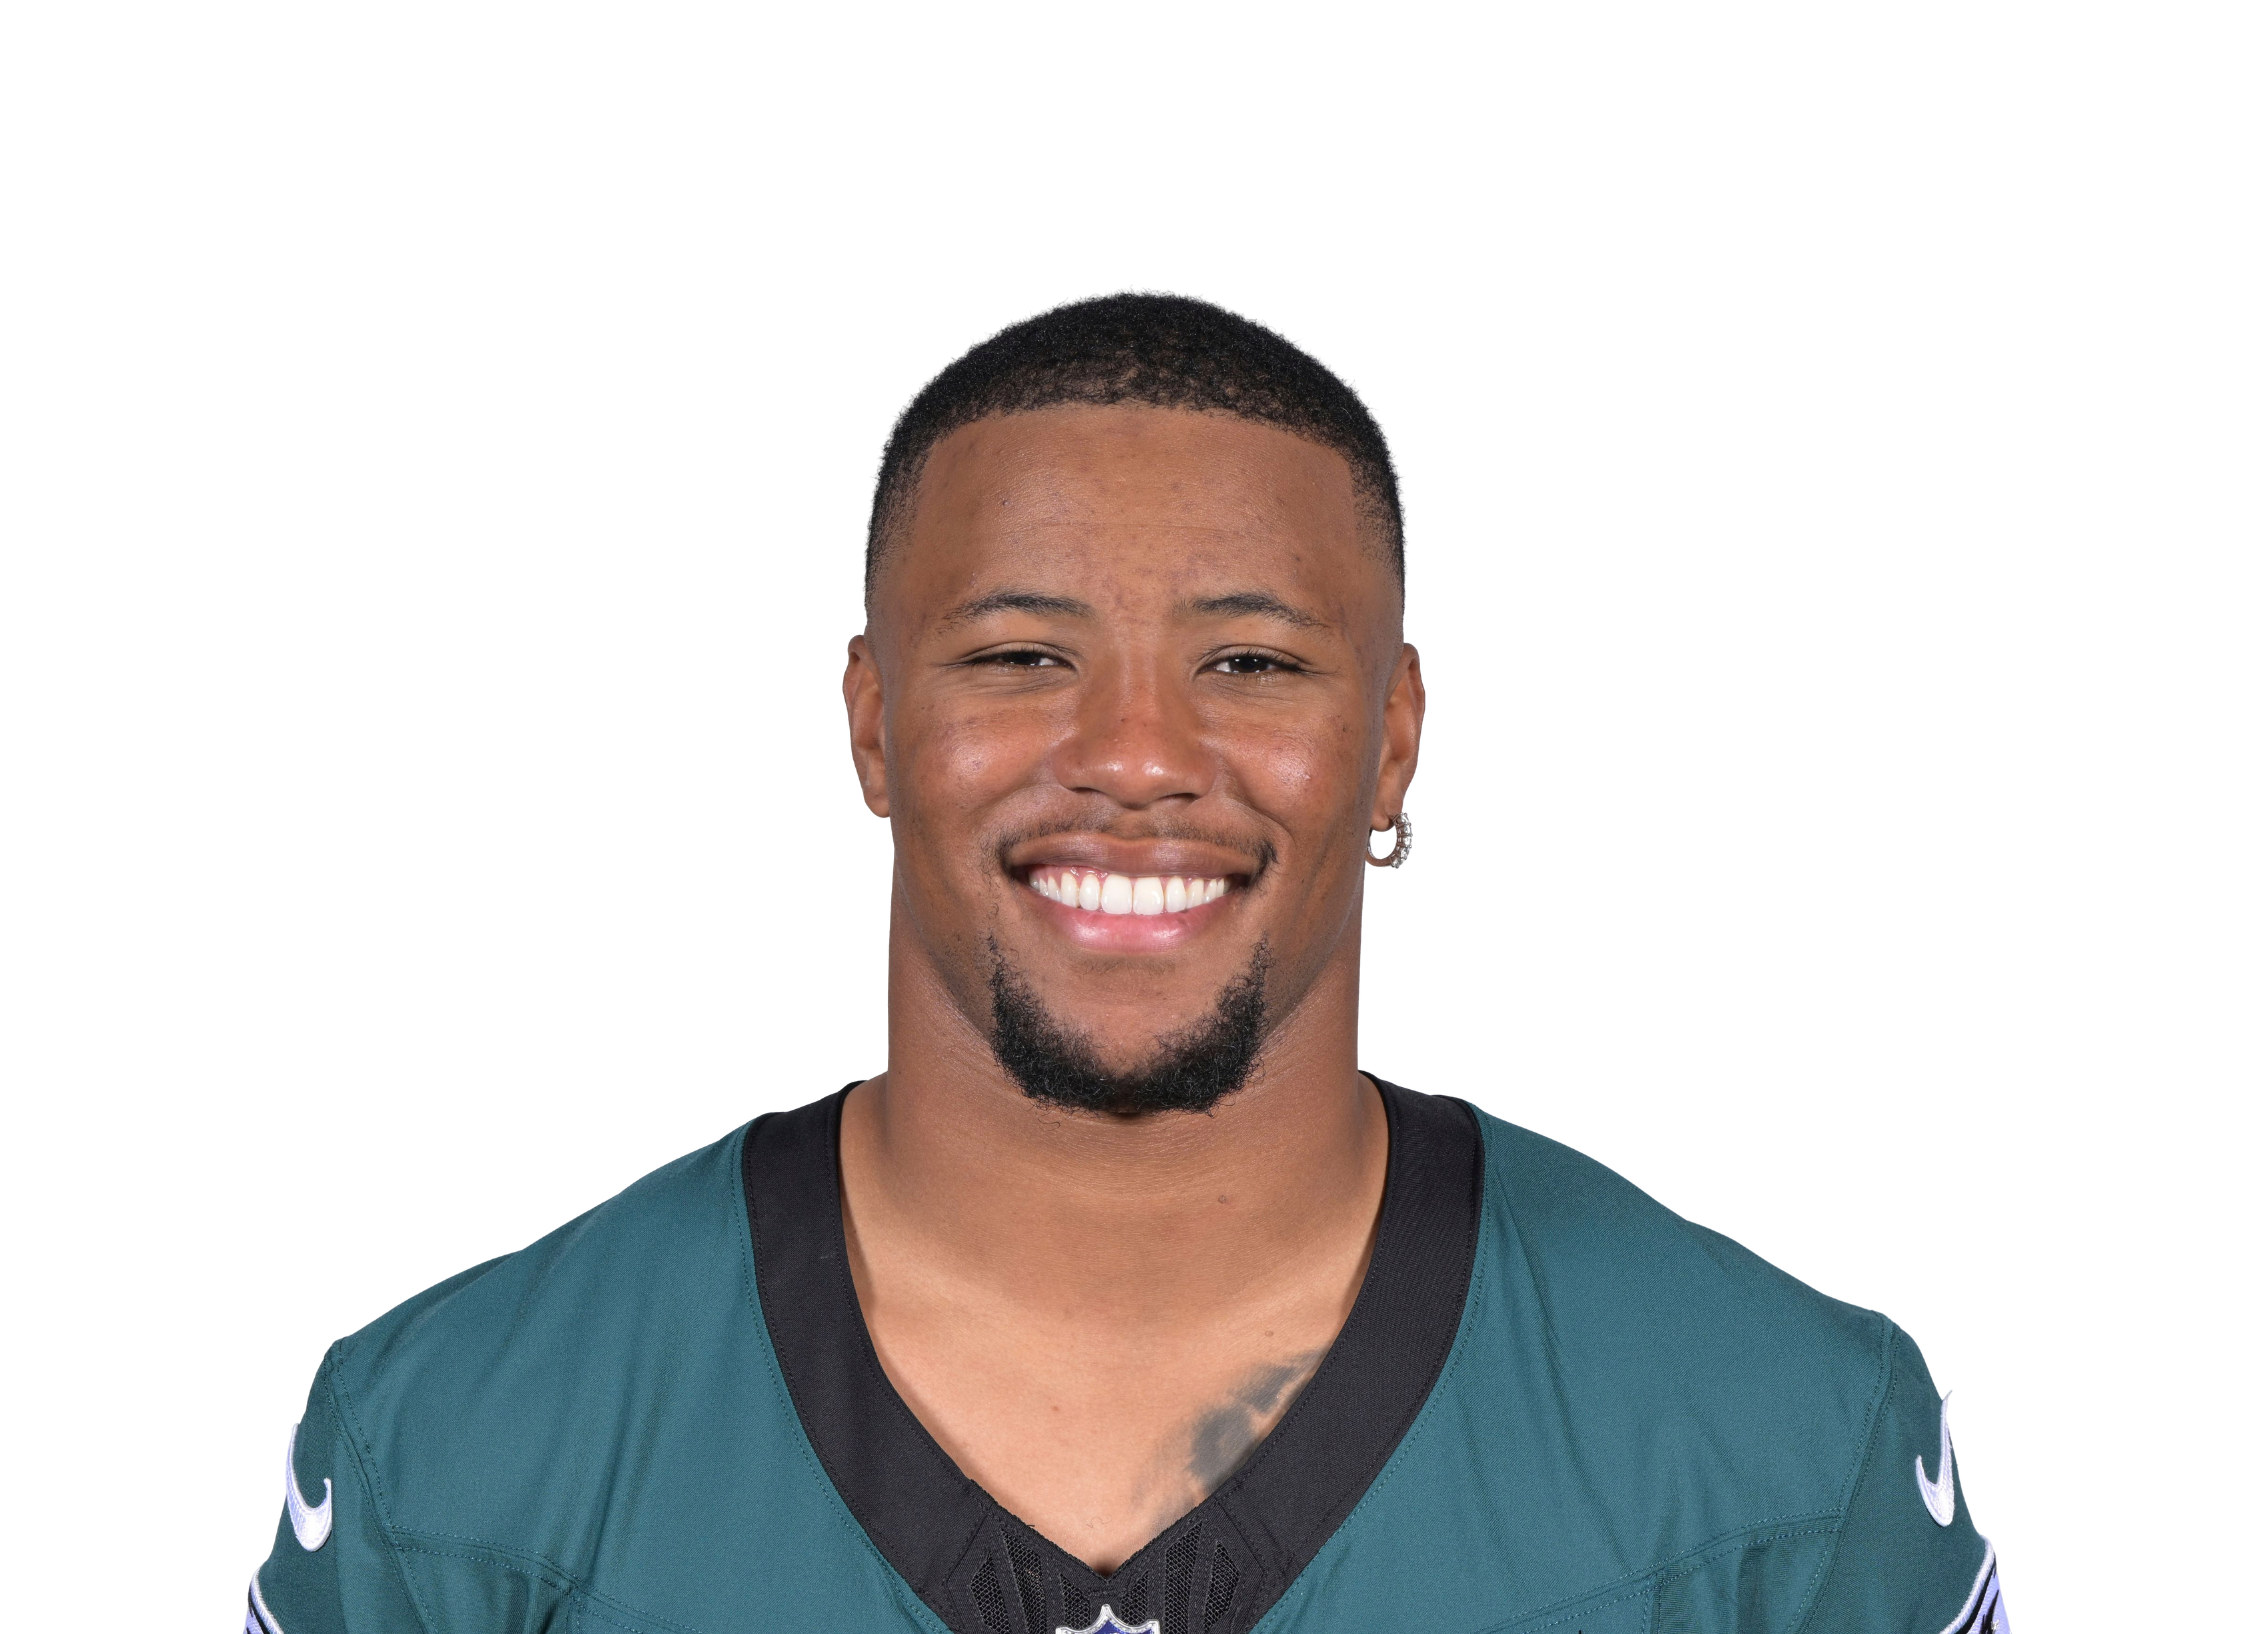 Saquon Barkley@ PHI • Wk 7 | 15.1 | 7 | 62 | 1 | 2 | 9 |
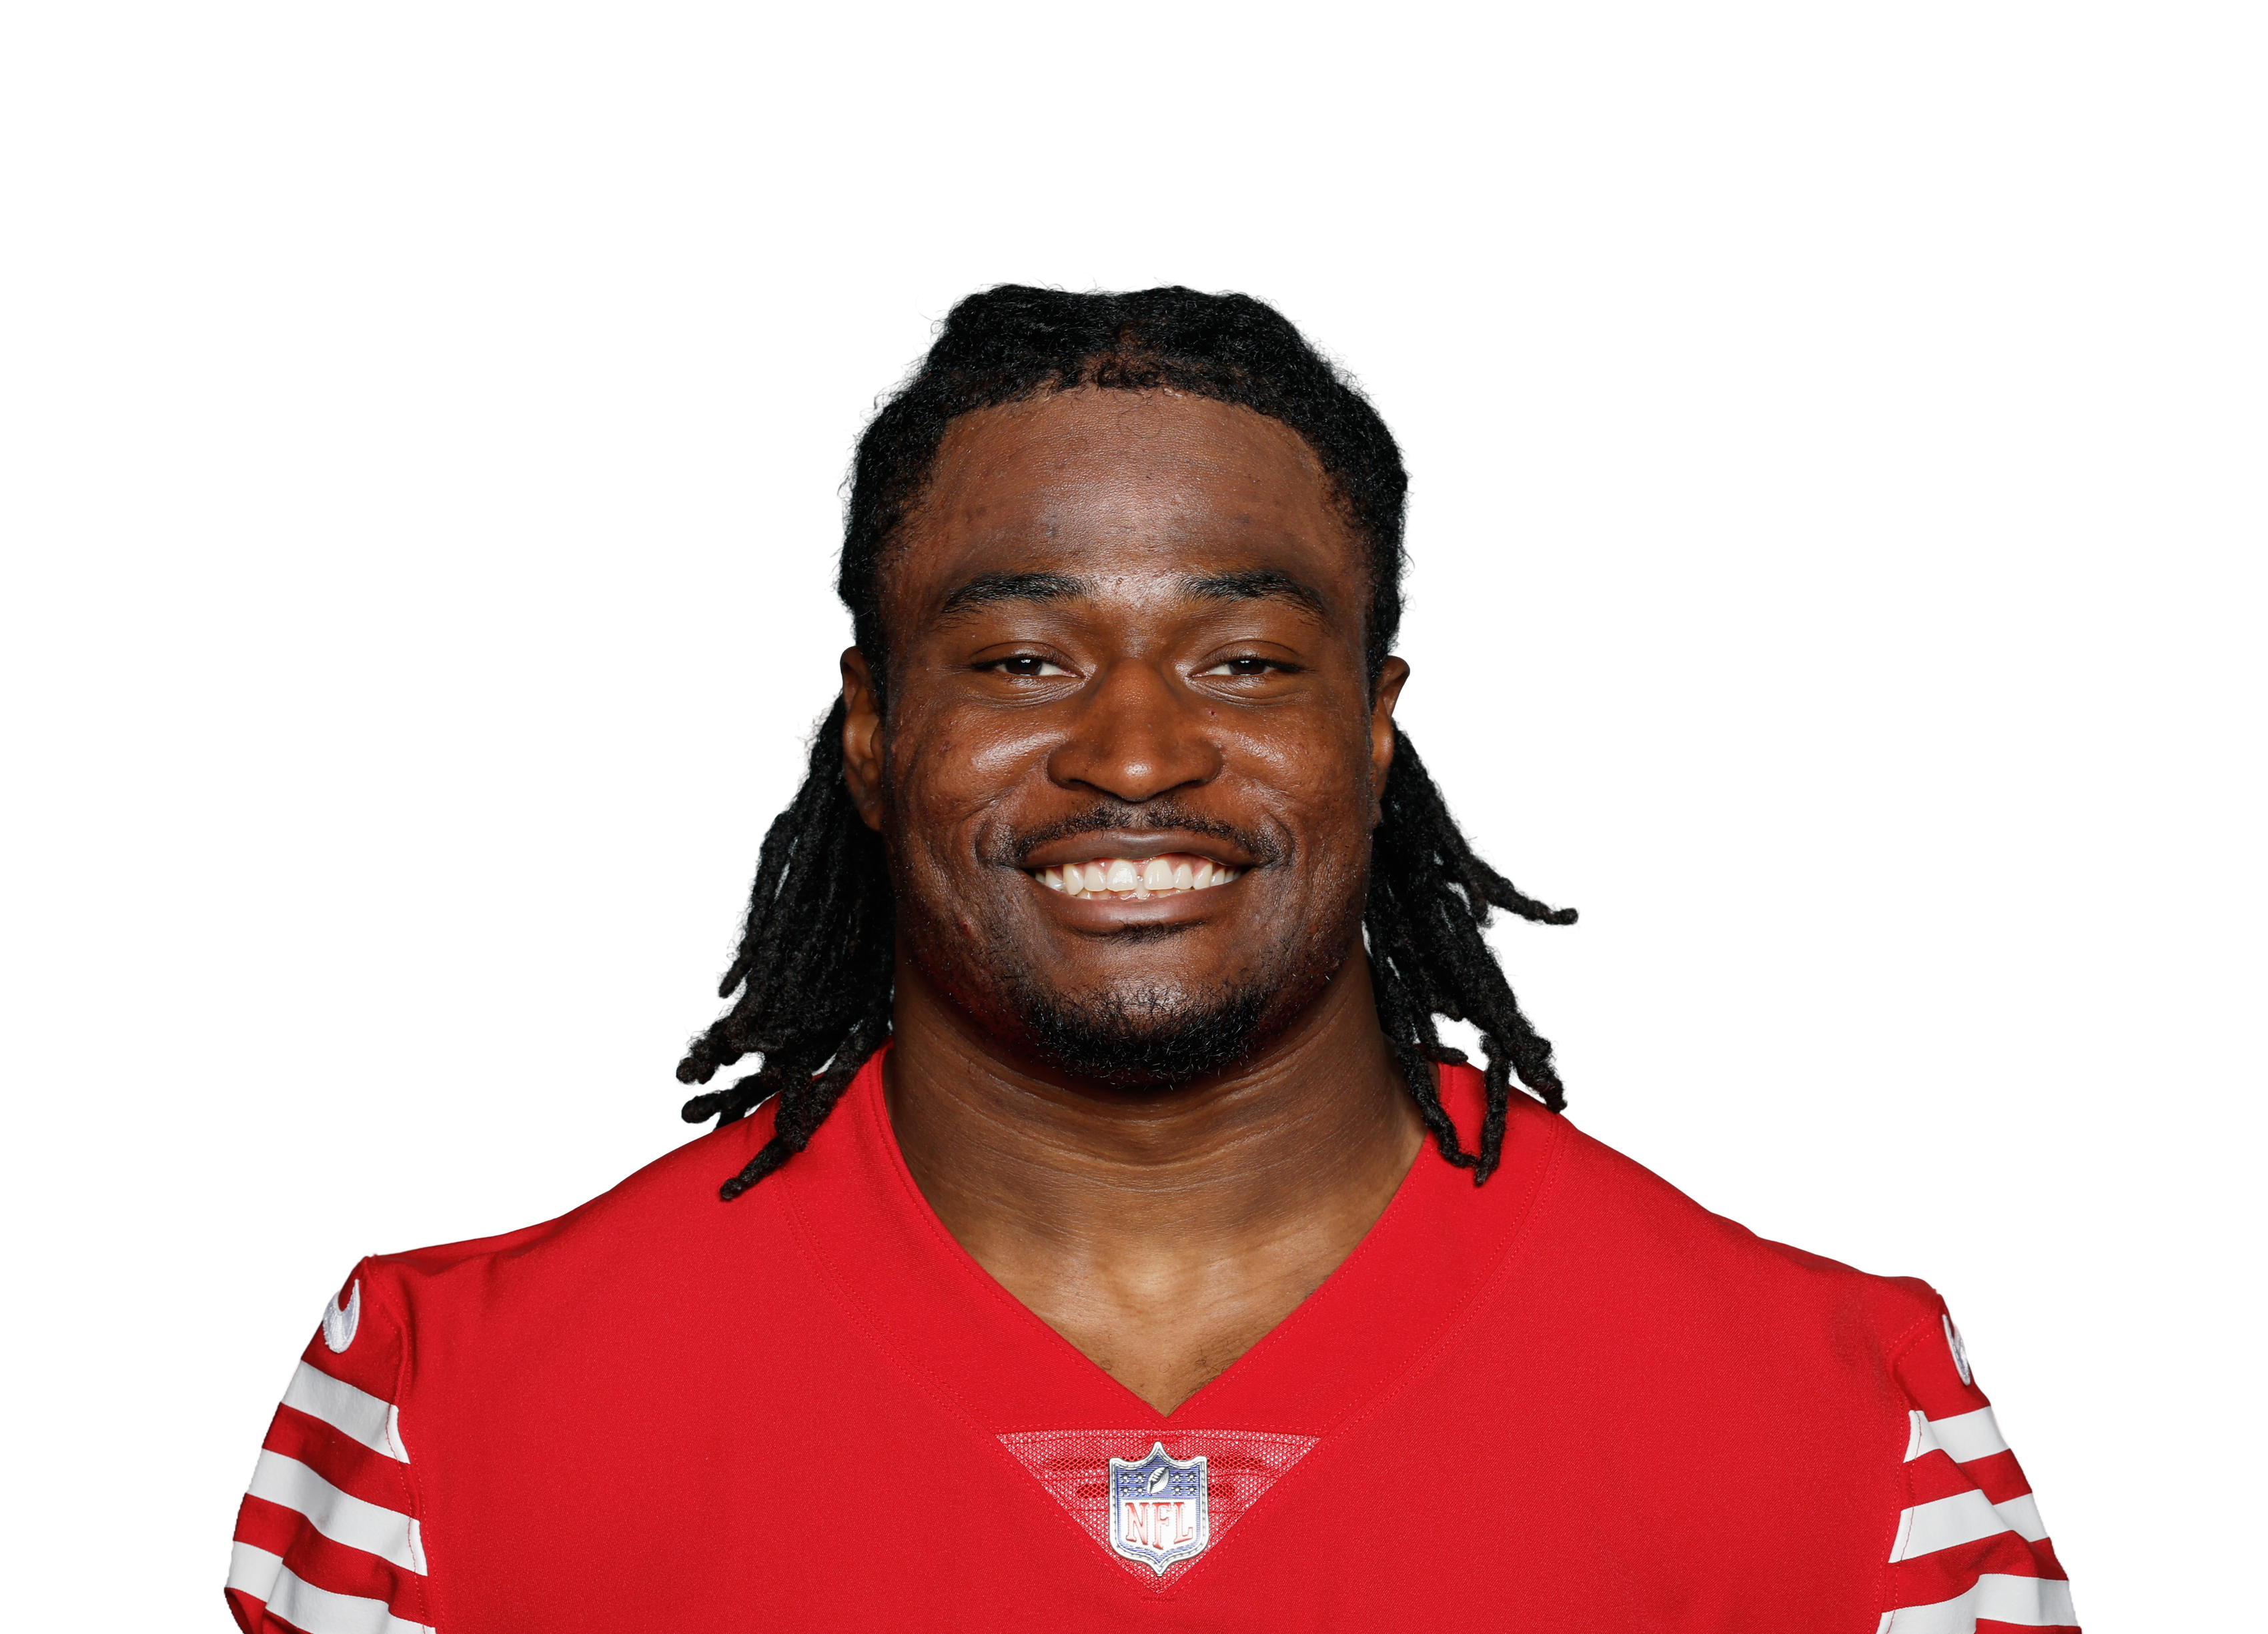 Kaelon Blackvs SF • Wk 10 | 14.6 | 11 | 53 | 1 | 2 | 13 |
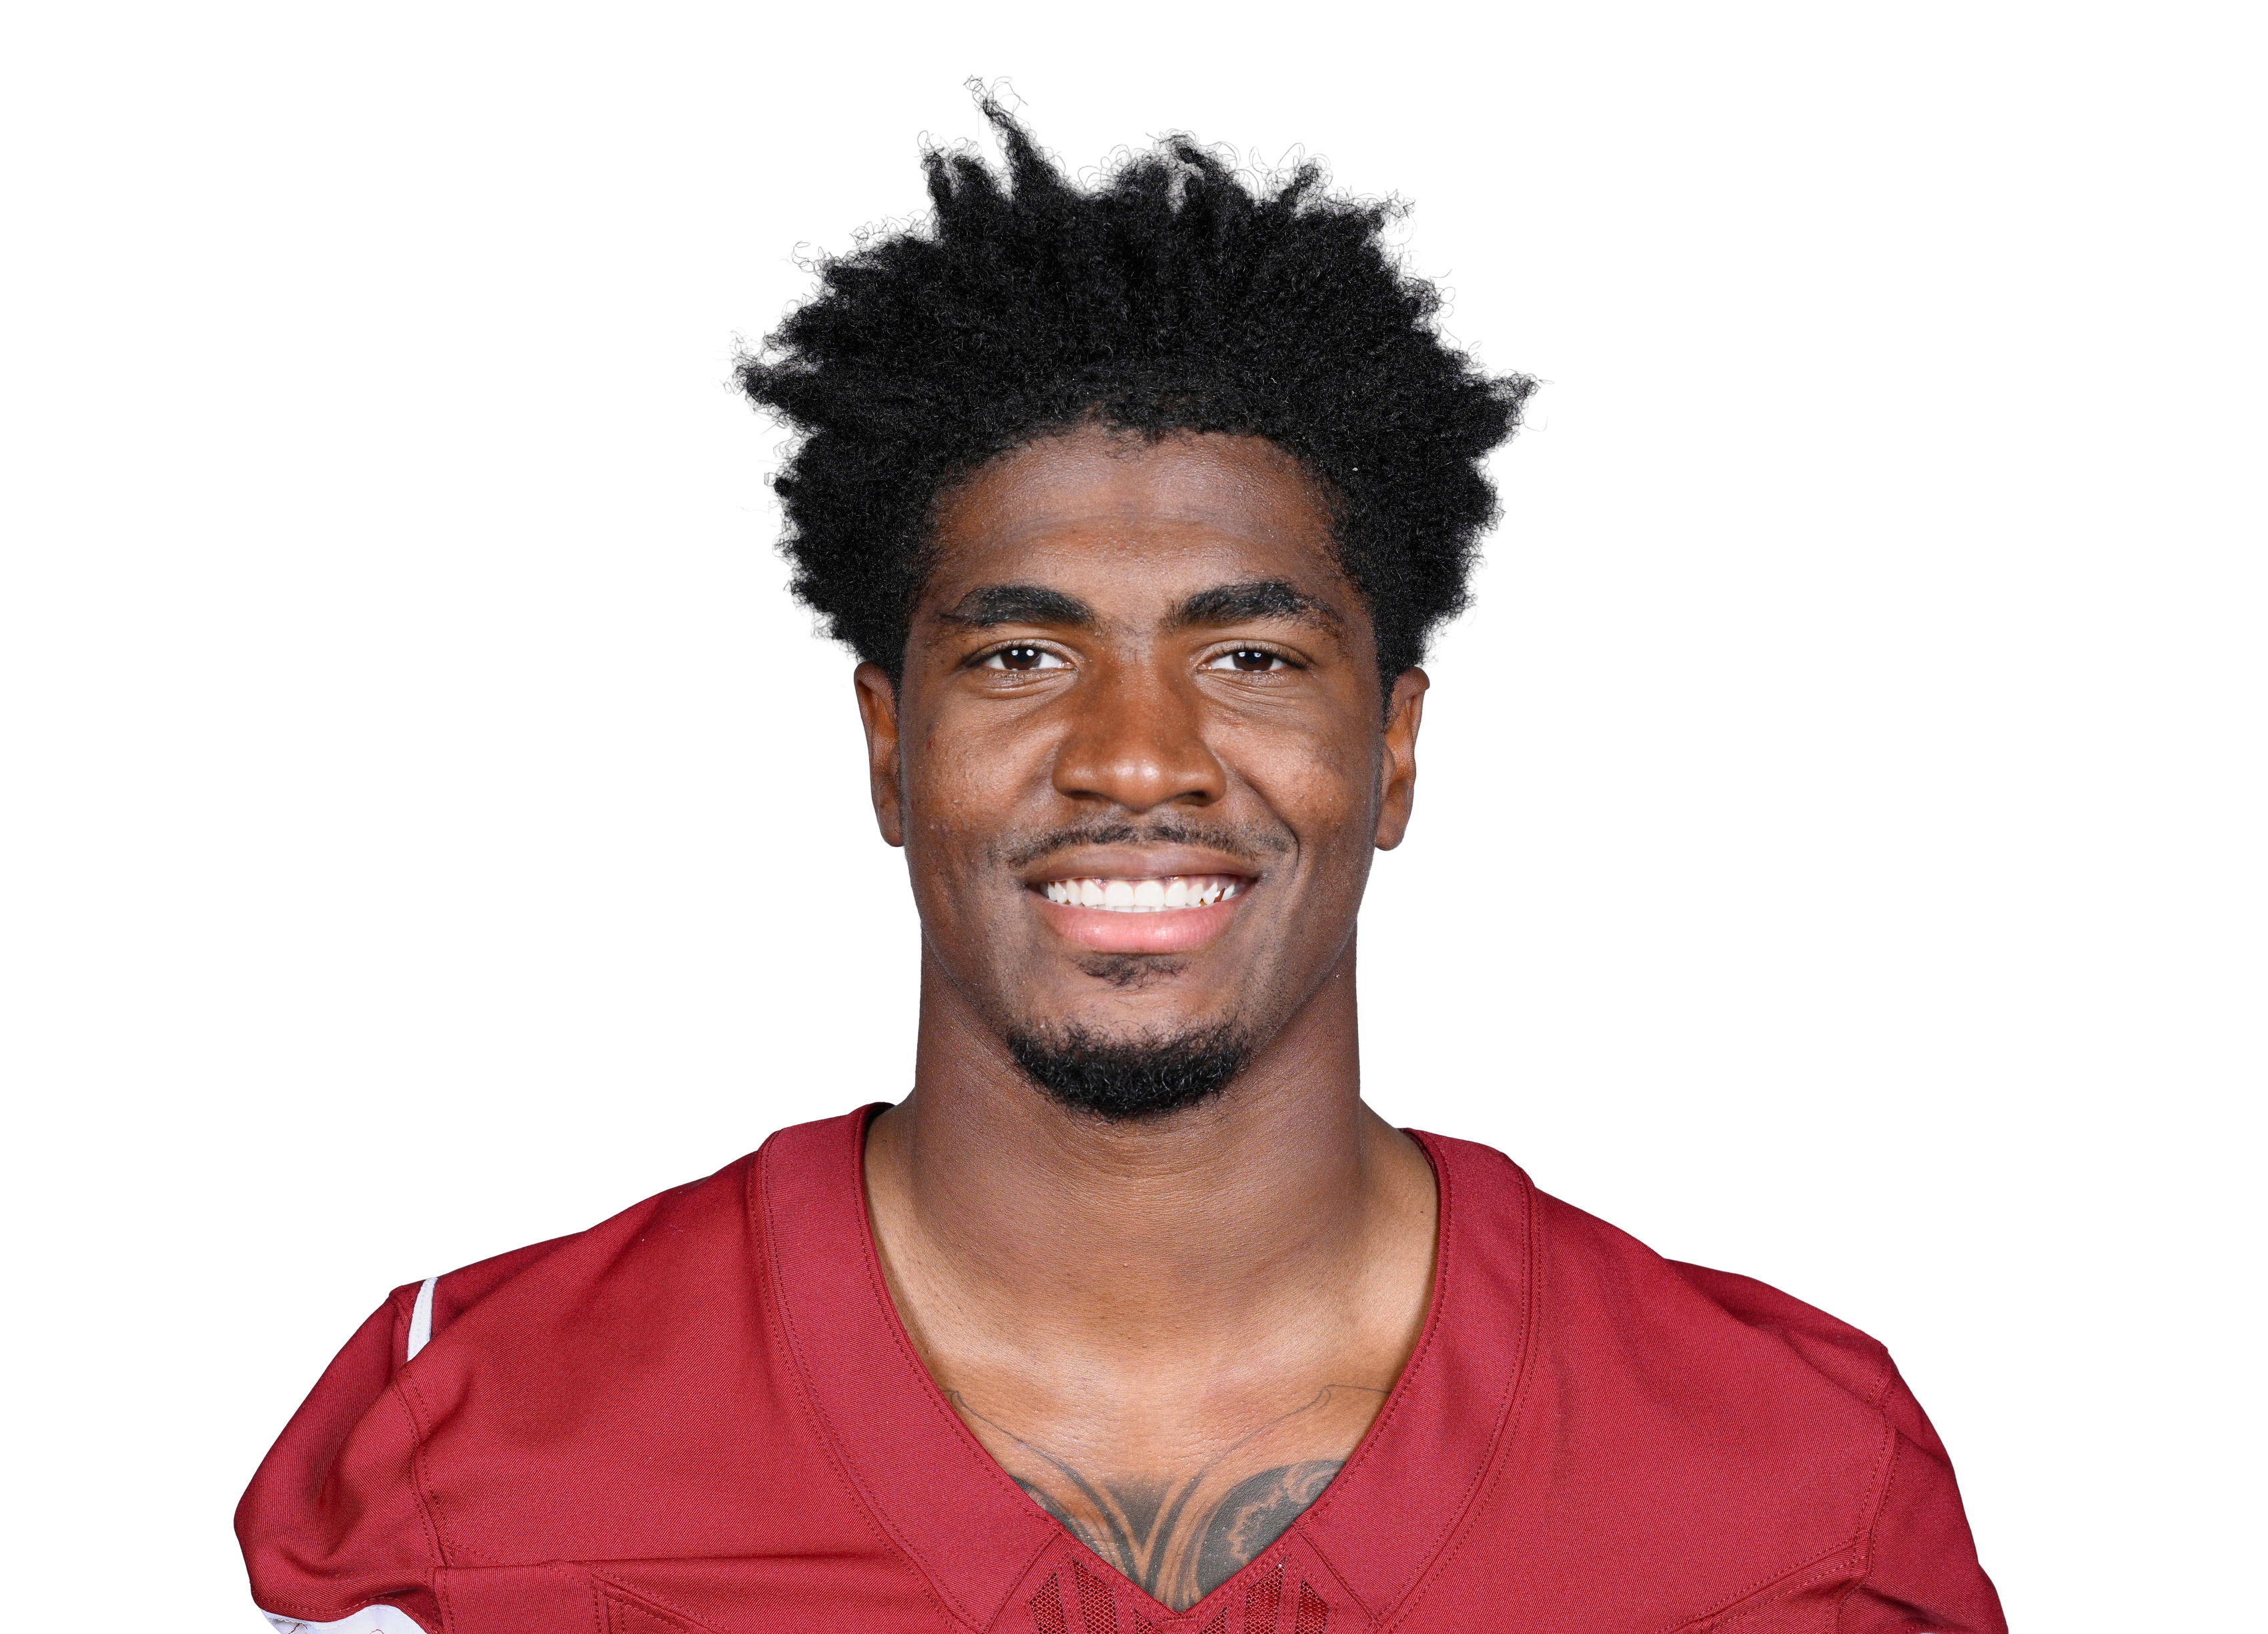 Rachaad Whitevs WAS • Wk 2 | 14.3 | 7 | 43 | 0 | 6 | 40 |
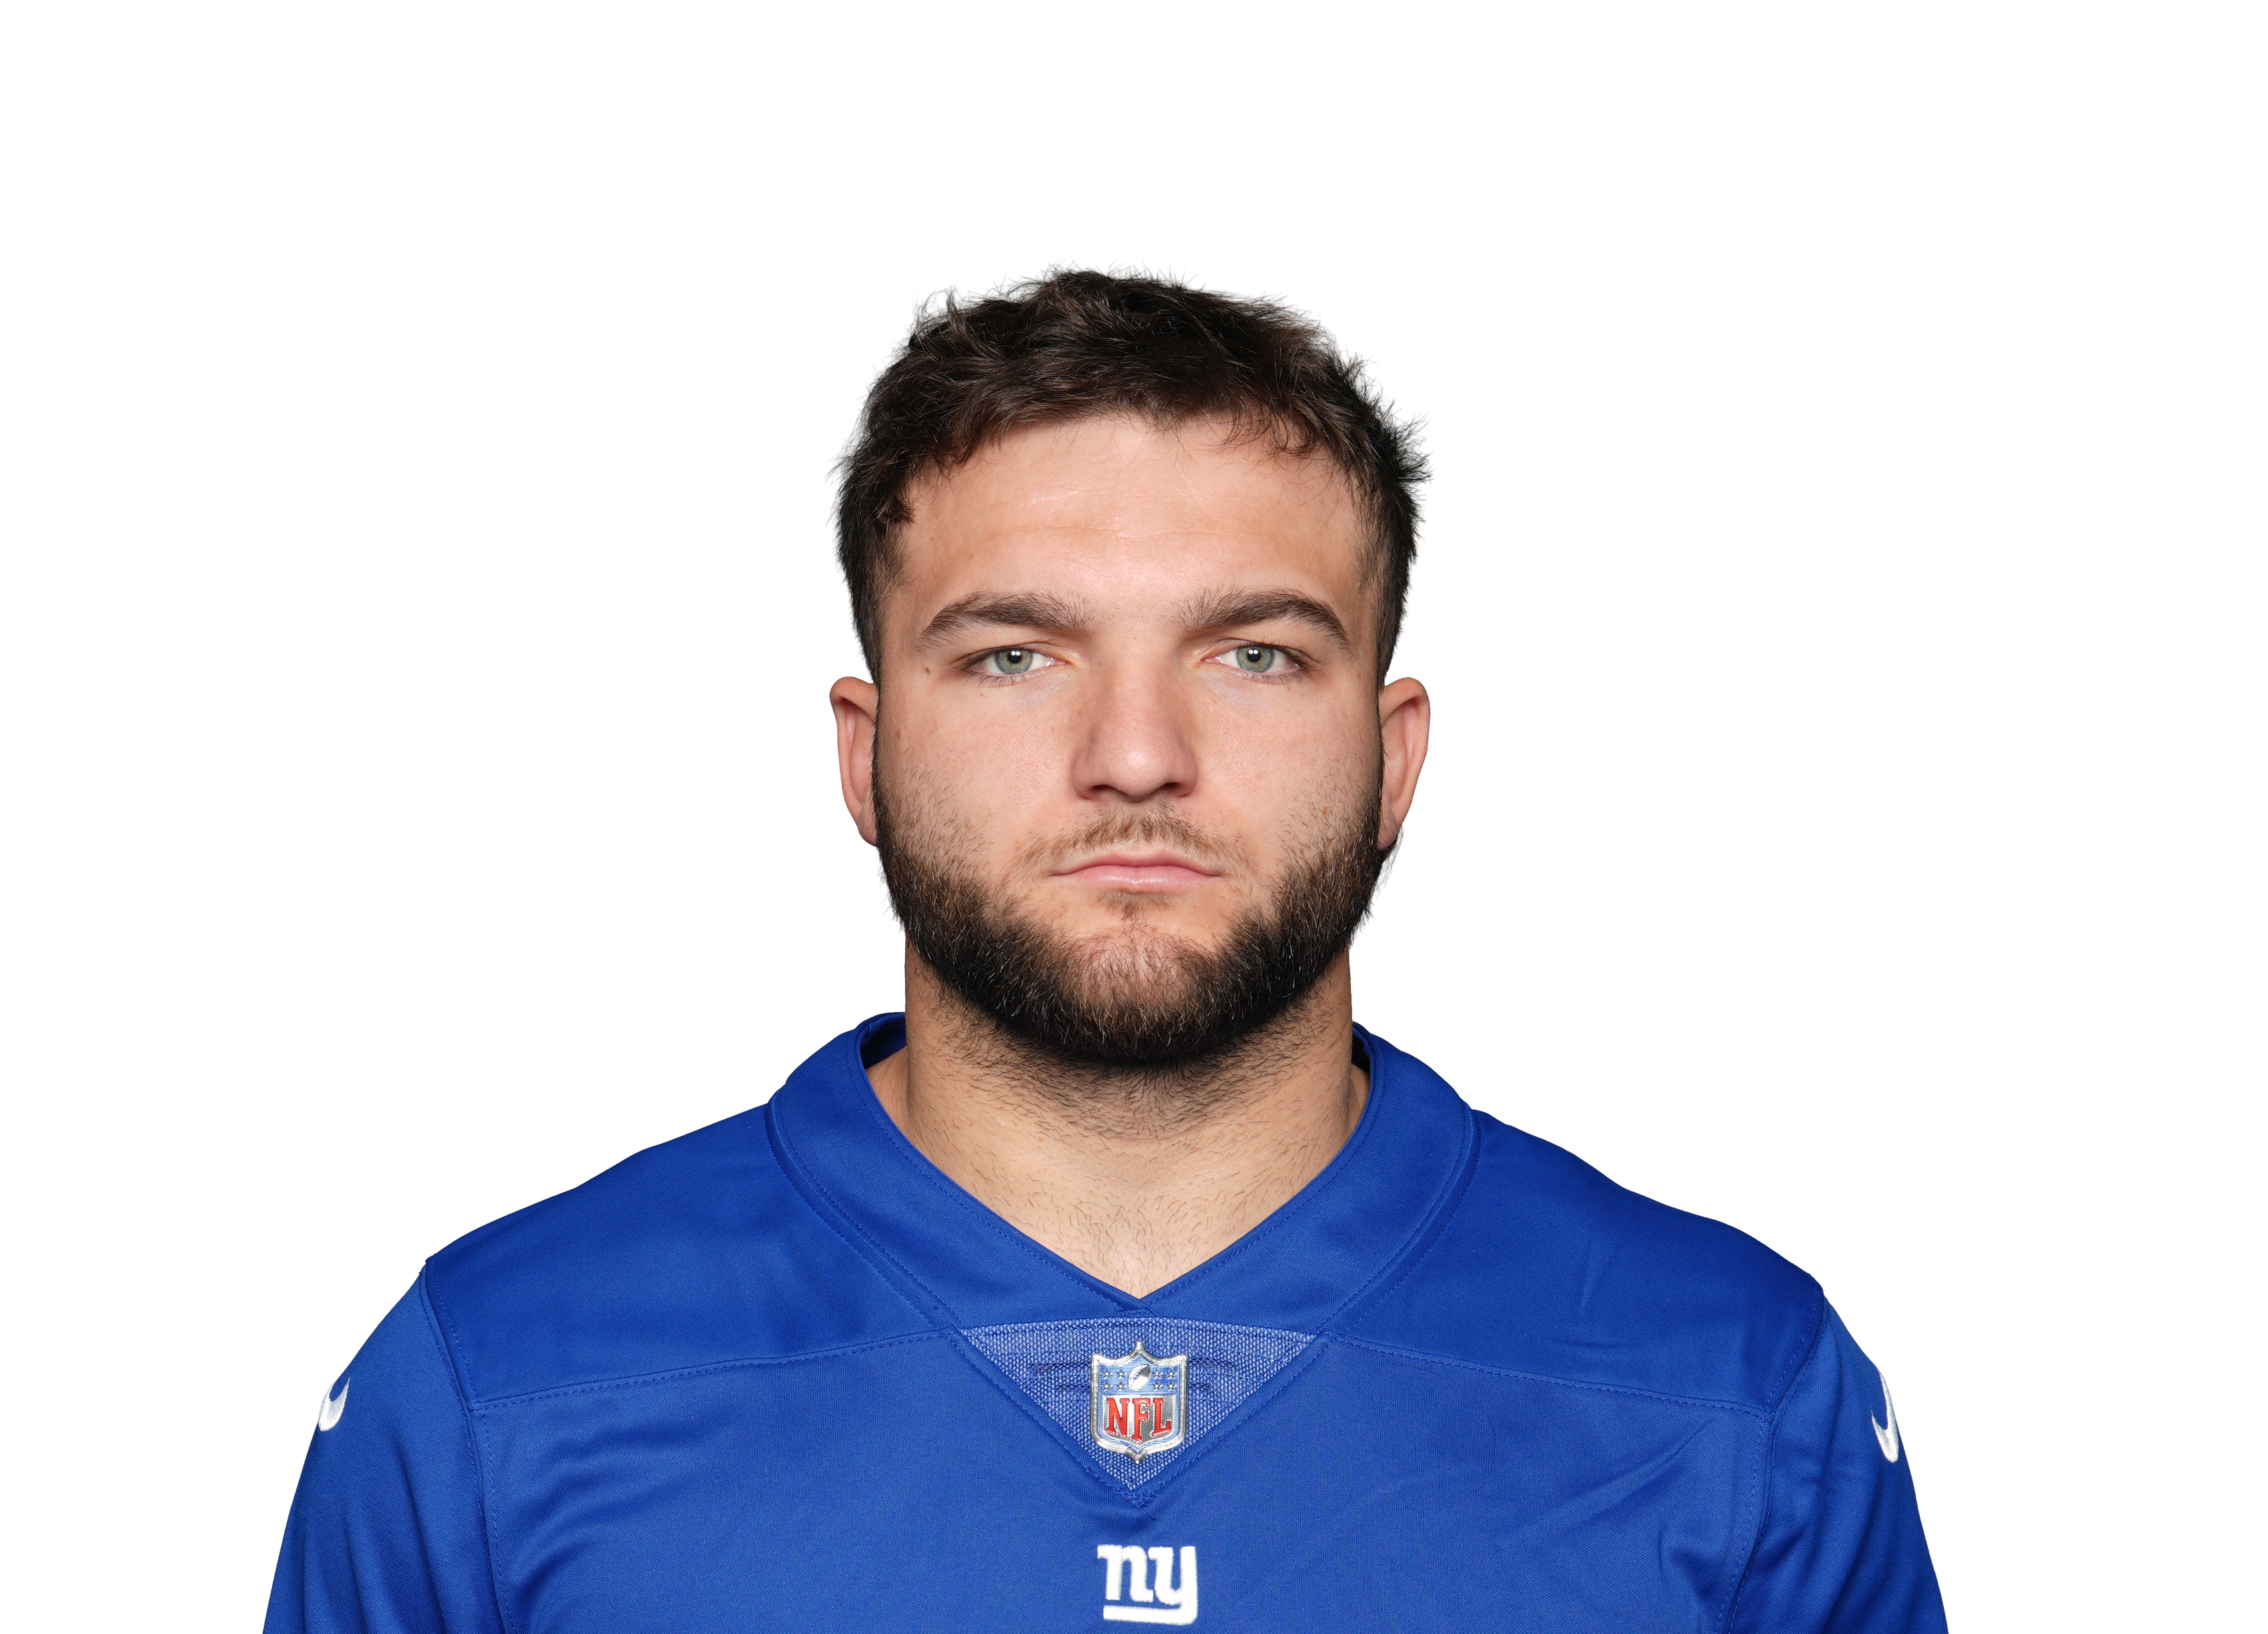 Cam Skattebo@ NYG • Wk 1 | 14.1 | 18 | 81 | 1 | 0 | 0 |
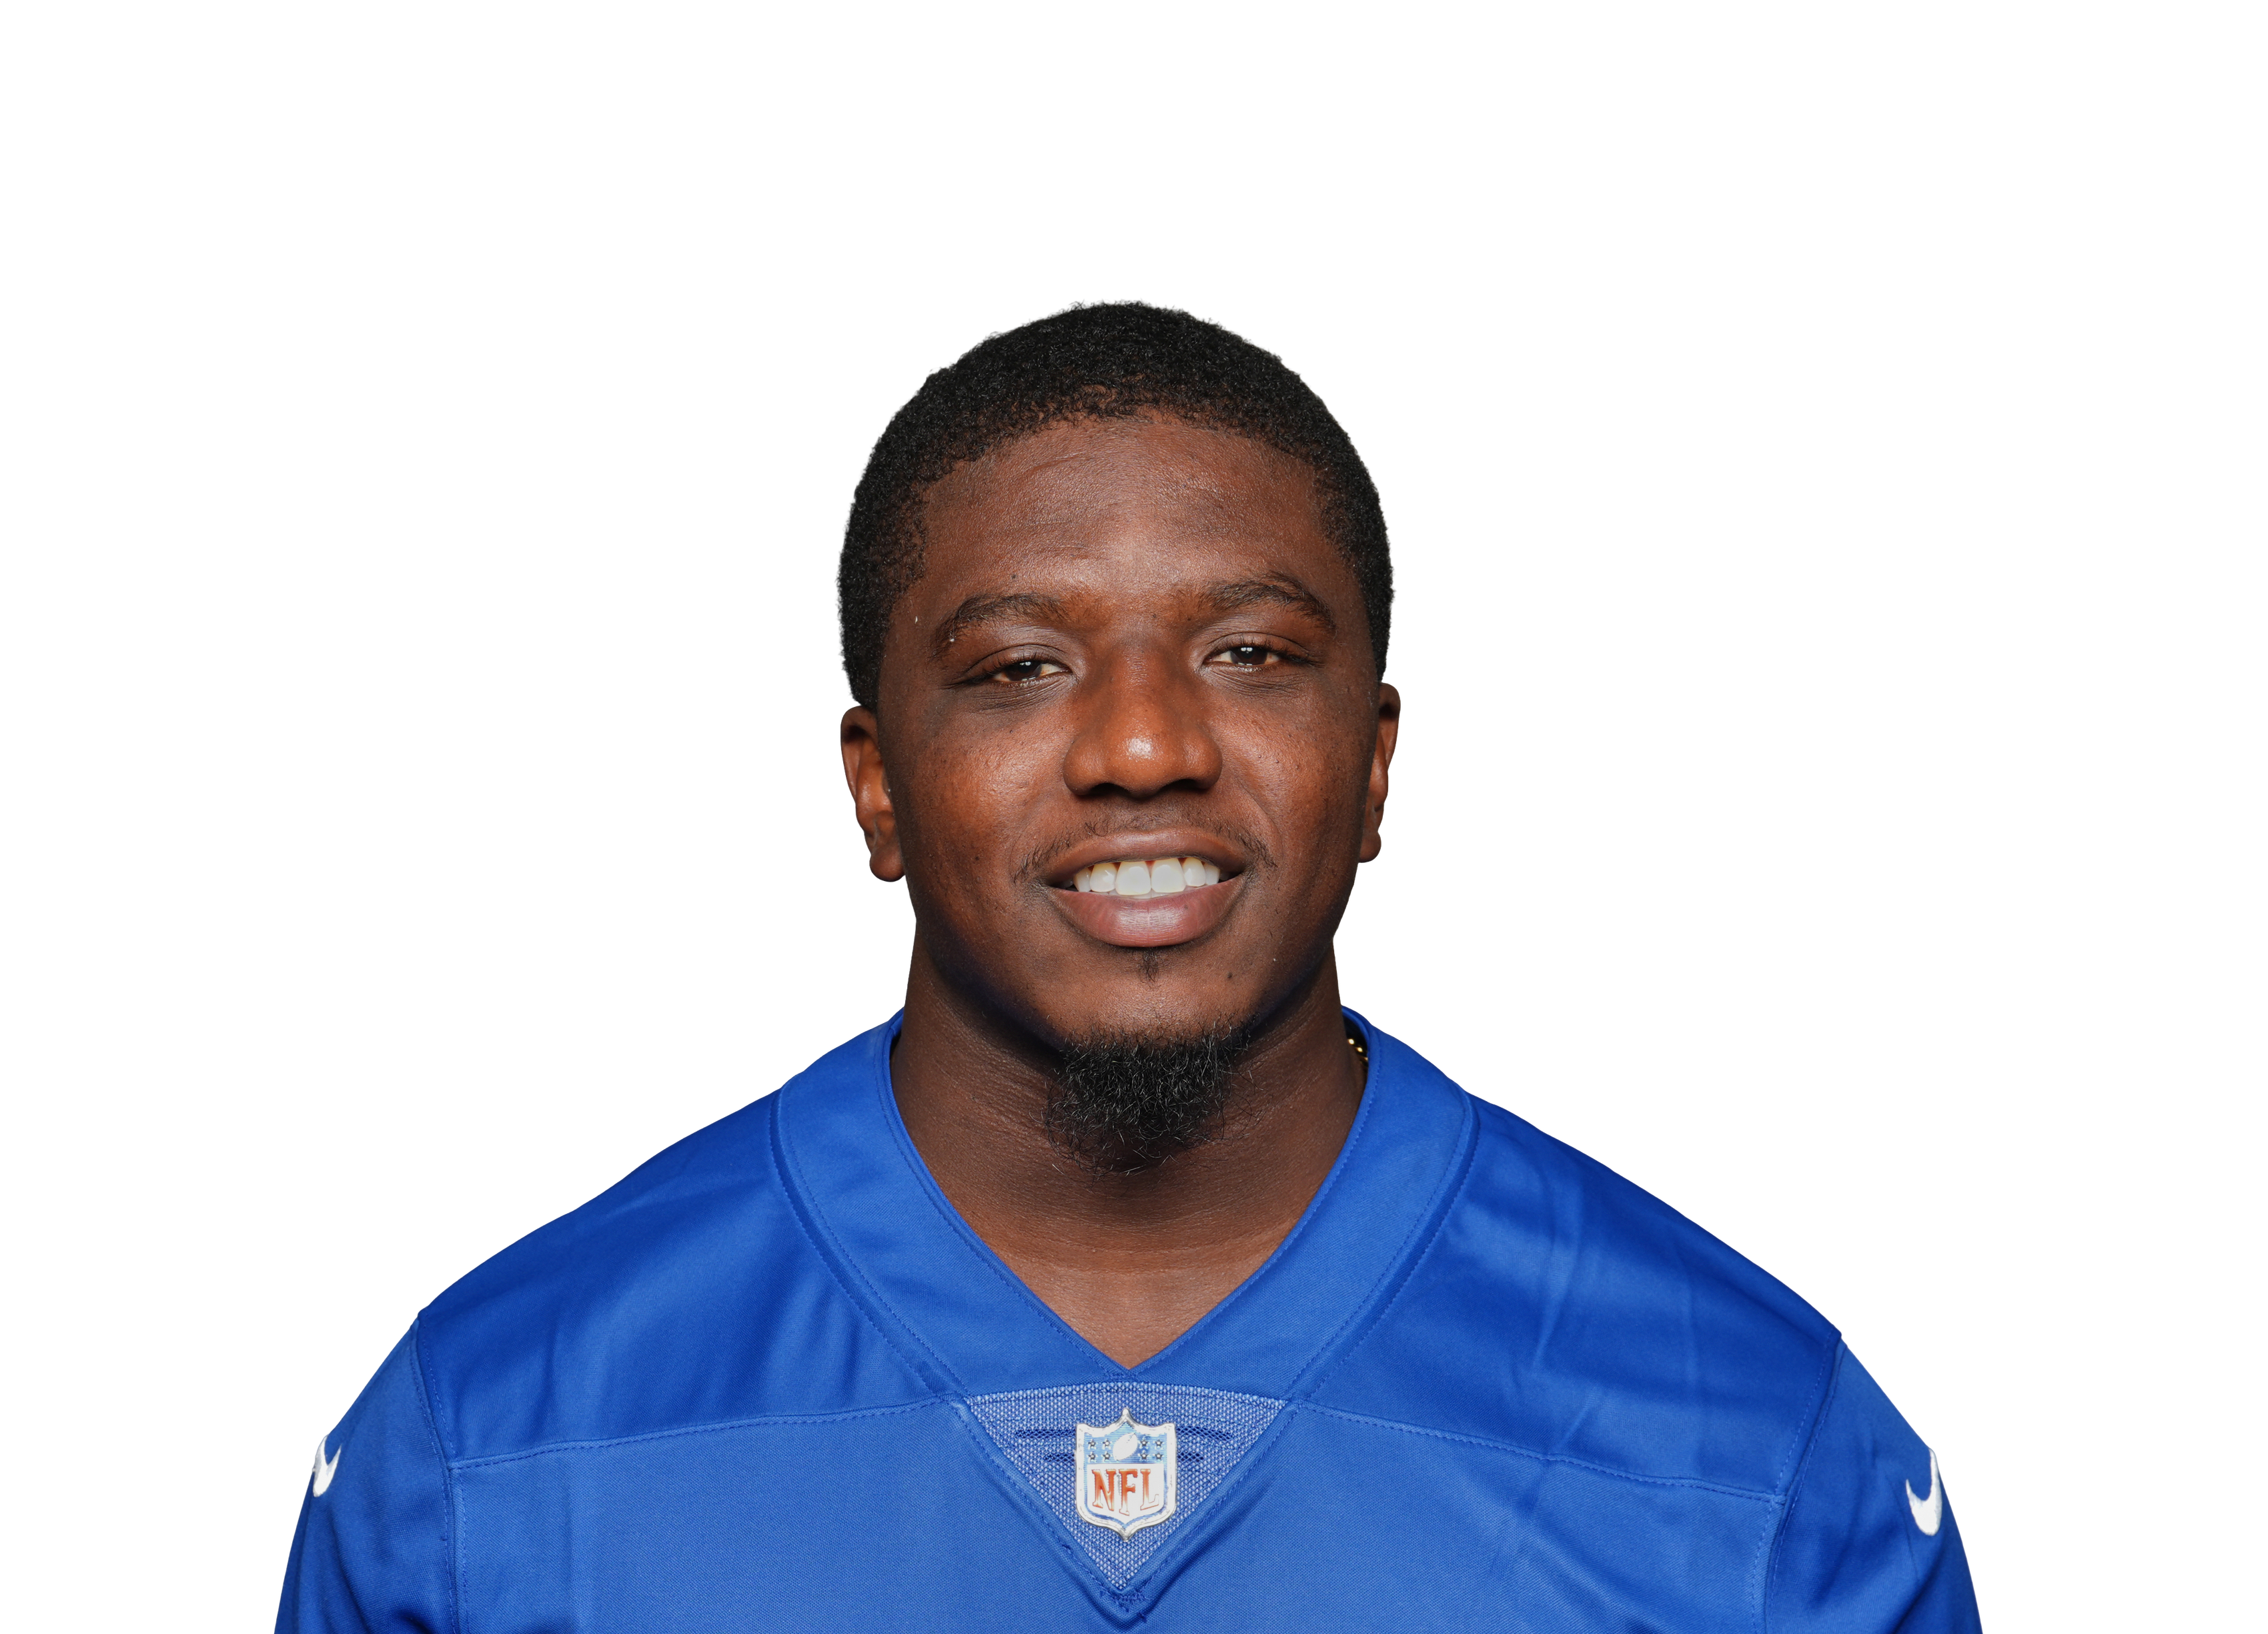 Devin Singletary@ NYG • Wk 1 | 13.8 | 6 | 16 | 0 | 4 | 22 |
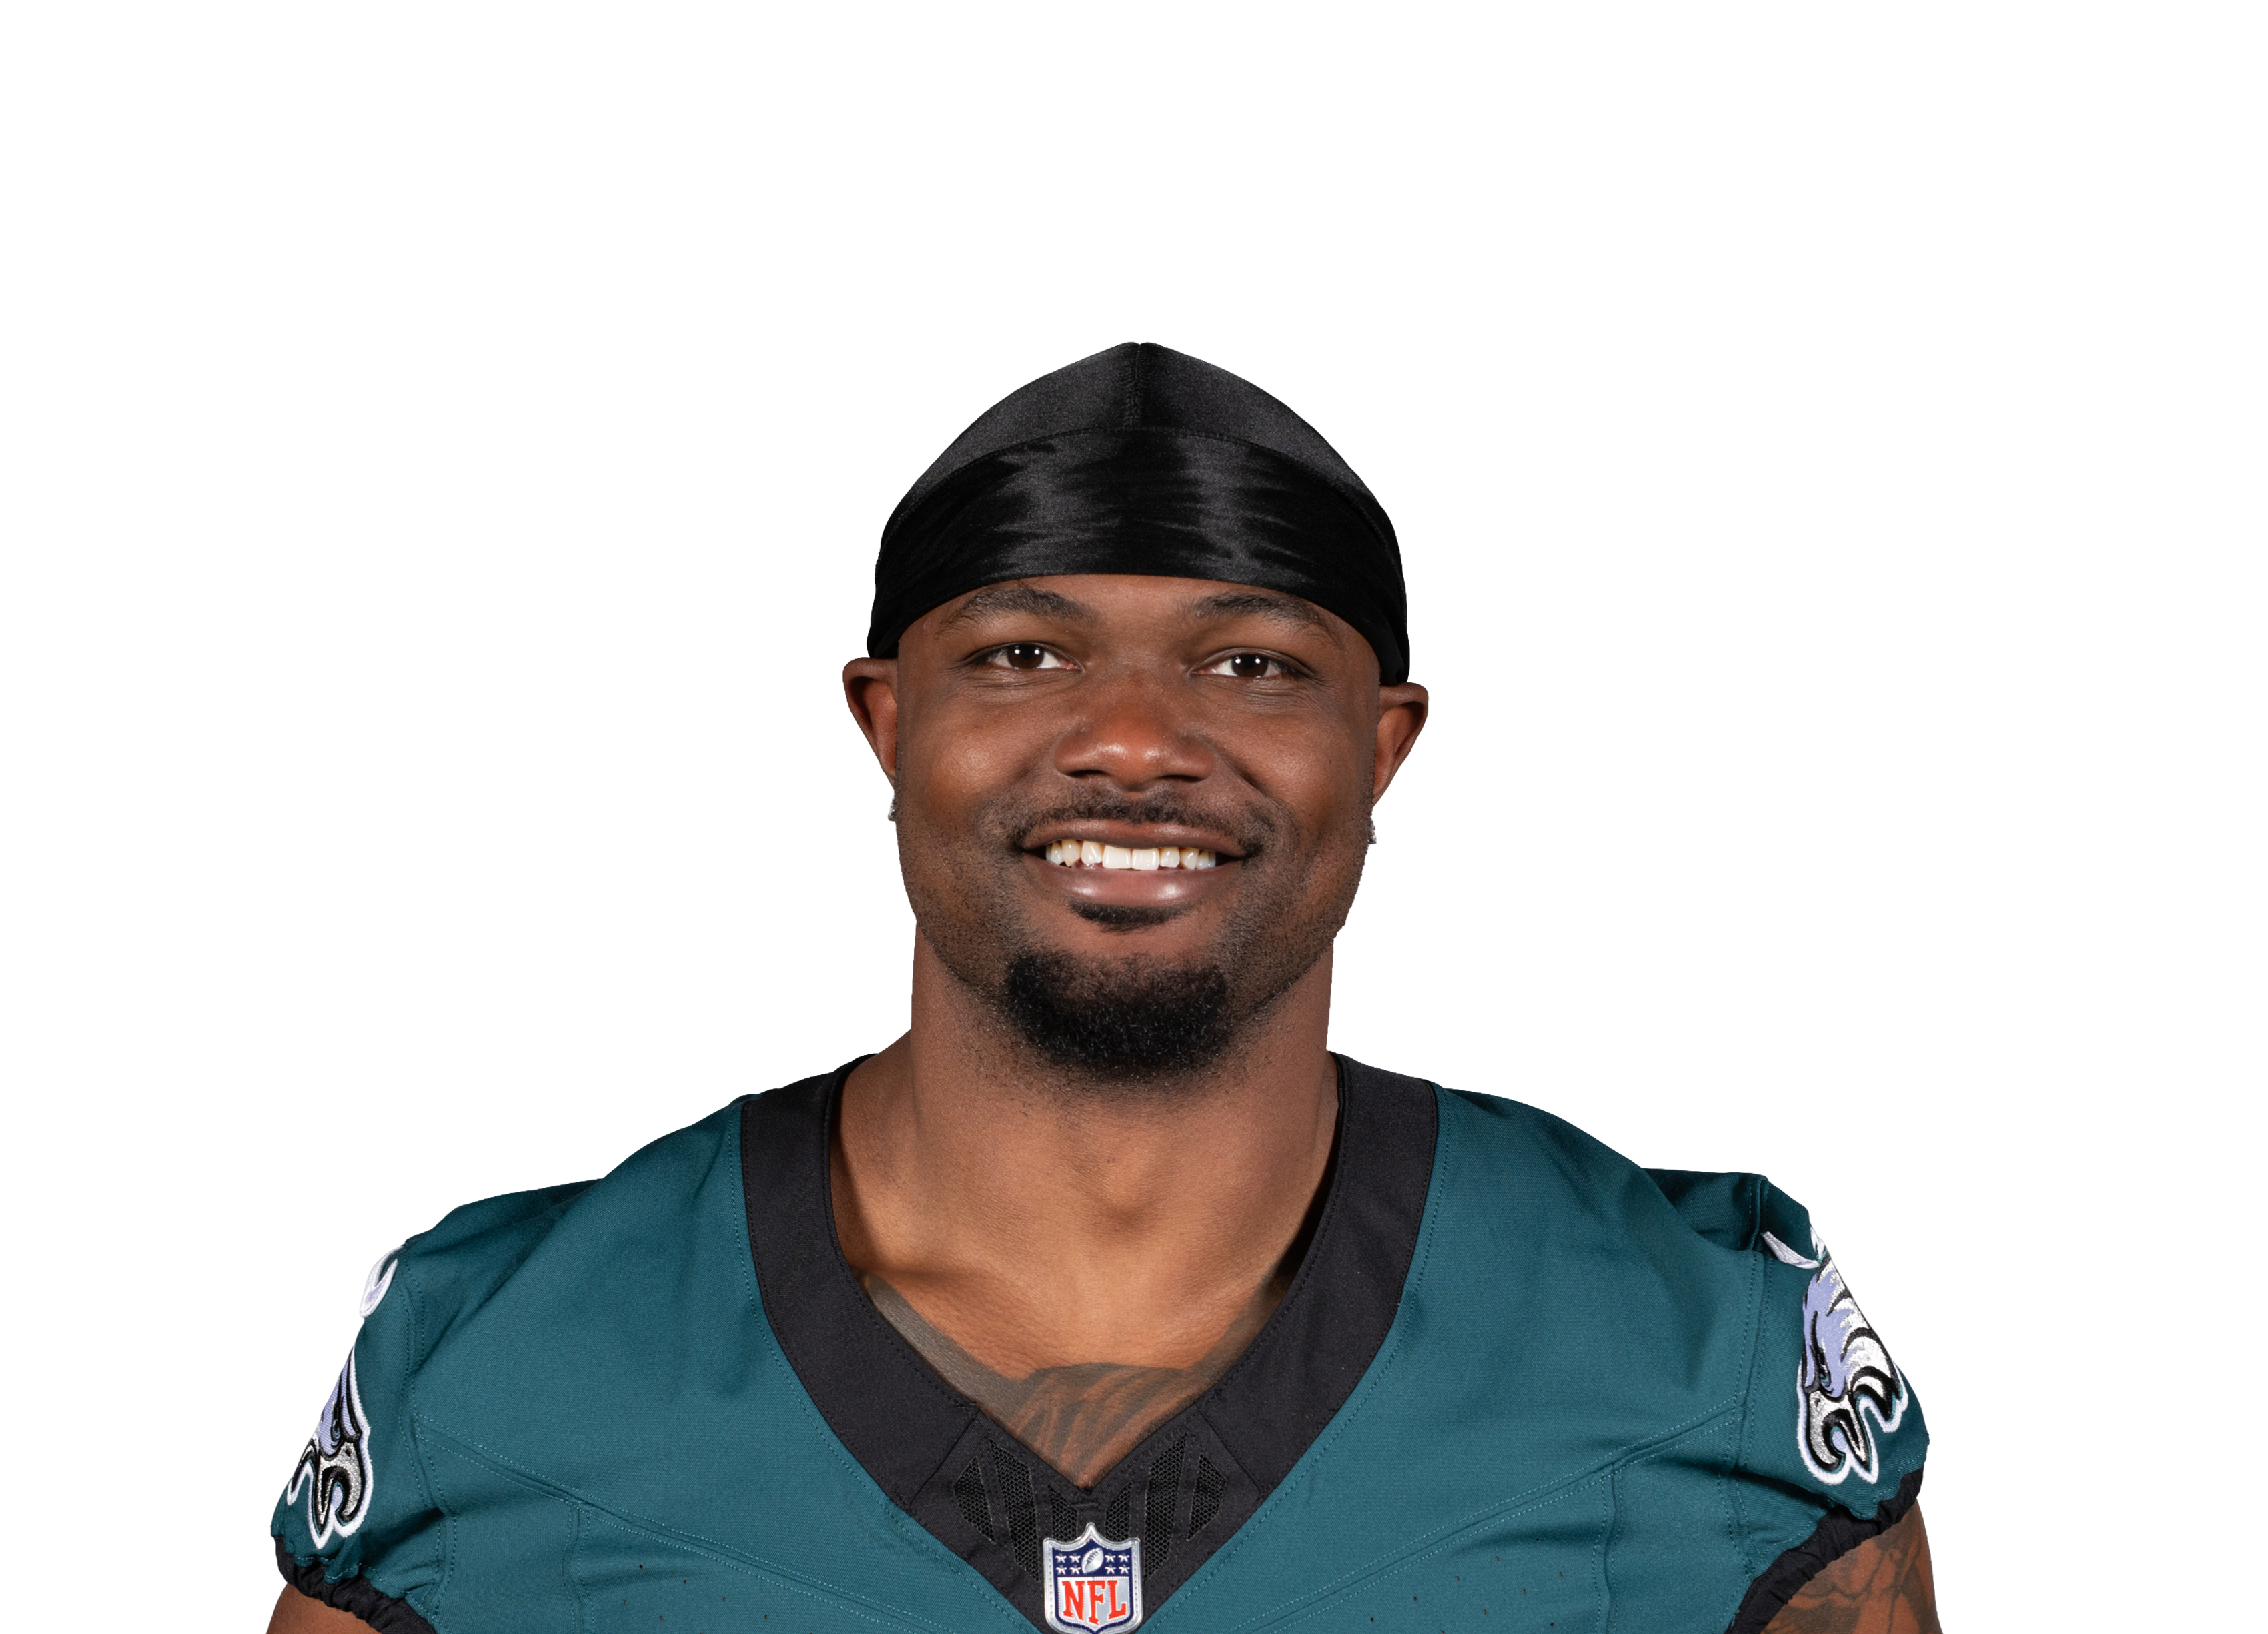 Dameon Pierce@ PHI • Wk 7 | 11.8 | 14 | 47 | 1 | 1 | 1 |
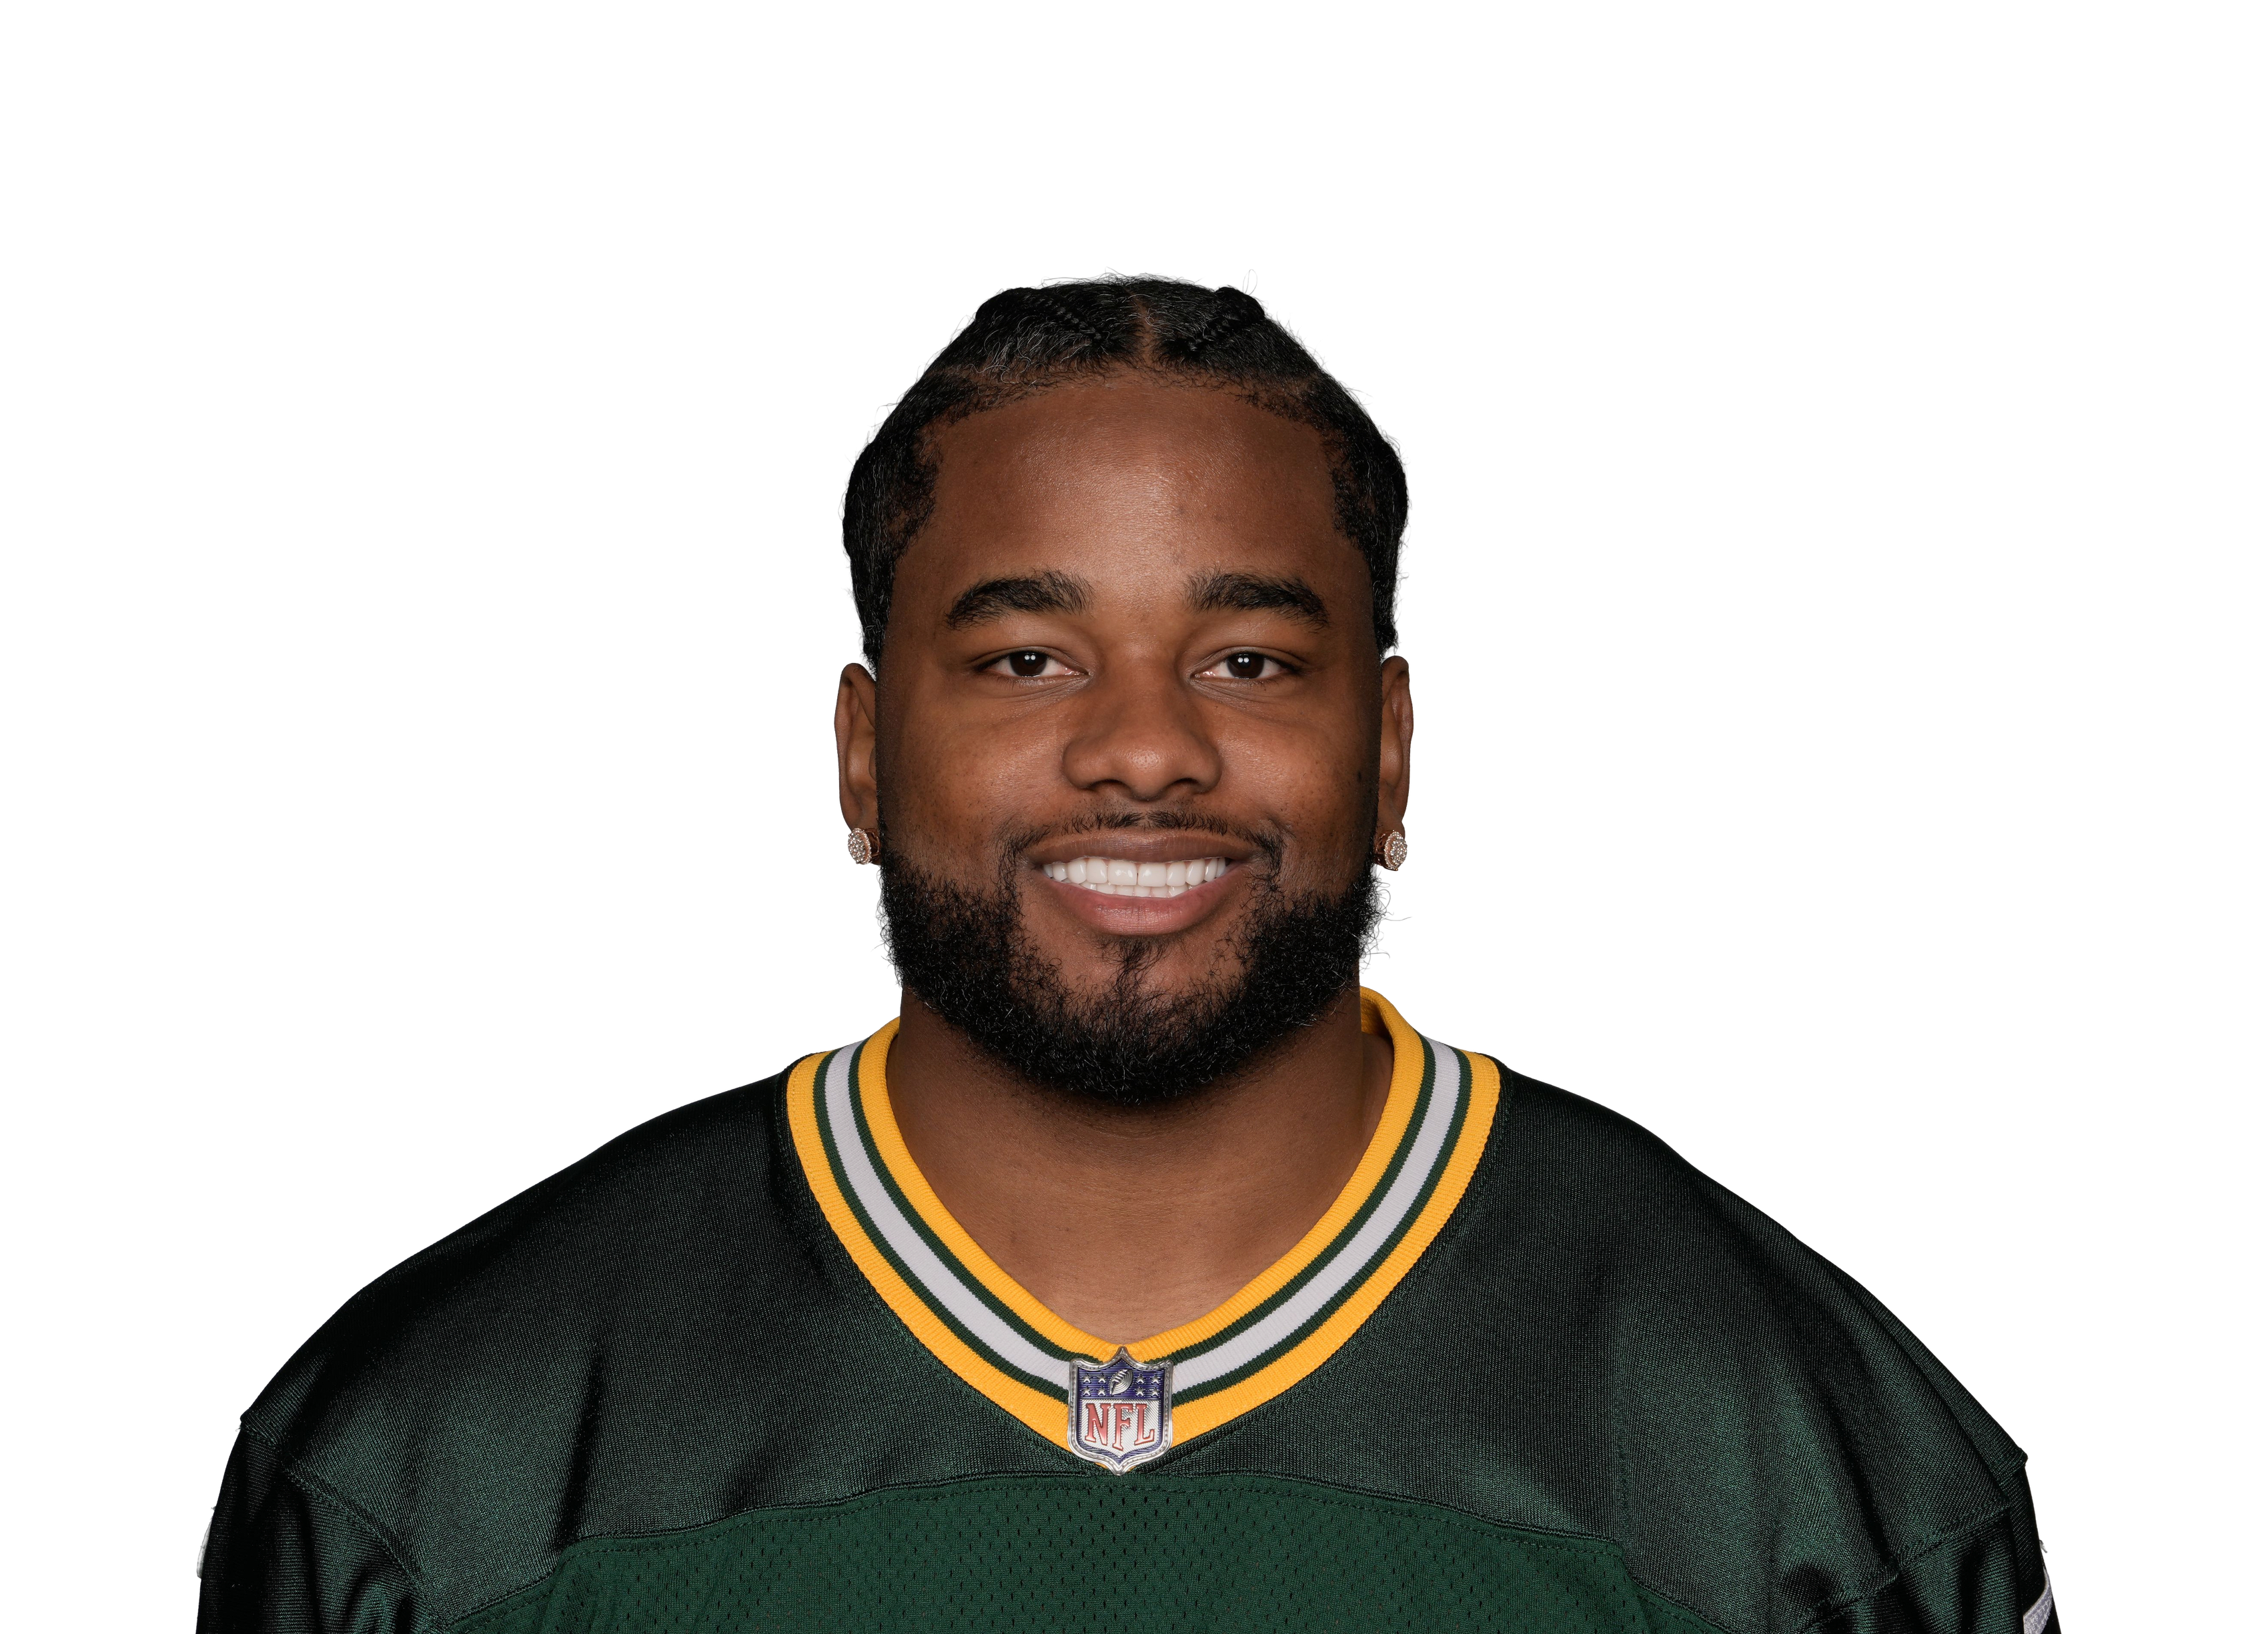 Pierre Strong@ GB • Wk 6 | 11.7 | 11 | 28 | 0 | 5 | 39 |
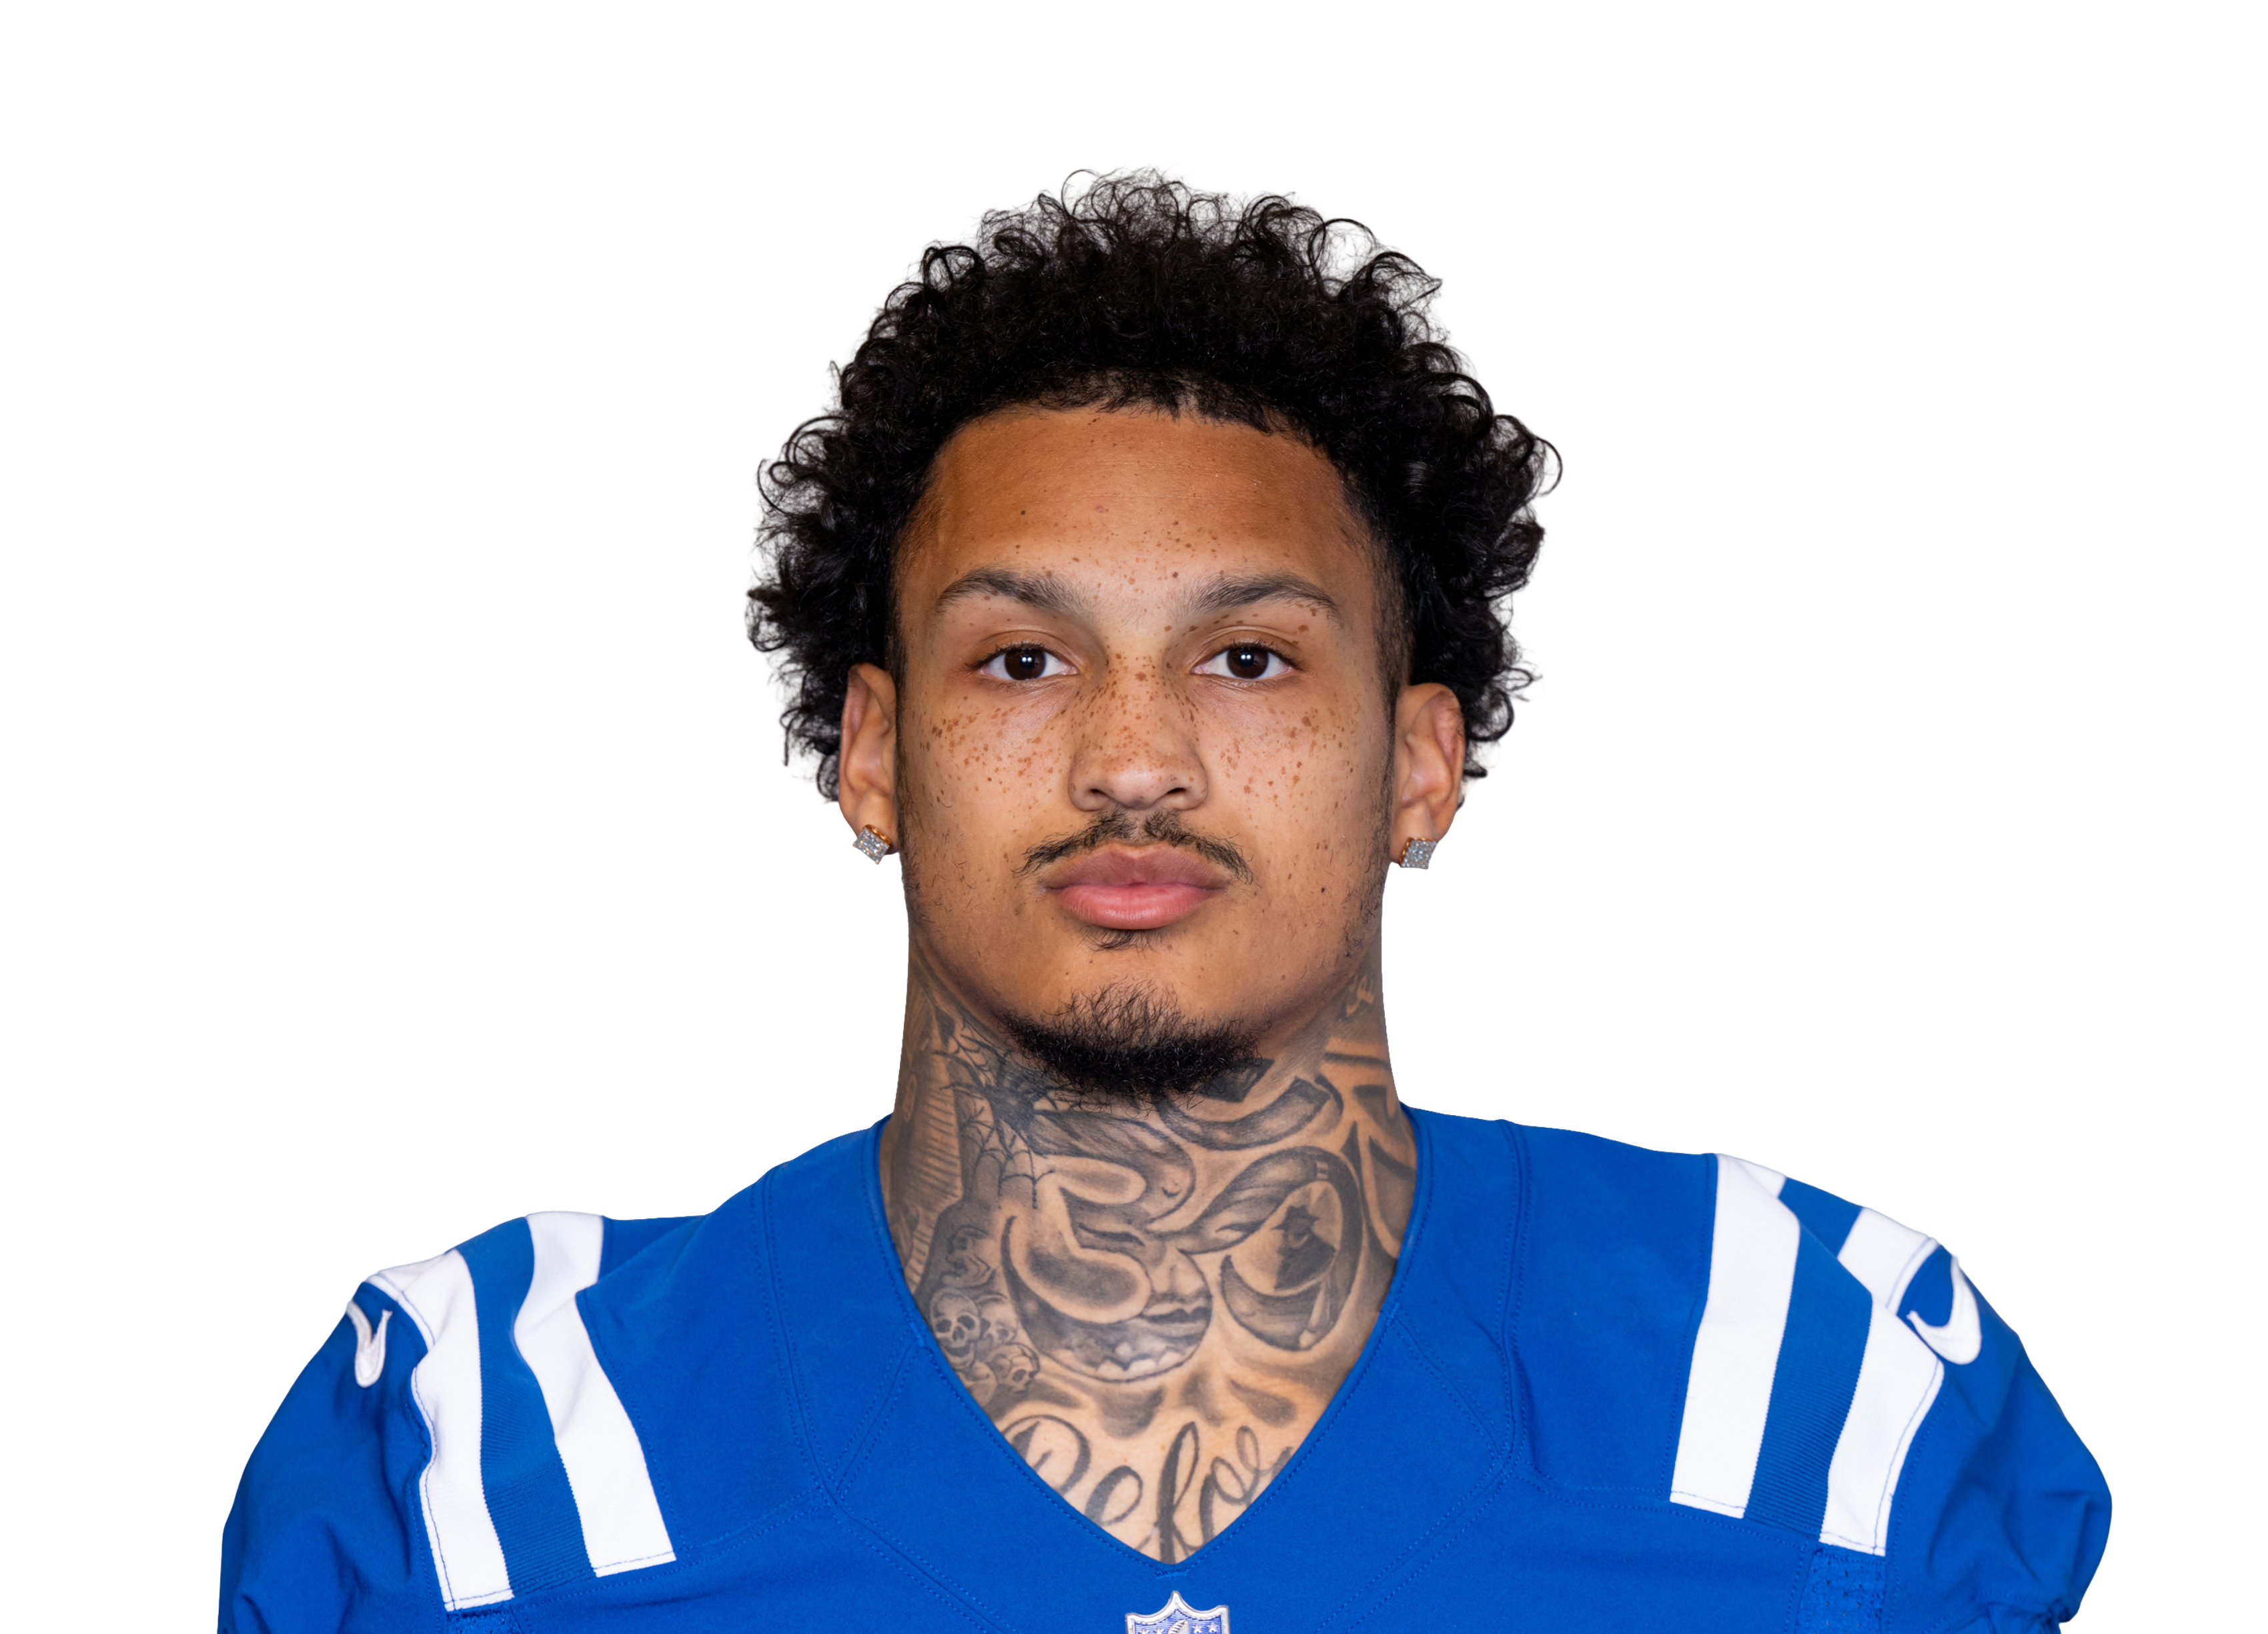 Seth McGowan@ IND • Wk 9 | 11.2 | 6 | 45 | 1 | 1 | -3 |
 Jonathan Taylor@ IND • Wk 9 | 9.4 | 13 | 46 | 0 | 5 | 18 |
 Woody Marks@ HOU • Wk 4 | 8.2 | 6 | 22 | 1 | 0 | 0 |
 Elijah Mitchell@ PHI • Wk 7 | 6.4 | 3 | 11 | 0 | 3 | 23 |
 Jacory Croskey-Merrittvs WAS • Wk 2 | 5.8 | 12 | 43 | 0 | 1 | 5 |
 Kenny Gainwellvs TB • Wk 5 | 5.8 | 4 | 18 | 0 | 3 | 10 |
 David Montgomery@ HOU • Wk 4 | 4.3 | 10 | 24 | 0 | 0 | 19 |
 Justice Hillvs BAL • Wk 3 | 3.3 | 5 | 33 | 0 | 0 | 0 |
 Kaytron Allenvs WAS • Wk 2 | 2.4 | 5 | 24 | 0 | 0 | 0 |
 Jeremiyah Lovevs ARI • Wk 8 | 2.3 | 9 | 23 | 0 | 0 | 0 |
 Sean Tuckervs TB • Wk 5 | 1.8 | 5 | 18 | 0 | 0 | 0 |
 MarShawn Lloyd@ GB • Wk 6 | 1.0 | 8 | 10 | 0 | 0 | 0 |
 Bam Knightvs ARI • Wk 8 | 0.8 | 3 | 8 | 0 | 1 | 10 |
 Patrick Ricard@ NYG • Wk 1 | 0.0 | 0 | 0 | 0 | 0 | 0 |
 Kaleb Johnson@ GB • Wk 6 | -0.2 | 1 | -2 | 0 | 0 | 0 |
 Tyrone Tracy Jr.@ NYG • Wk 1 | -0.6 | 2 | 14 | 0 | 0 | 0 |
Fantasy points first, then the stats that matter for his position. Ring around each photo is that player's Mania Rating. Tap a name to open his profile.
| Player | W1 | W2 | W3 | W4 | W5 | W6 | W7 | W8 | W10 | Per game |
|---|---|---|---|---|---|---|---|---|---|---|
| Tony Pollard | 934 yds21% touches52% snaps | 1565 yds33% touches55% snaps | 2196 yds38% touches53% snaps | 2050 yds37% touches53% snaps | 1552 yds28% touches48% snaps | 2076 yds44% touches76% snaps | 28155 yds47% touches75% snaps | 26137 yds39% touches82% snaps | 1899 yds33% touches72% snaps | 19.185 yds a game • 4.4 per touch36% touches63% snaps |
| Tyjae Spears | 724 yds17% touches50% snaps | 970 yds20% touches36% snaps | 35 yds5% touches47% snaps | 36 yds6% touches36% snaps | 1128 yds21% touches54% snaps | 28 yds4% touches24% snaps | — | — | 528 yds9% touches28% snaps | 5.724 yds a game • 4.2 per touch12% touches39% snaps |
| Michael Carter | — | — | — | — | — | — | 414 yds7% touches25% snaps | — | — | 4.014 yds a game • 3.5 per touch7% touches25% snaps |
| Nicholas Singleton | — | 410 yds9% touches11% snaps | — | 32 yds6% touches12% snaps | — | — | — | — | — | 3.56 yds a game • 1.7 per touch7% touches12% snaps |
| Kalel Mullings | — | — | — | — | 13 yds2% touches2% snaps | — | — | — | — | 1.03 yds a game • 3.0 per touch2% touches2% snaps |
| Julius Chestnut | — | 00 yds0% touches0% snaps | 00 yds0% touches0% snaps | 00 yds0% touches0% snaps | — | 00 yds0% touches0% snaps | 00 yds0% touches0% snaps | 00 yds0% touches3% snaps | — | 0.00 yds a game0% touches1% snaps |
| Use | Game | Proj | PPR | Tgt | Rec | Rec Yd | Car | Rush Yd | TD | Snap |
|---|---|---|---|---|---|---|---|---|---|---|
W1 vs NYJ | 11.1 | 4.4 | 2 | 1 | -1 | 7 | 35 | 0 | 52% | |
W2 vs PHI | 8.5 | 7.5 | 1 | 1 | 1 | 14 | 64 | 0 | 55% | |
W3 vs NYG | 9.0 | 13.6 | 4 | 4 | 22 | 17 | 74 | 0 | 53% | |
W4 vs BAL | 9.7 | 13 | 4 | 2 | 2 | 16 | 48 | 1 | 53% | |
W5 vs HOU | 9.8 | 5.2 | 1 | 0 | 0 | 14 | 52 | 0 | 48% | |
W6 vs IND | 10.3 | 7.6 | 1 | 0 | 0 | 19 | 76 | 0 | 76% | |
W7 vs CLE | 10.2 | 36.5 | 3 | 3 | 26 | 25 | 129 | 3 | 75% | |
W8 vs CIN | 13.7 | 28.7 | 5 | 3 | 20 | 21 | 117 | 2 | 82% | |
W10 vs JAX | 14.6 | 23.9 | 9 | 8 | 66 | 9 | 33 | 1 | 72% |
Ranked against 41 backs with at least 60 carries. Ranks account for how much work each number is based on, so a perfect record on a few plays does not beat one over a full workload. Tap a stat to see the full ranking.
Tony Pollard
TEN • RB • 9 gamesPick a teammate with or without. Pick more than one to combine them, like a game without the QB and without the other back.
Teammate injuries shift his Week 11 Rating3 teammate notes ▾
TENDALHow this is built
| Player | W1 | W2 | W3 | W4 | W5 | W6 | W7 | W8 | W10 | Per game |
|---|---|---|---|---|---|---|---|---|---|---|
| Tony Pollard | 934 yds21% touches52% snaps | 1565 yds33% touches55% snaps | 2196 yds38% touches53% snaps | 2050 yds37% touches53% snaps | 1552 yds28% touches48% snaps | 2076 yds44% touches76% snaps | 28155 yds47% touches75% snaps | 26137 yds39% touches82% snaps | 1899 yds33% touches72% snaps | 19.185 yds a game • 4.4 per touch36% touches63% snaps |
| Tyjae Spears | 724 yds17% touches50% snaps | 970 yds20% touches36% snaps | 35 yds5% touches47% snaps | 36 yds6% touches36% snaps | 1128 yds21% touches54% snaps | 28 yds4% touches24% snaps | — | — | 528 yds9% touches28% snaps | 5.724 yds a game • 4.2 per touch12% touches39% snaps |
| Michael Carter | — | — | — | — | — | — | 414 yds7% touches25% snaps | — | — | 4.014 yds a game • 3.5 per touch7% touches25% snaps |
| Nicholas Singleton | — | 410 yds9% touches11% snaps | — | 32 yds6% touches12% snaps | — | — | — | — | — | 3.56 yds a game • 1.7 per touch7% touches12% snaps |
| Kalel Mullings | — | — | — | — | 13 yds2% touches2% snaps | — | — | — | — | 1.03 yds a game • 3.0 per touch2% touches2% snaps |
| Julius Chestnut | — | 00 yds0% touches0% snaps | 00 yds0% touches0% snaps | 00 yds0% touches0% snaps | — | 00 yds0% touches0% snaps | 00 yds0% touches0% snaps | 00 yds0% touches3% snaps | — | 0.00 yds a game0% touches1% snaps |
| Use | Game | Proj | PPR | Tgt | Rec | Rec Yd | Car | Rush Yd | TD | Snap |
|---|---|---|---|---|---|---|---|---|---|---|
| W1vs NYJ | 11.1 | 4.4 | 2 | 1 | -1 | 7 | 35 | 0 | 52% | |
| W2vs PHI | 8.5 | 7.5 | 1 | 1 | 1 | 14 | 64 | 0 | 55% | |
| W3vs NYG | 9.0 | 13.6 | 4 | 4 | 22 | 17 | 74 | 0 | 53% | |
| W4vs BAL | 9.7 | 13 | 4 | 2 | 2 | 16 | 48 | 1 | 53% | |
| W5vs HOU | 9.8 | 5.2 | 1 | 0 | 0 | 14 | 52 | 0 | 48% | |
| W6vs IND | 10.3 | 7.6 | 1 | 0 | 0 | 19 | 76 | 0 | 76% | |
| W7vs CLE | 10.2 | 36.5 | 3 | 3 | 26 | 25 | 129 | 3 | 75% | |
| W8vs CIN | 13.7 | 28.7 | 5 | 3 | 20 | 21 | 117 | 2 | 82% | |
| W10vs JAX | 14.6 | 23.9 | 9 | 8 | 66 | 9 | 33 | 1 | 72% |
Ranked against 41 backs with at least 60 carries. Ranks account for how much work each number is based on, so a perfect record on a few plays does not beat one over a full workload. Tap a stat to see the full ranking.
29.3 PPR points a game allowed to running backs, 1st most of 32 defenses.
| Player | PPR | Rush | Rush Yd | Rush TD | Rec | Rec Yd |
|---|---|---|---|---|---|---|
| Christian McCaffreyvs SF • Wk 10 | 46.3 | 13 | 62 | 1 | 4 | 161 |
| Tyler Allgeiervs ARI • Wk 8 | 36.1 | 11 | 147 | 1 | 5 | 44 |
| Bucky Irvingvs TB • Wk 5 | 31.5 | 21 | 165 | 1 | 2 | 10 |
| Derrick Henryvs BAL • Wk 3 | 21.9 | 26 | 89 | 2 | 1 | 0 |
| Saquon Barkley@ PHI • Wk 7 | 15.1 | 7 | 62 | 1 | 2 | 9 |
| Kaelon Blackvs SF • Wk 10 | 14.6 | 11 | 53 | 1 | 2 | 13 |
| Rachaad Whitevs WAS • Wk 2 | 14.3 | 7 | 43 | 0 | 6 | 40 |
| Cam Skattebo@ NYG • Wk 1 | 14.1 | 18 | 81 | 1 | 0 | 0 |
| Devin Singletary@ NYG • Wk 1 | 13.8 | 6 | 16 | 0 | 4 | 22 |
| Dameon Pierce@ PHI • Wk 7 | 11.8 | 14 | 47 | 1 | 1 | 1 |
| Pierre Strong@ GB • Wk 6 | 11.7 | 11 | 28 | 0 | 5 | 39 |
| Seth McGowan@ IND • Wk 9 | 11.2 | 6 | 45 | 1 | 1 | -3 |
| Jonathan Taylor@ IND • Wk 9 | 9.4 | 13 | 46 | 0 | 5 | 18 |
| Woody Marks@ HOU • Wk 4 | 8.2 | 6 | 22 | 1 | 0 | 0 |
| Elijah Mitchell@ PHI • Wk 7 | 6.4 | 3 | 11 | 0 | 3 | 23 |
| Jacory Croskey-Merrittvs WAS • Wk 2 | 5.8 | 12 | 43 | 0 | 1 | 5 |
| Kenny Gainwellvs TB • Wk 5 | 5.8 | 4 | 18 | 0 | 3 | 10 |
| David Montgomery@ HOU • Wk 4 | 4.3 | 10 | 24 | 0 | 0 | 19 |
| Justice Hillvs BAL • Wk 3 | 3.3 | 5 | 33 | 0 | 0 | 0 |
| Kaytron Allenvs WAS • Wk 2 | 2.4 | 5 | 24 | 0 | 0 | 0 |
| Jeremiyah Lovevs ARI • Wk 8 | 2.3 | 9 | 23 | 0 | 0 | 0 |
| Sean Tuckervs TB • Wk 5 | 1.8 | 5 | 18 | 0 | 0 | 0 |
| MarShawn Lloyd@ GB • Wk 6 | 1.0 | 8 | 10 | 0 | 0 | 0 |
| Bam Knightvs ARI • Wk 8 | 0.8 | 3 | 8 | 0 | 1 | 10 |
| Patrick Ricard@ NYG • Wk 1 | 0.0 | 0 | 0 | 0 | 0 | 0 |
| Kaleb Johnson@ GB • Wk 6 | -0.2 | 1 | -2 | 0 | 0 | 0 |
| Tyrone Tracy Jr.@ NYG • Wk 1 | -0.6 | 2 | 14 | 0 | 0 | 0 |
Fantasy points first, then the stats that matter for his position. Ring around each photo is that player's Mania Rating. Tap a name to open his profile.