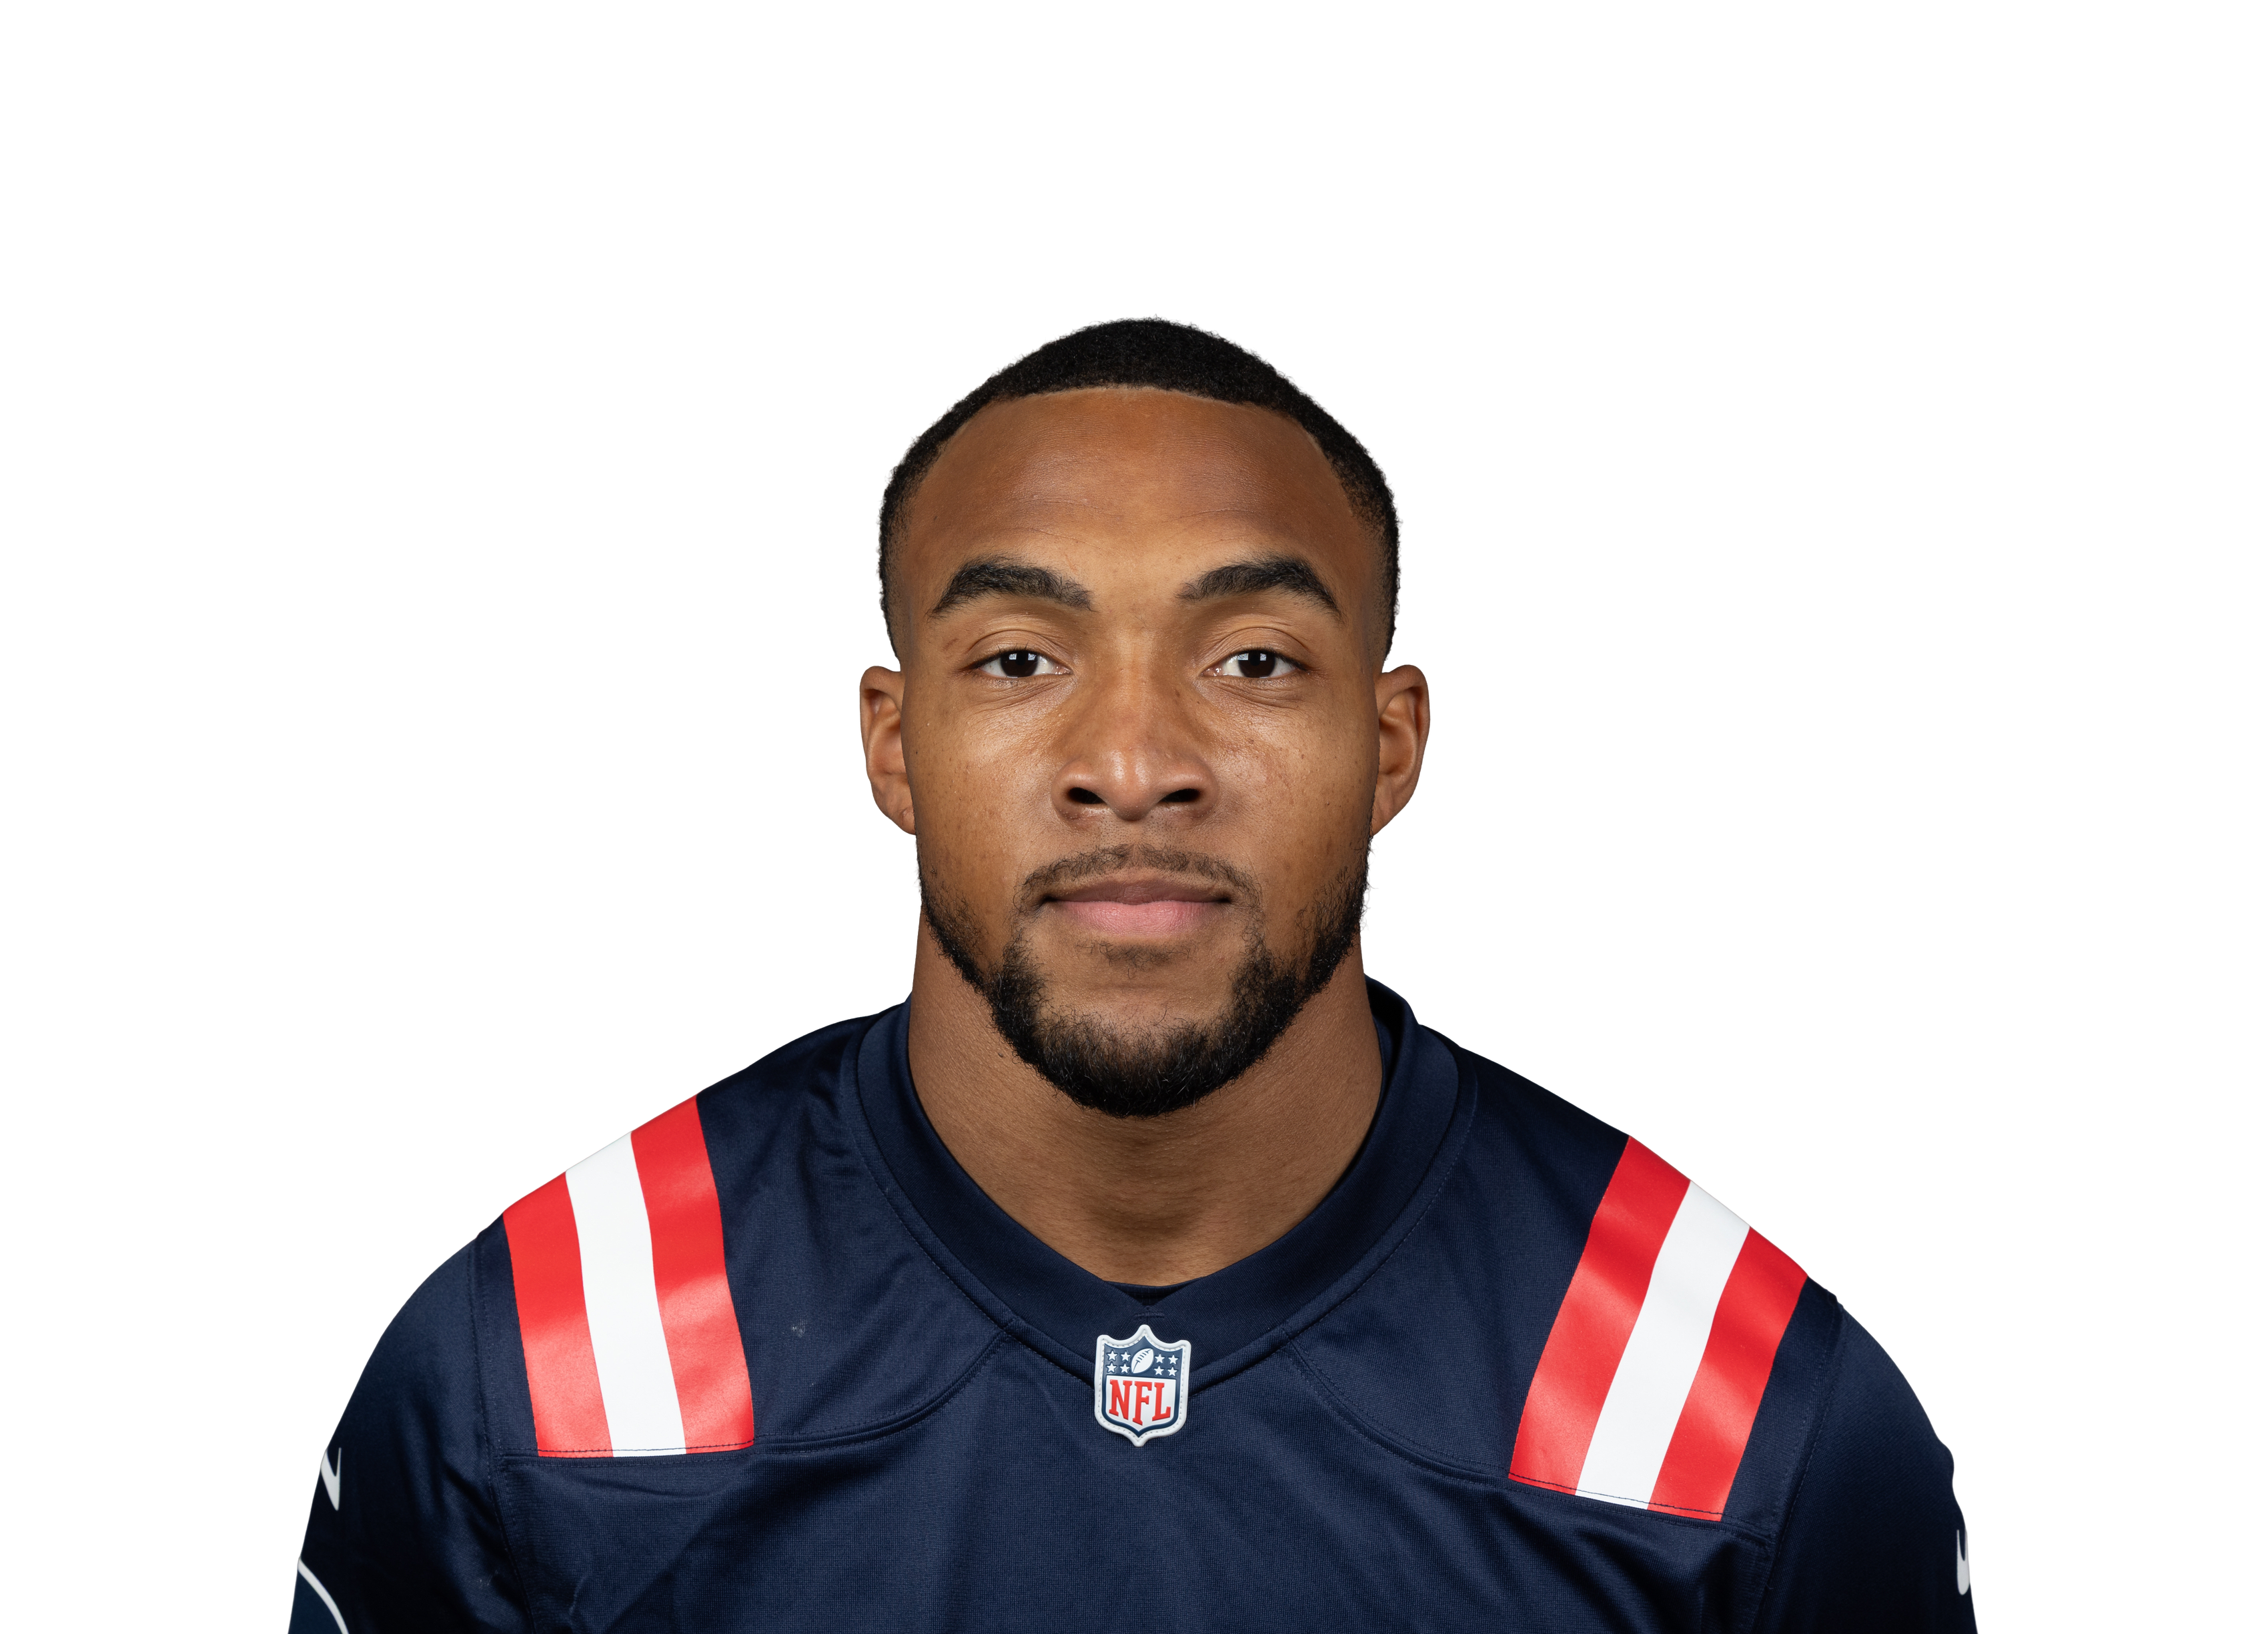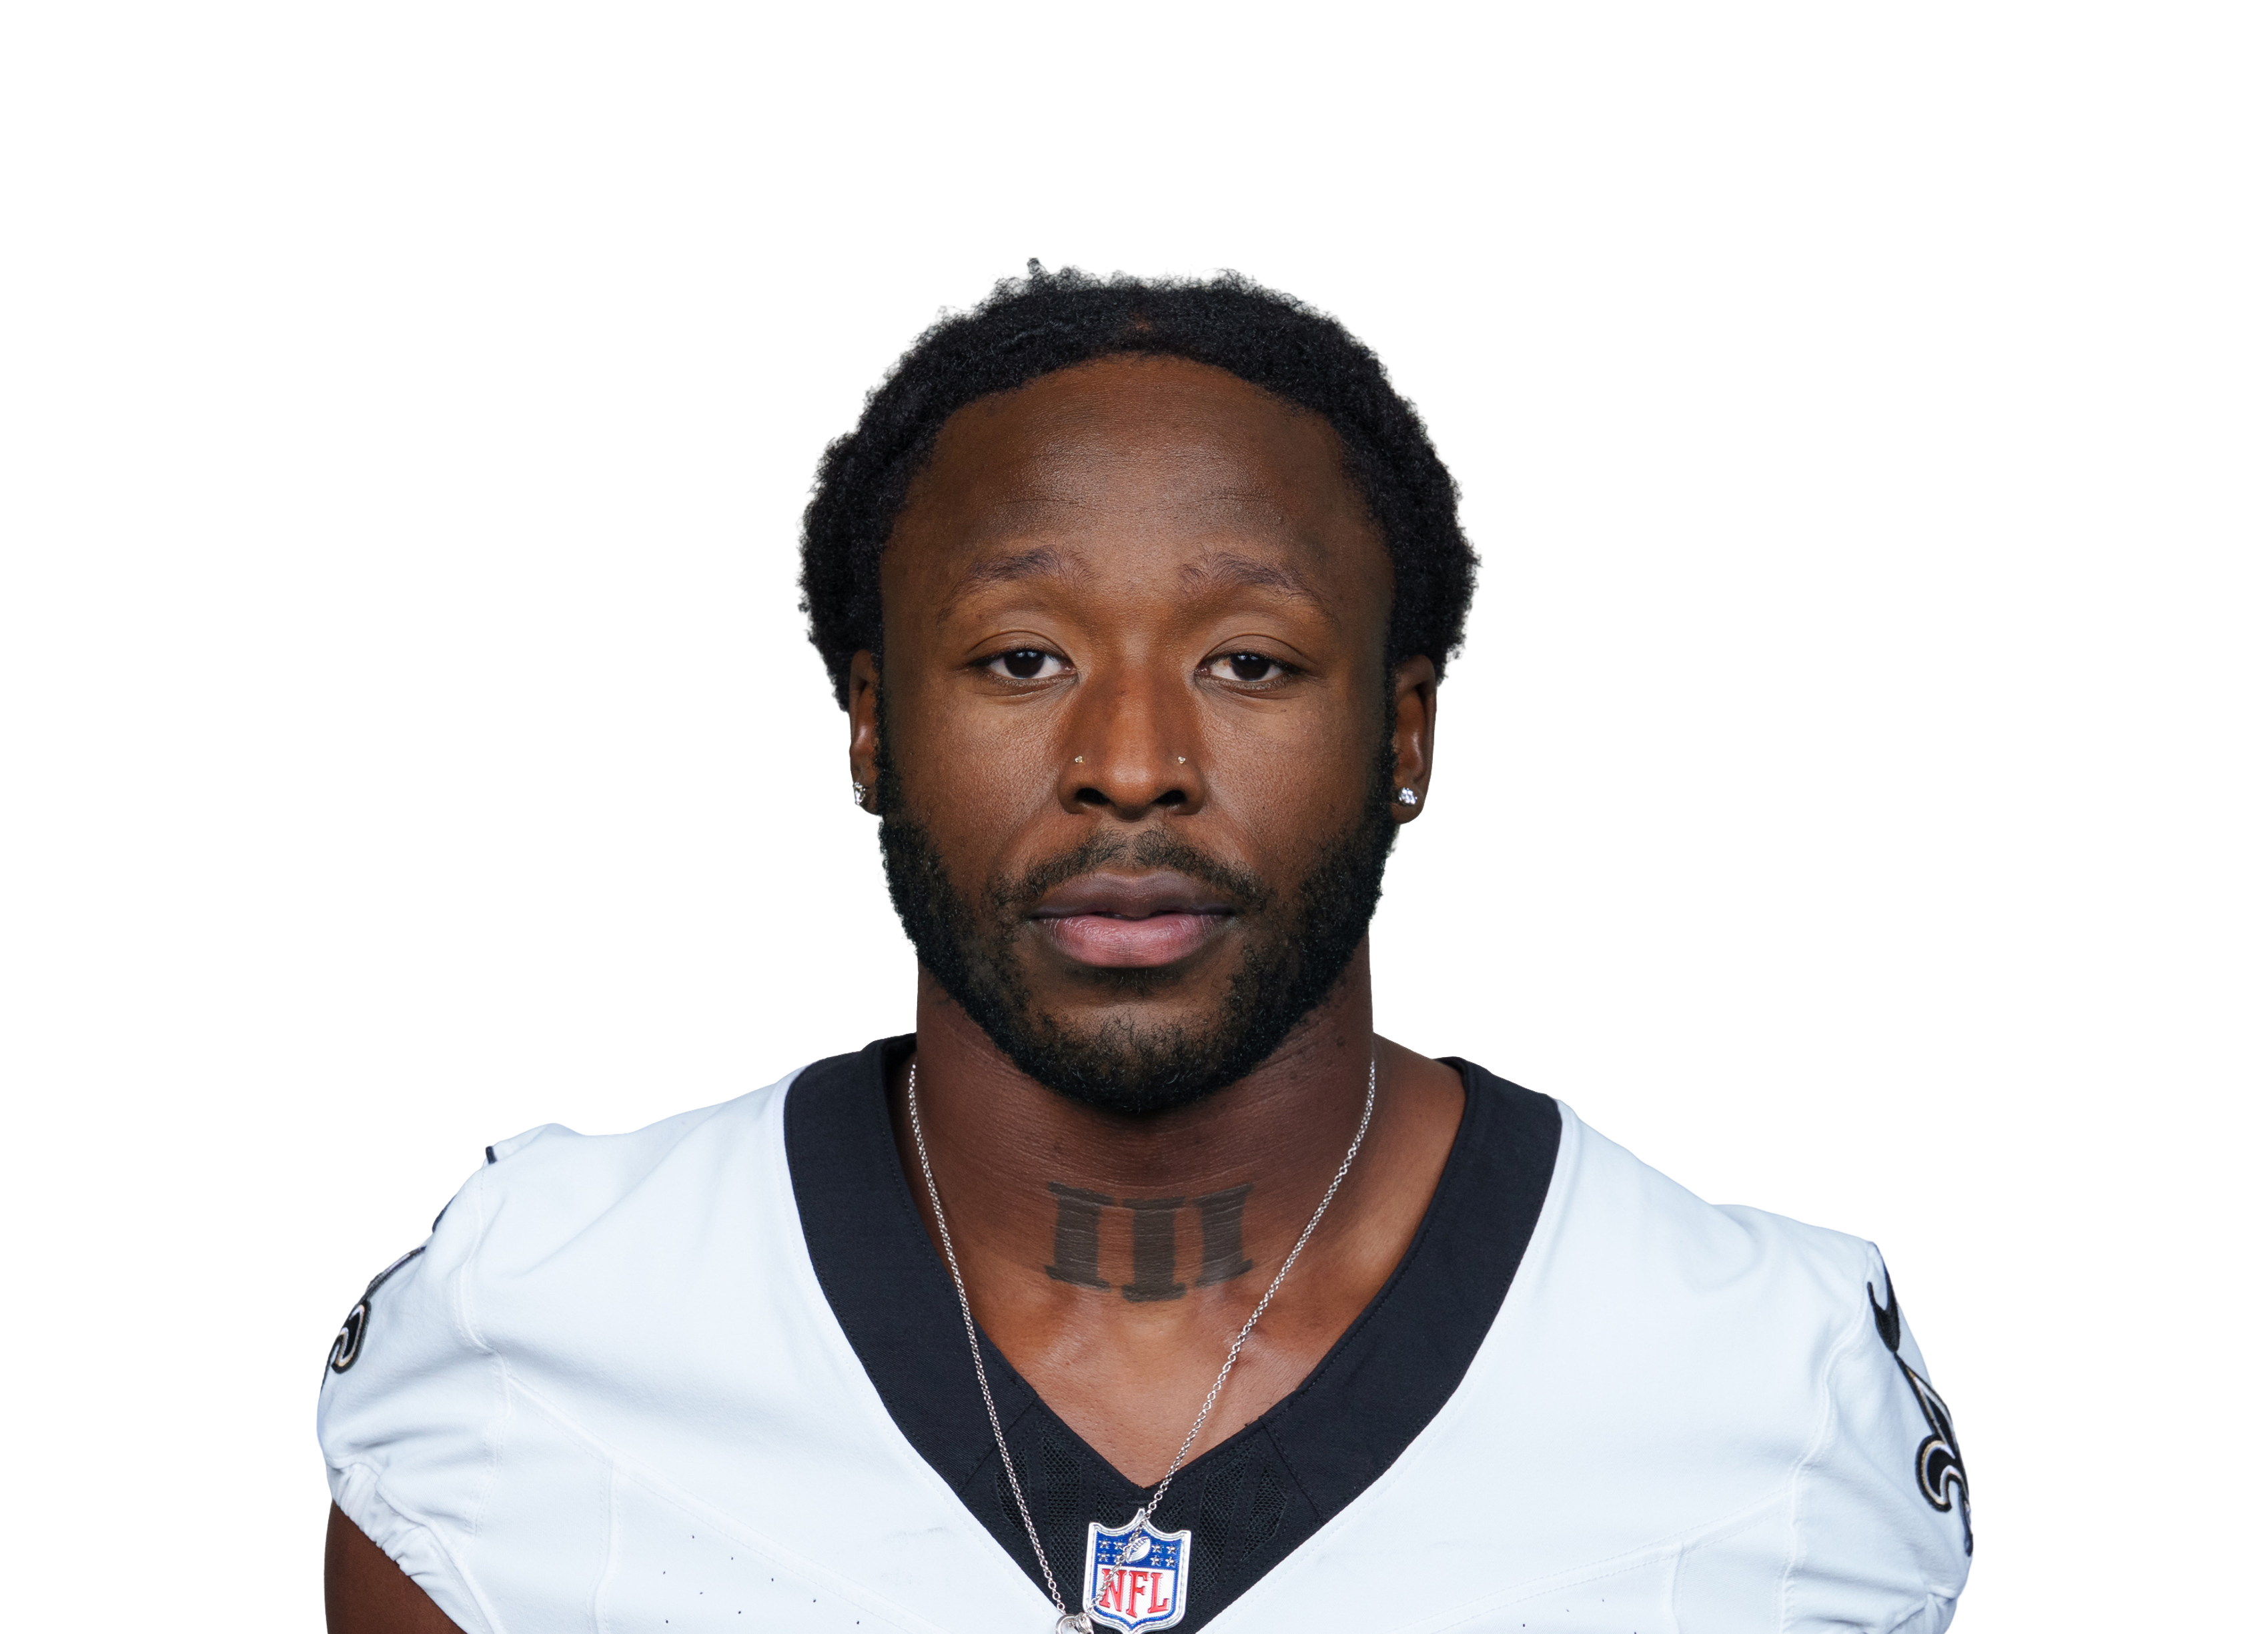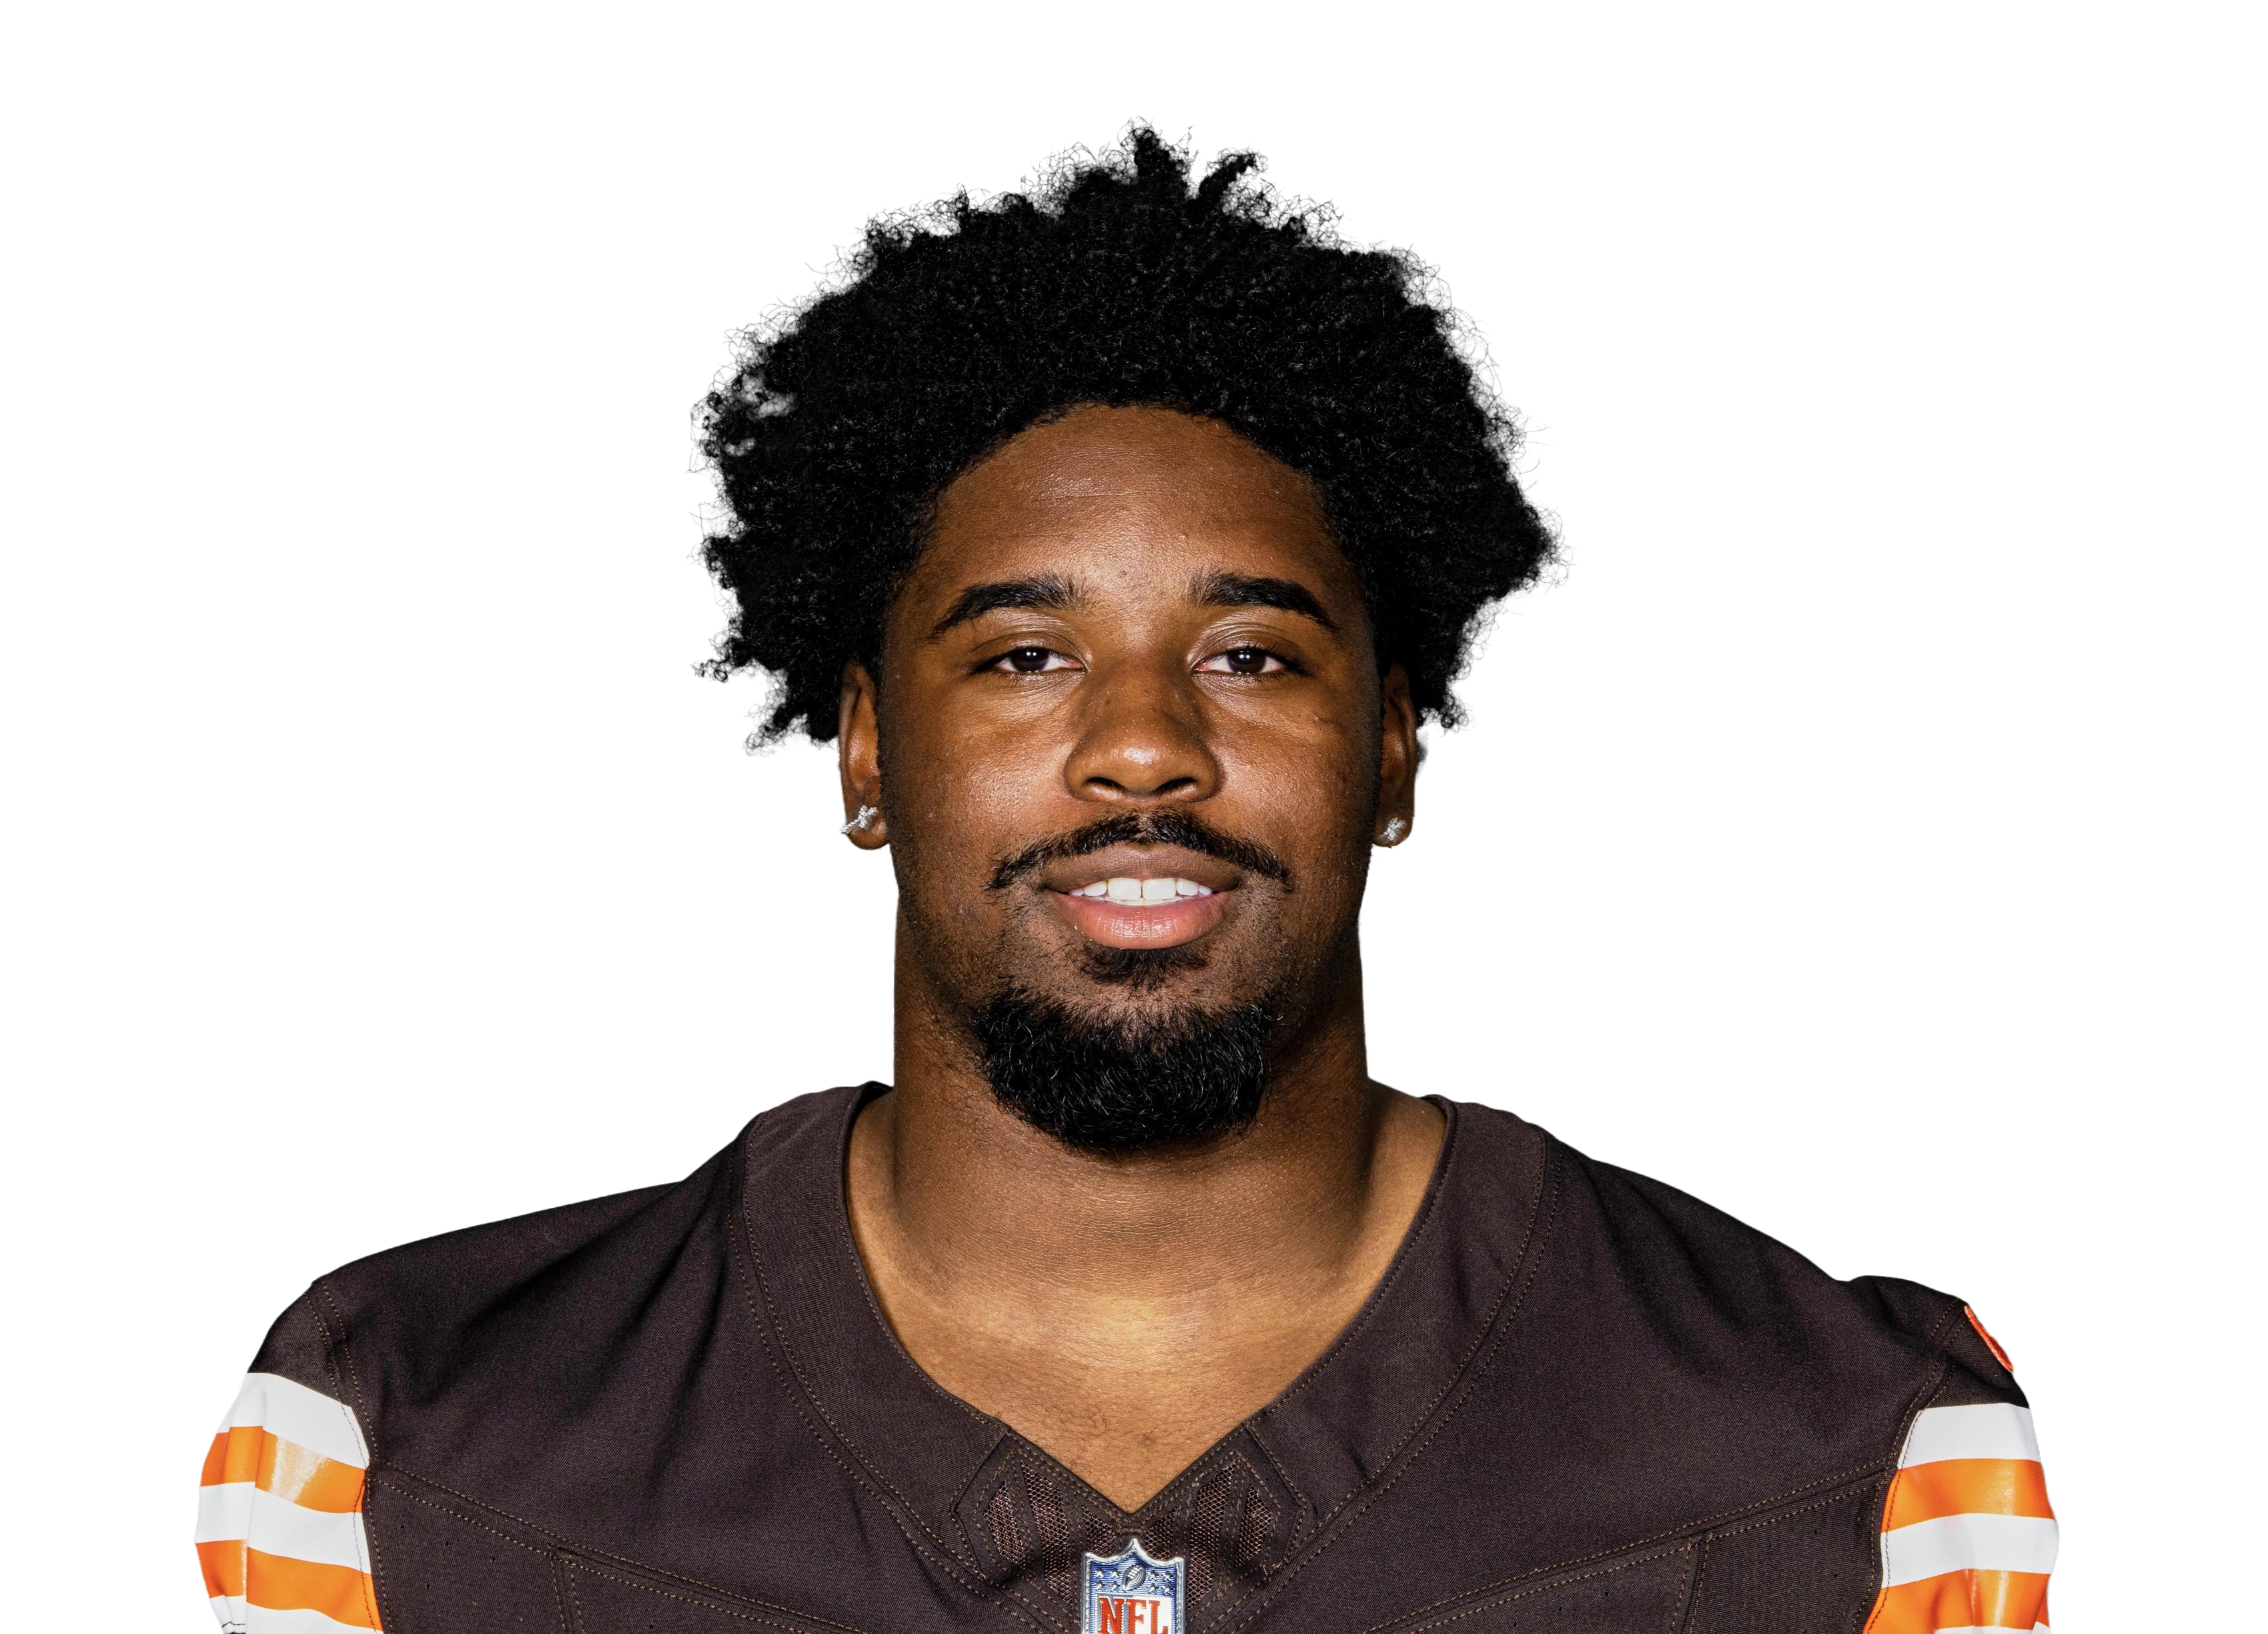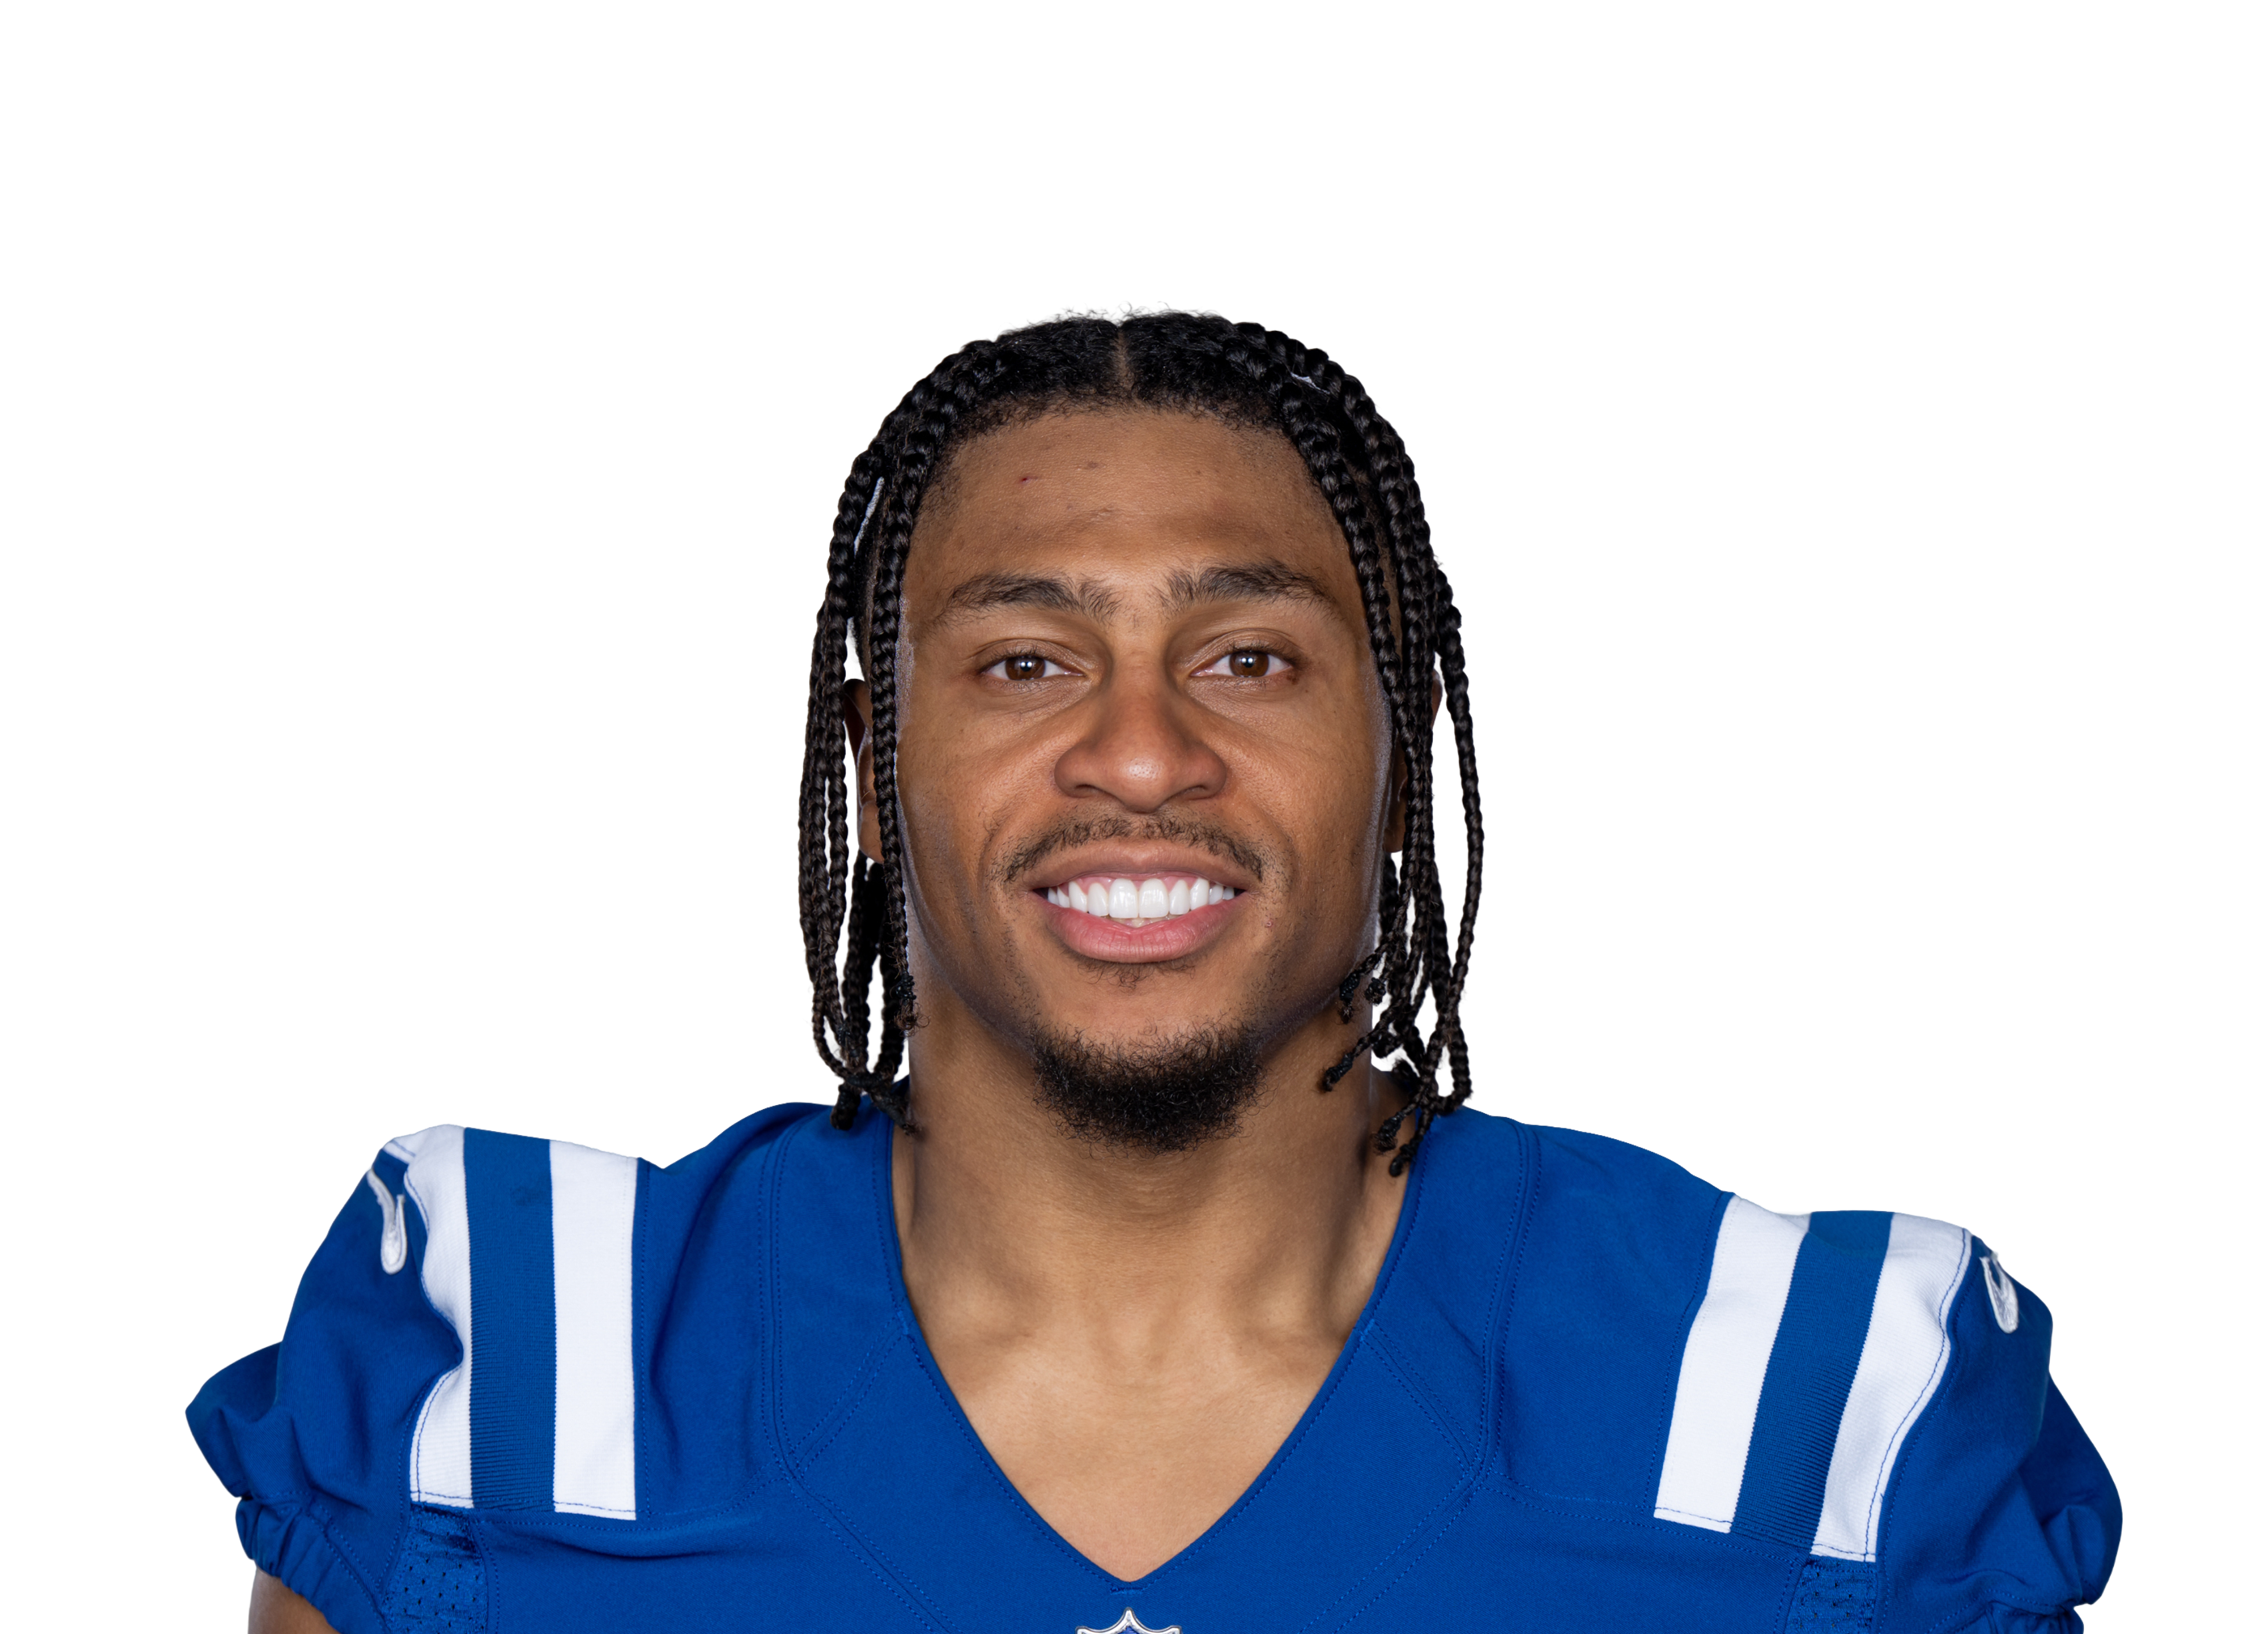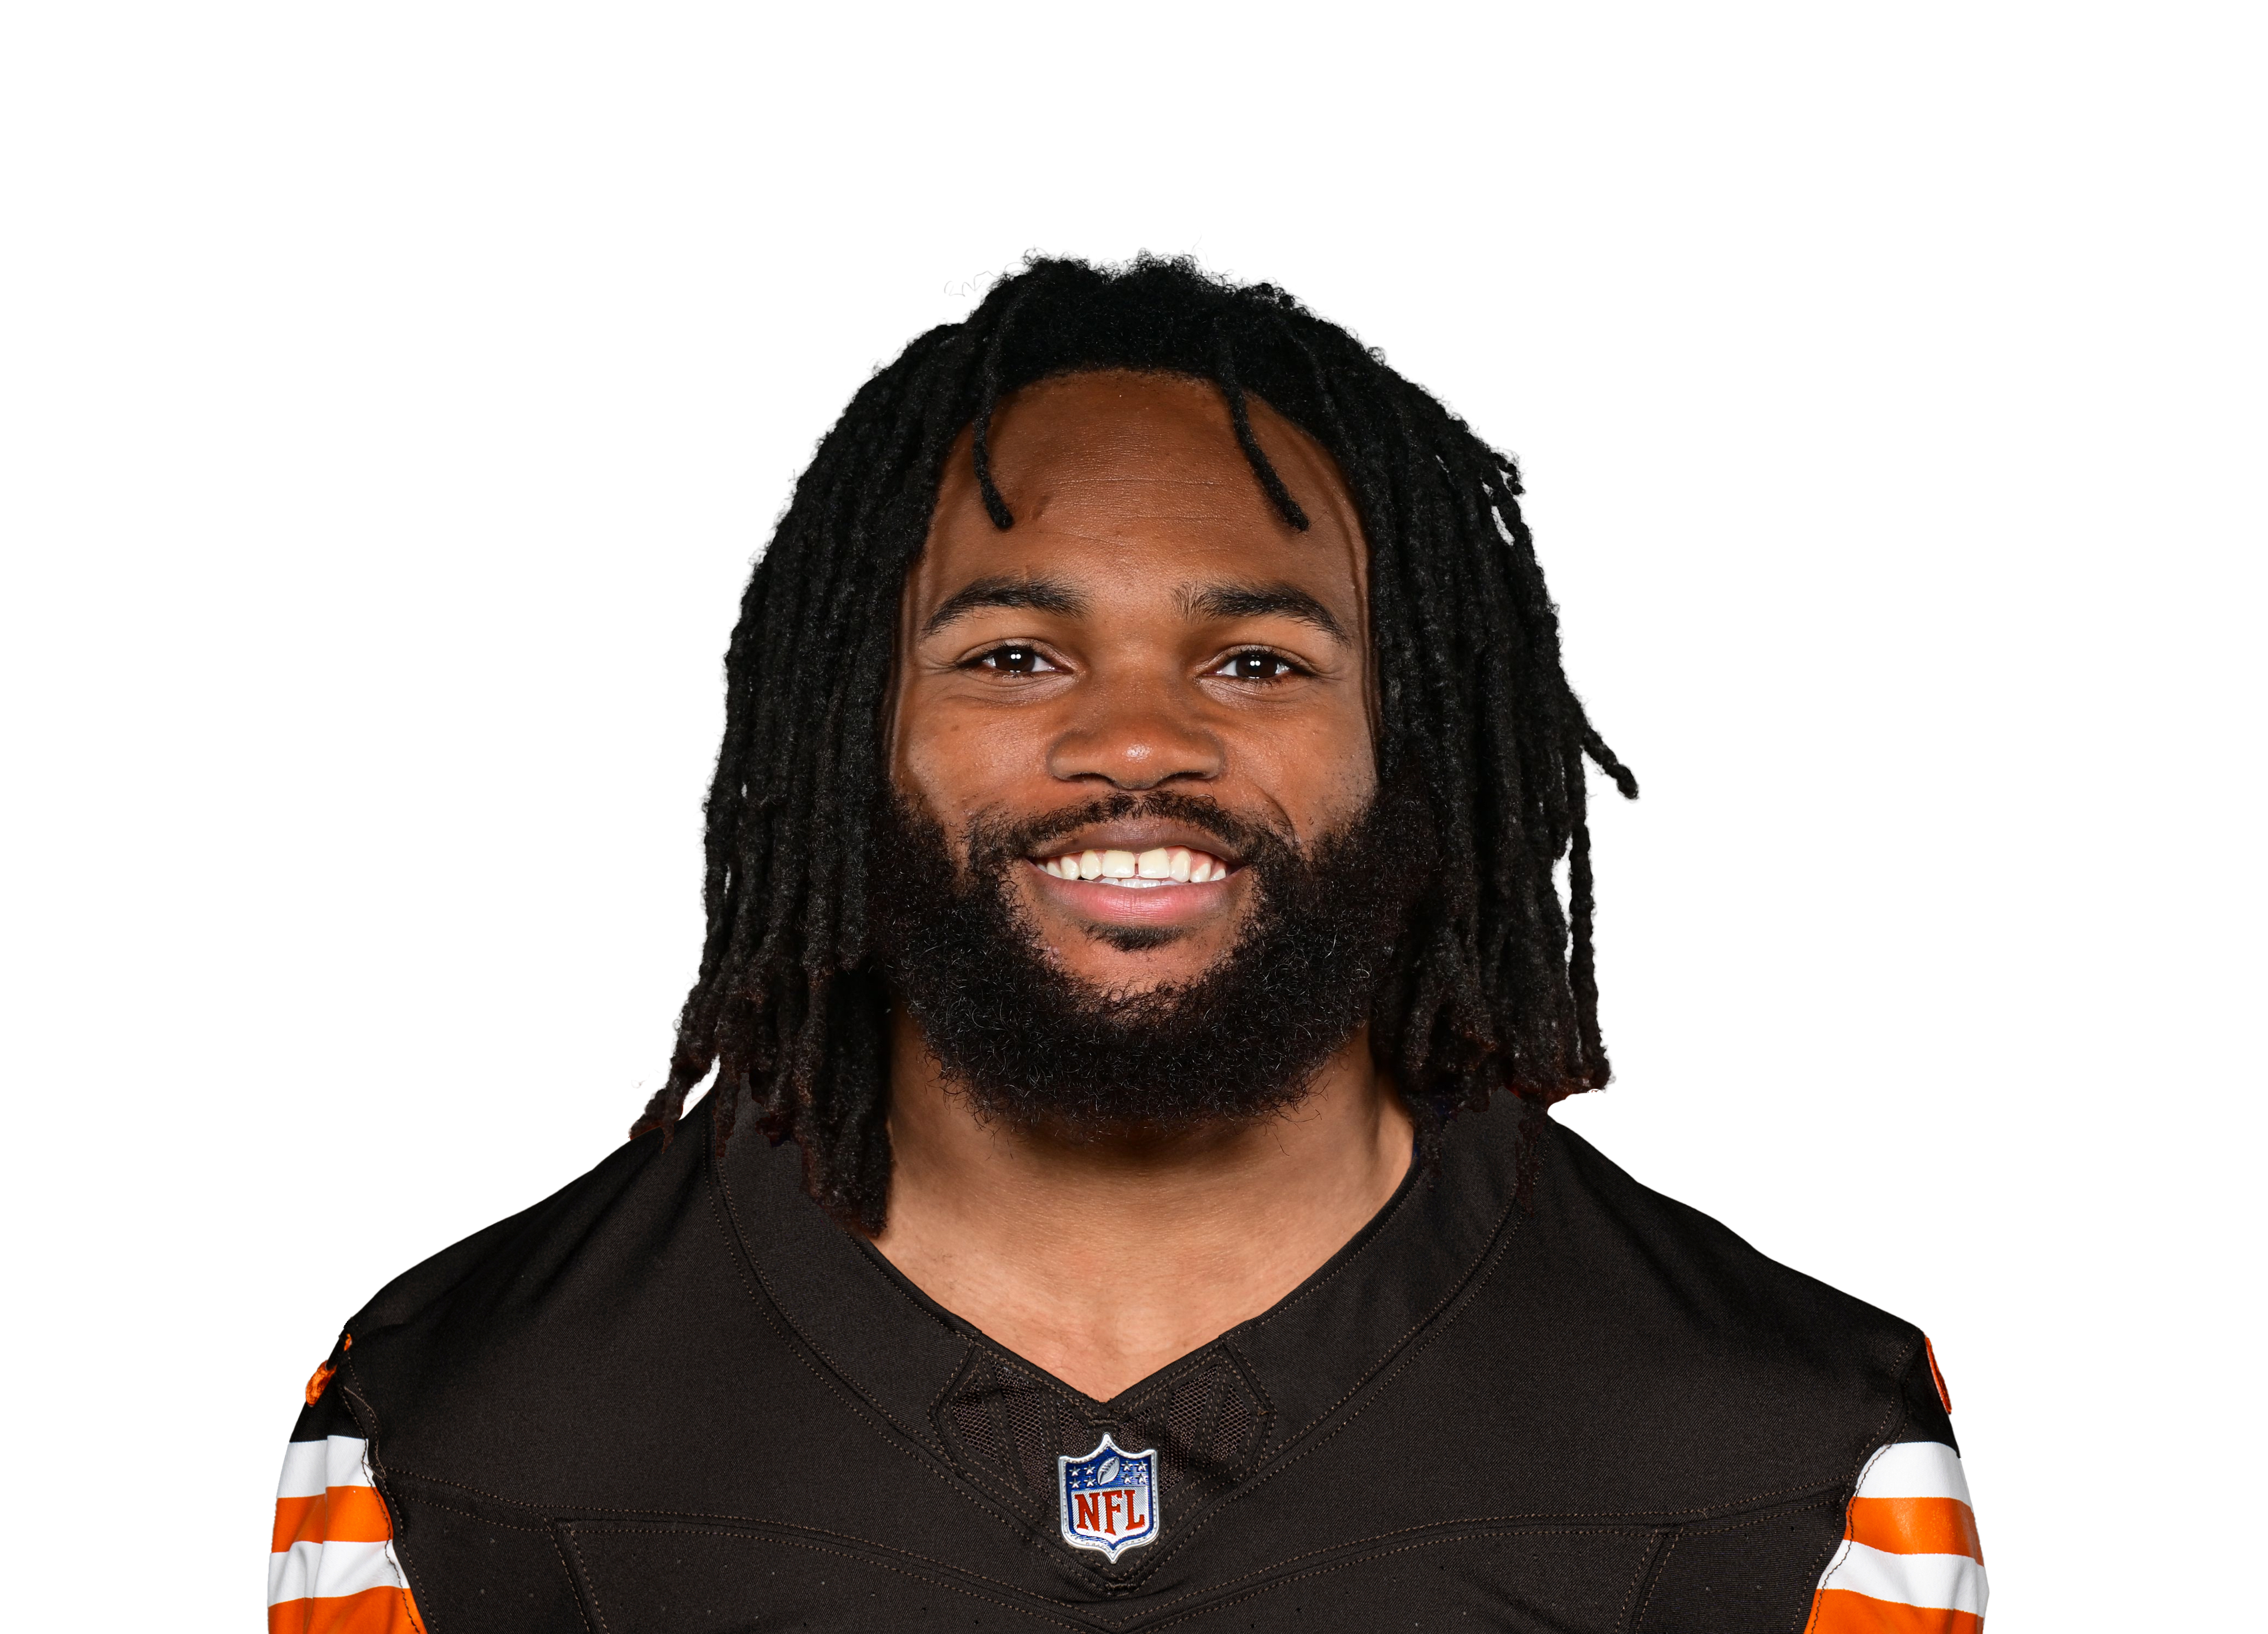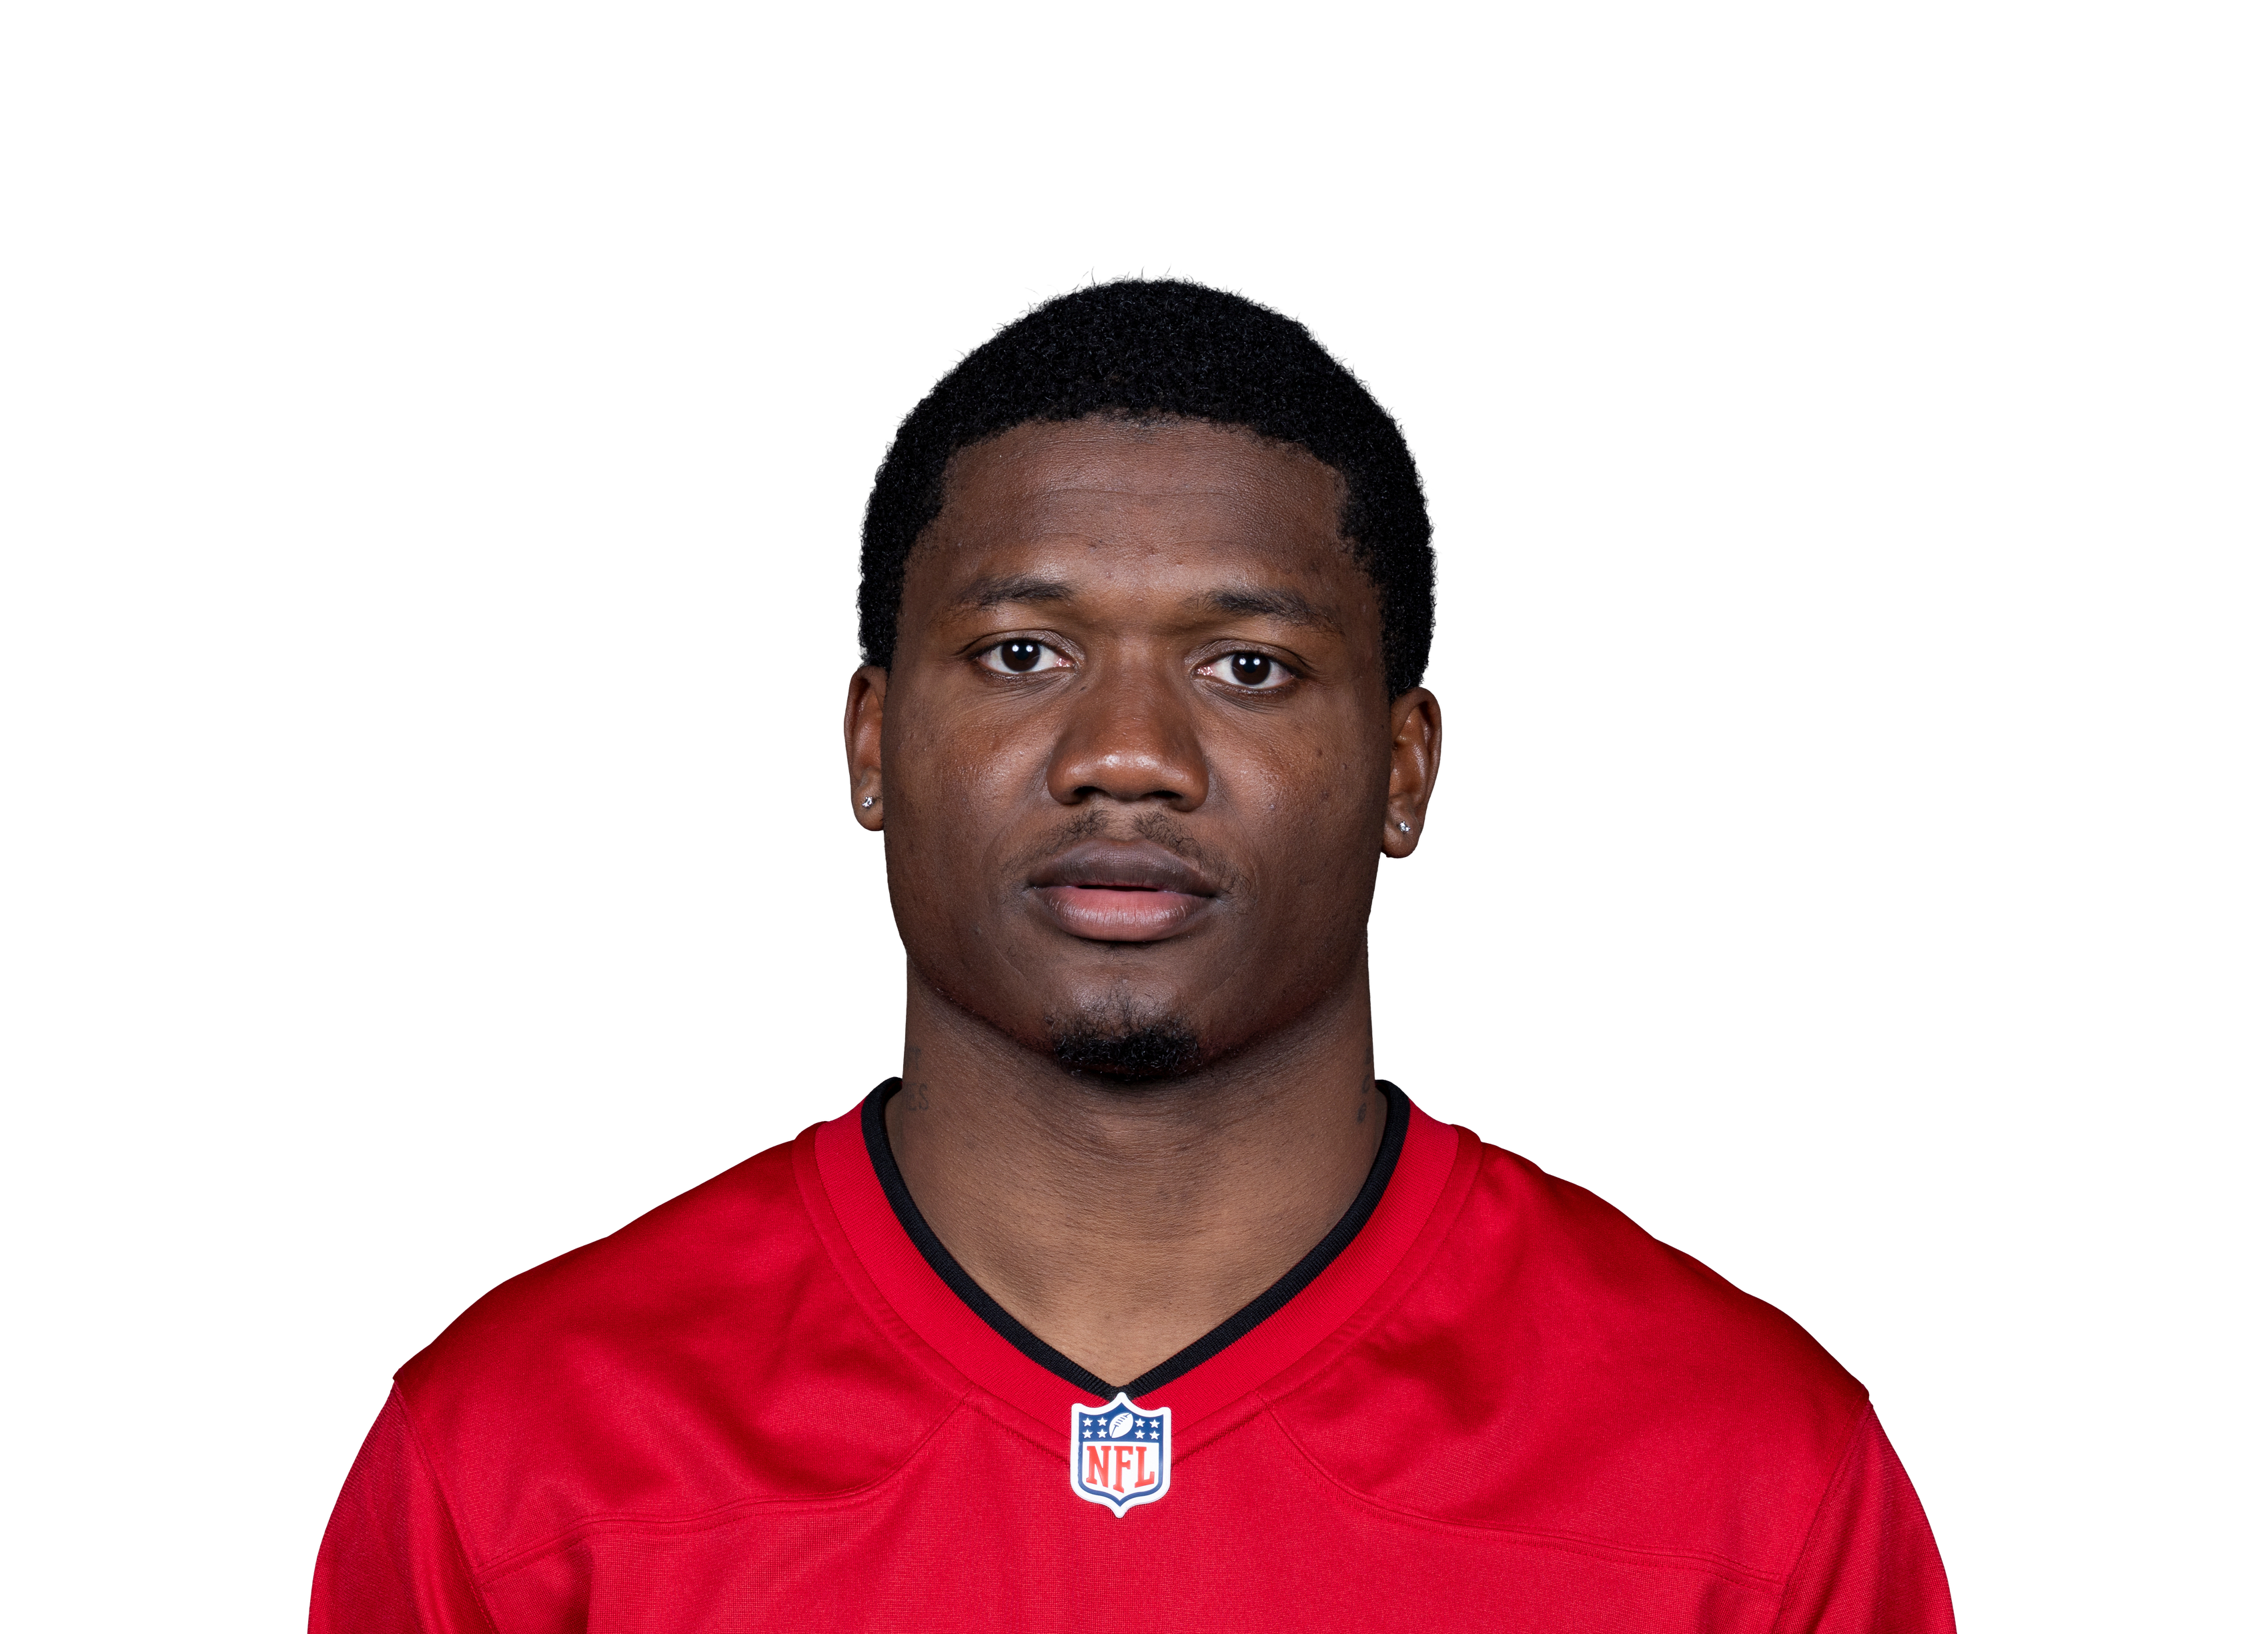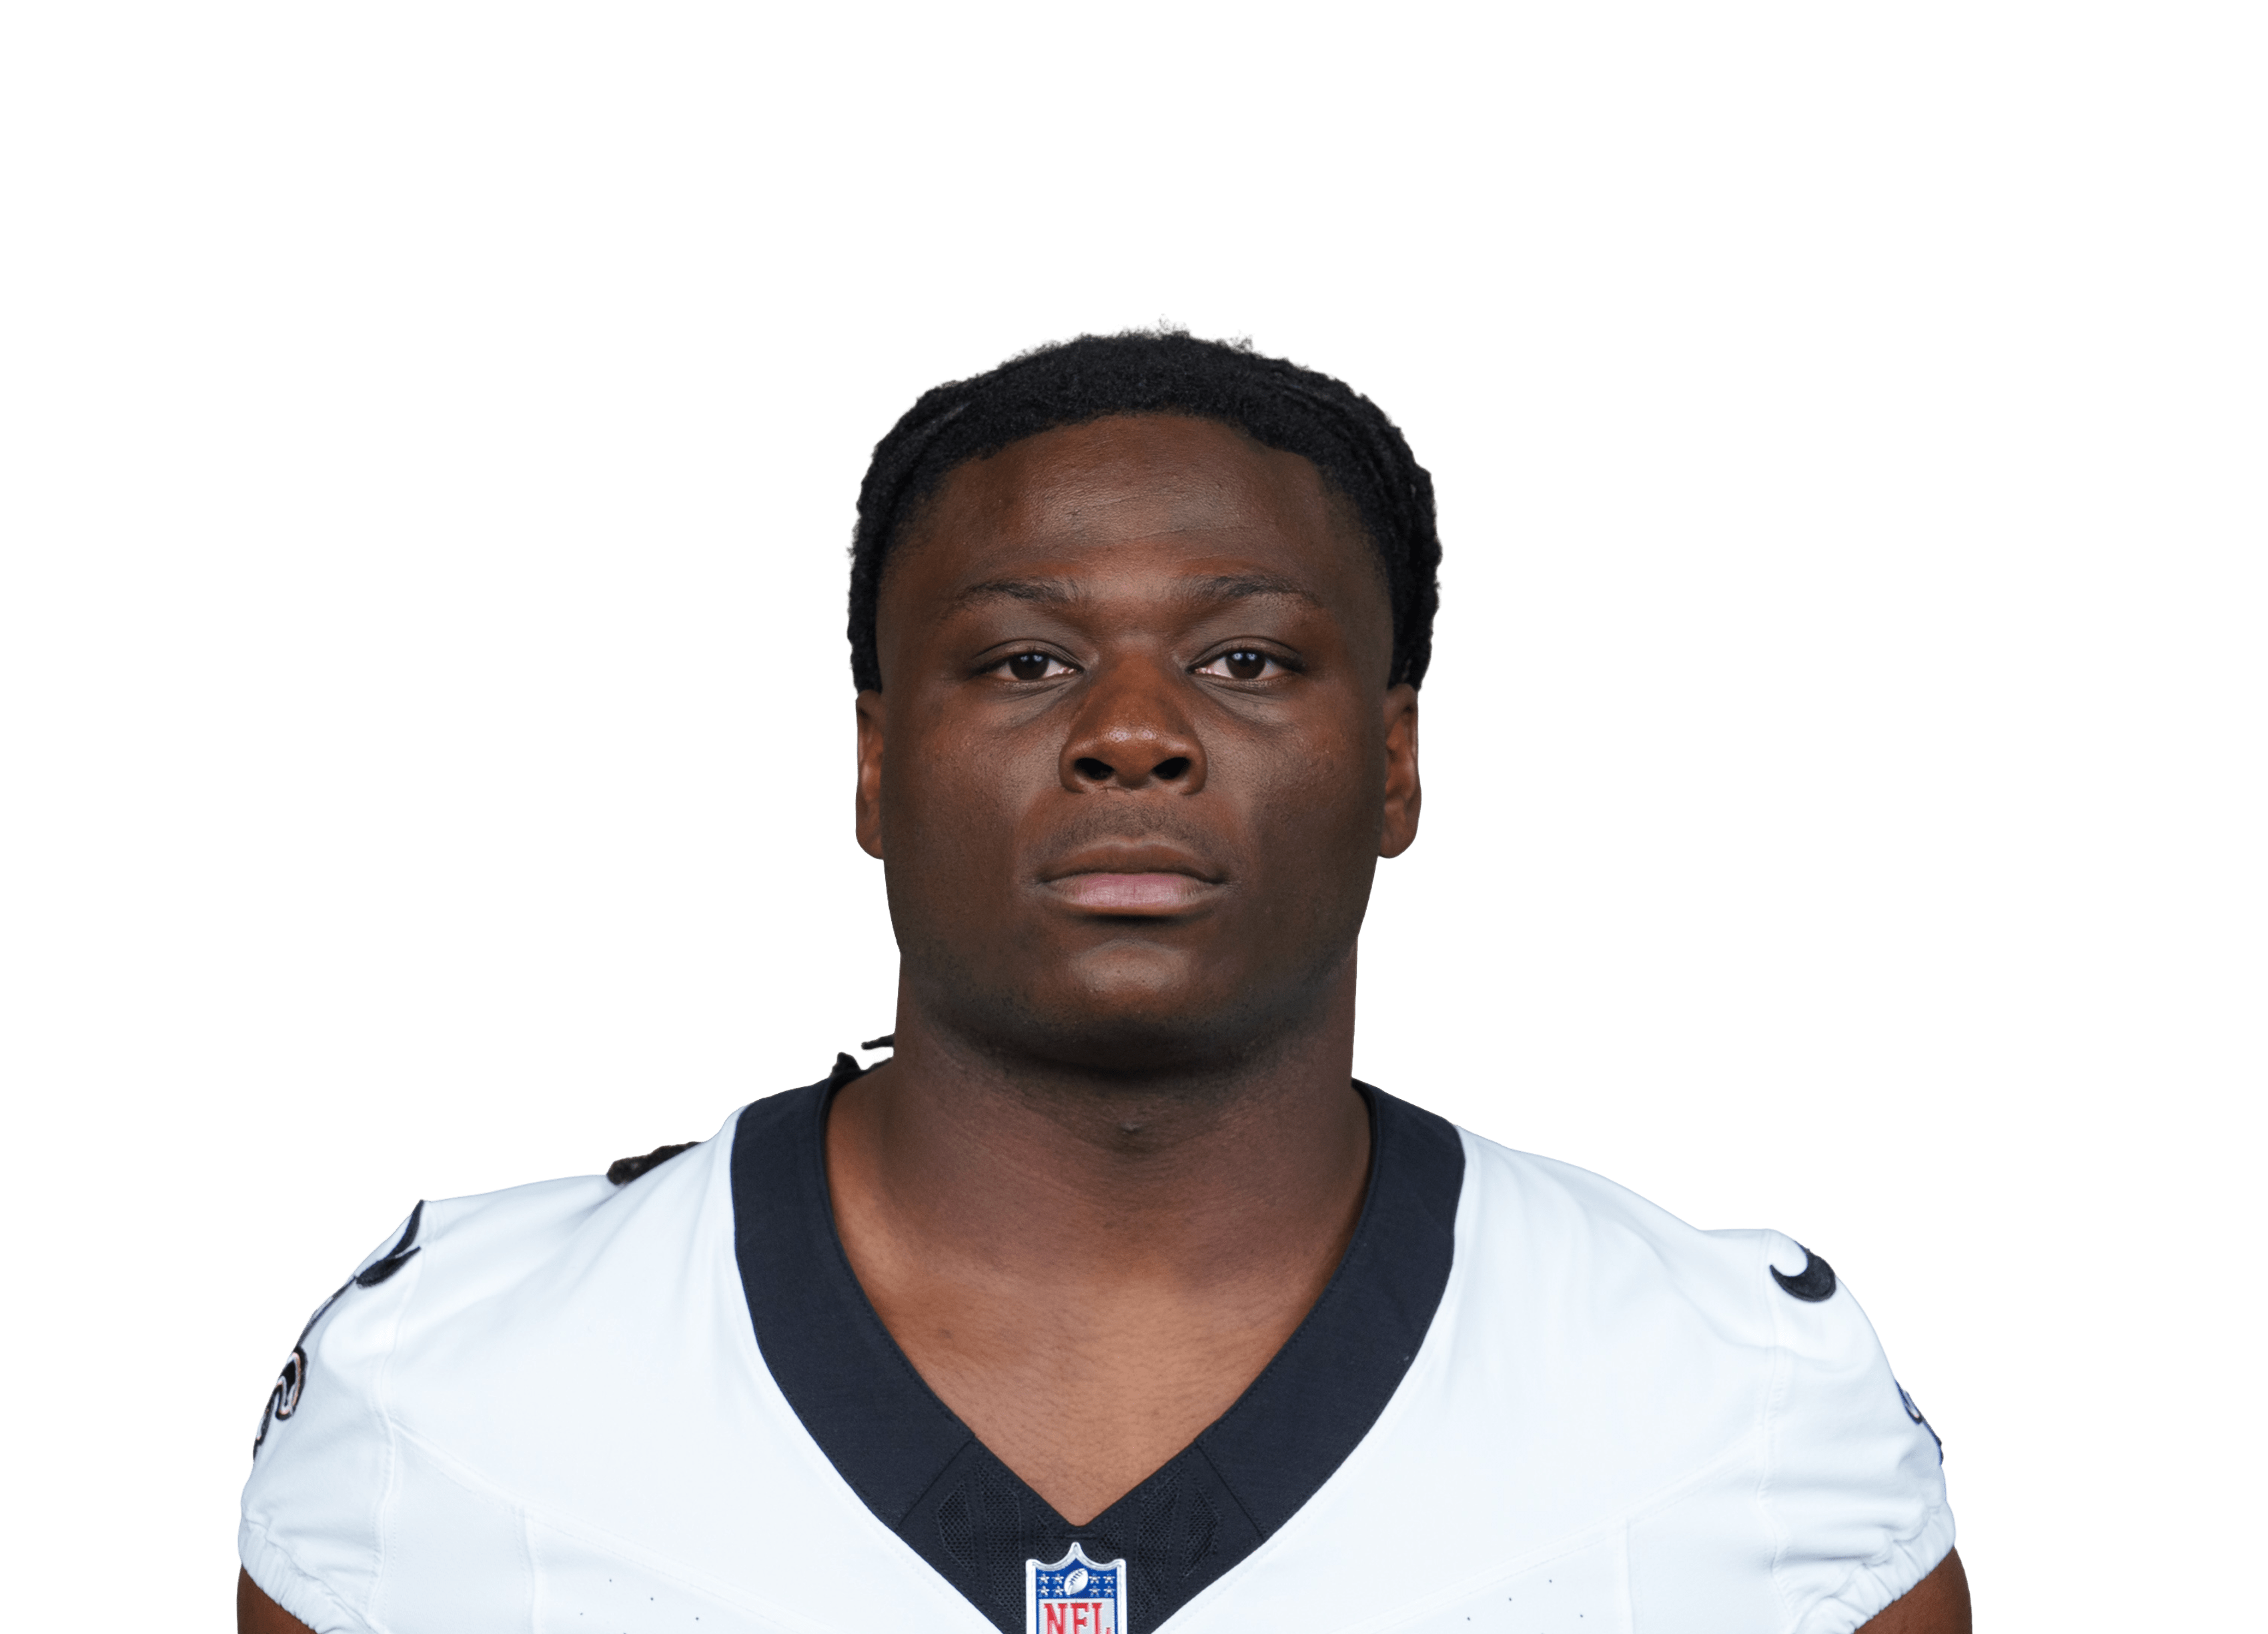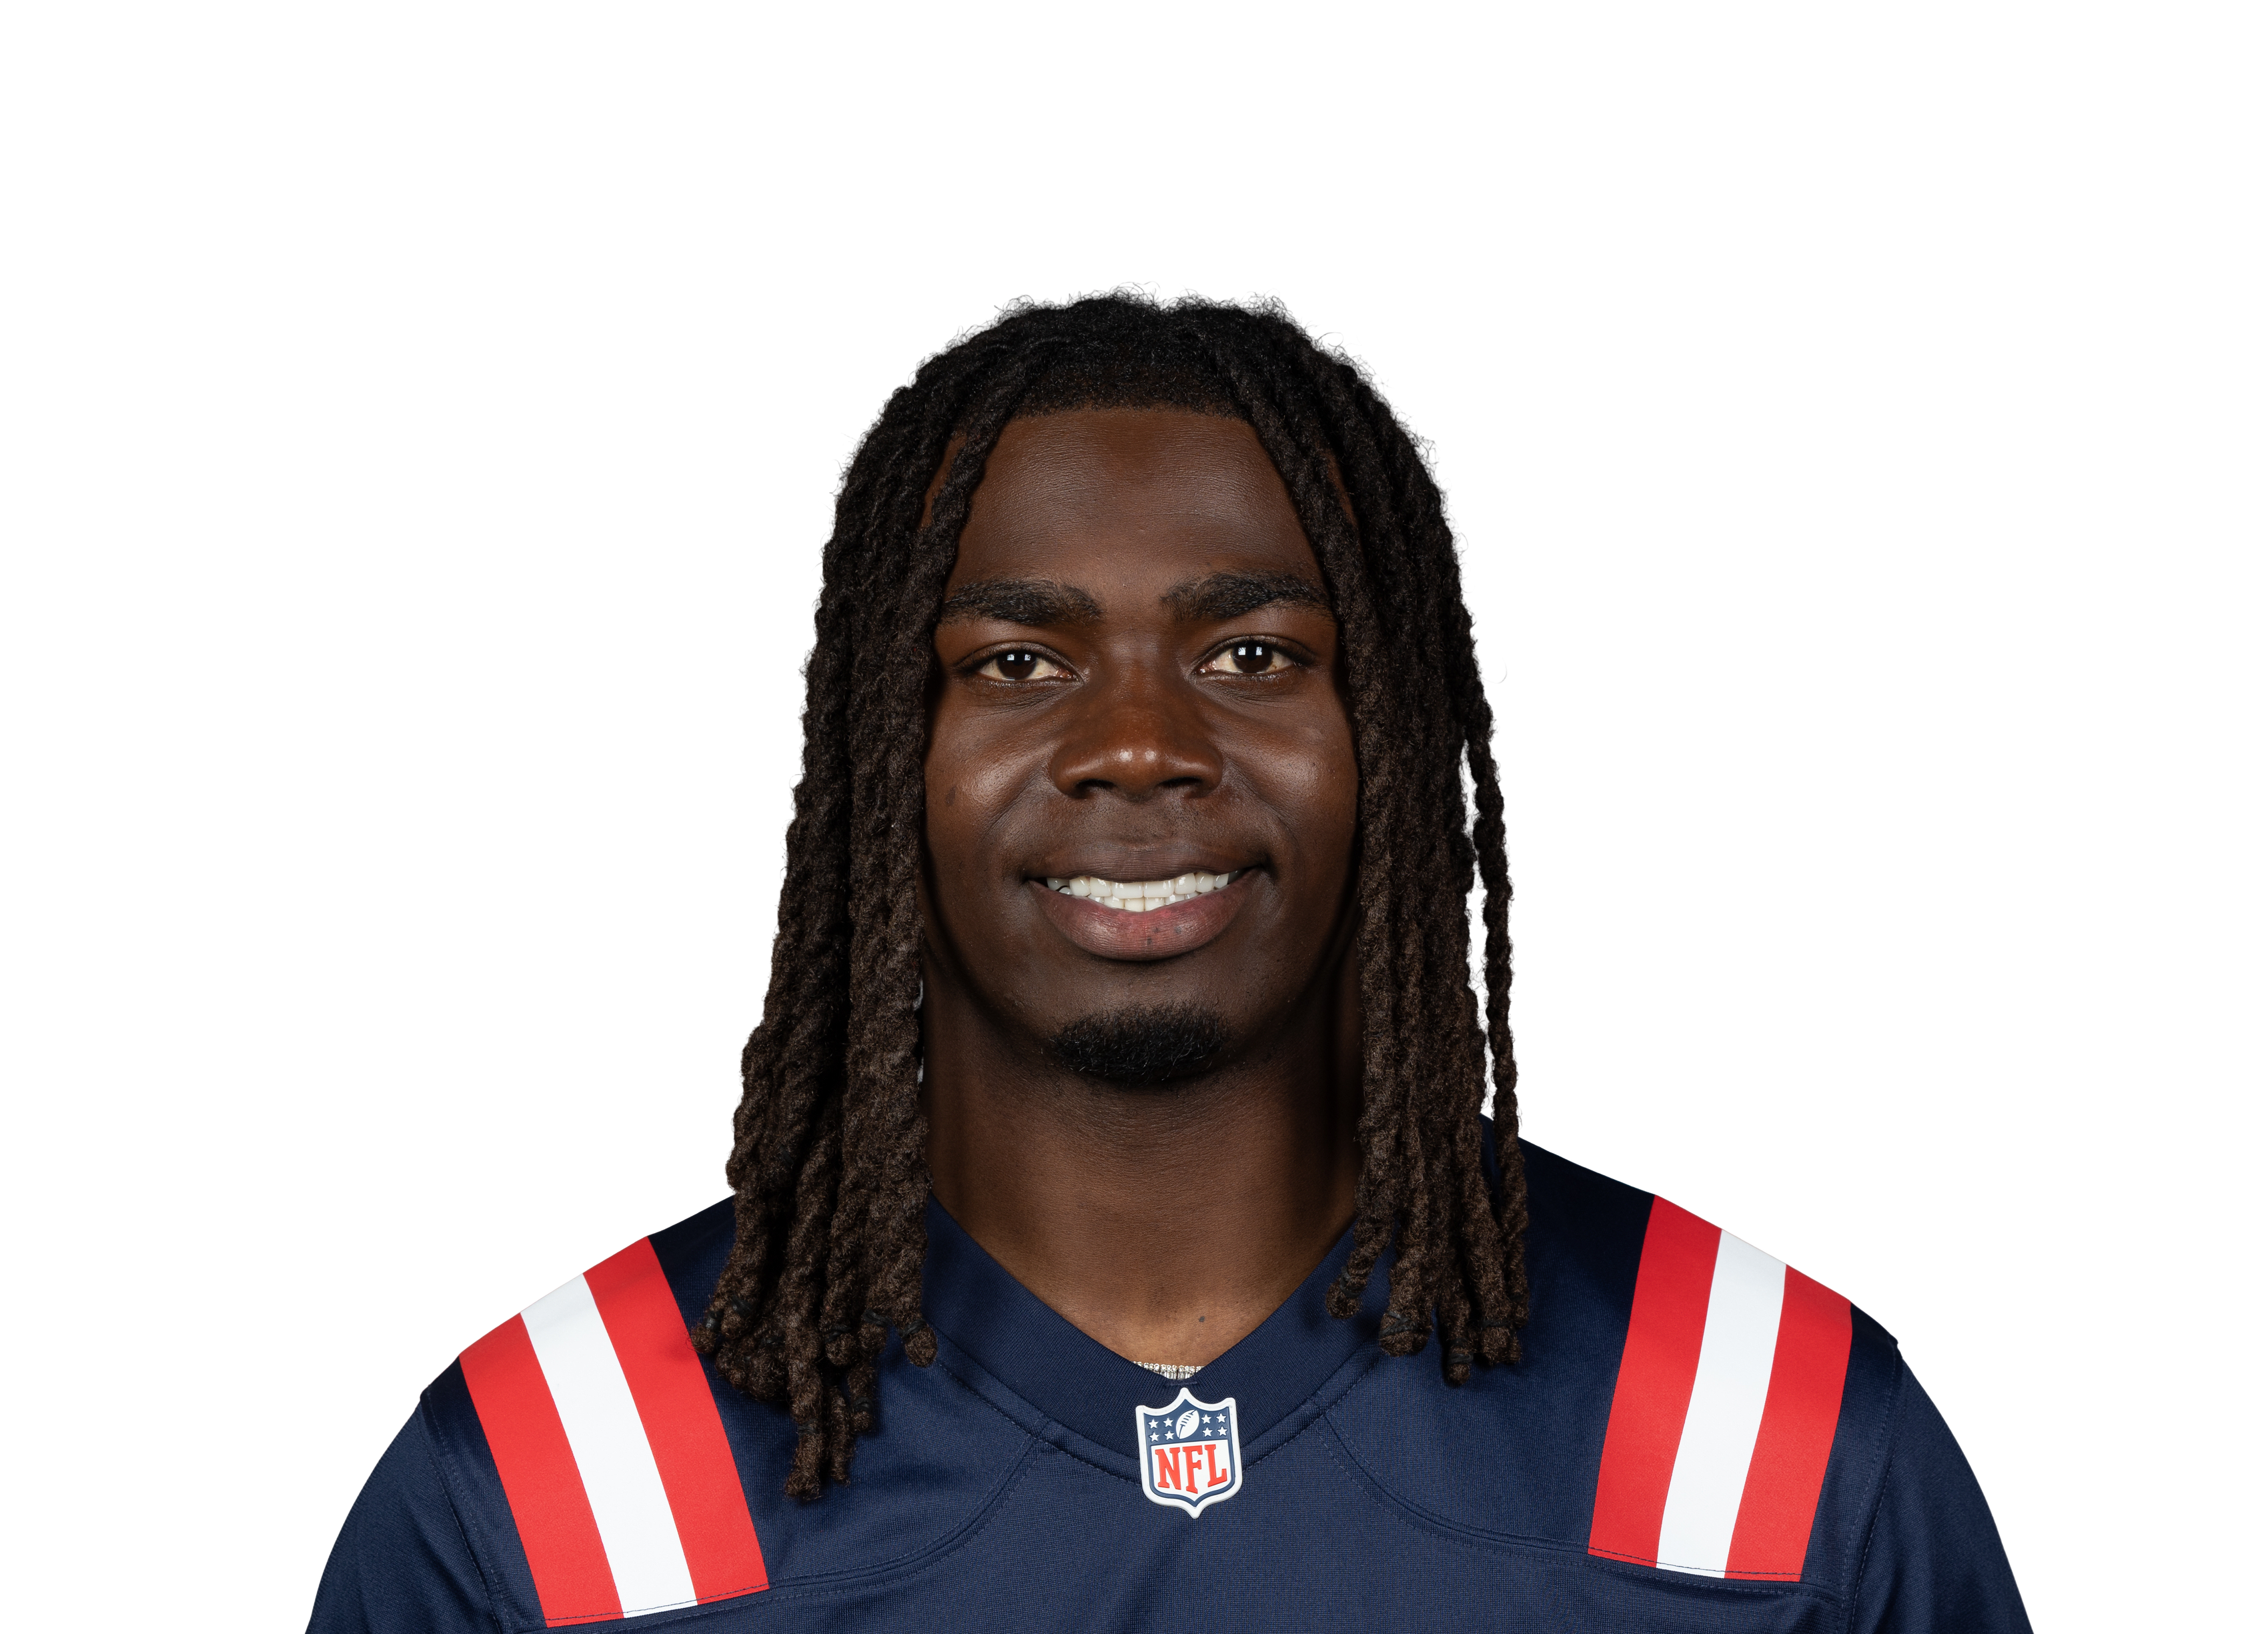
PHI
71.8MANIA RATINGOverall profile · Starter
MANIA RATING • STARTER

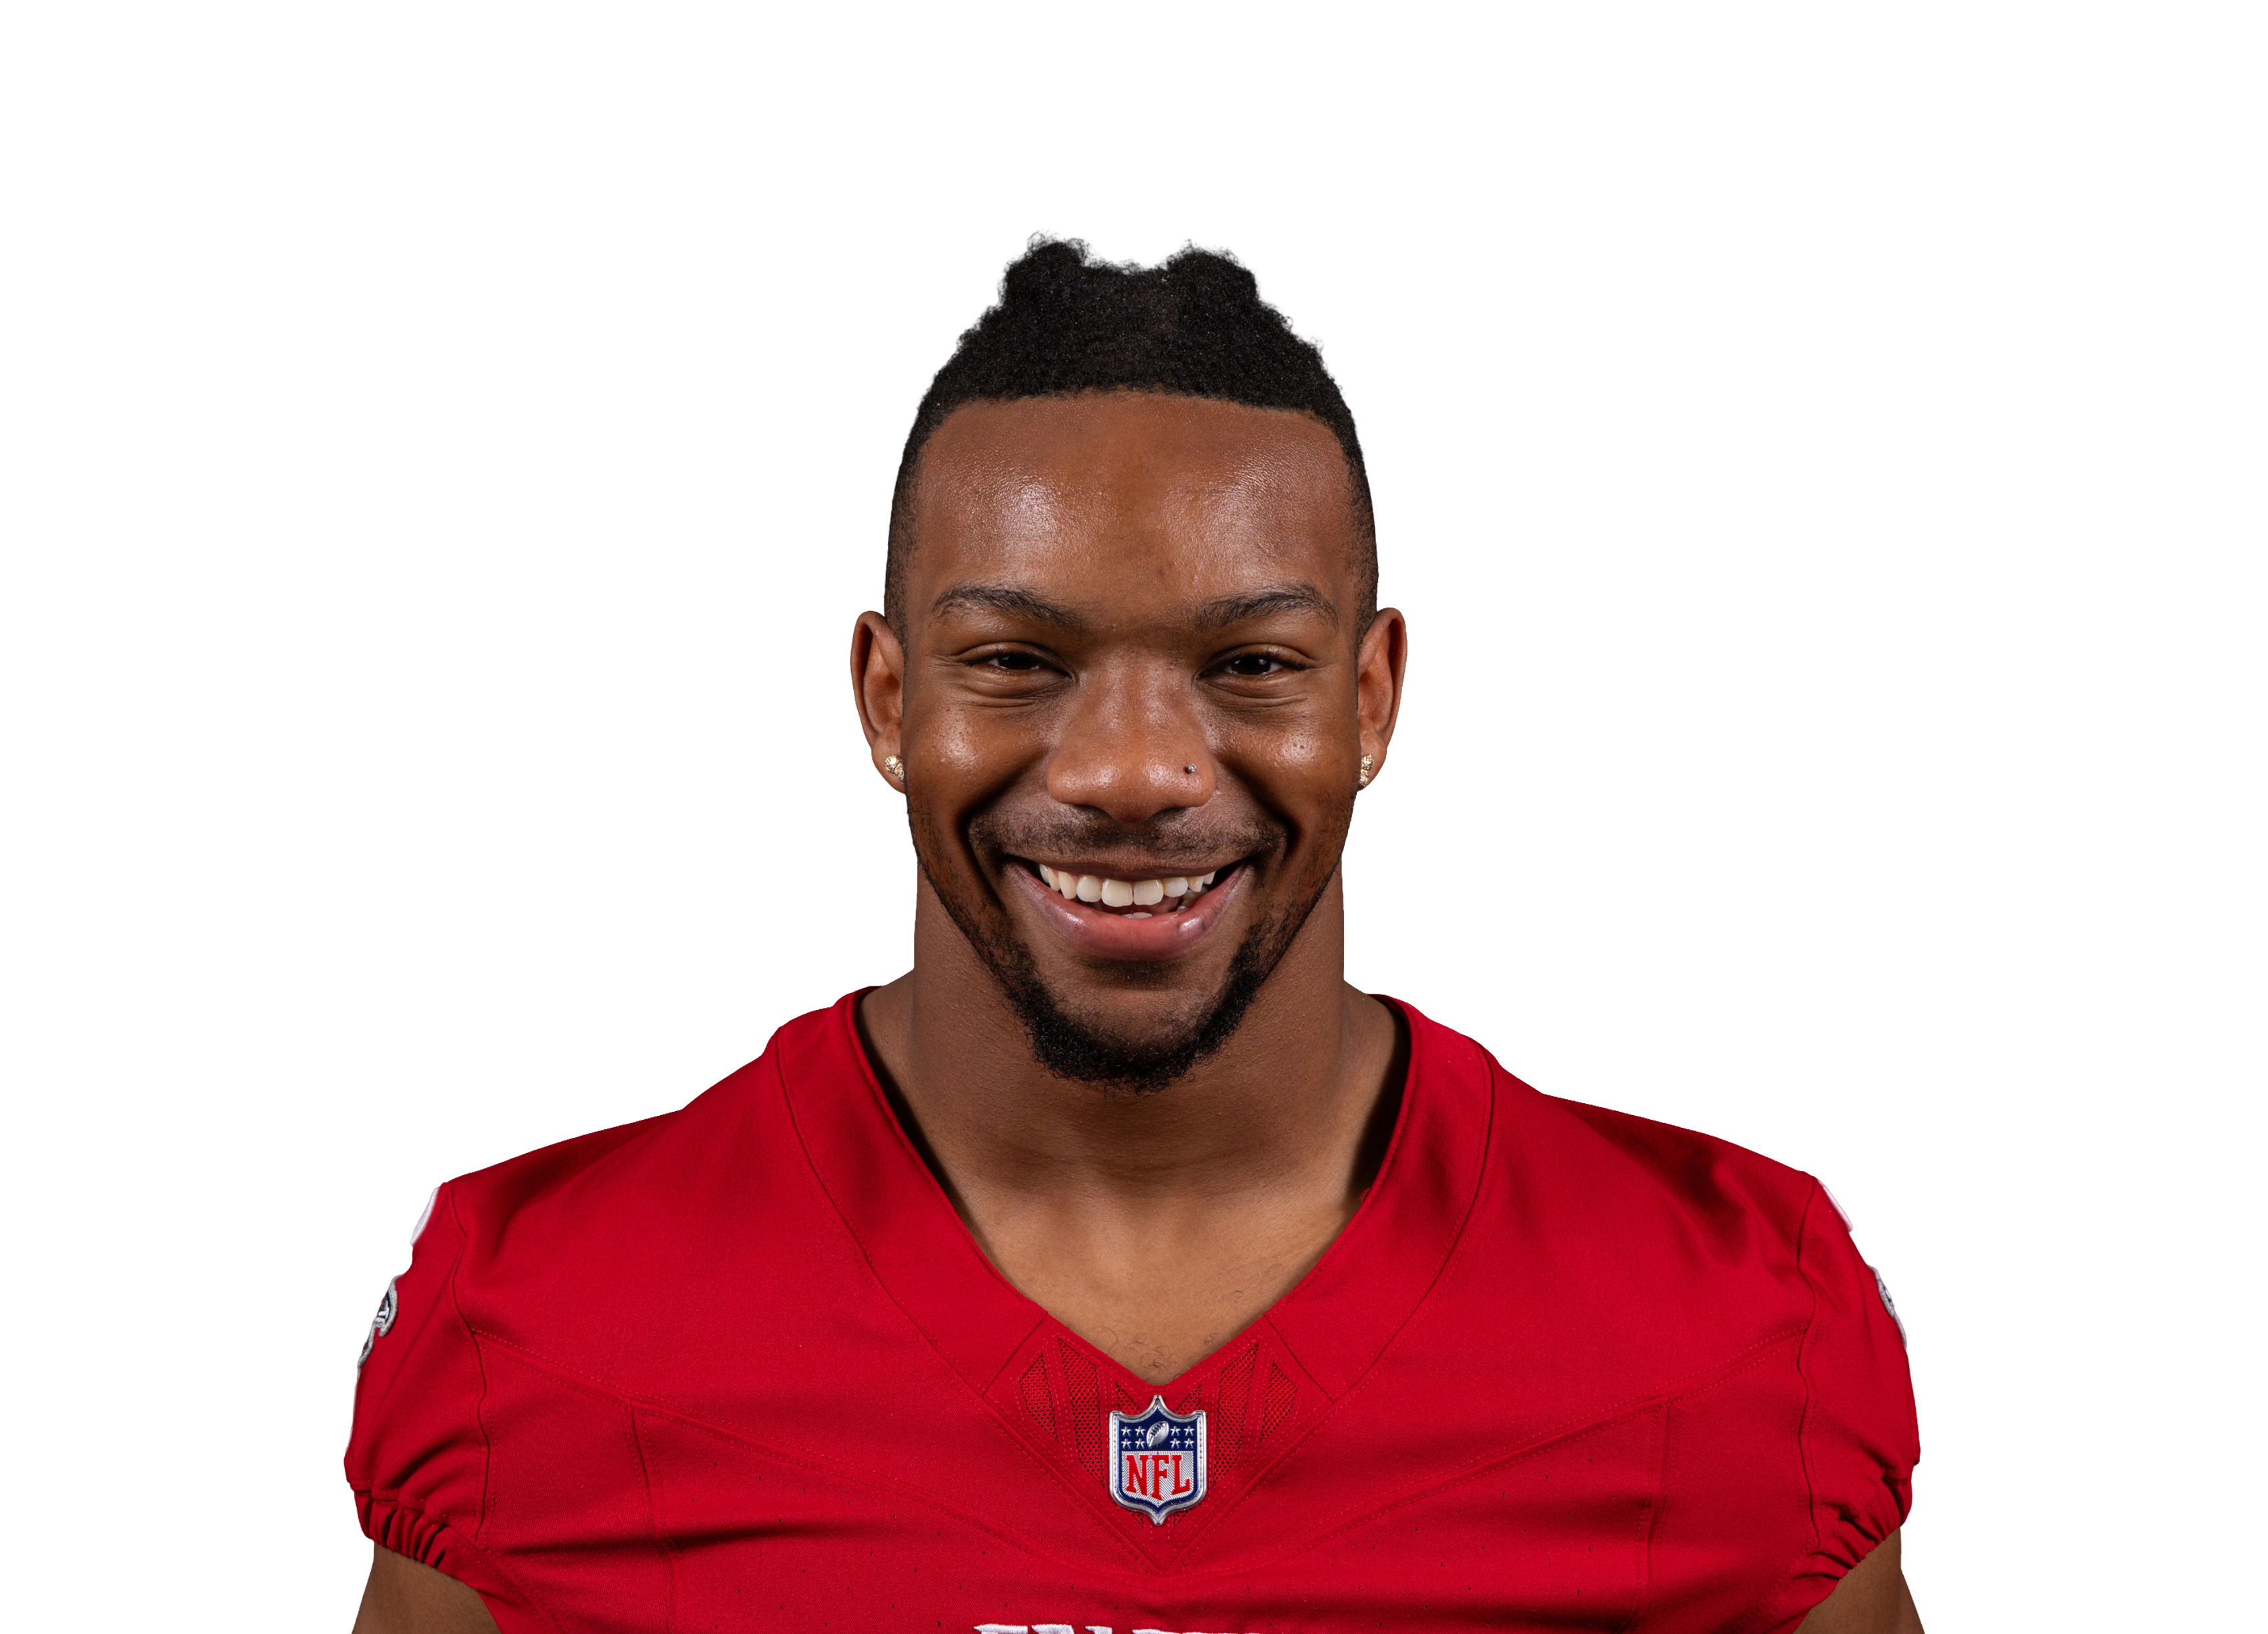
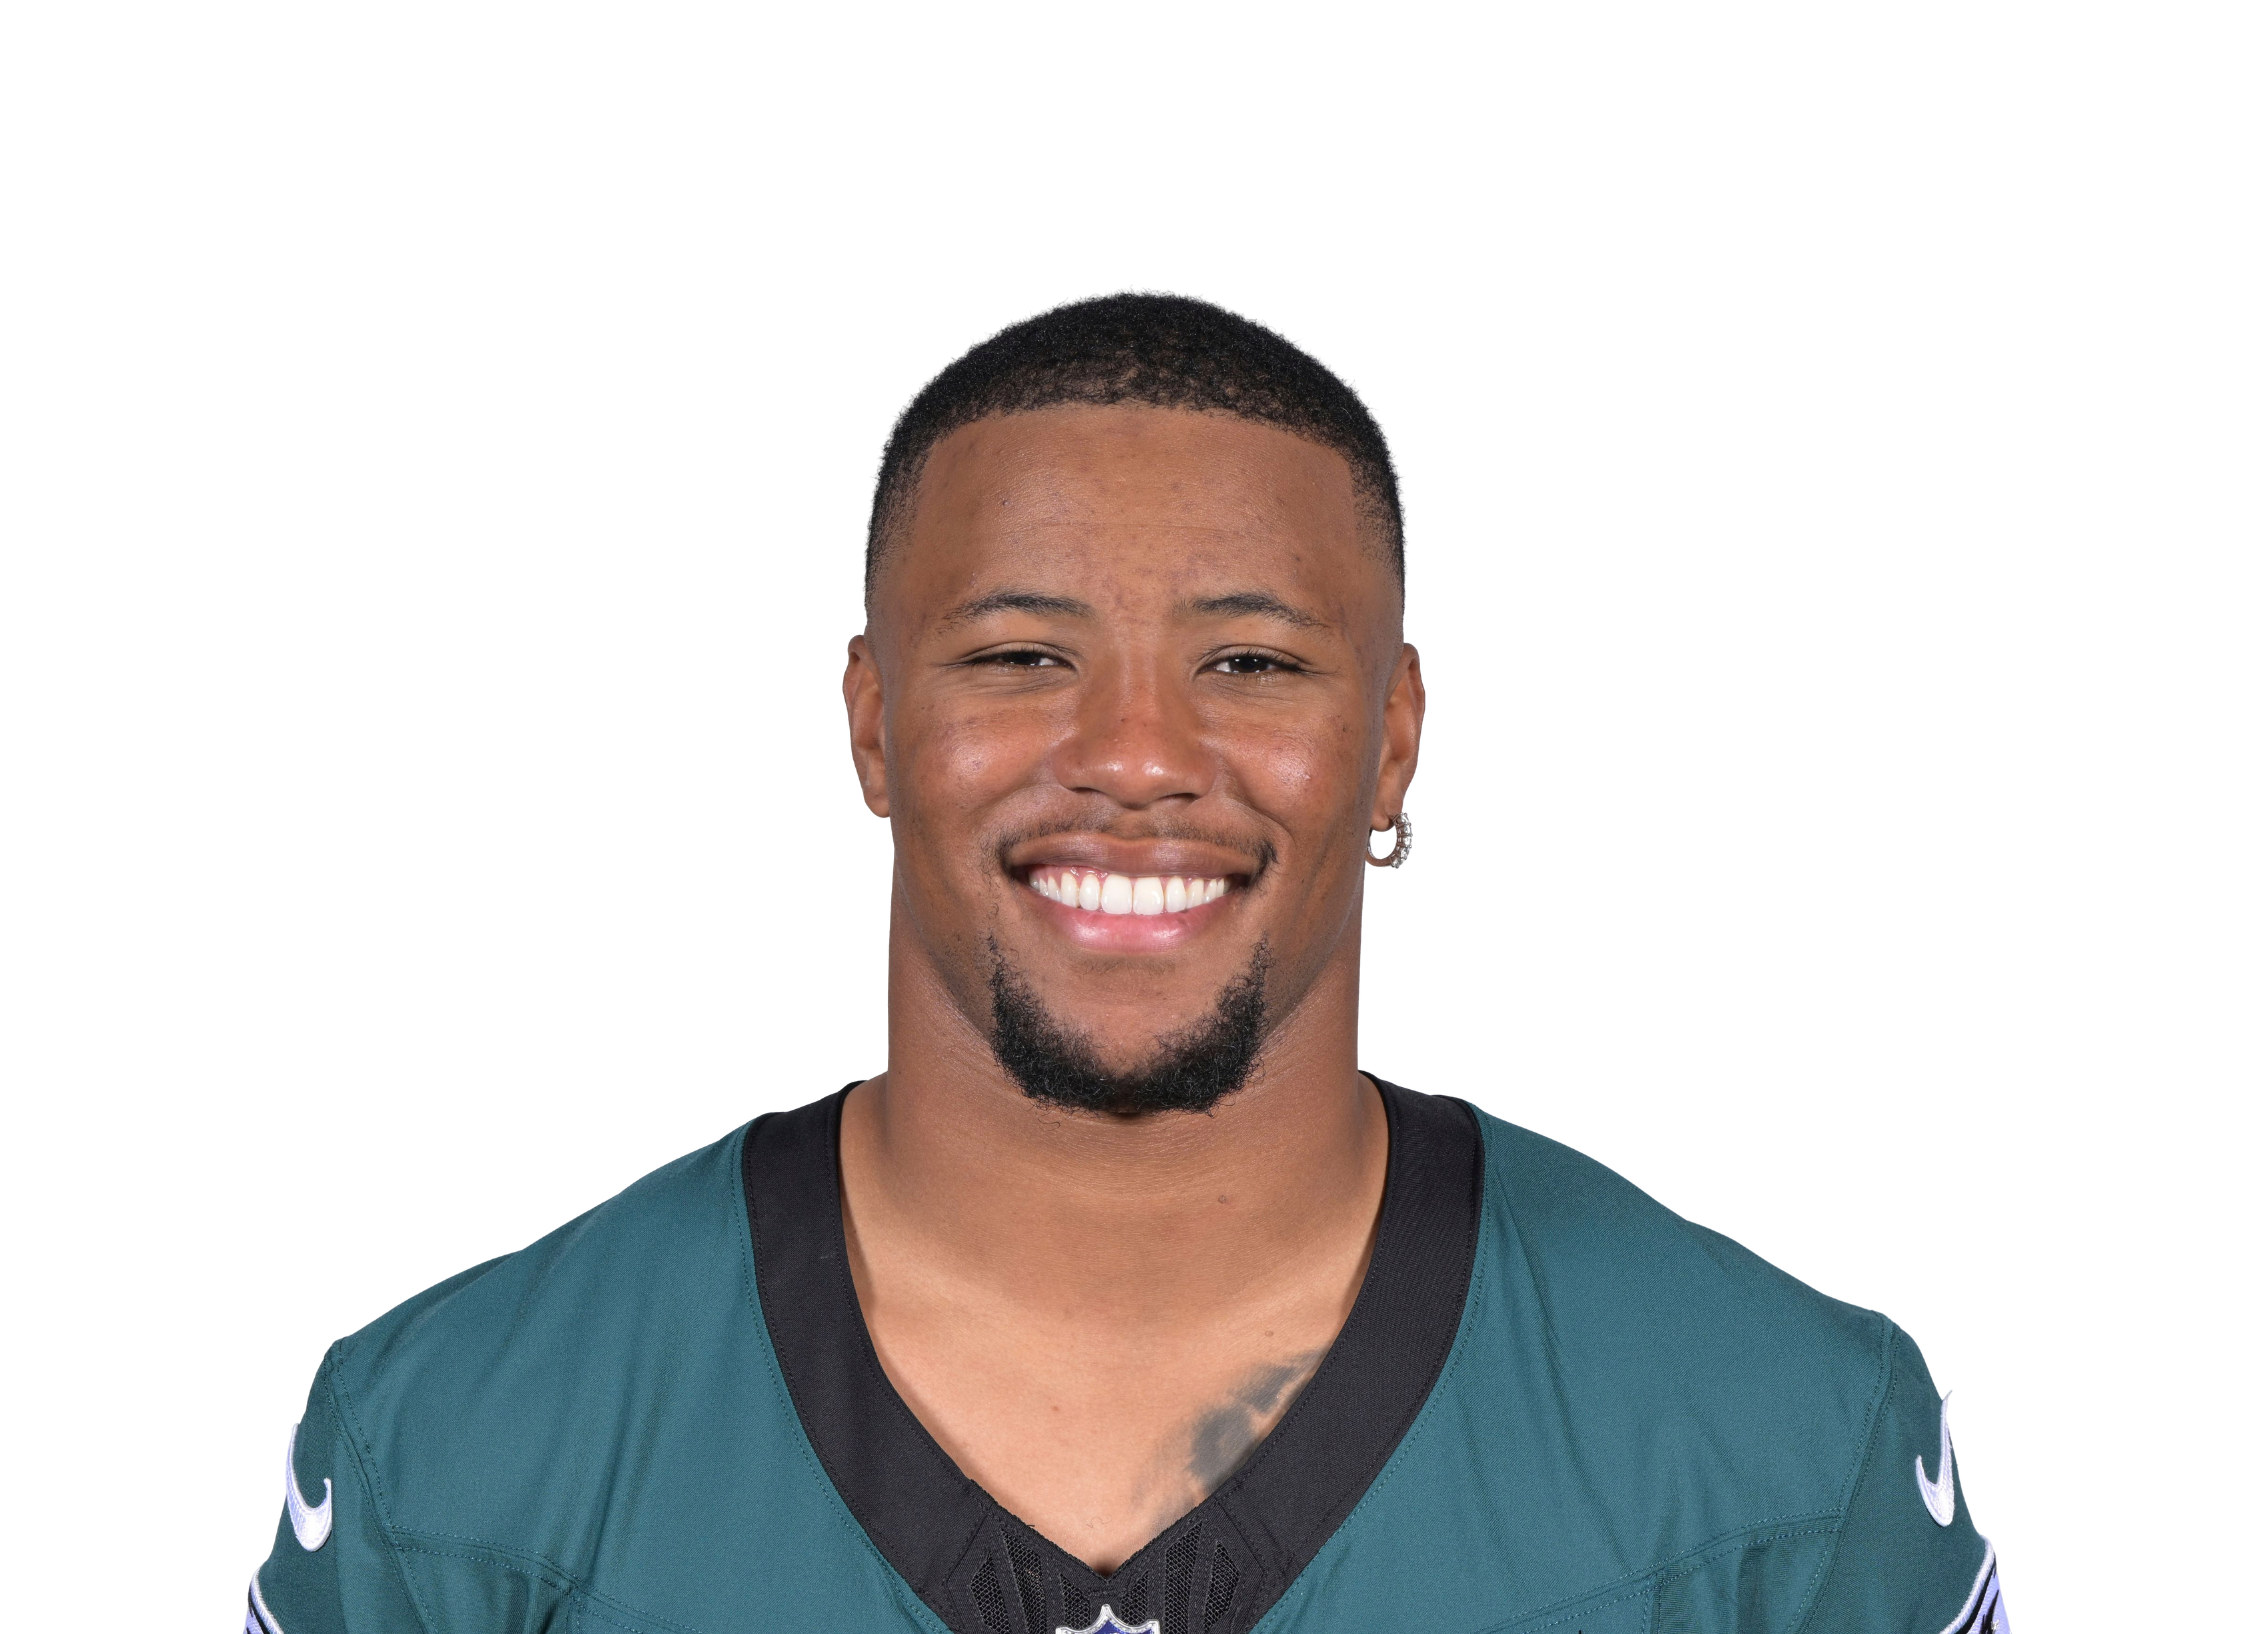
Saquon Barkley

Age 29 · PHI · RB · 7 games
#135 OverallRB33#2 RB on PHIDepth RB1 ›
RB22 this week
79.5WEEK 11 RATINGStart value vs PIT
10.9WEEK 11 PROJECTIONPPR
29%TOUCH SHARE60th percentile
53.2%SNAP SHARE58th percentile
Games counted
A game where he got hurt and missed most of it is already left out (tick it to bring it back). Untick or tick any game and Mania Rating, matchup and Week 11 Rating all recalculate. Official Mania Rating 71.8.
Mix and match games

Pick a teammate with or without. Pick more than one to combine them, like a game without the QB and without the other back.

Milton QB ✓ current
Hurts QB
McKee QB
Wicks WR
Goedert TE
Smith WR
Teammate injuries shift his Week 11 Rating2 teammate notes ▾

Dontayvion Wicks (WR, Out) -1.5 • without him that work was worth 8.9 pts vs 12.3 with (3 games)
Will Shipley (RB, Injured reserve) +0.8 • without him that work was worth 9.4 pts vs 12.3 with (4 games)
Injury report updated Sat Nov 21, 6:30 AM ET
Week 11 Rating = recent role + opponent + the latest injury report (updated Sat Nov 21, 6:30 AM ET). Check final inactives before you set your lineup.
Mania breakdown
Fantasy Production55
Touch Volume32
Backfield Control58
Goal-Line / Red-Zone66
Per-Touch Efficiency49
Mania breakdown
Percentile among RBs. 100 is the best, 50 is average.
55
How many fantasy points and total yards he is actually producing, compared with players at his position. Ranks better than 55% of RBs.
32
How many carries and targets he gets per game compared with other running backs. Ranks better than 32% of RBs.
58
How much of his team backfield he owns: share of touches plus snap share. Ranks better than 58% of RBs.
66
Scoring-position work: red-zone carries, goal-line carries (inside the 5) and red-zone targets. Ranks better than 66% of RBs.
49
What he produces with each touch instead of just rewarding volume: fantasy points per touch, yards per carry and catch rate. Ranks better than 49% of RBs.
Top 30%MiddleBottom 40%Tap a category to see what it means.
Week 11 projection
10.9
projected points
Floor 3.1 · Ceiling 20.4
-2.2Game script
0.0Matchup
+0.1Injuries
Week 11 projection
PHI
VSPPR
PIT
Average matchup • PIT is #13 in points allowed to RBs
10.9
projected pointsRushing 14.5 carries, 59 yds • Receiving 2.2 targets, 1.5 catches, 9 yds • 0.43 TD
Floor 3.14 of 5 games land hereCeiling 20.4
Vegas lines included. From usage alone: 10.2. Sportsbook lines imply 11.4. Blended: 10.9. Biggest gaps: touchdowns 0.51 on the sportsbooks vs 0.33 from usage.
-2.2Game script
0.0Matchup
+0.1Injuries
How this is built
Recent and last-season usage, the Vegas spread and total, how this defense treats his position, and the injury report (teammates out, QB out). The three boxes show how many points each moved it. When sportsbook player lines are posted (Wednesday to Sunday) they are blended in, leaning on them most for new starters and players with few games. PPR scoring only. Tested on past seasons it is about 5% closer than a plain season average.
Week 11 matchup
vs PIT
Neutral matchup
Adjustment+0.4 pts
Allows to RBs14th most
Week11
Week 11 matchup
vs PIT
-2.3Rating boost
Tough matchup13th easiest of 32 defenses for RBs
ToughEasy
22.1PPR a game PIT allows to RBs
9.3Similar players, usual PPR a game
9.2Same players against PIT
Players with a role like his scored 9.2 PPR a game against PIT, versus 9.3 in their usual games (-2%). That moves his Week 11 Rating by -2.3.
How running backs did against PIT

22.8 PPR points a game allowed to running backs, 13th most of 32 defenses.

PlayerPPRRushRush YdRush TDRecRec Yd
Bijan Robinsonvs ATL • Wk 131.321830890
Chase Brown@ CIN • Wk 1028.310440839
Quinshon Judkins@ CLE • Wk 421.617531643
Samaje Perine@ CIN • Wk 1013.96141425
TreVeyon Henderson@ NE • Wk 213.61676100
Alvin Kamara@ NO • Wk 713.2650757
Dylan Sampsonvs CLE • Wk 812.9170662
Jonathan Taylorvs IND • Wk 511.215450337
Chase Brownvs CIN • Wk 38.91361028
Jaleel McLaughlin@ CLE • Wk 48.8128100
Bucky Irving@ TB • Wk 66.91946023
Quinshon Judkinsvs CLE • Wk 86.911250224
Kendre Miller@ NO • Wk 75.8860322
Rhamondre Stevenson@ NE • Wk 23.6643013
Raheim Sanders@ CLE • Wk 43.629027
Kenny Gainwell@ TB • Wk 63.4217017
Brian Robinsonvs ATL • Wk 13.1931000
Seth McGowanvs IND • Wk 52.9516013
Samaje Perinevs CIN • Wk 32.439015
Reggie Gilliam@ NE • Wk 21.400014
Tahj Brooks@ CIN • Wk 101.2312000
Corey Kiner@ NE • Wk 20.020000

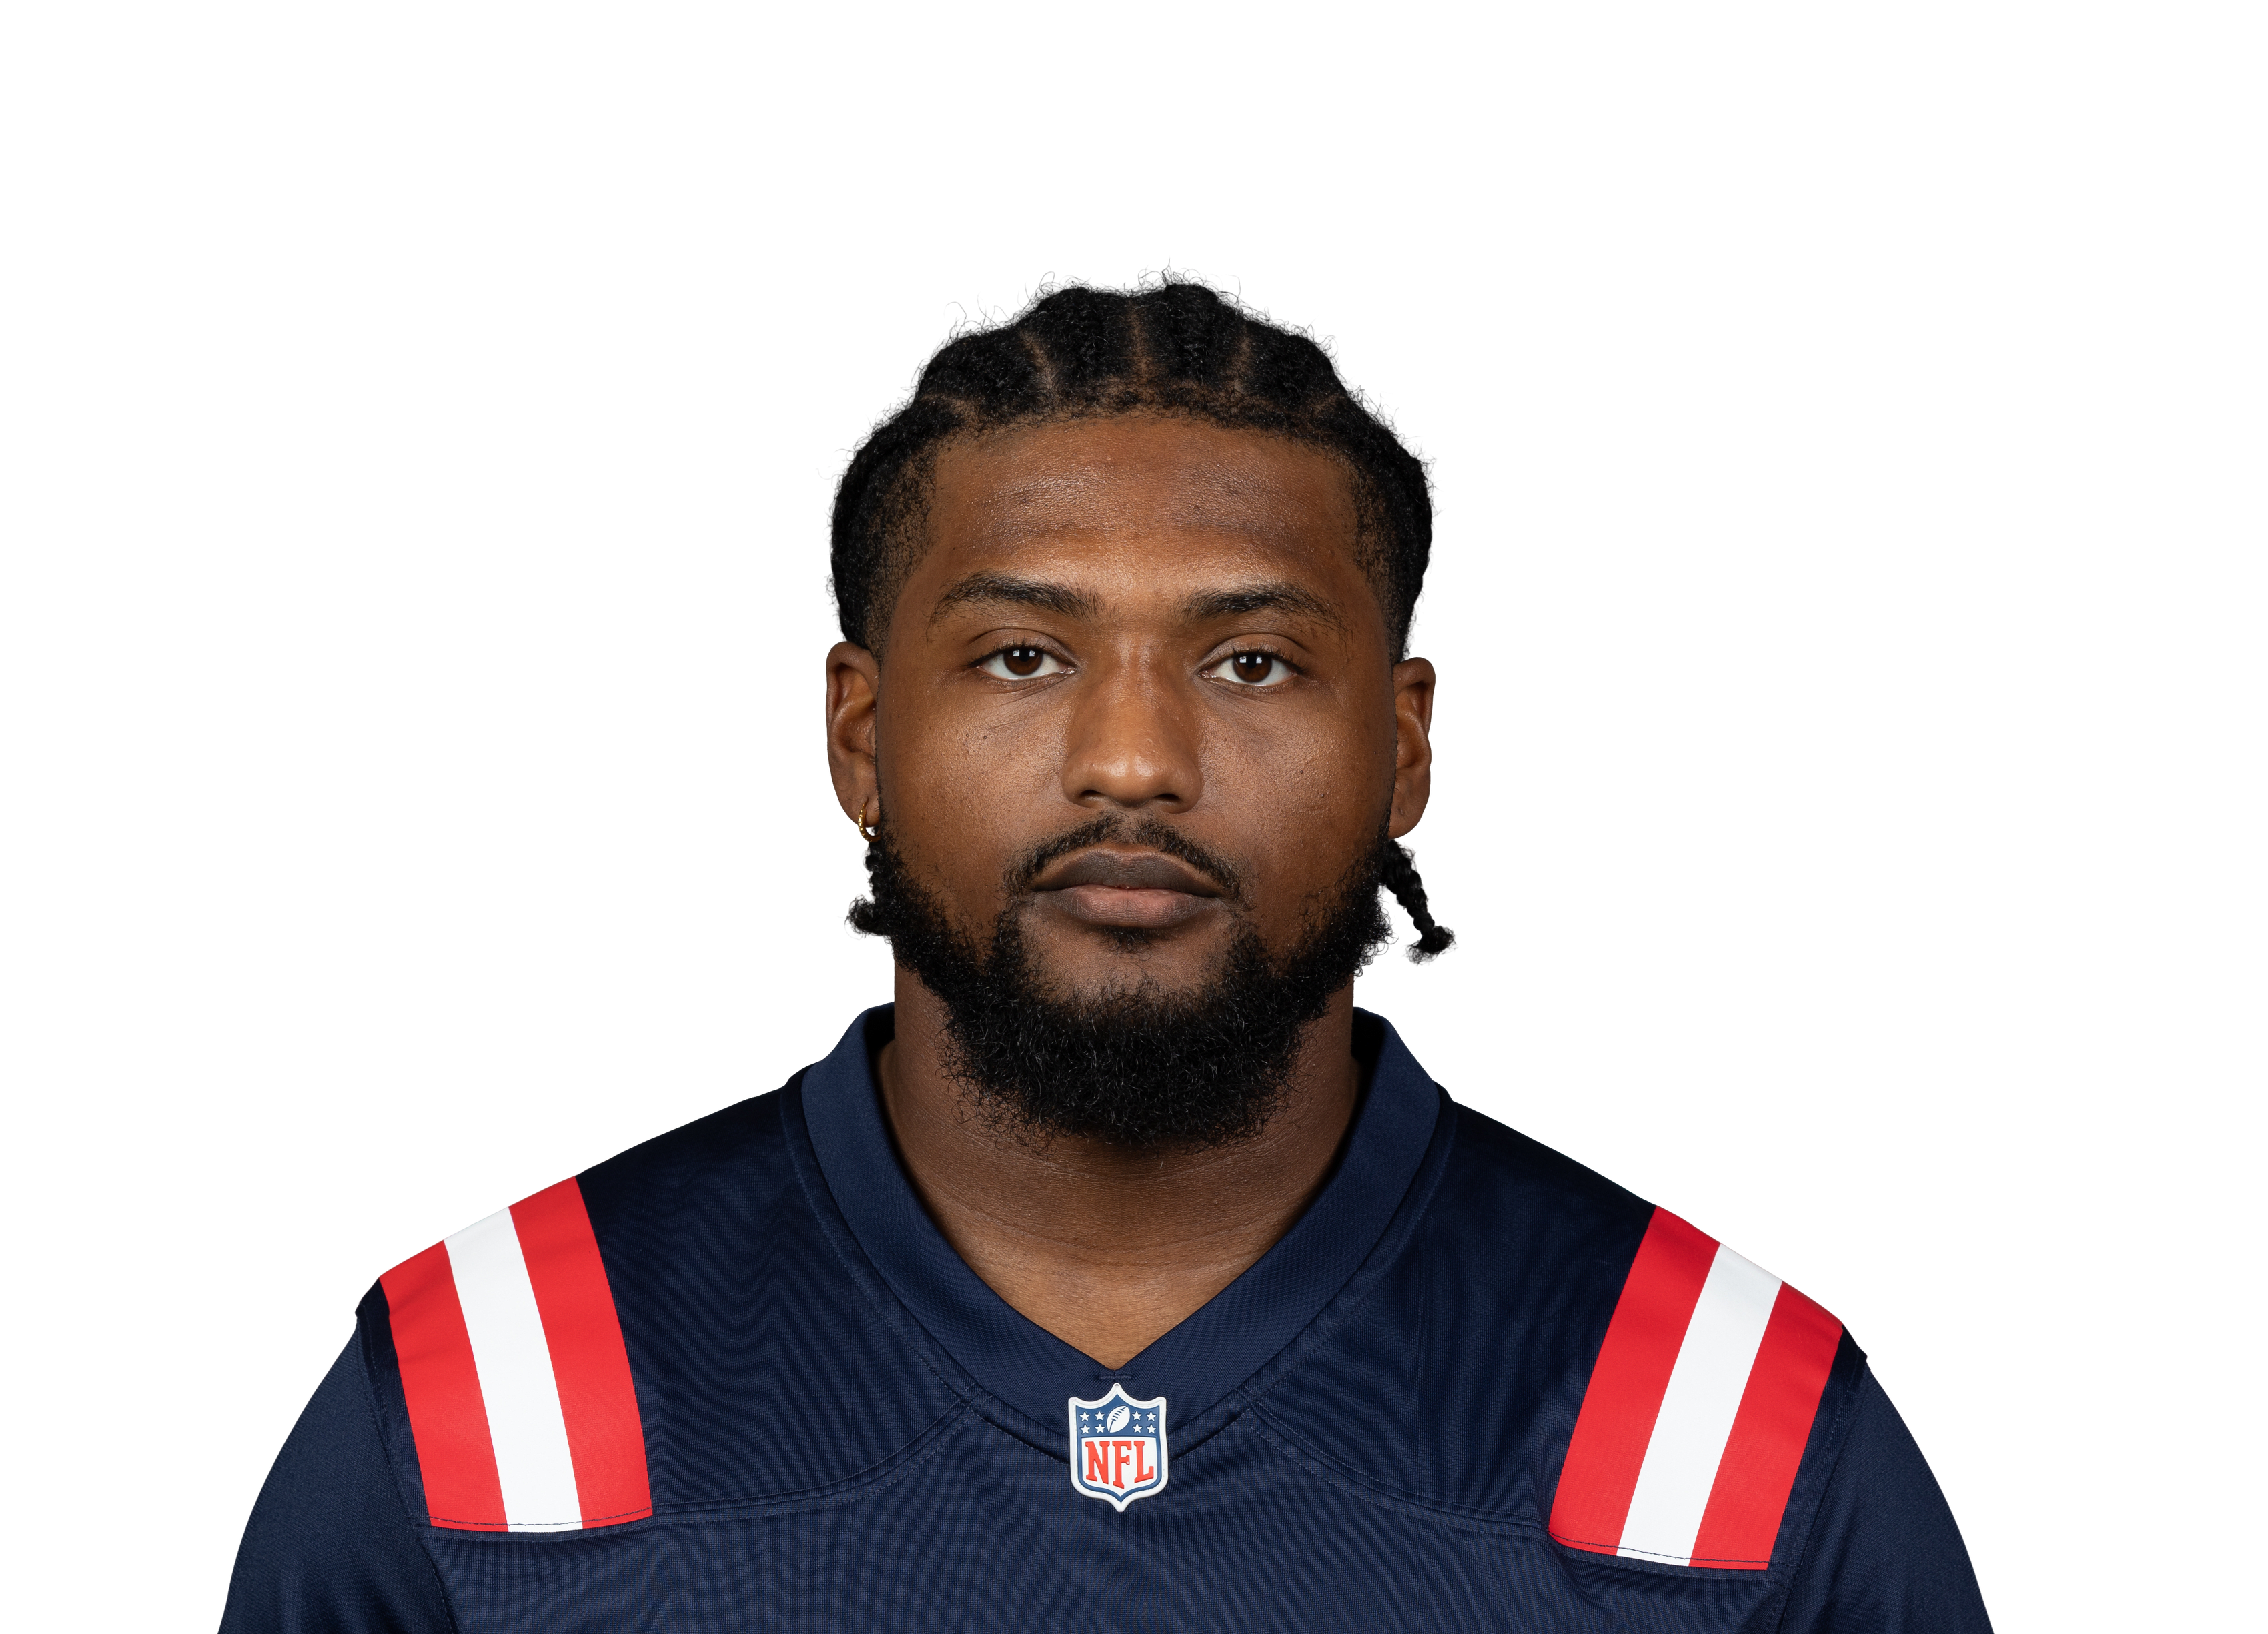
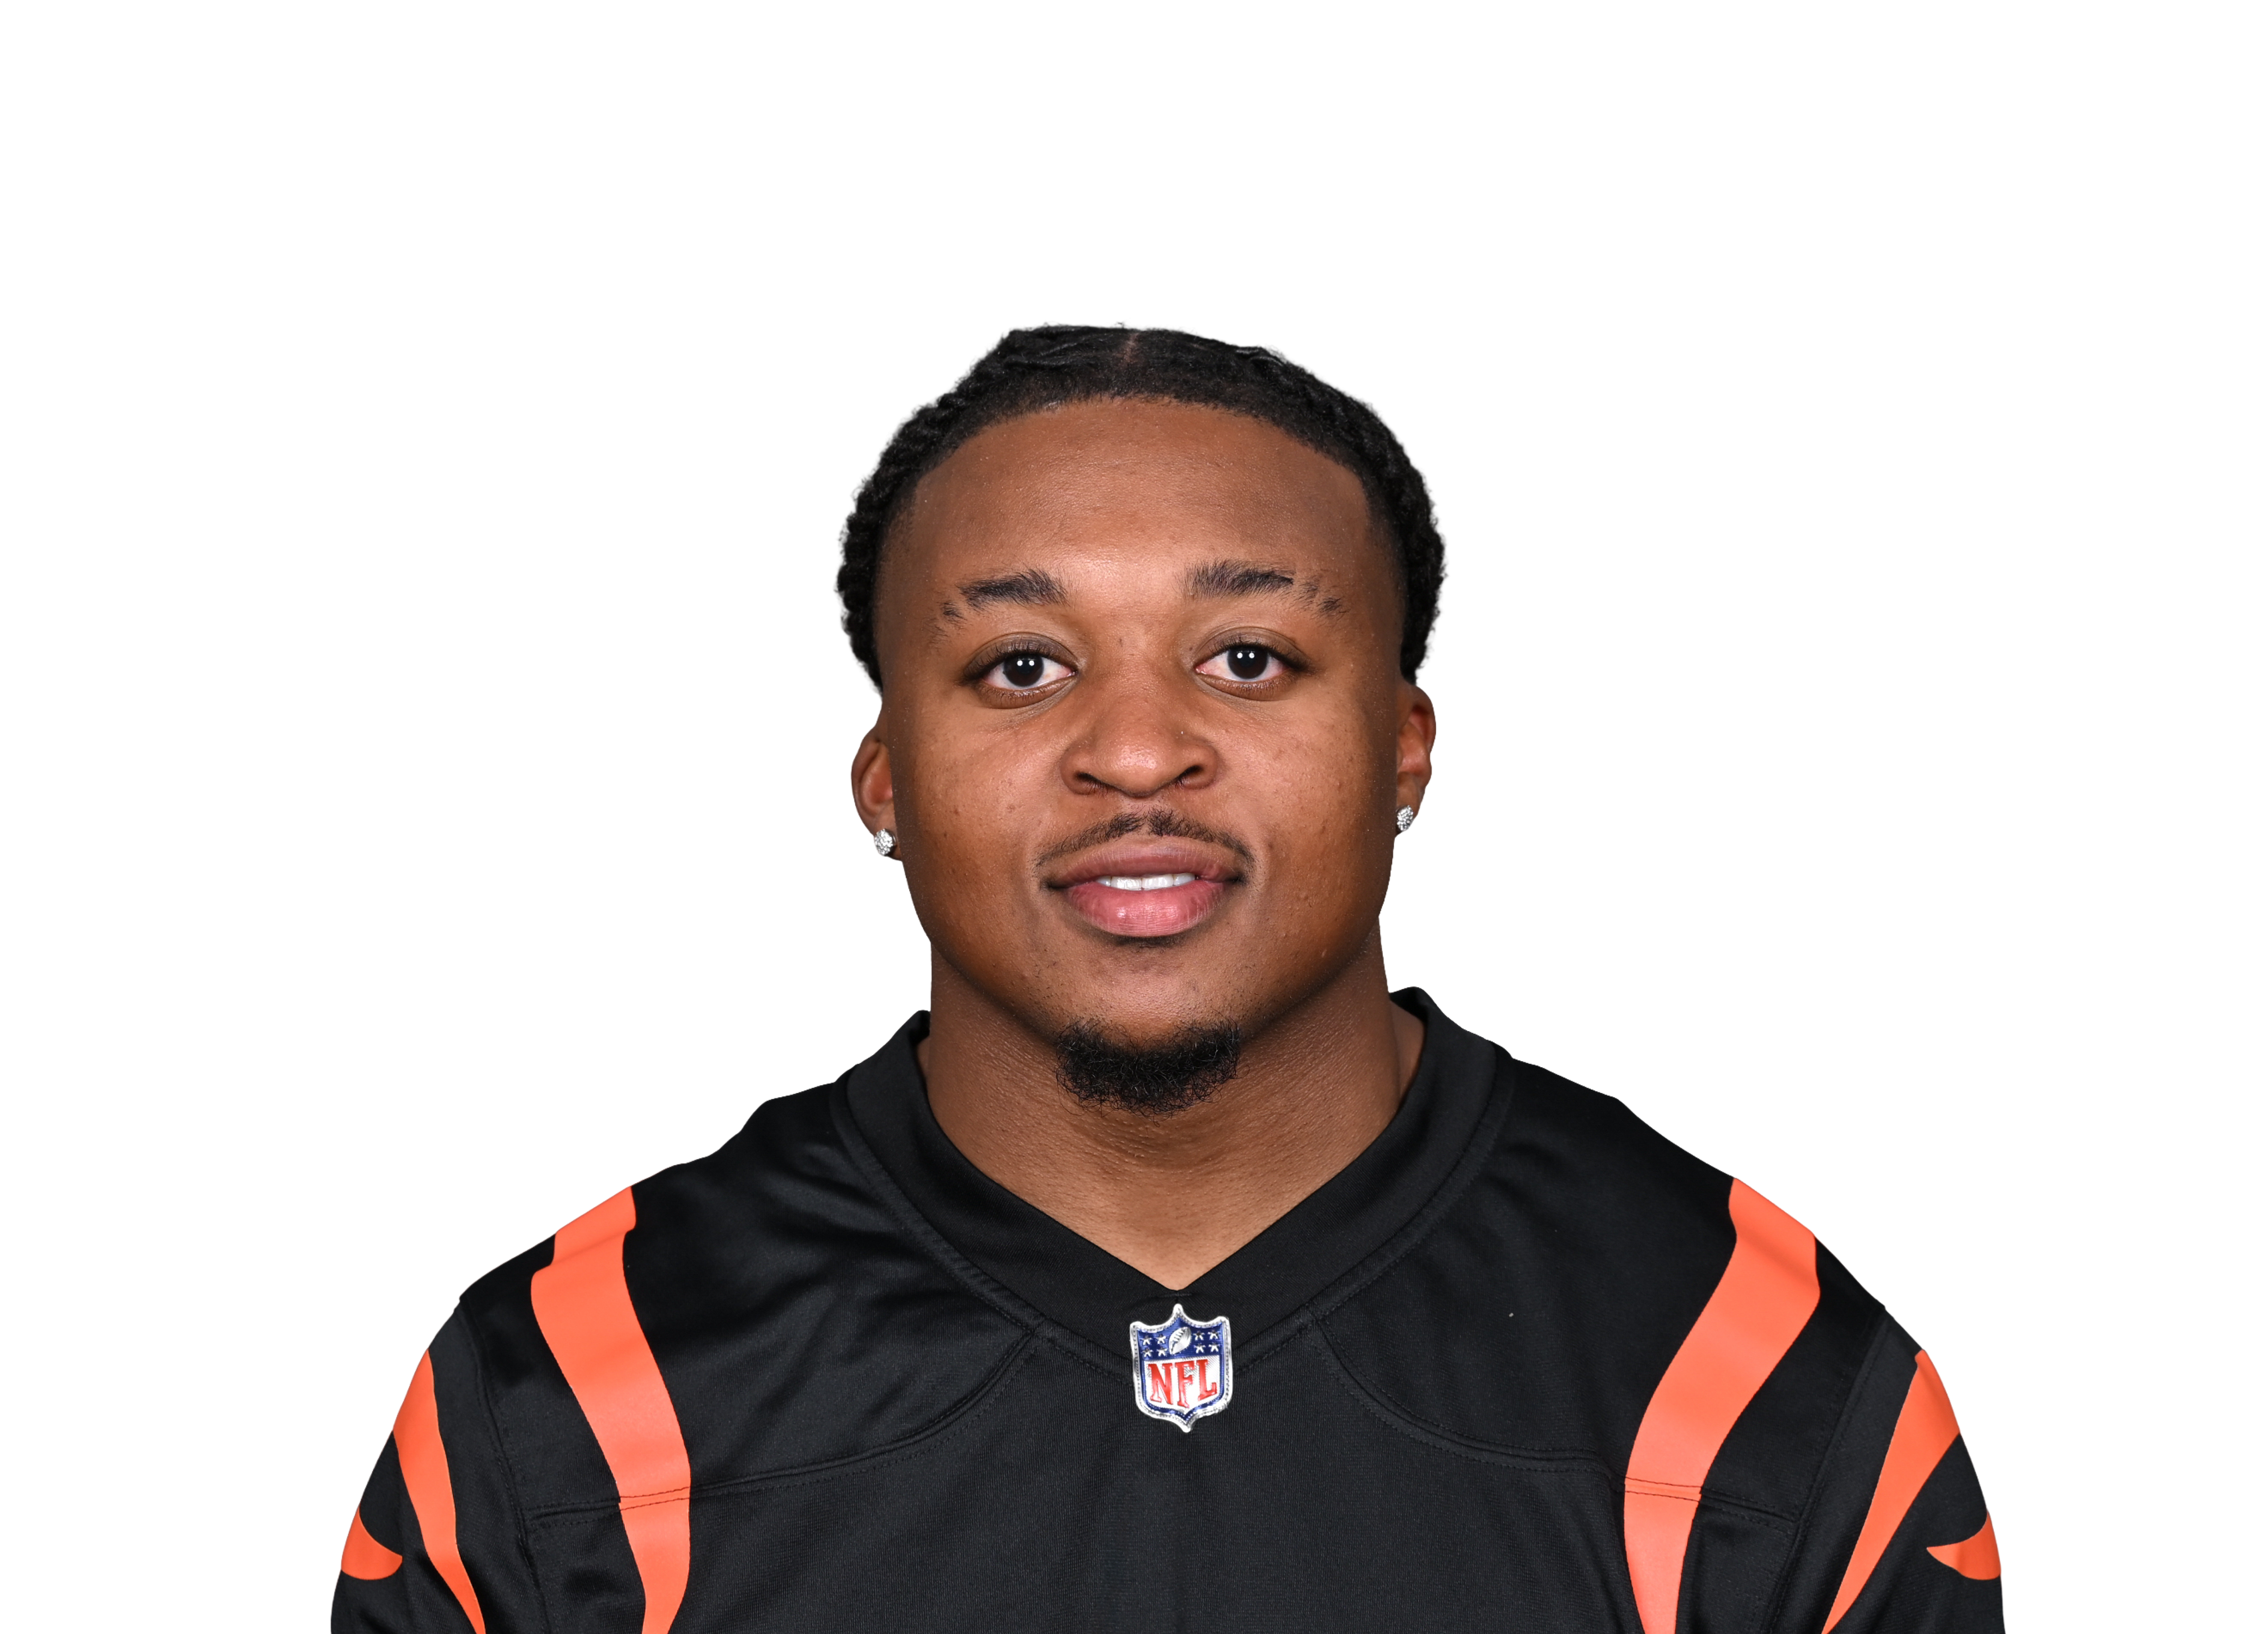
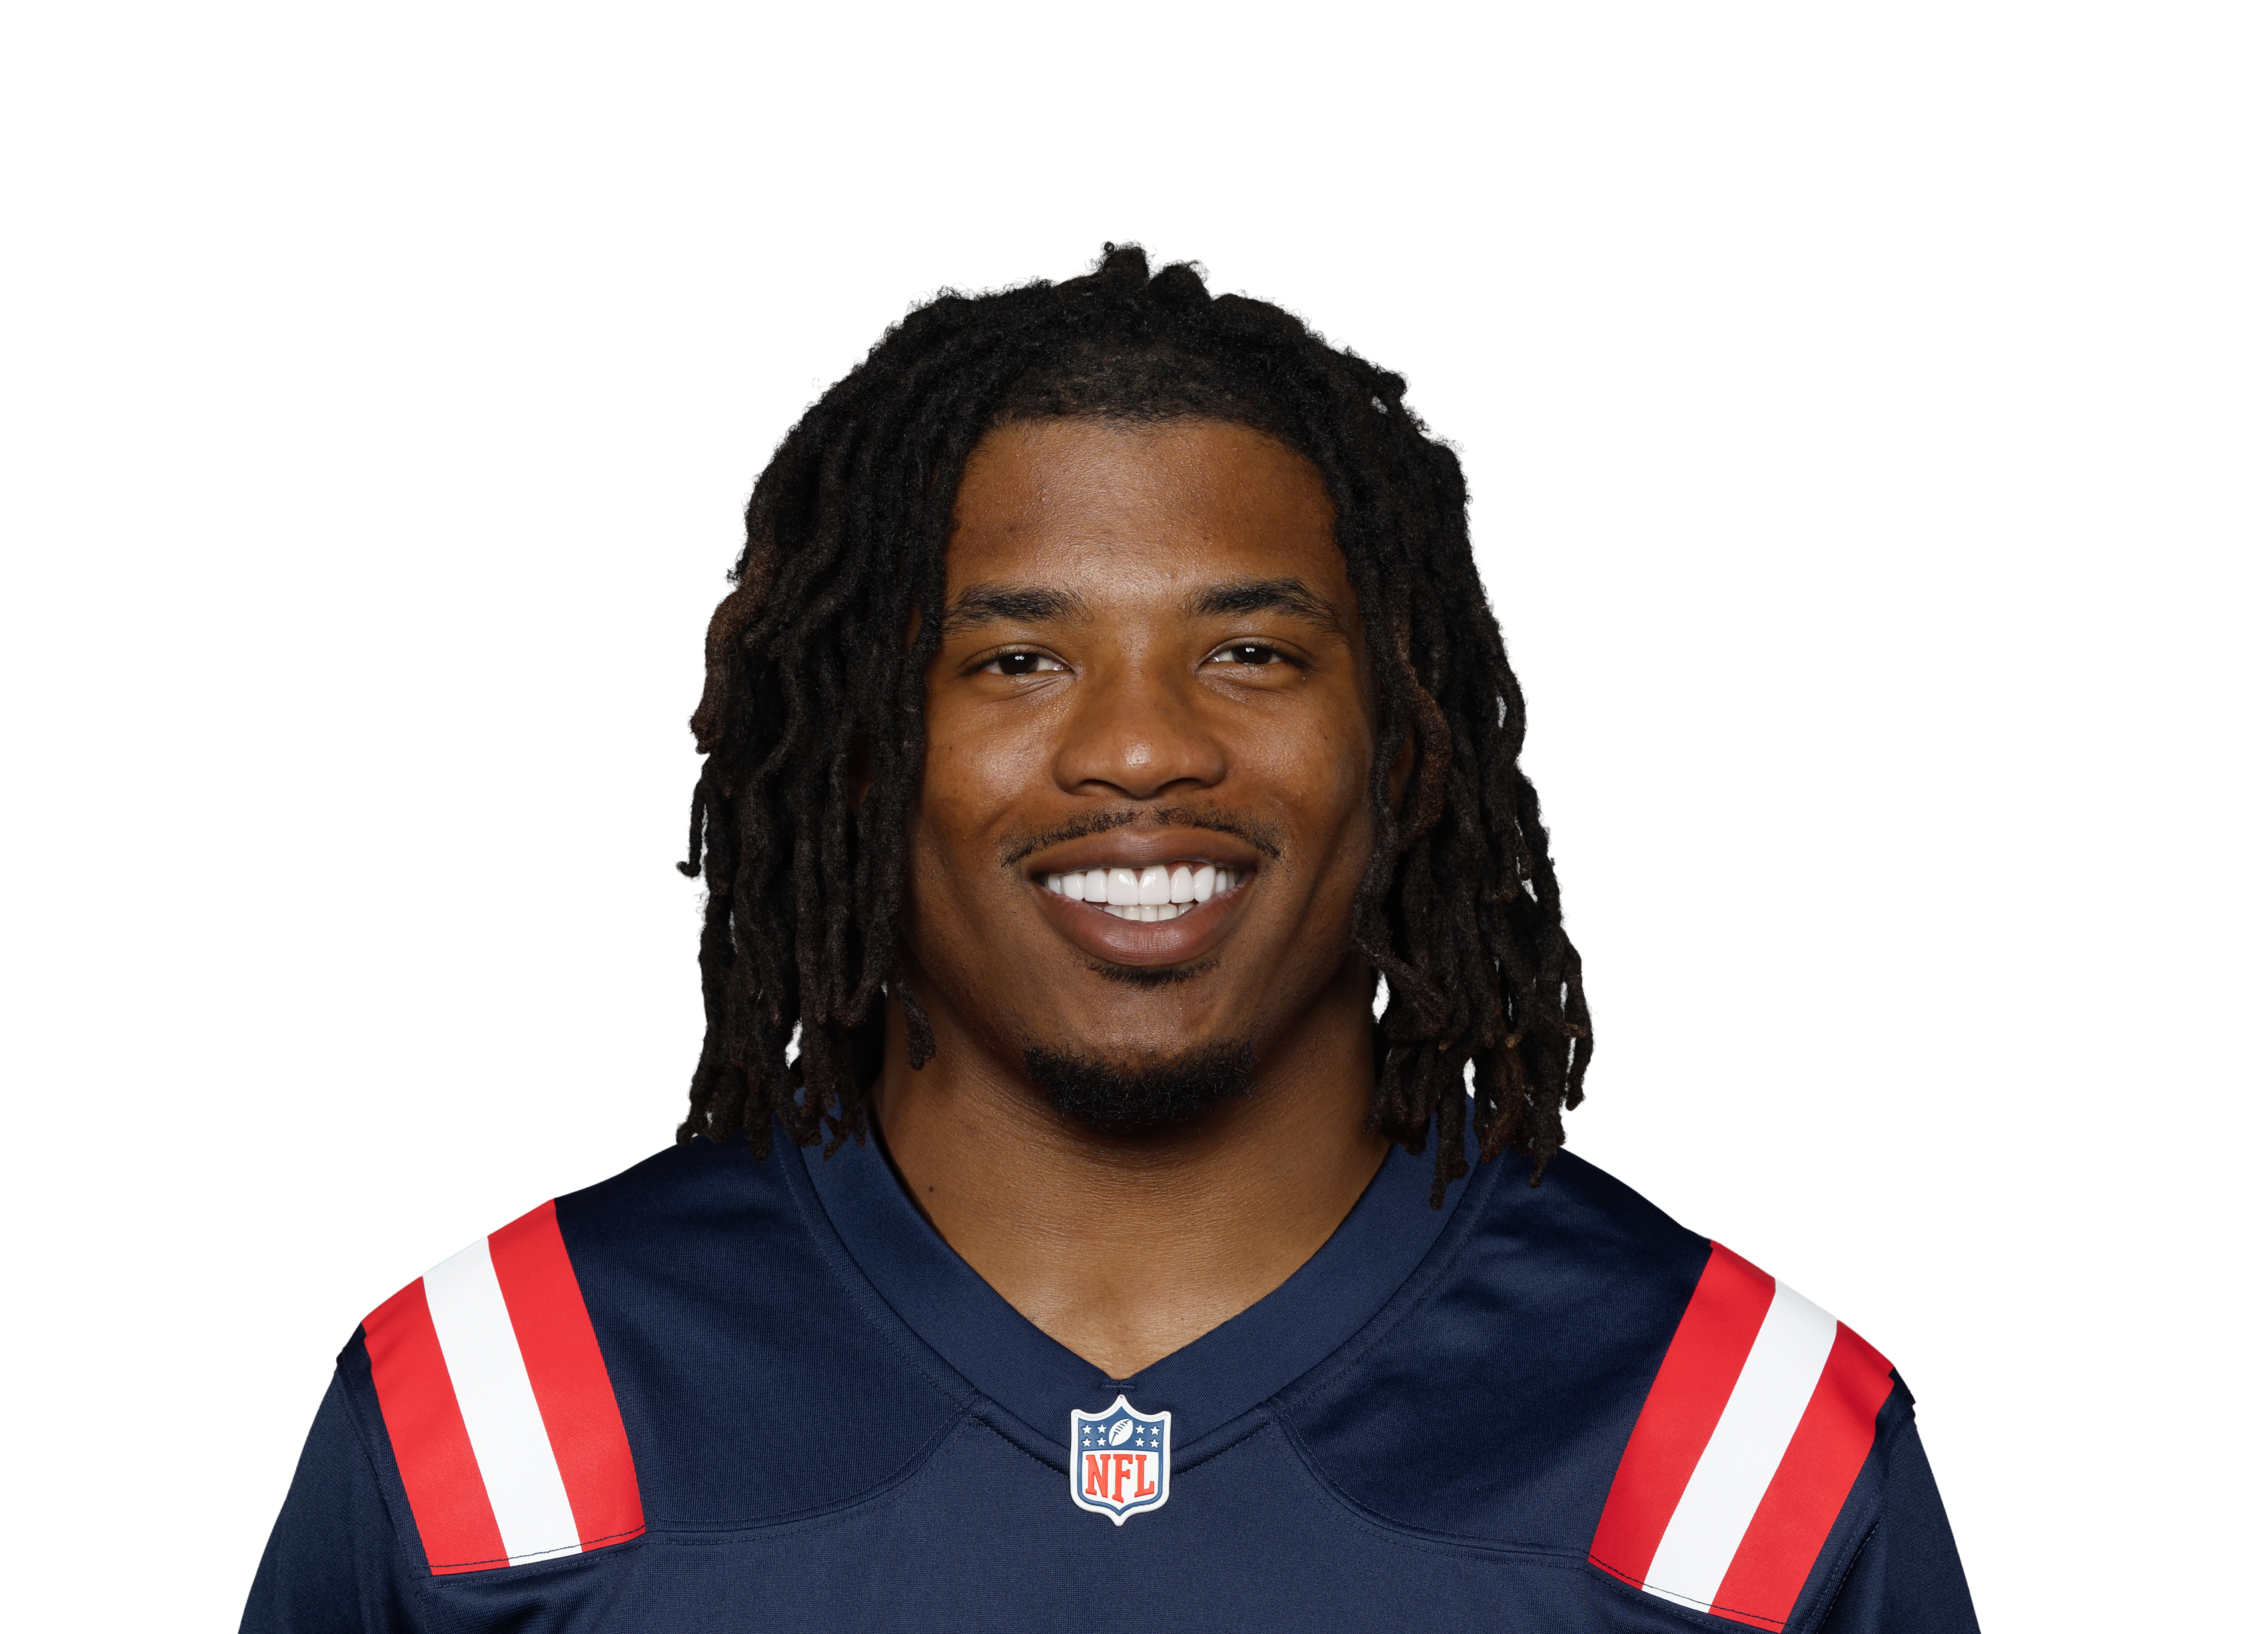
Fantasy points first, then the stats that matter for his position. Ring around each photo is that player's Mania Rating. Tap a name to open his profile.

Usage
Snaps
53%
Touch share
29%
Carries/G
13.0
PPR/G
10.4
By the numbers
PPR / Game
10.4
52nd percentileRB avg 10.9
Rushing Attempts / Game
13
60th percentileRB avg 11
Rush Yards / Game
56.8
68th percentileRB avg 45.2
Targets / Game
1.6
22nd percentileRB avg 2.9
Scrimmage Yards / Game
61.2
53rd percentileRB avg 61.1
Share of Team Touches
28.5%
60th percentileRB avg 23.9%
Red-Zone Carries / Game
2.4
66th percentileRB avg 2
Goal-Line Carries / Game
1.2
82nd percentileRB avg 0.6
Red-Zone Targets / Game
0
22nd percentileRB avg 0.4
End-Zone Targets / Game
0
81st percentileRB avg 0
Snap Share
53.1%
56th percentileRB avg 51.4%
TDs / Game
0.6
64th percentileRB avg 0.5
PHI RB room
S. Barkley29%
D. Pierce28%
E. Mitchell18%
T. Bigsby14%
W. Shipley10%
Share of touches
PHI RB room, week by week
Touches = carries + targets. Switch to look at just carries or just targets.
PlayerW1W2W3W4W5W6W7W8W9Per game
Dameon Pierce————1612 yds29% touches77% snaps1750 yds30% touches95% snaps1548 yds26% touches64% snaps——16.037 yds a game • 2.3 per touch28% touches79% snaps
Saquon Barkley1780 yds36% touches71% snaps620 yds9% touches16% snaps1780 yds39% touches72% snaps310 yds6% touches7% snaps——971 yds16% touches15% snaps1454 yds23% touches32% snaps1422 yds24% touches59% snaps11.448 yds a game • 4.2 per touch22% touches39% snaps
Elijah Mitchell——————734 yds12% touches21% snaps1737 yds28% touches57% snaps726 yds12% touches41% snaps10.332 yds a game • 3.1 per touch17% touches40% snaps
Tank Bigsby13 yds2% touches11% snaps1538 yds23% touches34% snaps15 yds2% touches4% snaps1555 yds29% touches48% snaps—————8.025 yds a game • 3.2 per touch14% touches24% snaps
Will Shipley312 yds6% touches18% snaps929 yds14% touches51% snaps211 yds5% touches26% snaps723 yds14% touches48% snaps713 yds13% touches21% snaps————5.618 yds a game • 3.1 per touch10% touches33% snaps
Jaydon Blue———————19 yds2% touches12% snaps00 yds0% touches0% snaps0.55 yds a game • 9.0 per touch1% touches6% snaps
Carson Steele————00 yds0% touches0% snaps24 yds4% touches5% snaps———1.02 yds a game • 2.0 per touch2% touches3% snaps
Each cell is the count that week with his yards on those touches plus his share of the team and his snap percentage. Click a name to open that player.
Game log
3W2
9W3
2W4
15.1W7
12.4W8
8.2W9
Games7
PPR/G10.4
Game log
9W13W29W32W415.1W712.4W88.2W9
Barkley avg 8.4NFL top 30 RBs avg 15.7
Solid dot is what he scored. Hollow dot is our projection before the game.
UseGameProjPPRTgtRecRec YdCarRush YdTDSnap
W1vs WAS 15.6921-31583071%
W2vs TEN HURT, LEFT OUT14.23211149016%
W3vs CHI 14.4921-21582072%
W4vs LA HURT, LEFT OUT14.521122807%
W7vs DAL 13.515.1229762115%
W8vs WAS 12.712.411241330132%
W9vs NYG 12.58.21001322159%
Opponent color:Easy defense for RBsAverageTough
Schedule ahead
11 PIT12 DAL13 ARI14 IND15 SEA16 HOU17 SF18 NYG
Green easier, red tougher
Schedule ahead
Colored by what each defense has given up to RBs so far. Green is an easier matchup, red is a tougher one.
Wk 11 PITWk 12 DALWk 13 ARIWk 14 INDWk 15 SEAWk 16 HOUWk 17 SFWk 18 NYG
See every team's RB schedule ›
StatPer gameSeasonRank
Overall
Games—555›
PPR points10.453.752›
Touchdowns0.55363›
Receiving
Targets1.6822›
Catches0.9515›
Receiving yards4.32810›
Yards per target2.7—11›
Yards per catch4.4—77›
Rushing
Carries136360›
Rush yards56.927970›
Rush TDs—382›
Scrimmage yards61.230756›
Usage
Snap %53%—58›
Target share %6%—27›
Touch share %28.5%—60›
Carry share %46.9%—68›
Air yards share %0.7%1481›
Scoring chances
Red-zone carries2.4—66›
Goal-line carries1.2—82›
Tap any stat to see everyone ranked. Bars: green top 30%, yellow middle, red bottom 40%.
Advanced stats

Ranked against 41 backs with at least 60 carries. He is still a small sample (69 carries), so his ranks lean toward average. Ranks account for how much work each number is based on, so a perfect record on a few plays does not beat one over a full workload. Tap a stat to see the full ranking.

71.8
Mania Rating
Overall profile • Starter
79.5
Week 11 Rating
Start value vs PIT

Saquon Barkley

PHI • RB • 7 games
#135 OverallRB33#2 RB on PHIDepth RB1 ›Age 29
Week 11 projection 10.9 PPR ›
RB22 this week
Games counted
A game where he got hurt and missed most of it is already left out (tick it to bring it back). Untick or tick any game and Mania Rating, matchup and Week 11 Rating all recalculate. Official Mania Rating 71.8.
Mix and match games

Pick a teammate with or without. Pick more than one to combine them, like a game without the QB and without the other back.

Milton QB ✓ current
Hurts QB
McKee QB
Wicks WR
Goedert TE
Smith WR
Teammate injuries shift his Week 11 Rating2 teammate notes ▾
Dontayvion Wicks (WR, Out) -1.5 • without him that work was worth 8.9 pts vs 12.3 with (3 games)
Will Shipley (RB, Injured reserve) +0.8 • without him that work was worth 9.4 pts vs 12.3 with (4 games)
Injury report updated Sat Nov 21, 6:30 AM ET
Week 11 Rating = recent role + opponent + the latest injury report (updated Sat Nov 21, 6:30 AM ET). Check final inactives before you set your lineup.
Week 11 projection
10.9
projected points
Floor 3.1 · Ceiling 20.4
-2.2Game script
0.0Matchup
+0.1Injuries
Week 11 projection
PHI
VSPPR
PIT
Average matchup • PIT is #13 in points allowed to RBs
10.9
projected pointsRushing 14.5 carries, 59 yds • Receiving 2.2 targets, 1.5 catches, 9 yds • 0.43 TD
Floor 3.14 of 5 games land hereCeiling 20.4
Vegas lines included. From usage alone: 10.2. Sportsbook lines imply 11.4. Blended: 10.9. Biggest gaps: touchdowns 0.51 on the sportsbooks vs 0.33 from usage.
-2.2Game script
0.0Matchup
+0.1Injuries
How this is built
Recent and last-season usage, the Vegas spread and total, how this defense treats his position, and the injury report (teammates out, QB out). The three boxes show how many points each moved it. When sportsbook player lines are posted (Wednesday to Sunday) they are blended in, leaning on them most for new starters and players with few games. PPR scoring only. Tested on past seasons it is about 5% closer than a plain season average.
PHI RB room
S. Barkley29%
D. Pierce28%
E. Mitchell18%
T. Bigsby14%
W. Shipley10%
Share of touches
PHI RB room, week by week
Touches = carries + targets. Switch to look at just carries or just targets.
PlayerW1W2W3W4W5W6W7W8W9Per game
Dameon Pierce————1612 yds29% touches77% snaps1750 yds30% touches95% snaps1548 yds26% touches64% snaps——16.037 yds a game • 2.3 per touch28% touches79% snaps
Saquon Barkley1780 yds36% touches71% snaps620 yds9% touches16% snaps1780 yds39% touches72% snaps310 yds6% touches7% snaps——971 yds16% touches15% snaps1454 yds23% touches32% snaps1422 yds24% touches59% snaps11.448 yds a game • 4.2 per touch22% touches39% snaps
Elijah Mitchell——————734 yds12% touches21% snaps1737 yds28% touches57% snaps726 yds12% touches41% snaps10.332 yds a game • 3.1 per touch17% touches40% snaps
Tank Bigsby13 yds2% touches11% snaps1538 yds23% touches34% snaps15 yds2% touches4% snaps1555 yds29% touches48% snaps—————8.025 yds a game • 3.2 per touch14% touches24% snaps
Will Shipley312 yds6% touches18% snaps929 yds14% touches51% snaps211 yds5% touches26% snaps723 yds14% touches48% snaps713 yds13% touches21% snaps————5.618 yds a game • 3.1 per touch10% touches33% snaps
Jaydon Blue———————19 yds2% touches12% snaps00 yds0% touches0% snaps0.55 yds a game • 9.0 per touch1% touches6% snaps
Carson Steele————00 yds0% touches0% snaps24 yds4% touches5% snaps———1.02 yds a game • 2.0 per touch2% touches3% snaps
Each cell is the count that week with his yards on those touches plus his share of the team and his snap percentage. Click a name to open that player.
Game log
3W2
9W3
2W4
15.1W7
12.4W8
8.2W9
Games7
PPR/G10.4
Game log
9W13W29W32W415.1W712.4W88.2W9
Barkley avg 8.4NFL top 30 RBs avg 15.7
Solid dot is what he scored. Hollow dot is our projection before the game.
UseGameProjPPRTgtRecRec YdCarRush YdTDSnap
W1vs WAS 15.6921-31583071%
W2vs TEN HURT, LEFT OUT14.23211149016%
W3vs CHI 14.4921-21582072%
W4vs LA HURT, LEFT OUT14.521122807%
W7vs DAL 13.515.1229762115%
W8vs WAS 12.712.411241330132%
W9vs NYG 12.58.21001322159%
Opponent color:Easy defense for RBsAverageTough
Schedule ahead
11 PIT12 DAL13 ARI14 IND15 SEA16 HOU17 SF18 NYG
Green easier, red tougher
Schedule ahead
Colored by what each defense has given up to RBs so far. Green is an easier matchup, red is a tougher one.
Wk 11 PITWk 12 DALWk 13 ARIWk 14 INDWk 15 SEAWk 16 HOUWk 17 SFWk 18 NYG
See every team's RB schedule ›
StatPer gameSeasonRank
Overall
Games—555›
PPR points10.453.752›
Touchdowns0.55363›
Receiving
Targets1.6822›
Catches0.9515›
Receiving yards4.32810›
Yards per target2.7—11›
Yards per catch4.4—77›
Rushing
Carries136360›
Rush yards56.927970›
Rush TDs—382›
Scrimmage yards61.230756›
Usage
Snap %53%—58›
Target share %6%—27›
Touch share %28.5%—60›
Carry share %46.9%—68›
Air yards share %0.7%1481›
Scoring chances
Red-zone carries2.4—66›
Goal-line carries1.2—82›
Tap any stat to see everyone ranked. Bars: green top 30%, yellow middle, red bottom 40%.
Advanced stats

Ranked against 41 backs with at least 60 carries. He is still a small sample (69 carries), so his ranks lean toward average. Ranks account for how much work each number is based on, so a perfect record on a few plays does not beat one over a full workload. Tap a stat to see the full ranking.

Mania breakdown
Fantasy Production55
Touch Volume32
Backfield Control58
Goal-Line / Red-Zone66
Per-Touch Efficiency49
Mania breakdown
Percentile among RBs. 100 is the best, 50 is average.
55
How many fantasy points and total yards he is actually producing, compared with players at his position. Ranks better than 55% of RBs.
32
How many carries and targets he gets per game compared with other running backs. Ranks better than 32% of RBs.
58
How much of his team backfield he owns: share of touches plus snap share. Ranks better than 58% of RBs.
66
Scoring-position work: red-zone carries, goal-line carries (inside the 5) and red-zone targets. Ranks better than 66% of RBs.
49
What he produces with each touch instead of just rewarding volume: fantasy points per touch, yards per carry and catch rate. Ranks better than 49% of RBs.
Top 30%MiddleBottom 40%Tap a category to see what it means.
Week 11 matchup
vs PIT
Neutral matchup
Adjustment+0.4 pts
Allows to RBs14th most
Week11
Week 11 matchup
vs PIT
-2.3Rating boost
Tough matchup13th easiest of 32 defenses for RBs
ToughEasy
22.1PPR a game PIT allows to RBs
9.3Similar players, usual PPR a game
9.2Same players against PIT
Players with a role like his scored 9.2 PPR a game against PIT, versus 9.3 in their usual games (-2%). That moves his Week 11 Rating by -2.3.
How running backs did against PIT

22.8 PPR points a game allowed to running backs, 13th most of 32 defenses.

PlayerPPRRushRush YdRush TDRecRec Yd
Bijan Robinsonvs ATL • Wk 131.321830890
Chase Brown@ CIN • Wk 1028.310440839
Quinshon Judkins@ CLE • Wk 421.617531643
Samaje Perine@ CIN • Wk 1013.96141425
TreVeyon Henderson@ NE • Wk 213.61676100
Alvin Kamara@ NO • Wk 713.2650757
Dylan Sampsonvs CLE • Wk 812.9170662
Jonathan Taylorvs IND • Wk 511.215450337
Chase Brownvs CIN • Wk 38.91361028
Jaleel McLaughlin@ CLE • Wk 48.8128100
Bucky Irving@ TB • Wk 66.91946023
Quinshon Judkinsvs CLE • Wk 86.911250224
Kendre Miller@ NO • Wk 75.8860322
Rhamondre Stevenson@ NE • Wk 23.6643013
Raheim Sanders@ CLE • Wk 43.629027
Kenny Gainwell@ TB • Wk 63.4217017
Brian Robinsonvs ATL • Wk 13.1931000
Seth McGowanvs IND • Wk 52.9516013
Samaje Perinevs CIN • Wk 32.439015
Reggie Gilliam@ NE • Wk 21.400014
Tahj Brooks@ CIN • Wk 101.2312000
Corey Kiner@ NE • Wk 20.020000

Fantasy points first, then the stats that matter for his position. Ring around each photo is that player's Mania Rating. Tap a name to open his profile.

Usage
Snaps
53%
Touch share
29%
Carries/G
13.0
PPR/G
10.4
By the numbers
PPR / Game
10.4
52nd percentileRB avg 10.9
Rushing Attempts / Game
13
60th percentileRB avg 11
Rush Yards / Game
56.8
68th percentileRB avg 45.2
Targets / Game
1.6
22nd percentileRB avg 2.9
Scrimmage Yards / Game
61.2
53rd percentileRB avg 61.1
Share of Team Touches
28.5%
60th percentileRB avg 23.9%
Red-Zone Carries / Game
2.4
66th percentileRB avg 2
Goal-Line Carries / Game
1.2
82nd percentileRB avg 0.6
Red-Zone Targets / Game
0
22nd percentileRB avg 0.4
End-Zone Targets / Game
0
81st percentileRB avg 0
Snap Share
53.1%
56th percentileRB avg 51.4%
TDs / Game
0.6
64th percentileRB avg 0.5

More on Saquon Barkley

Start/sit this week

More RBs

Rankings

Tools

Mania Ratings and projections through Week 10 of the 2026 season, updated during the week. Tap anything above to open the full interactive profile in Fantasy Mania.