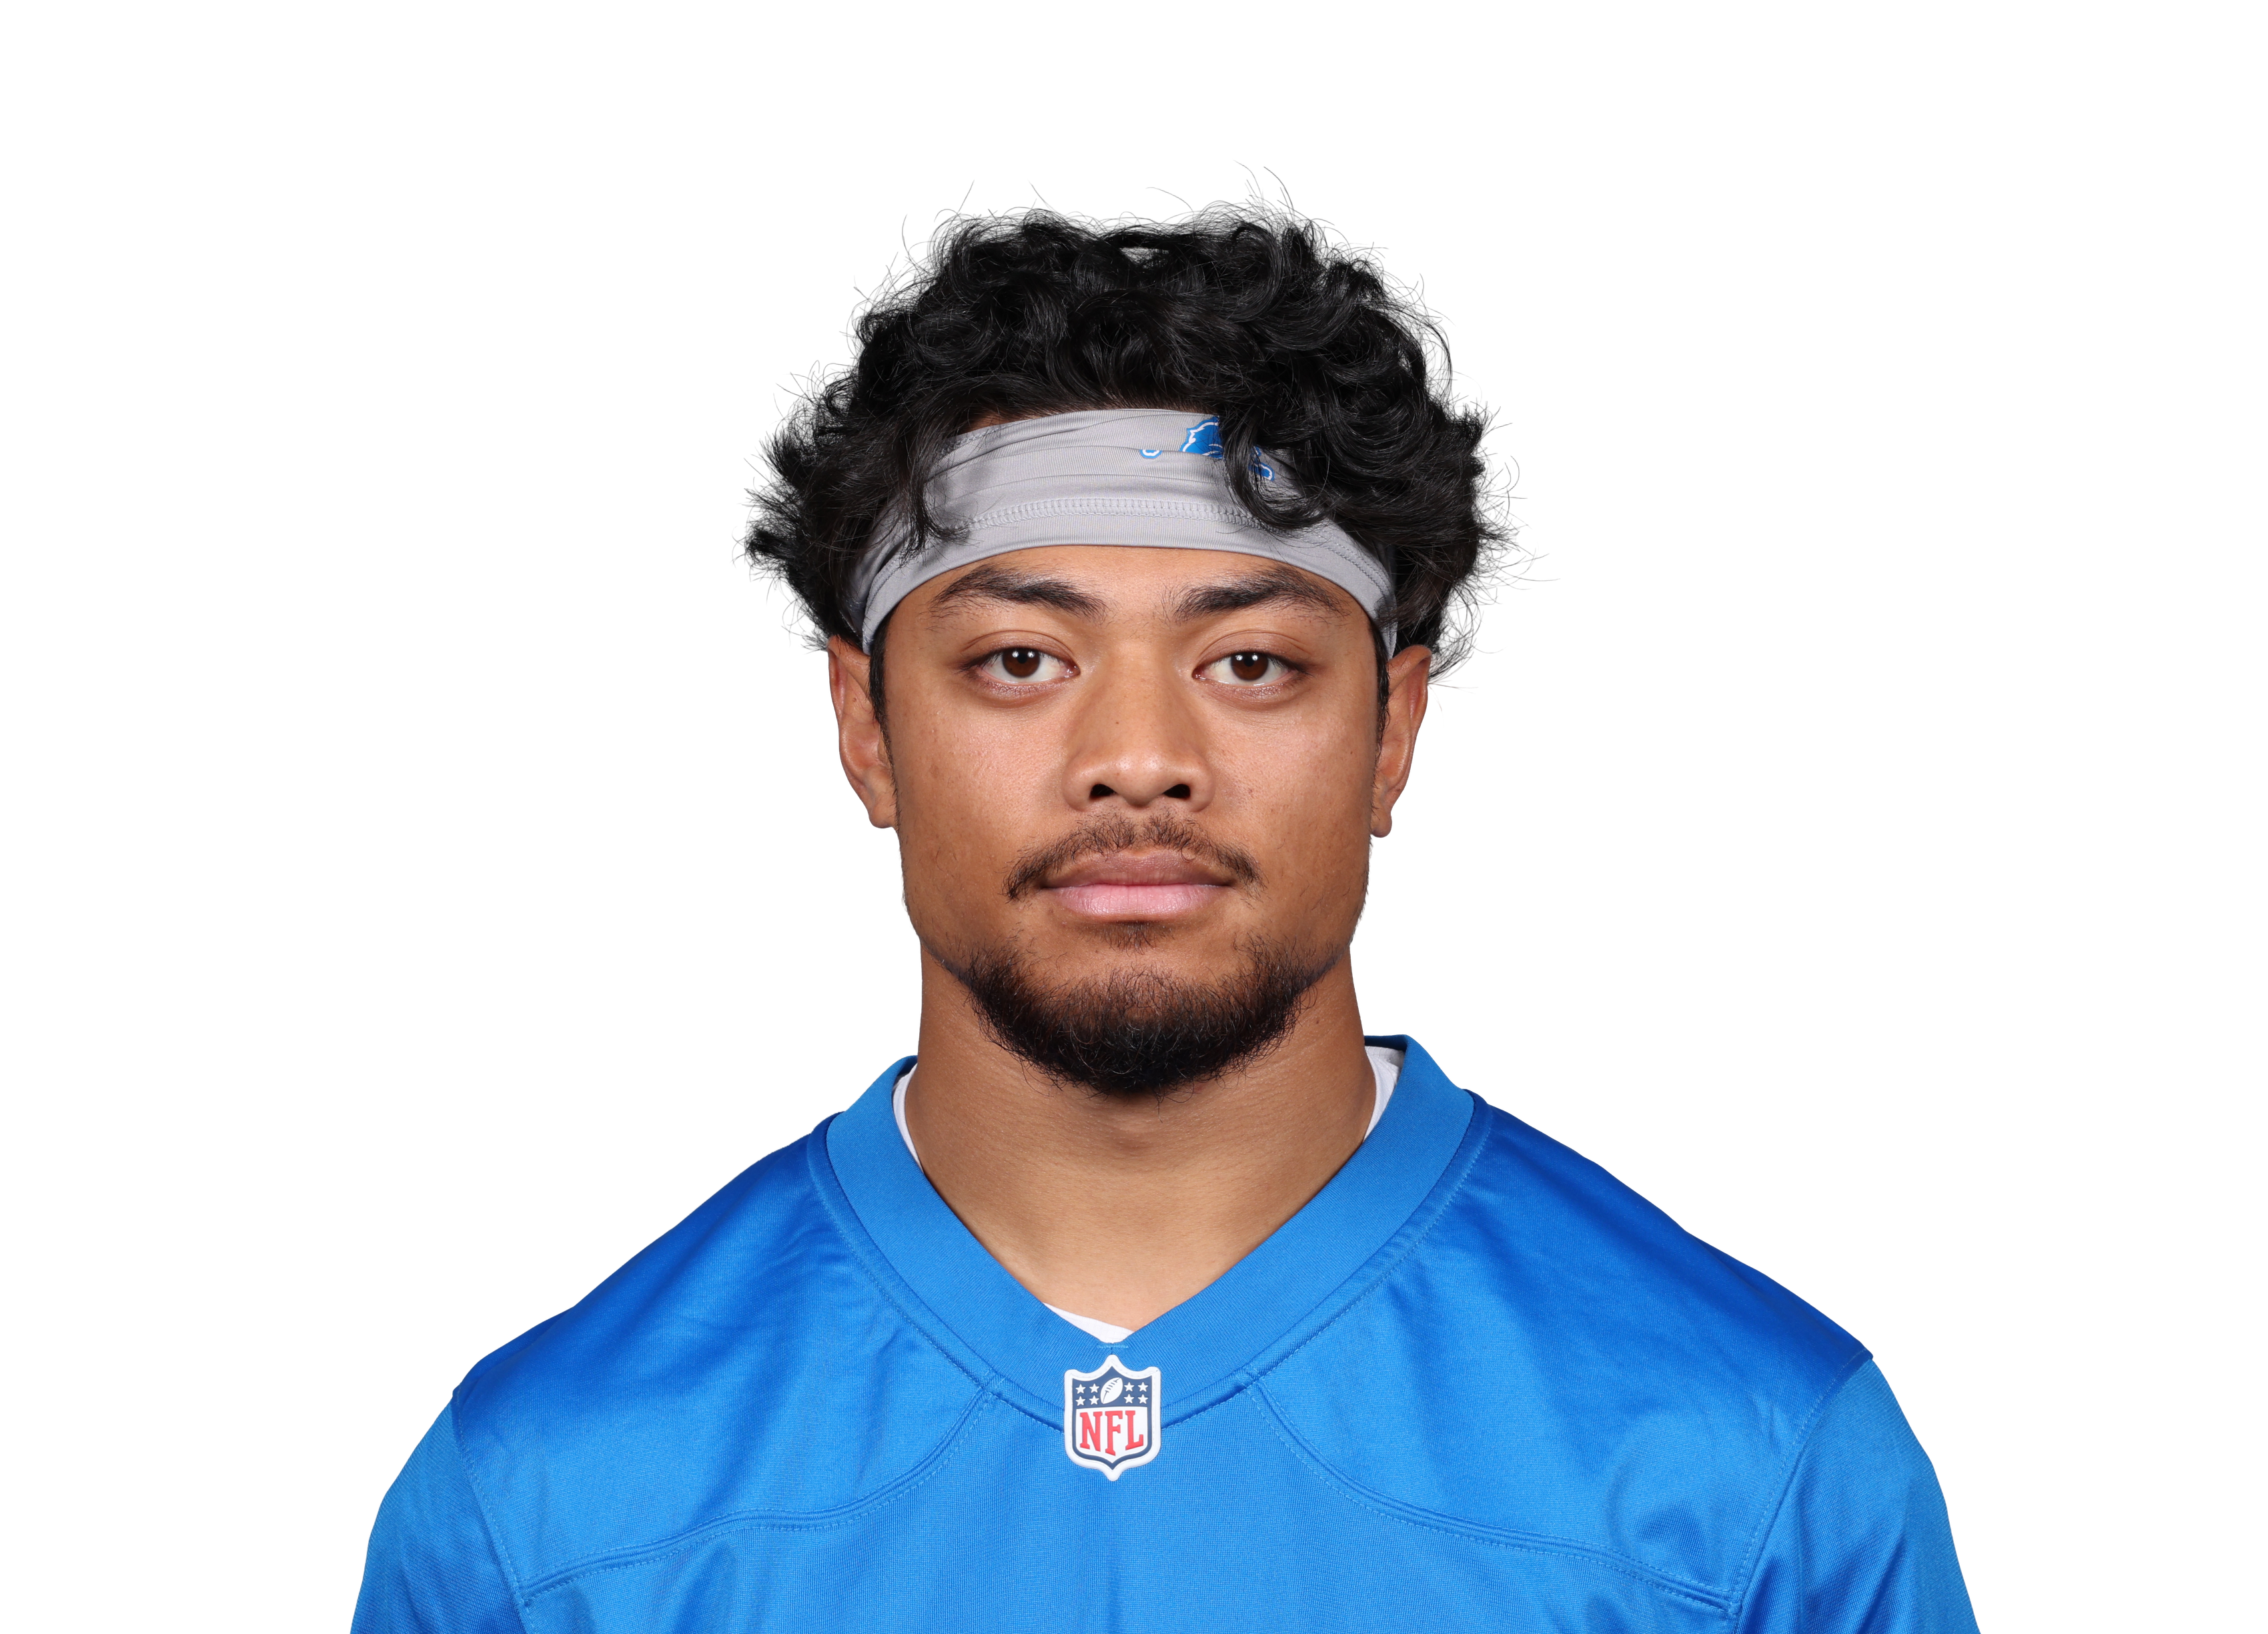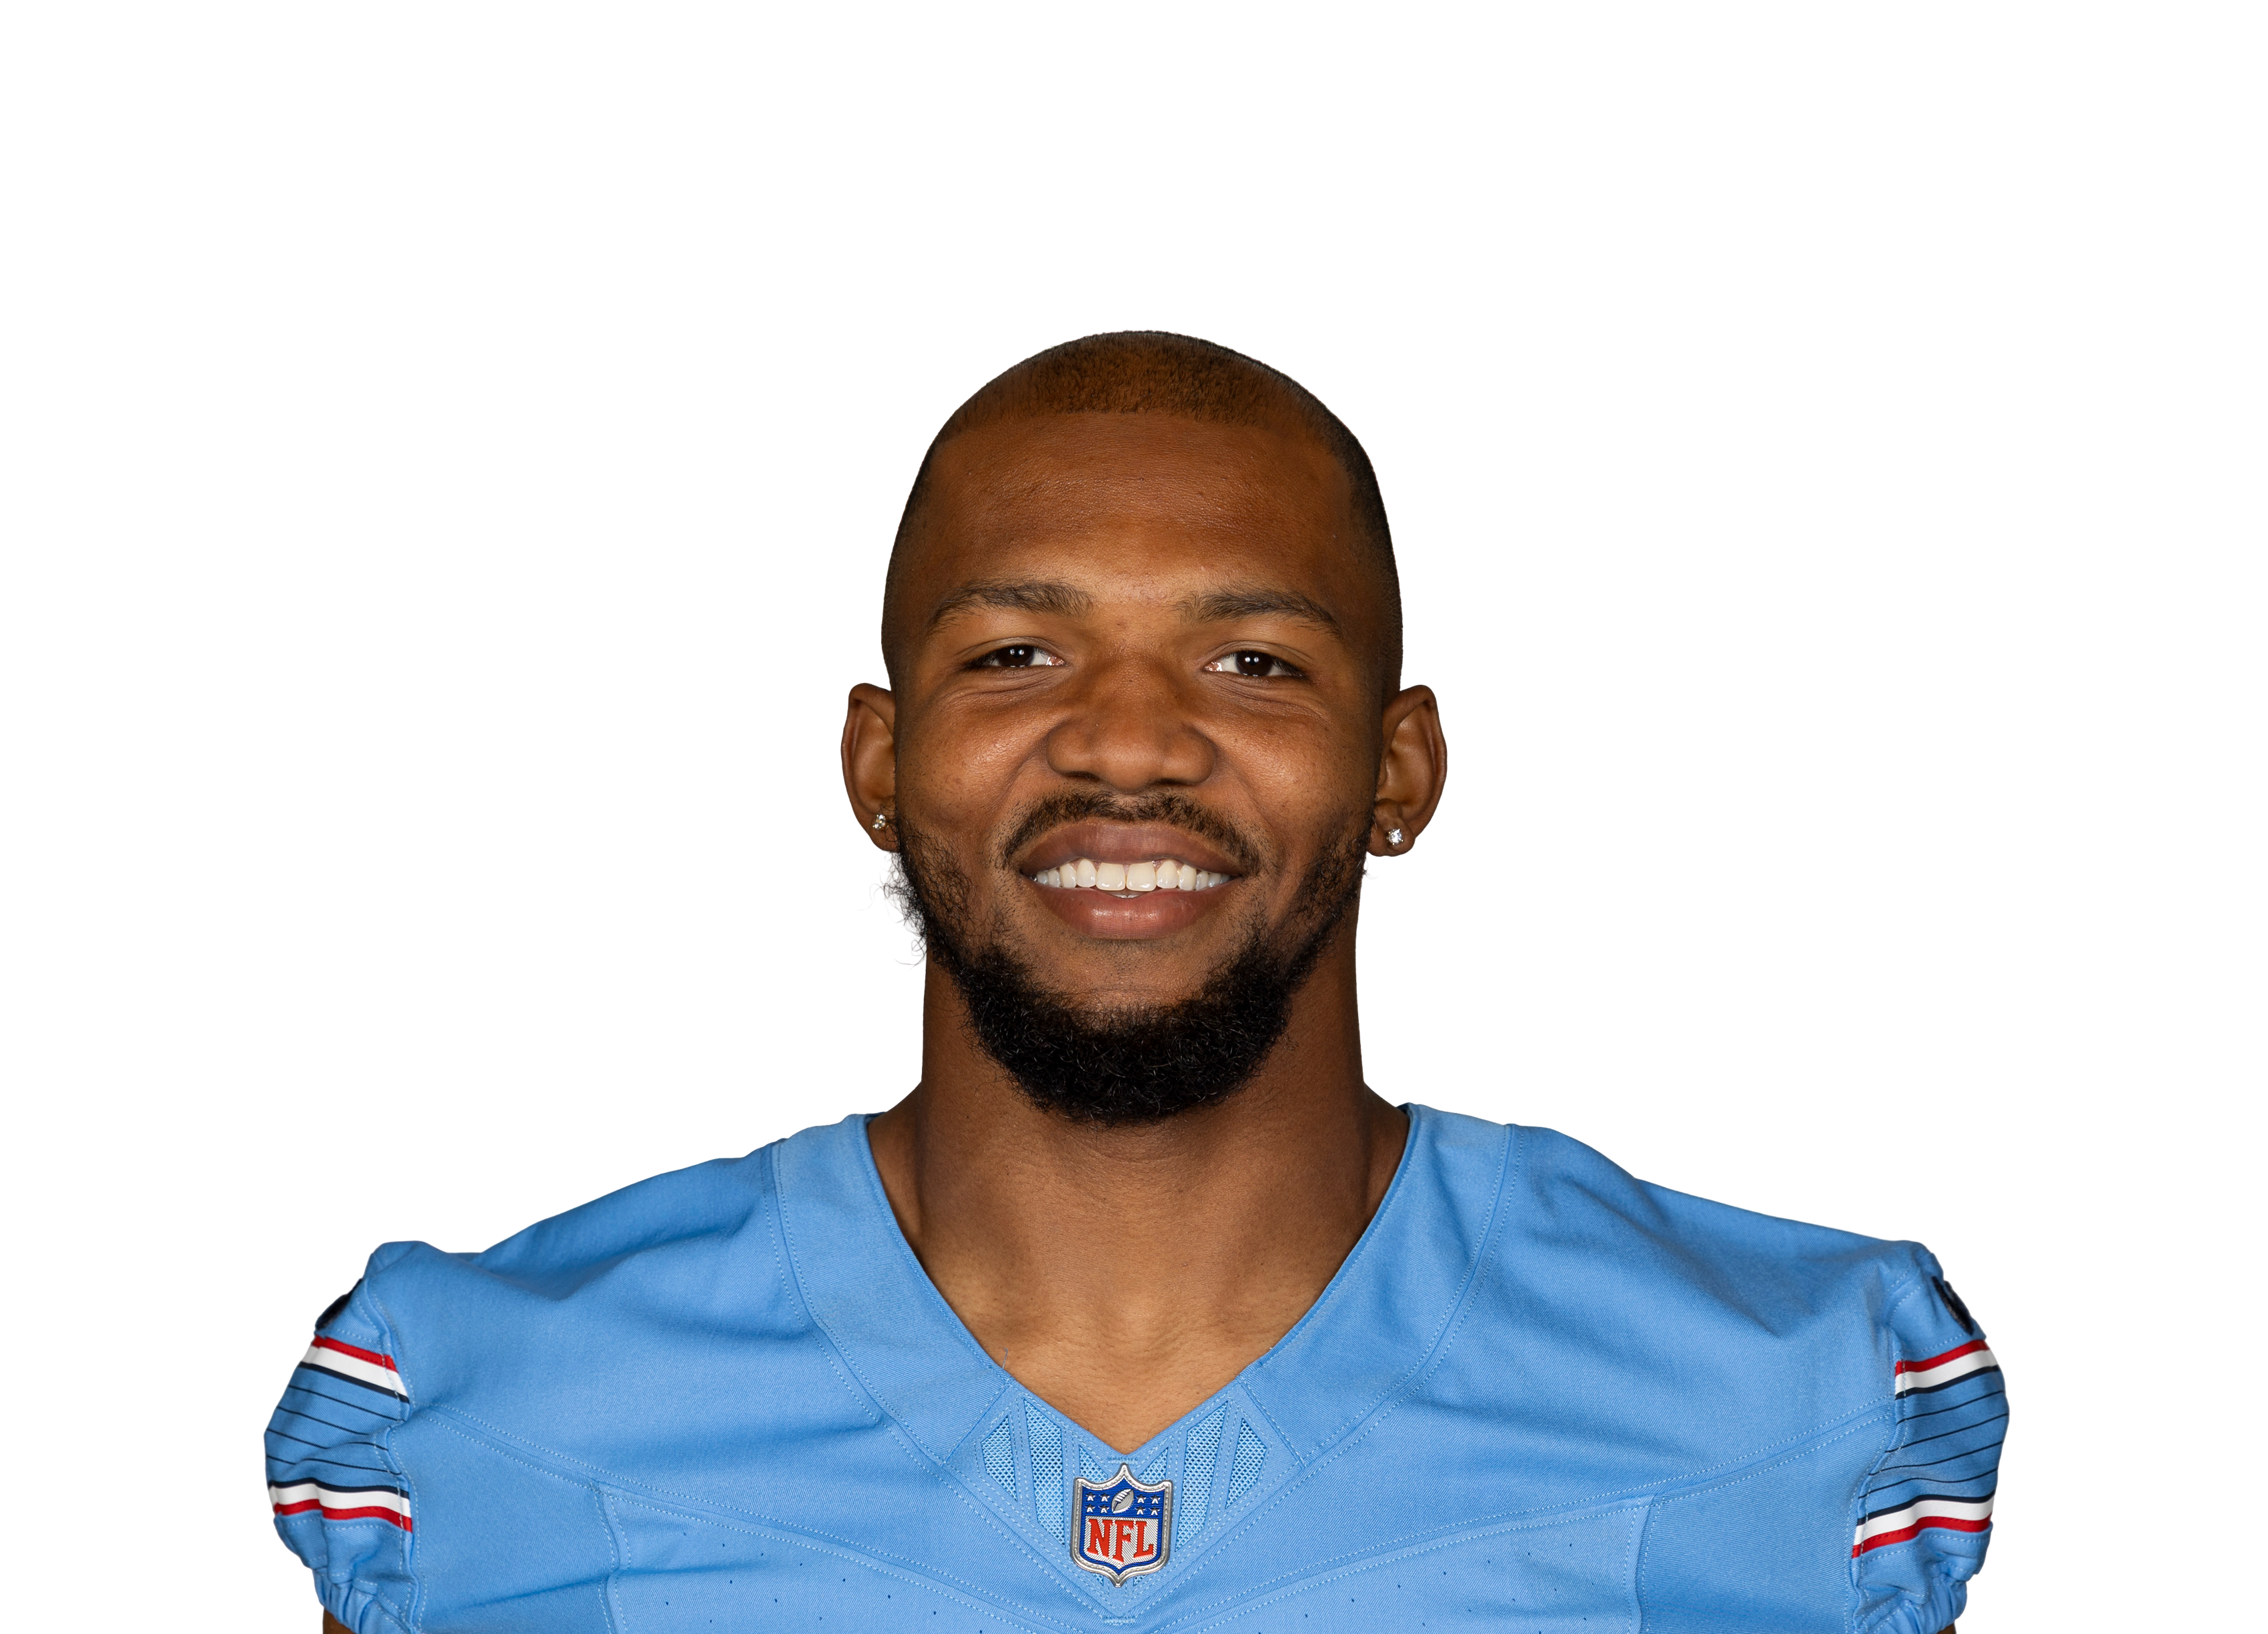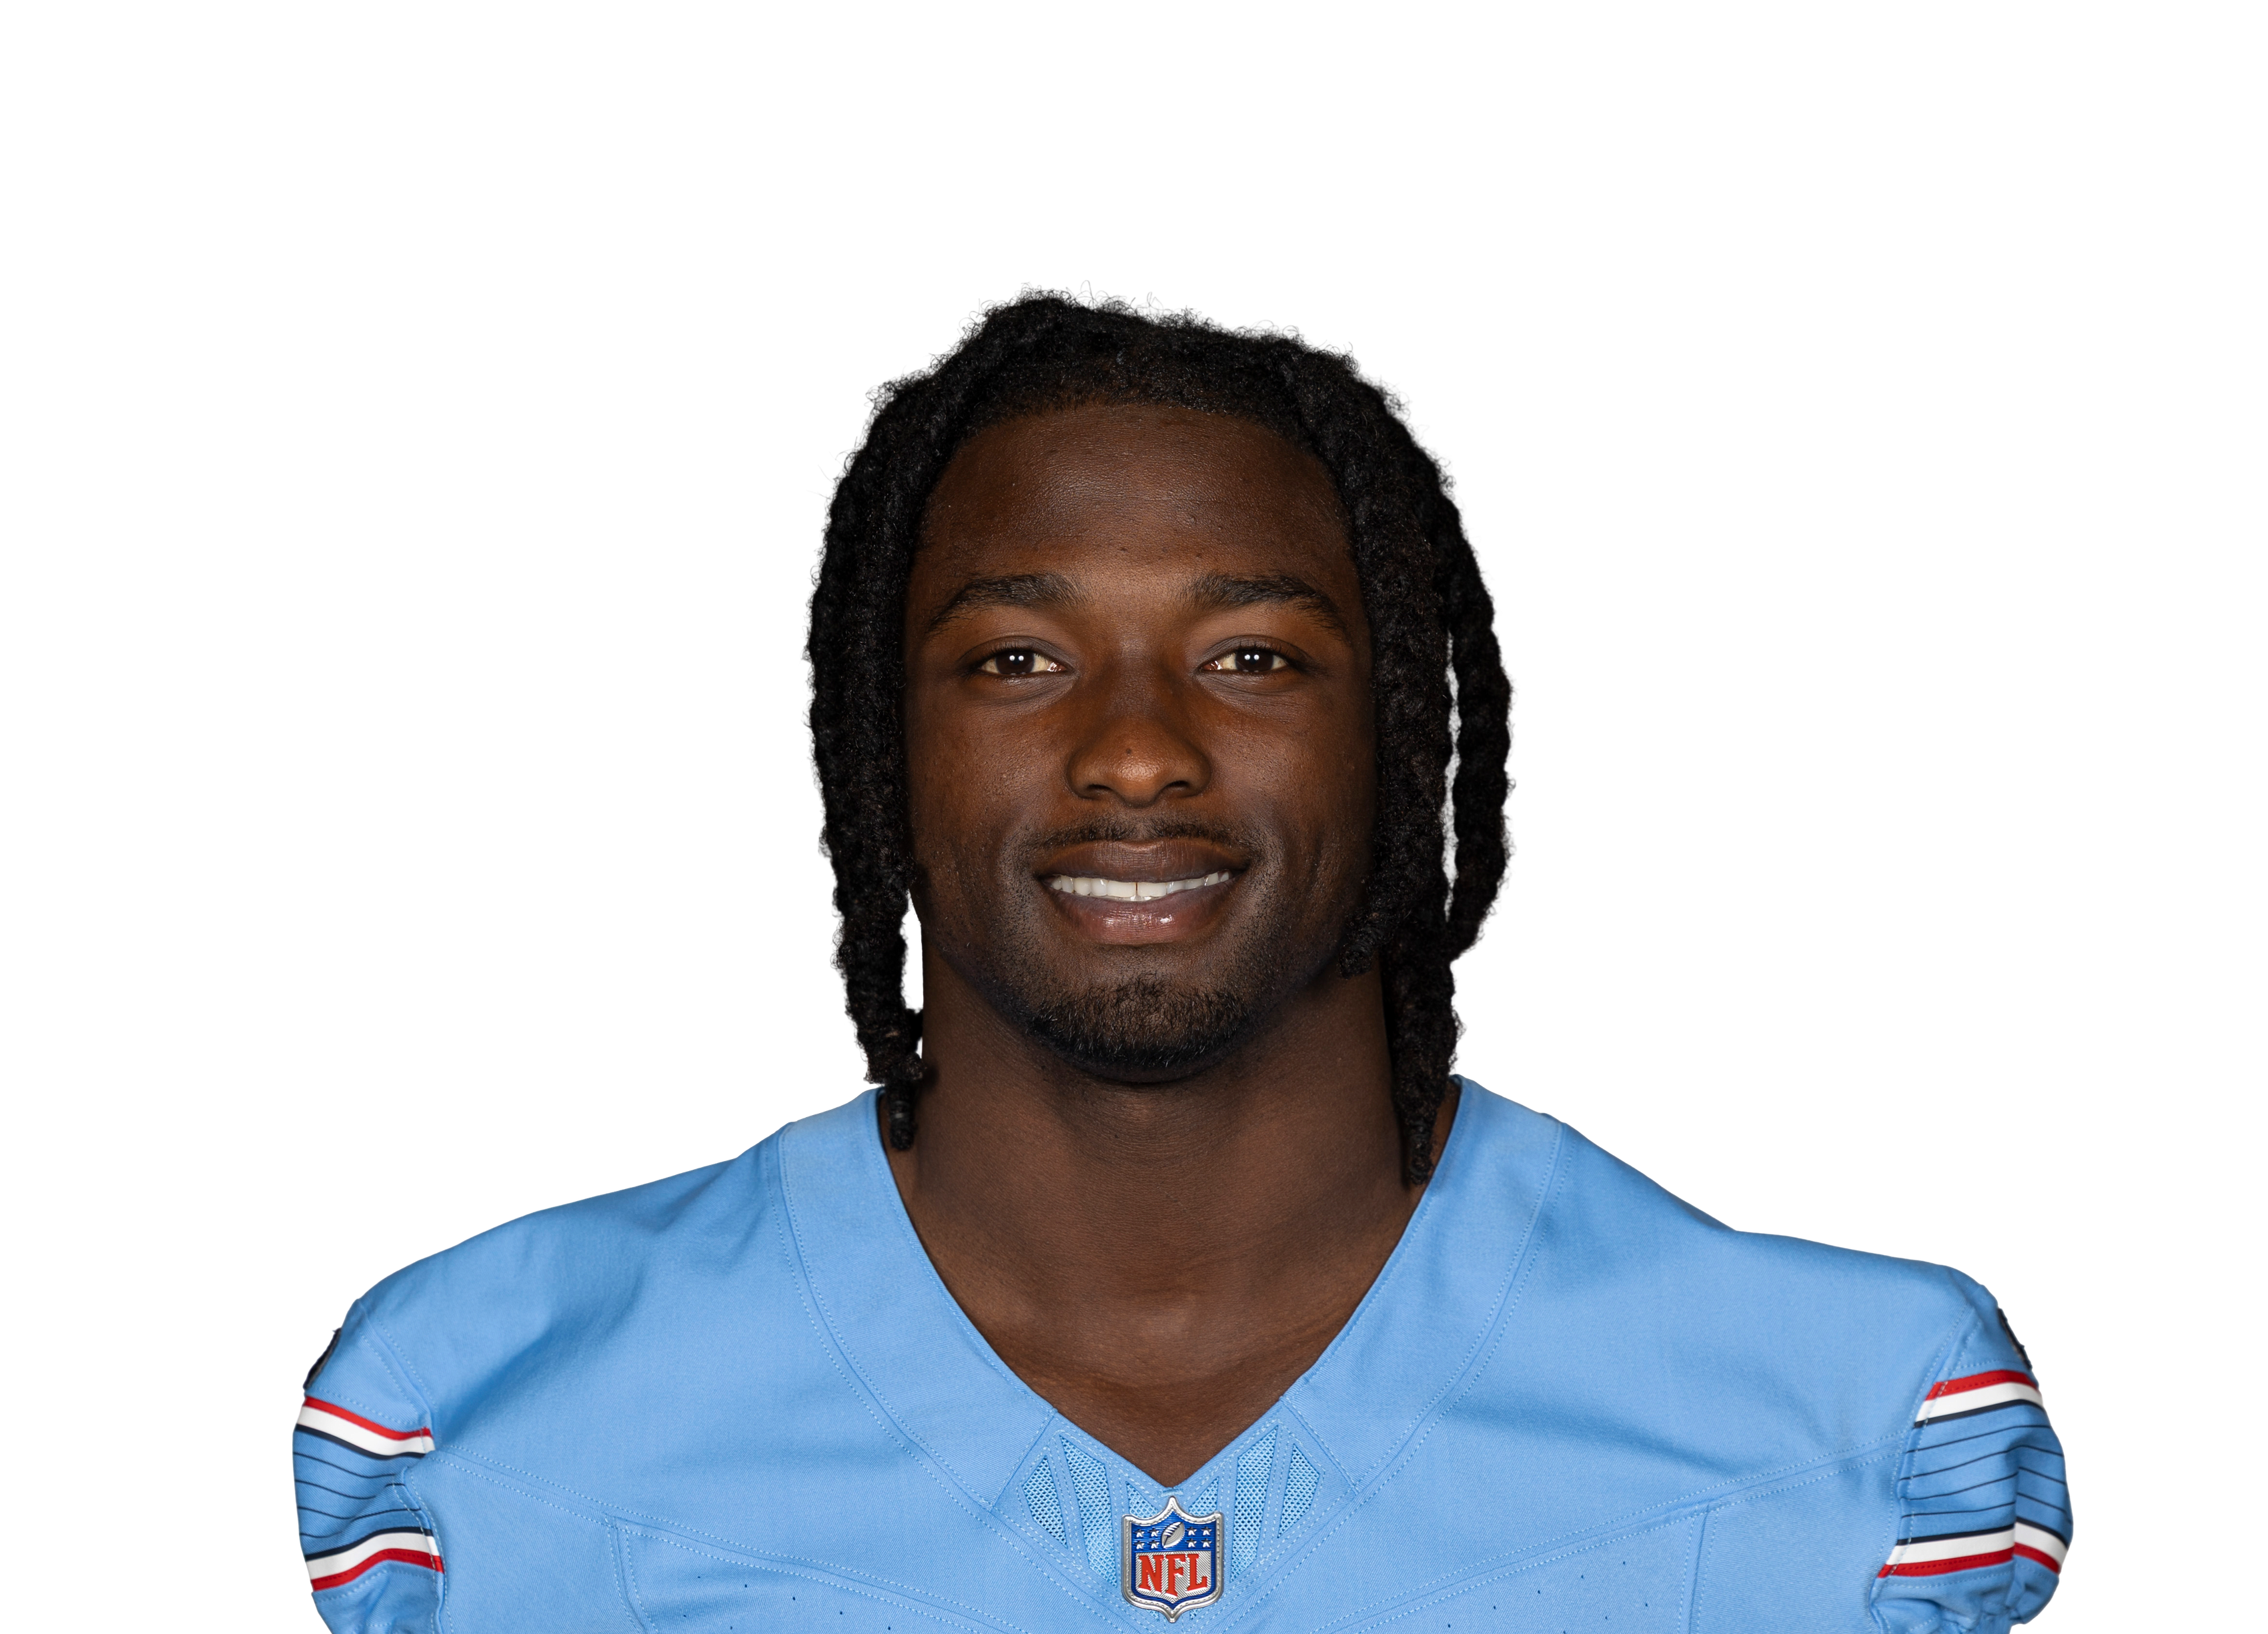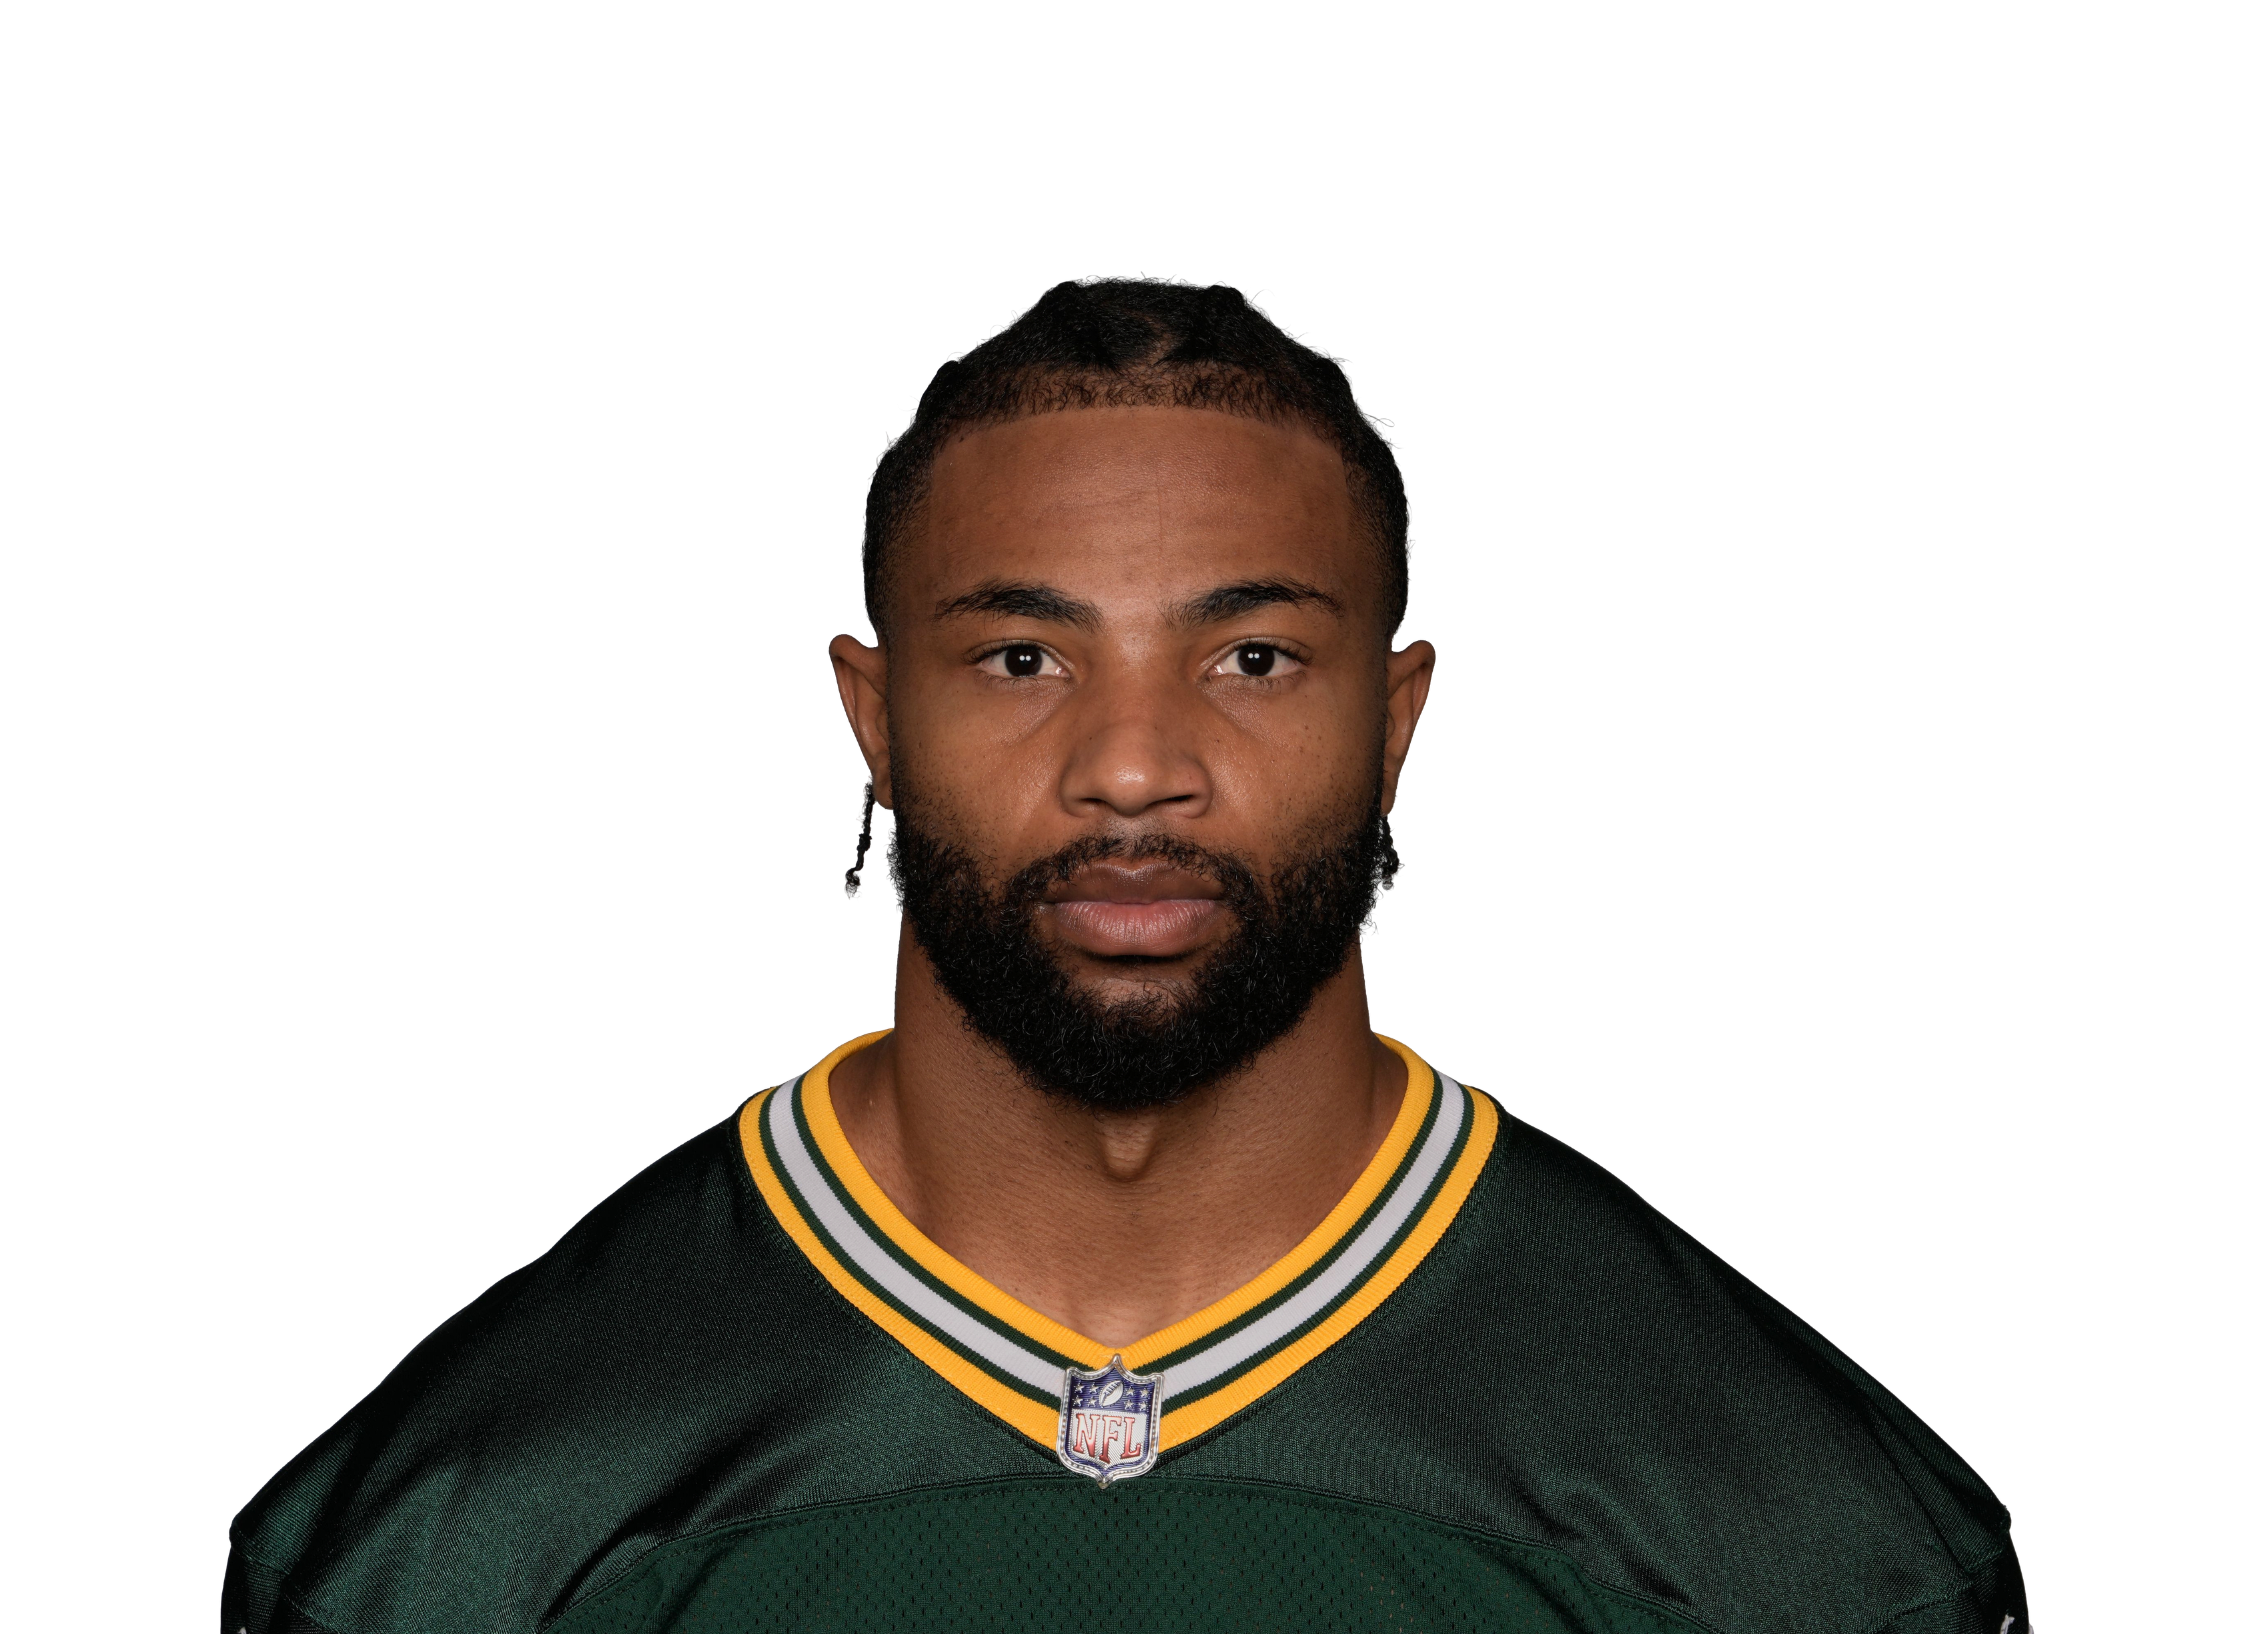
LAC
57.5MANIA RATINGOverall profile · Depth
MANIA RATING • DEPTH

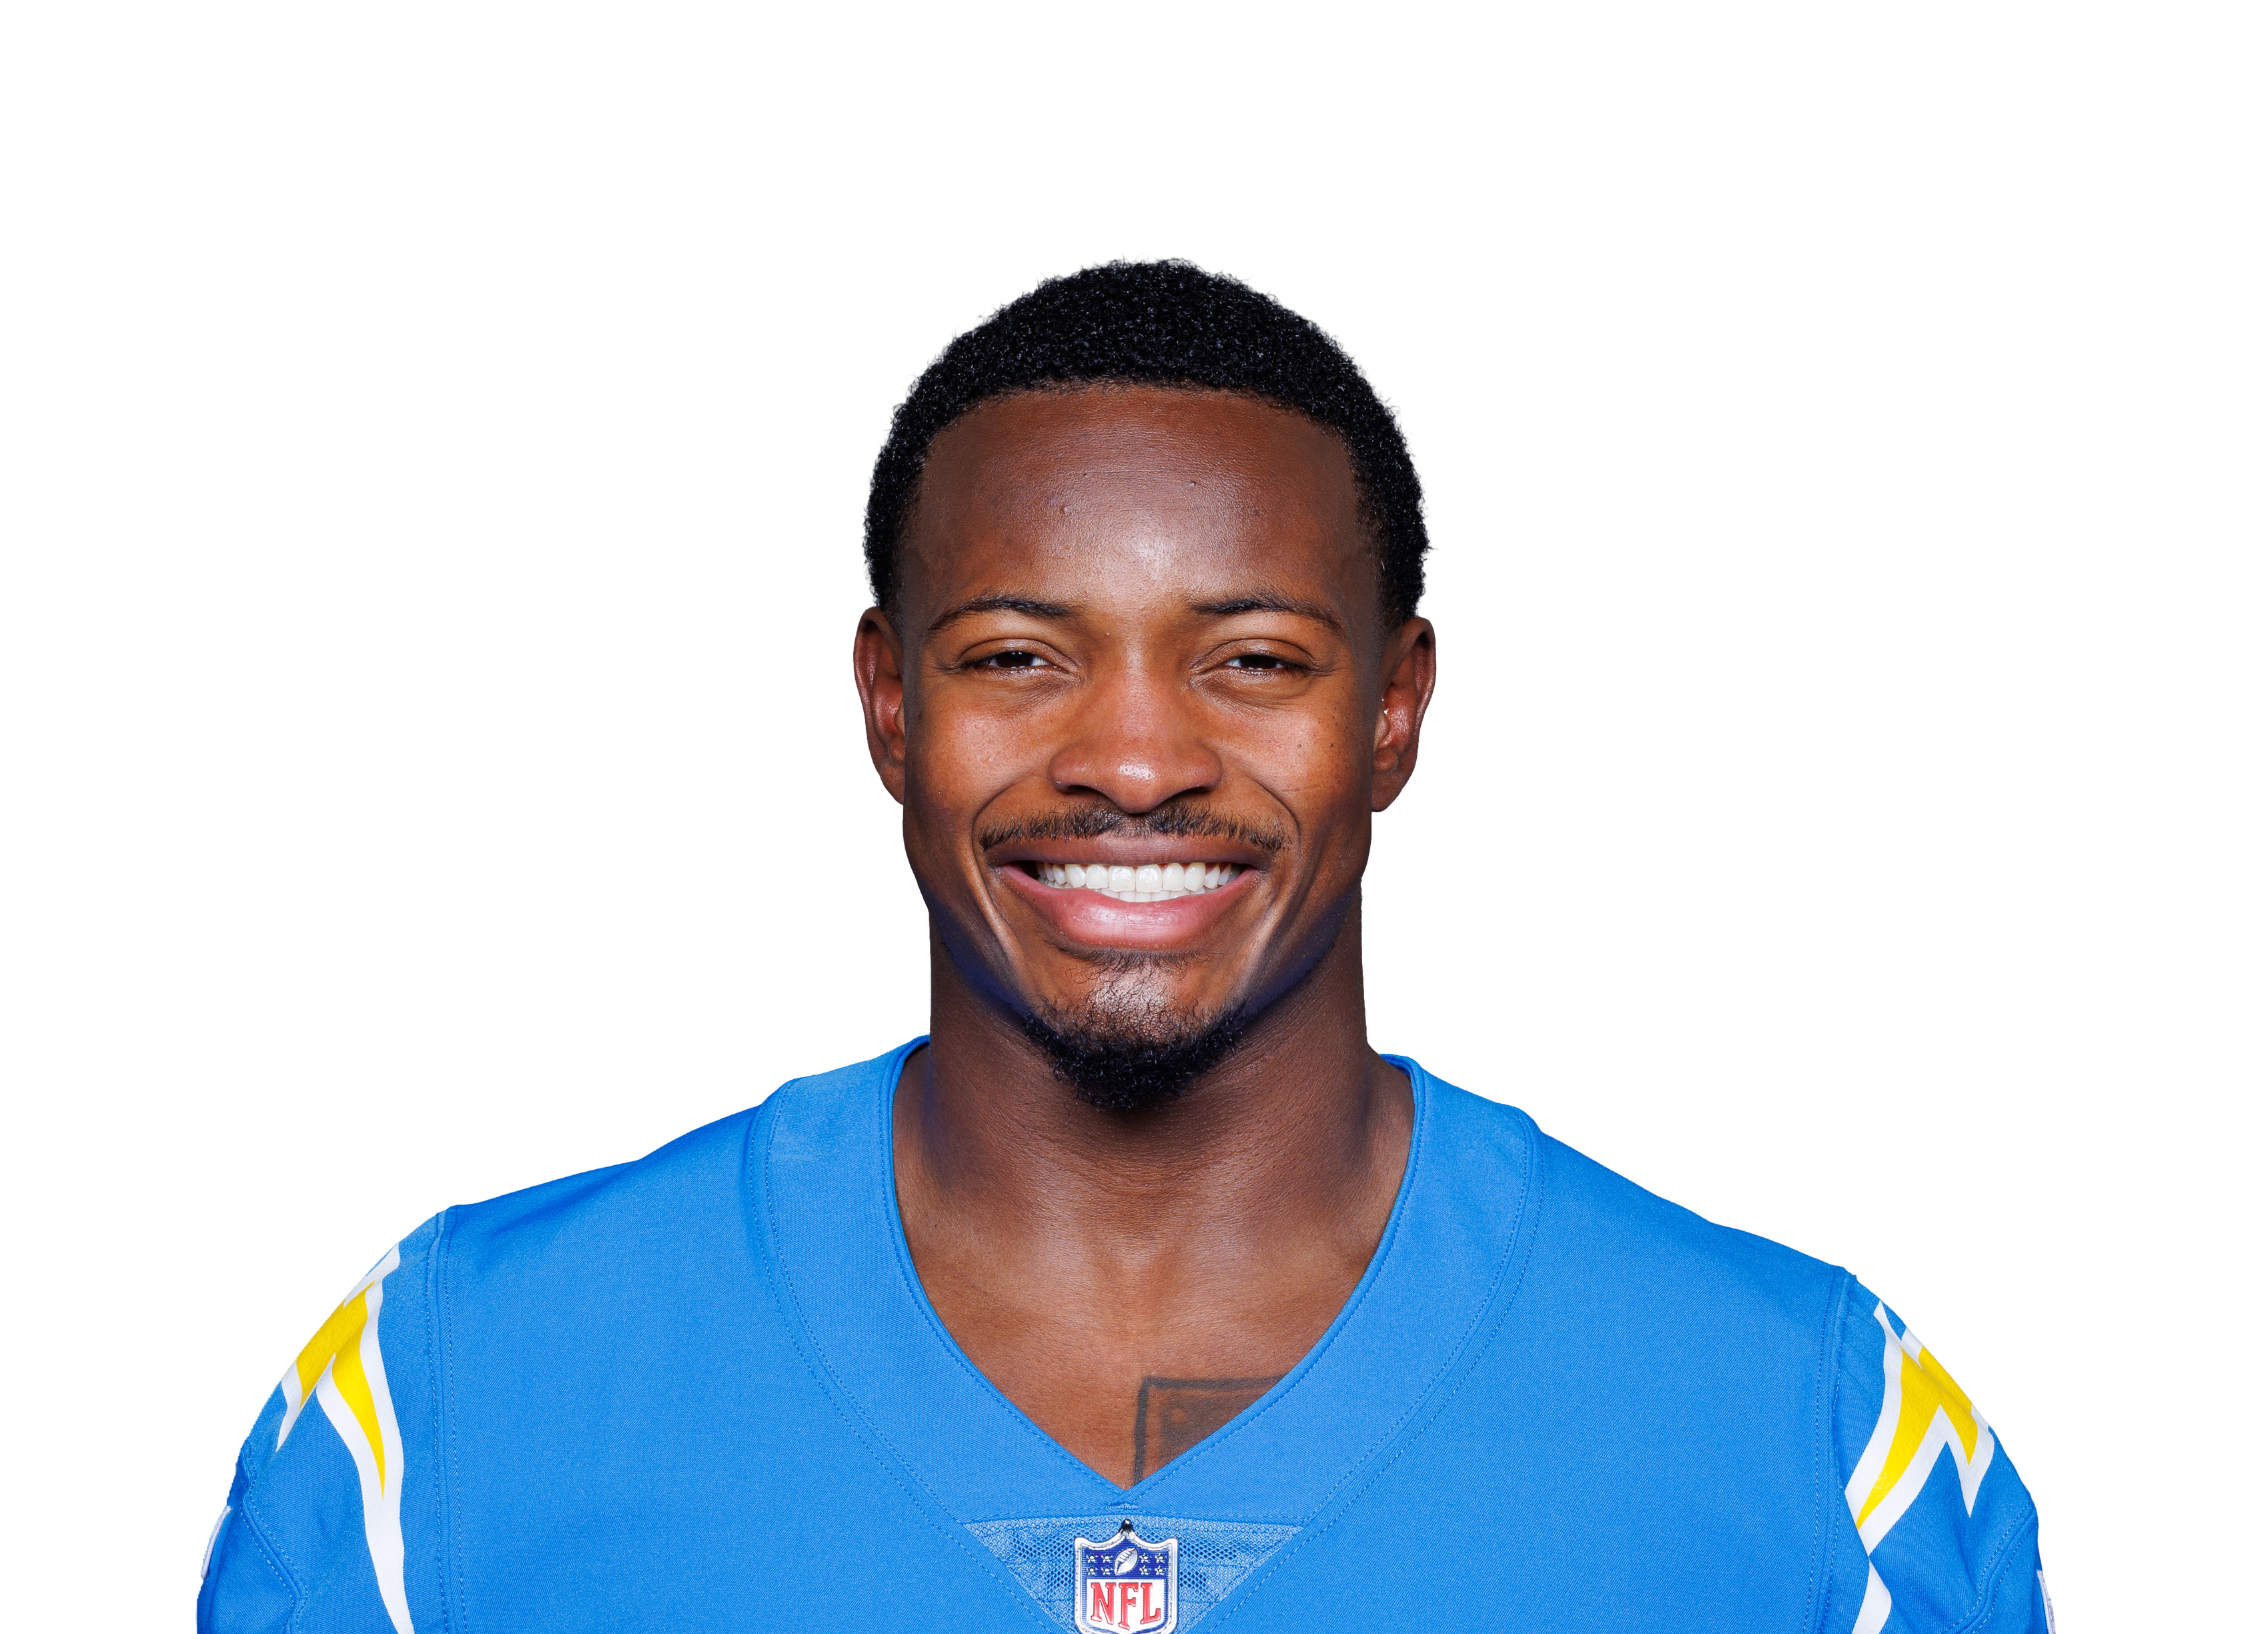
Kimani Vidal

Age 25 · LAC · RB · 8 games
#241 OverallRB66#2 RB on LACDepth RB3 ›
RB44 this week
63.5WEEK 11 RATINGStart value vs NYJ
5.8WEEK 11 PROJECTIONPPR
12%TOUCH SHARE11th percentile
32.5%SNAP SHARE10th percentile
Games counted
Untick or tick any game and Mania Rating, matchup and Week 11 Rating all recalculate. Official Mania Rating 57.5.
Mix and match games

Pick a teammate with or without. Pick more than one to combine them, like a game without the QB and without the other back.

Herbert QB ✓ current
Johnston WR
Harris WR
Kolar TE
Teammate injuries shift his Week 11 Rating1 teammate note ▾

Brenen Thompson (WR, Doubtful) +4.0 • without him that work was worth 7.1 pts vs 0 with (7 games)
Injury report updated Sat Nov 21, 6:30 AM ET
Week 11 Rating = recent role + opponent + the latest injury report (updated Sat Nov 21, 6:30 AM ET). Check final inactives before you set your lineup.
Mania breakdown
Fantasy Production11
Touch Volume22
Backfield Control4
Goal-Line / Red-Zone11
Per-Touch Efficiency48
Mania breakdown
Percentile among RBs. 100 is the best, 50 is average.
11
How many fantasy points and total yards he is actually producing, compared with players at his position. Ranks better than 11% of RBs.
22
How many carries and targets he gets per game compared with other running backs. Ranks better than 22% of RBs.
4
How much of his team backfield he owns: share of touches plus snap share. Ranks better than 4% of RBs.
11
Scoring-position work: red-zone carries, goal-line carries (inside the 5) and red-zone targets. Ranks better than 11% of RBs.
48
What he produces with each touch instead of just rewarding volume: fantasy points per touch, yards per carry and catch rate. Ranks better than 48% of RBs.
Top 30%MiddleBottom 40%Tap a category to see what it means.
Week 11 projection
5.8
projected points
Floor 0.0 · Ceiling 13.7
+0.1Game script
+0.1Matchup
+0.4Injuries
Week 11 projection
LAC
VSPPR
NYJ
Easy matchup • NYJ is #10 in points allowed to RBs
5.8
projected pointsRushing 6 carries, 18 yds • Receiving 2.3 targets, 1.6 catches, 11 yds • 0.22 TD
Floor 0.04 of 5 games land hereCeiling 13.7
Vegas lines included. From usage alone: 7.5. Sportsbook lines imply 4.9. Blended: 5.8. Biggest gaps: rushing yards 15 on the sportsbooks vs 26 from usage.
+0.1Game script
+0.1Matchup
+0.4Injuries
How this is built
Recent and last-season usage, the Vegas spread and total, how this defense treats his position, and the injury report (teammates out, QB out). The three boxes show how many points each moved it. When sportsbook player lines are posted (Wednesday to Sunday) they are blended in, leaning on them most for new starters and players with few games. PPR scoring only. Tested on past seasons it is about 5% closer than a plain season average.
Week 11 matchup
vs NYJ
Tough matchup
Adjustment-4.3 pts
Allows to RBs7th most
Week11
Week 11 matchup
vs NYJ
-2.9Rating boost
Tough matchup10th easiest of 32 defenses for RBs
ToughEasy
24.6PPR a game NYJ allows to RBs
6.7Similar players, usual PPR a game
6.2Same players against NYJ
Players with a role like his scored 6.2 PPR a game against NYJ, versus 6.7 in their usual games (-7%). That moves his Week 11 Rating by -2.9.
How running backs did against NYJ

24.0 PPR points a game allowed to running backs, 10th most of 32 defenses.

PlayerPPRRushRush YdRush TDRecRec Yd
Jahmyr Gibbs@ DET • Wk 341.420992765
Kenneth Walker III@ KC • Wk 936.3181021441
Kyle Monangai@ CHI • Wk 428.030146214
James Cookvs BUF • Wk 1021.718157100
Ollie Gordon IIvs MIA • Wk 717.325103110
Ashton Jeantyvs LV • Wk 810.3290364
Emmett Johnson@ KC • Wk 99.4634100
MarShawn Lloydvs GB • Wk 28.6620026
Mike Washington Jr.vs LV • Wk 88.32583000
Quinshon Judkinsvs CLE • Wk 58.01444036
D'Andre Swift@ CHI • Wk 47.415580216
Corey Kiner@ NE • Wk 65.71157000
Sione Vaki@ DET • Wk 34.76260111
Tony Pollard@ TEN • Wk 14.473501-1
Tyjae Spears@ TEN • Wk 14.43120212
Chris Brooksvs GB • Wk 23.64110115
Rhamondre Stevenson@ NE • Wk 63.61436000
Roschon Johnson@ CHI • Wk 43.3416017
Kaleb Johnsonvs GB • Wk 23.2832000
TreVeyon Henderson@ NE • Wk 63.0731019
Raheim Sandersvs CLE • Wk 52.3312011
Jaydn Ott@ KC • Wk 91.9319000
Ty Johnsonvs BUF • Wk 101.400014
Jaylen Wrightvs MIA • Wk 70.868000
Ray Davisvs BUF • Wk 100.838000
Jaleel McLaughlinvs CLE • Wk 50.000000

Fantasy points first, then the stats that matter for his position. Ring around each photo is that player's Mania Rating. Tap a name to open his profile.

Usage
Snaps
33%
Touch share
12%
Carries/G
4.8
PPR/G
5.9
By the numbers
PPR / Game
5.9
16th percentileRB avg 10.9
Rushing Attempts / Game
4.8
16th percentileRB avg 11
Rush Yards / Game
20.3
22nd percentileRB avg 45.2
Targets / Game
2.4
44th percentileRB avg 2.9
Scrimmage Yards / Game
29
12th percentileRB avg 61.1
Share of Team Touches
12.4%
12th percentileRB avg 23.9%
Red-Zone Carries / Game
0.3
10th percentileRB avg 2
Goal-Line Carries / Game
0
21st percentileRB avg 0.6
Red-Zone Targets / Game
0.3
49th percentileRB avg 0.4
End-Zone Targets / Game
0
81st percentileRB avg 0
Snap Share
32.5%
10th percentileRB avg 51.4%
TDs / Game
0.3
34th percentileRB avg 0.5
LAC RB room
O. Hampton28%
K. Mitchell14%
K. Vidal12%
S. Matlock0%
Share of touches
LAC RB room, week by week
Touches = carries + targets. Switch to look at just carries or just targets.
PlayerW1W2W3W4W5W6W8W9W10Per game
Omarion Hampton1243 yds25% touches58% snaps25115 yds43% touches63% snaps1656 yds26% touches42% snaps1153 yds18% touches35% snaps1539 yds27% touches30% snaps1139 yds19% touches50% snaps1227 yds22% touches30% snaps1360 yds22% touches40% snaps24105 yds48% touches63% snaps15.460 yds a game • 3.9 per touch28% touches46% snaps
Kimani Vidal—00 yds0% touches10% snaps420 yds7% touches25% snaps836 yds13% touches35% snaps1056 yds18% touches42% snaps1140 yds19% touches37% snaps1030 yds18% touches46% snaps1036 yds17% touches39% snaps414 yds8% touches26% snaps7.129 yds a game • 4.1 per touch12% touches33% snaps
Keaton Mitchell49 yds8% touches31% snaps639 yds10% touches25% snaps1147 yds18% touches38% snaps1663 yds25% touches37% snaps1029 yds18% touches34% snaps34 yds5% touches25% snaps723 yds13% touches31% snaps1167 yds18% touches25% snaps44 yds8% touches23% snaps8.032 yds a game • 4.0 per touch14% touches30% snaps
Scott Matlock——————00 yds0% touches36% snaps00 yds0% touches40% snaps—0.00 yds a game0% touches38% snaps
Each cell is the count that week with his yards on those touches plus his share of the team and his snap percentage. Click a name to open that player.
Game log
11.6W4
12.6W5
7W6
5W8
4.6W9
3.4W10
Games8
PPR/G5.9
Game log
0W23W311.6W412.6W57W65W84.6W93.4W10
Vidal avg 5.9NFL top 30 RBs avg 15.7
Solid dot is what he scored. Hollow dot is our projection before the game.
UseGameProjPPRTgtRecRec YdCarRush YdTDSnap
W2vs LV 10.4000000010%
W3vs BUF 3.93311416025%
W4vs SEA 3.711.63211525135%
W5vs DEN 6.112.621-1857142%
W6vs KC 6.174319721037%
W8vs LA 6.75227823046%
W9vs HOU 7.34.6316730039%
W10vs BAL 6.93.4221420026%
Opponent color:Easy defense for RBsAverageTough
Schedule ahead
11 NYJ12 NE13 TB14 LV15 SF16 MIA17 KC18 DEN
Green easier, red tougher
Schedule ahead
Colored by what each defense has given up to RBs so far. Green is an easier matchup, red is a tougher one.
Wk 11 NYJWk 12 NEWk 13 TBWk 14 LVWk 15 SFWk 16 MIAWk 17 KCWk 18 DEN
See every team's RB schedule ›
StatPer gameSeasonRank
Overall
Games—865›
PPR points5.947.216›
Touchdowns0.25234›
Receiving
Targets2.41947›
Catches1.51237›
Receiving yards8.87032›
Receiving TDs—190›
Yards per target3.7—19›
Yards per catch4.3—72›
Rushing
Carries4.83816›
Rush yards20.216221›
Rush TDs—164›
Scrimmage yards2923212›
Usage
Snap %33%—10›
Target share %8.6%—53›
Touch share %12.4%—11›
Carry share %18.9%—36›
Air yards share %-1.3%-1240›
Scoring chances
Red-zone targets0.3249›
Red-zone carries0.3—10›
Tap any stat to see everyone ranked. Bars: green top 30%, yellow middle, red bottom 40%.
Advanced stats

Too few plays to rank yet (needs 60 carries, he has 38). Here are his raw numbers so far.

DropsNot ranked
1 on 19 targets · 5.3%
Broken tacklesNot ranked
0 on 12 catches
Yards after the catchNot ranked
8.1 per catch
Broken tacklesNot ranked
3 on 38 carries
57.5
Mania Rating
Overall profile • Depth
63.5
Week 11 Rating
Start value vs NYJ

Kimani Vidal

LAC • RB • 8 games
#241 OverallRB66#2 RB on LACDepth RB3 ›Age 25
Week 11 projection 5.8 PPR ›
RB44 this week
Games counted
Untick or tick any game and Mania Rating, matchup and Week 11 Rating all recalculate. Official Mania Rating 57.5.
Mix and match games

Pick a teammate with or without. Pick more than one to combine them, like a game without the QB and without the other back.

Herbert QB ✓ current
Johnston WR
Harris WR
Kolar TE
Teammate injuries shift his Week 11 Rating1 teammate note ▾
Brenen Thompson (WR, Doubtful) +4.0 • without him that work was worth 7.1 pts vs 0 with (7 games)
Injury report updated Sat Nov 21, 6:30 AM ET
Week 11 Rating = recent role + opponent + the latest injury report (updated Sat Nov 21, 6:30 AM ET). Check final inactives before you set your lineup.
Week 11 projection
5.8
projected points
Floor 0.0 · Ceiling 13.7
+0.1Game script
+0.1Matchup
+0.4Injuries
Week 11 projection
LAC
VSPPR
NYJ
Easy matchup • NYJ is #10 in points allowed to RBs
5.8
projected pointsRushing 6 carries, 18 yds • Receiving 2.3 targets, 1.6 catches, 11 yds • 0.22 TD
Floor 0.04 of 5 games land hereCeiling 13.7
Vegas lines included. From usage alone: 7.5. Sportsbook lines imply 4.9. Blended: 5.8. Biggest gaps: rushing yards 15 on the sportsbooks vs 26 from usage.
+0.1Game script
+0.1Matchup
+0.4Injuries
How this is built
Recent and last-season usage, the Vegas spread and total, how this defense treats his position, and the injury report (teammates out, QB out). The three boxes show how many points each moved it. When sportsbook player lines are posted (Wednesday to Sunday) they are blended in, leaning on them most for new starters and players with few games. PPR scoring only. Tested on past seasons it is about 5% closer than a plain season average.
LAC RB room
O. Hampton28%
K. Mitchell14%
K. Vidal12%
S. Matlock0%
Share of touches
LAC RB room, week by week
Touches = carries + targets. Switch to look at just carries or just targets.
PlayerW1W2W3W4W5W6W8W9W10Per game
Omarion Hampton1243 yds25% touches58% snaps25115 yds43% touches63% snaps1656 yds26% touches42% snaps1153 yds18% touches35% snaps1539 yds27% touches30% snaps1139 yds19% touches50% snaps1227 yds22% touches30% snaps1360 yds22% touches40% snaps24105 yds48% touches63% snaps15.460 yds a game • 3.9 per touch28% touches46% snaps
Kimani Vidal—00 yds0% touches10% snaps420 yds7% touches25% snaps836 yds13% touches35% snaps1056 yds18% touches42% snaps1140 yds19% touches37% snaps1030 yds18% touches46% snaps1036 yds17% touches39% snaps414 yds8% touches26% snaps7.129 yds a game • 4.1 per touch12% touches33% snaps
Keaton Mitchell49 yds8% touches31% snaps639 yds10% touches25% snaps1147 yds18% touches38% snaps1663 yds25% touches37% snaps1029 yds18% touches34% snaps34 yds5% touches25% snaps723 yds13% touches31% snaps1167 yds18% touches25% snaps44 yds8% touches23% snaps8.032 yds a game • 4.0 per touch14% touches30% snaps
Scott Matlock——————00 yds0% touches36% snaps00 yds0% touches40% snaps—0.00 yds a game0% touches38% snaps
Each cell is the count that week with his yards on those touches plus his share of the team and his snap percentage. Click a name to open that player.
Game log
11.6W4
12.6W5
7W6
5W8
4.6W9
3.4W10
Games8
PPR/G5.9
Game log
0W23W311.6W412.6W57W65W84.6W93.4W10
Vidal avg 5.9NFL top 30 RBs avg 15.7
Solid dot is what he scored. Hollow dot is our projection before the game.
UseGameProjPPRTgtRecRec YdCarRush YdTDSnap
W2vs LV 10.4000000010%
W3vs BUF 3.93311416025%
W4vs SEA 3.711.63211525135%
W5vs DEN 6.112.621-1857142%
W6vs KC 6.174319721037%
W8vs LA 6.75227823046%
W9vs HOU 7.34.6316730039%
W10vs BAL 6.93.4221420026%
Opponent color:Easy defense for RBsAverageTough
Schedule ahead
11 NYJ12 NE13 TB14 LV15 SF16 MIA17 KC18 DEN
Green easier, red tougher
Schedule ahead
Colored by what each defense has given up to RBs so far. Green is an easier matchup, red is a tougher one.
Wk 11 NYJWk 12 NEWk 13 TBWk 14 LVWk 15 SFWk 16 MIAWk 17 KCWk 18 DEN
See every team's RB schedule ›
StatPer gameSeasonRank
Overall
Games—865›
PPR points5.947.216›
Touchdowns0.25234›
Receiving
Targets2.41947›
Catches1.51237›
Receiving yards8.87032›
Receiving TDs—190›
Yards per target3.7—19›
Yards per catch4.3—72›
Rushing
Carries4.83816›
Rush yards20.216221›
Rush TDs—164›
Scrimmage yards2923212›
Usage
Snap %33%—10›
Target share %8.6%—53›
Touch share %12.4%—11›
Carry share %18.9%—36›
Air yards share %-1.3%-1240›
Scoring chances
Red-zone targets0.3249›
Red-zone carries0.3—10›
Tap any stat to see everyone ranked. Bars: green top 30%, yellow middle, red bottom 40%.
Advanced stats

Too few plays to rank yet (needs 60 carries, he has 38). Here are his raw numbers so far.

DropsNot ranked
1 on 19 targets · 5.3%
Broken tacklesNot ranked
0 on 12 catches
Yards after the catchNot ranked
8.1 per catch
Broken tacklesNot ranked
3 on 38 carries
Mania breakdown
Fantasy Production11
Touch Volume22
Backfield Control4
Goal-Line / Red-Zone11
Per-Touch Efficiency48
Mania breakdown
Percentile among RBs. 100 is the best, 50 is average.
11
How many fantasy points and total yards he is actually producing, compared with players at his position. Ranks better than 11% of RBs.
22
How many carries and targets he gets per game compared with other running backs. Ranks better than 22% of RBs.
4
How much of his team backfield he owns: share of touches plus snap share. Ranks better than 4% of RBs.
11
Scoring-position work: red-zone carries, goal-line carries (inside the 5) and red-zone targets. Ranks better than 11% of RBs.
48
What he produces with each touch instead of just rewarding volume: fantasy points per touch, yards per carry and catch rate. Ranks better than 48% of RBs.
Top 30%MiddleBottom 40%Tap a category to see what it means.
Week 11 matchup
vs NYJ
Tough matchup
Adjustment-4.3 pts
Allows to RBs7th most
Week11
Week 11 matchup
vs NYJ
-2.9Rating boost
Tough matchup10th easiest of 32 defenses for RBs
ToughEasy
24.6PPR a game NYJ allows to RBs
6.7Similar players, usual PPR a game
6.2Same players against NYJ
Players with a role like his scored 6.2 PPR a game against NYJ, versus 6.7 in their usual games (-7%). That moves his Week 11 Rating by -2.9.
How running backs did against NYJ

24.0 PPR points a game allowed to running backs, 10th most of 32 defenses.

PlayerPPRRushRush YdRush TDRecRec Yd
Jahmyr Gibbs@ DET • Wk 341.420992765
Kenneth Walker III@ KC • Wk 936.3181021441
Kyle Monangai@ CHI • Wk 428.030146214
James Cookvs BUF • Wk 1021.718157100
Ollie Gordon IIvs MIA • Wk 717.325103110
Ashton Jeantyvs LV • Wk 810.3290364
Emmett Johnson@ KC • Wk 99.4634100
MarShawn Lloydvs GB • Wk 28.6620026
Mike Washington Jr.vs LV • Wk 88.32583000
Quinshon Judkinsvs CLE • Wk 58.01444036
D'Andre Swift@ CHI • Wk 47.415580216
Corey Kiner@ NE • Wk 65.71157000
Sione Vaki@ DET • Wk 34.76260111
Tony Pollard@ TEN • Wk 14.473501-1
Tyjae Spears@ TEN • Wk 14.43120212
Chris Brooksvs GB • Wk 23.64110115
Rhamondre Stevenson@ NE • Wk 63.61436000
Roschon Johnson@ CHI • Wk 43.3416017
Kaleb Johnsonvs GB • Wk 23.2832000
TreVeyon Henderson@ NE • Wk 63.0731019
Raheim Sandersvs CLE • Wk 52.3312011
Jaydn Ott@ KC • Wk 91.9319000
Ty Johnsonvs BUF • Wk 101.400014
Jaylen Wrightvs MIA • Wk 70.868000
Ray Davisvs BUF • Wk 100.838000
Jaleel McLaughlinvs CLE • Wk 50.000000

Fantasy points first, then the stats that matter for his position. Ring around each photo is that player's Mania Rating. Tap a name to open his profile.

Usage
Snaps
33%
Touch share
12%
Carries/G
4.8
PPR/G
5.9
By the numbers
PPR / Game
5.9
16th percentileRB avg 10.9
Rushing Attempts / Game
4.8
16th percentileRB avg 11
Rush Yards / Game
20.3
22nd percentileRB avg 45.2
Targets / Game
2.4
44th percentileRB avg 2.9
Scrimmage Yards / Game
29
12th percentileRB avg 61.1
Share of Team Touches
12.4%
12th percentileRB avg 23.9%
Red-Zone Carries / Game
0.3
10th percentileRB avg 2
Goal-Line Carries / Game
0
21st percentileRB avg 0.6
Red-Zone Targets / Game
0.3
49th percentileRB avg 0.4
End-Zone Targets / Game
0
81st percentileRB avg 0
Snap Share
32.5%
10th percentileRB avg 51.4%
TDs / Game
0.3
34th percentileRB avg 0.5

More on Kimani Vidal

Start/sit this week

More RBs

Rankings

Tools

Mania Ratings and projections through Week 10 of the 2026 season, updated during the week. Tap anything above to open the full interactive profile in Fantasy Mania.