
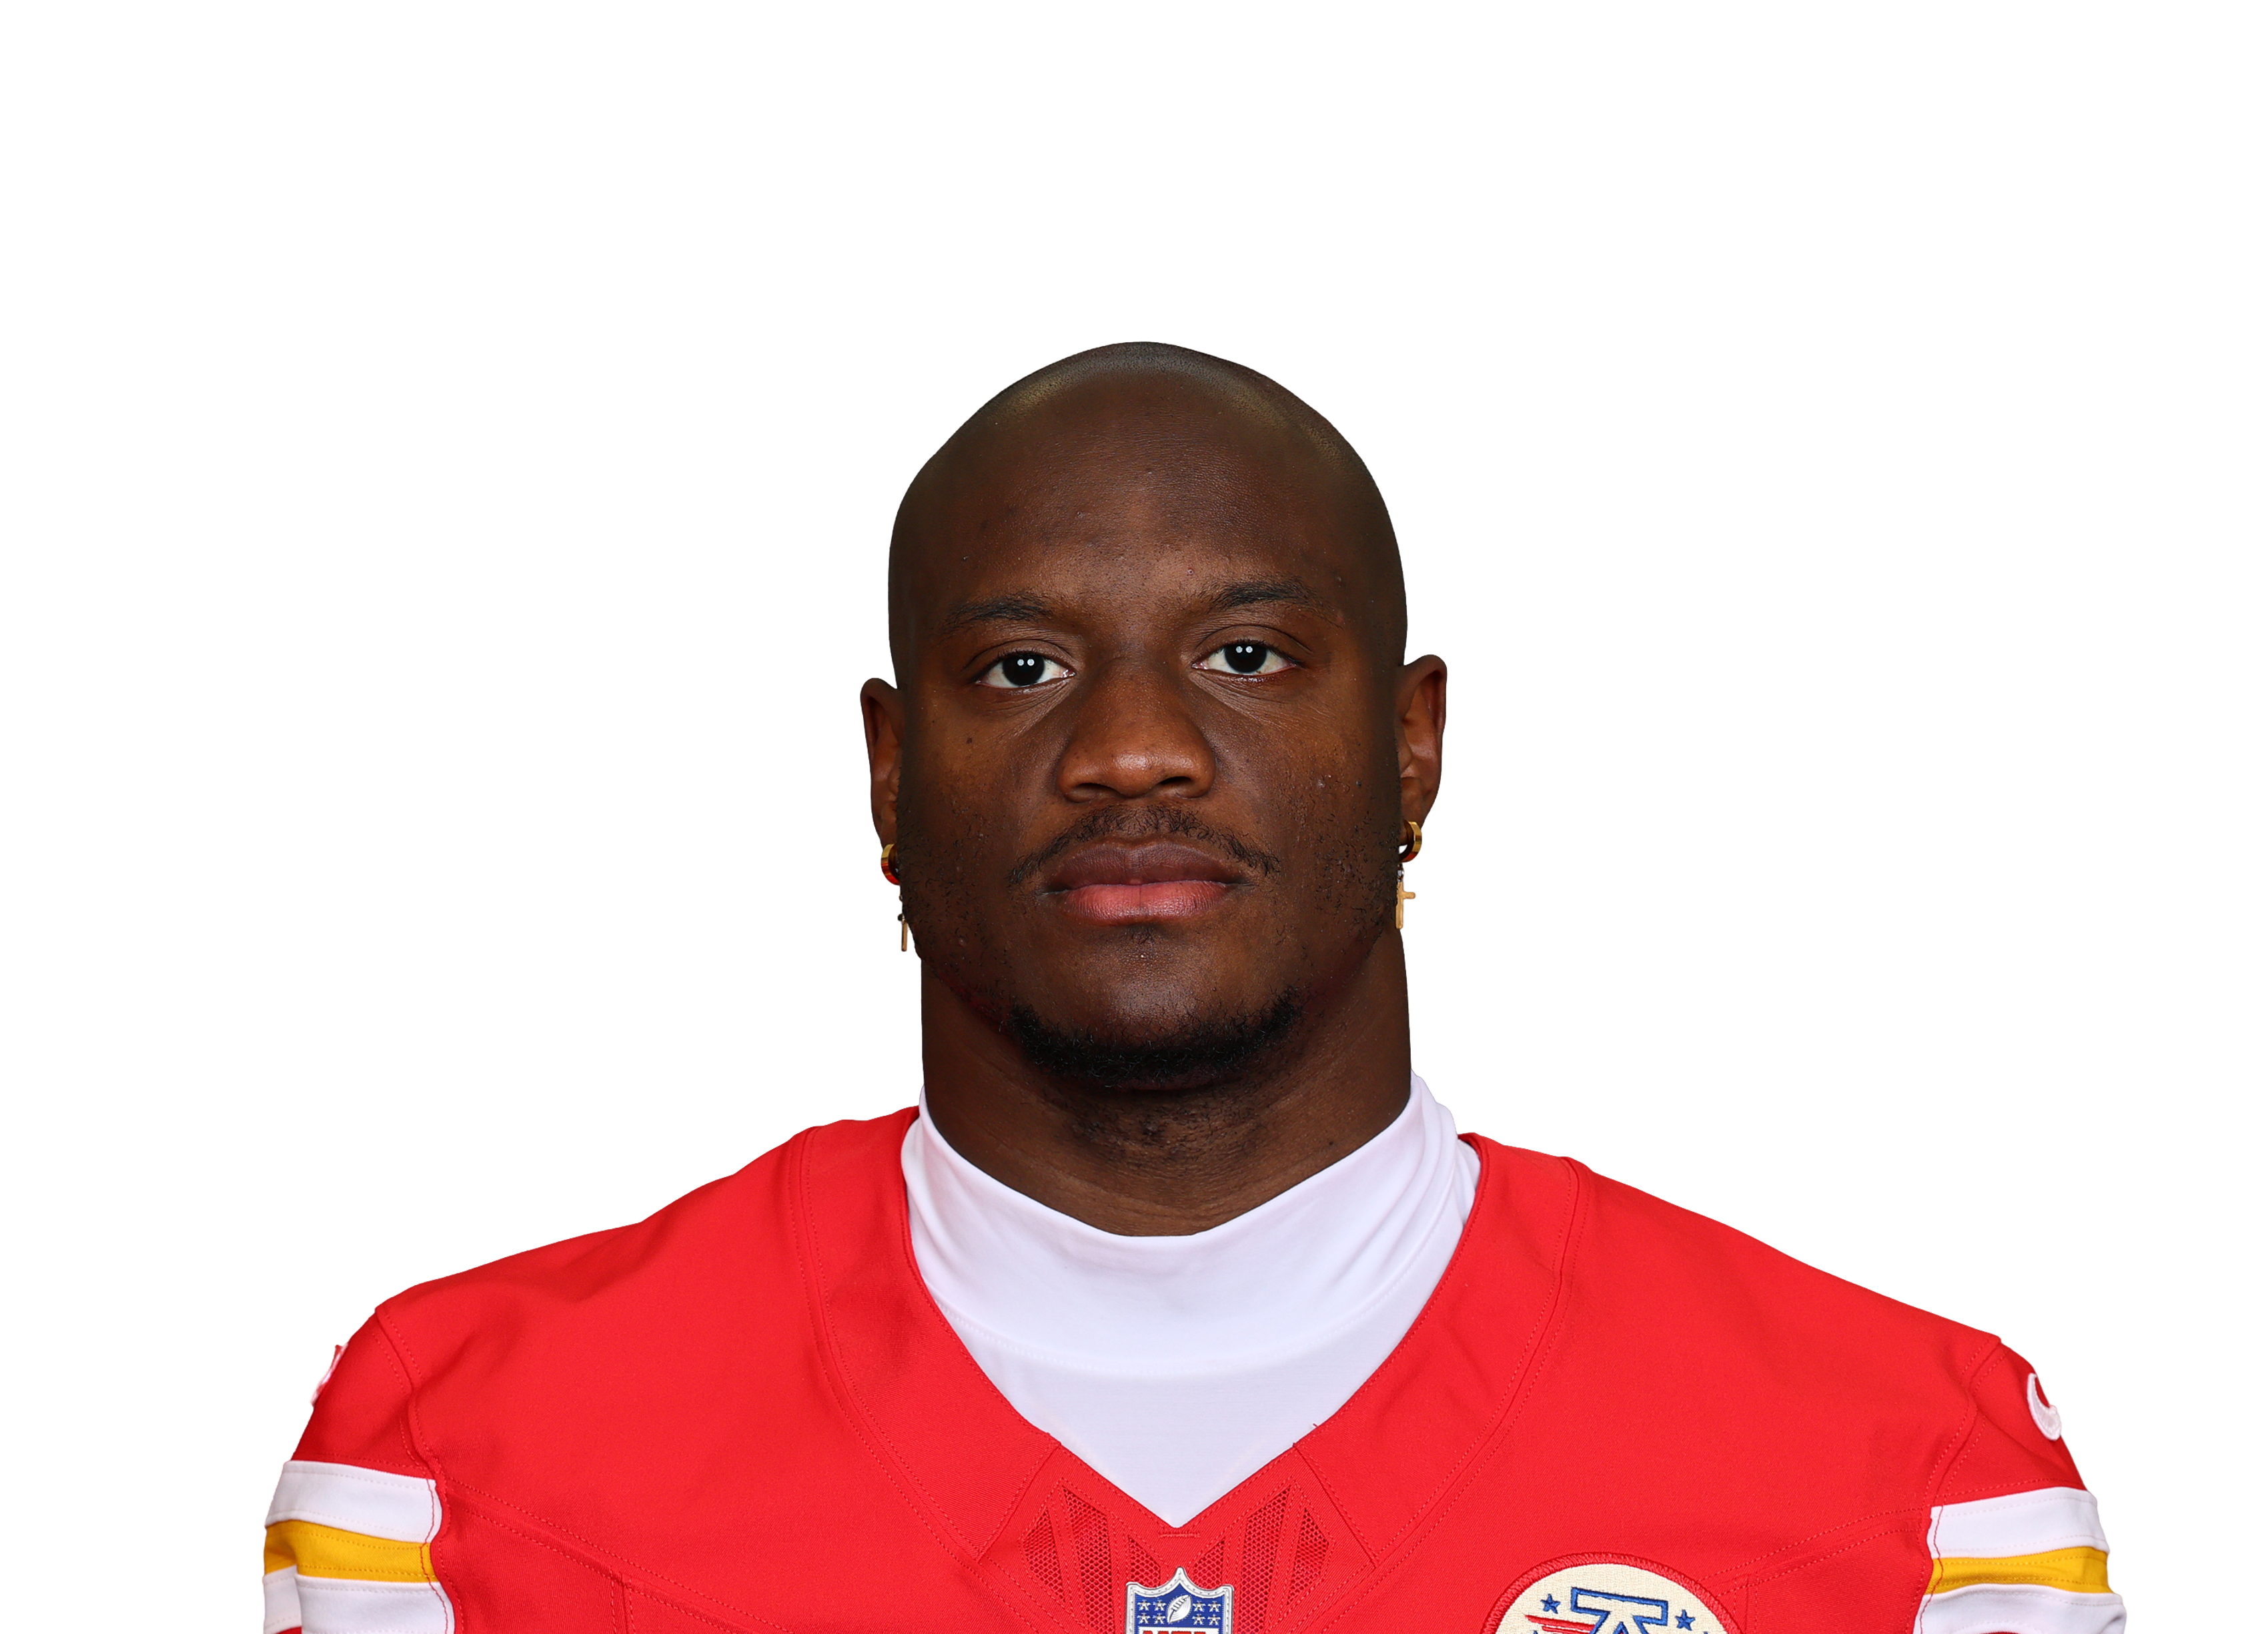
Kenneth Walker III
 KC • RB • 8 games
Pick a teammate with or without. Pick more than one to combine them, like a game without the QB and without the other back.
Out (Groin) • no Week 11 Rating • Est. return Nov 26 (Week 12, ESPN)1 teammate note ▾

22.2 PPR points a game allowed to running backs, 14th most of 32 defenses.
| Player | PPR | Rush | Rush Yd | Rush TD | Rec | Rec Yd |
|---|---|---|---|---|---|---|
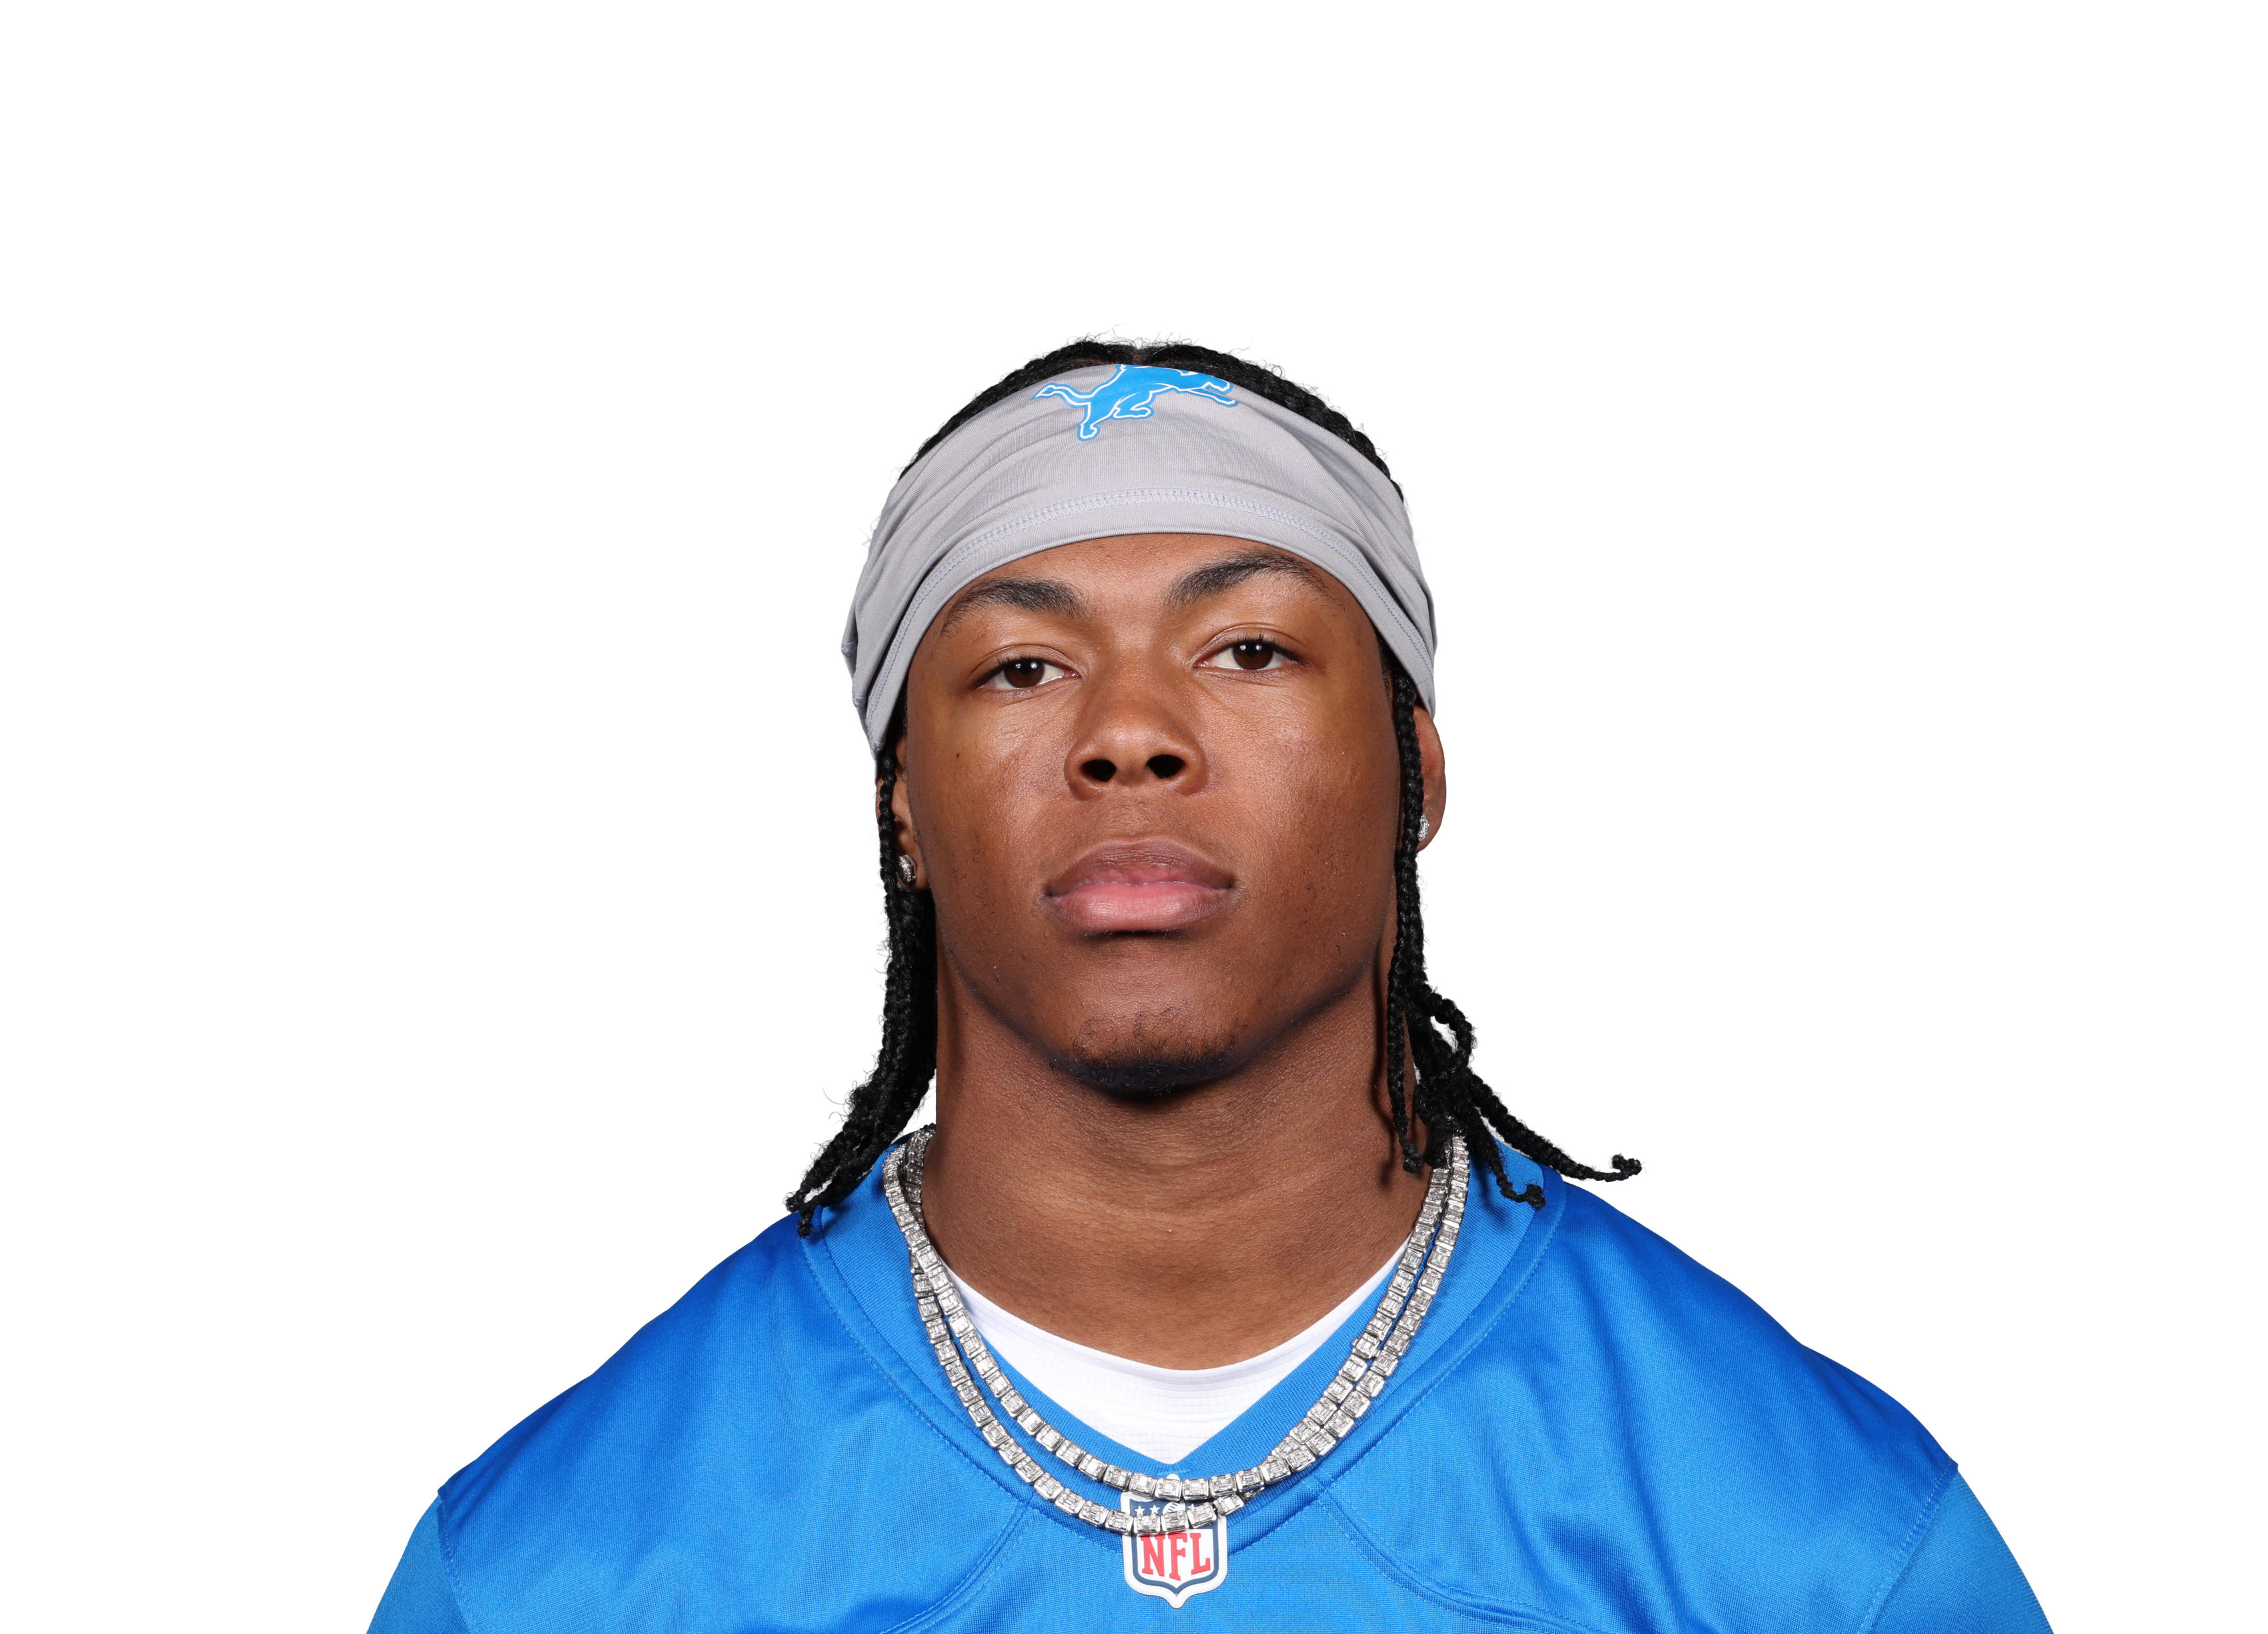 Jahmyr Gibbsvs DET • Wk 5 | 37.7 | 25 | 151 | 2 | 5 | 56 |
 Christian McCaffrey@ SF • Wk 3 | 21.6 | 15 | 75 | 1 | 4 | 41 |
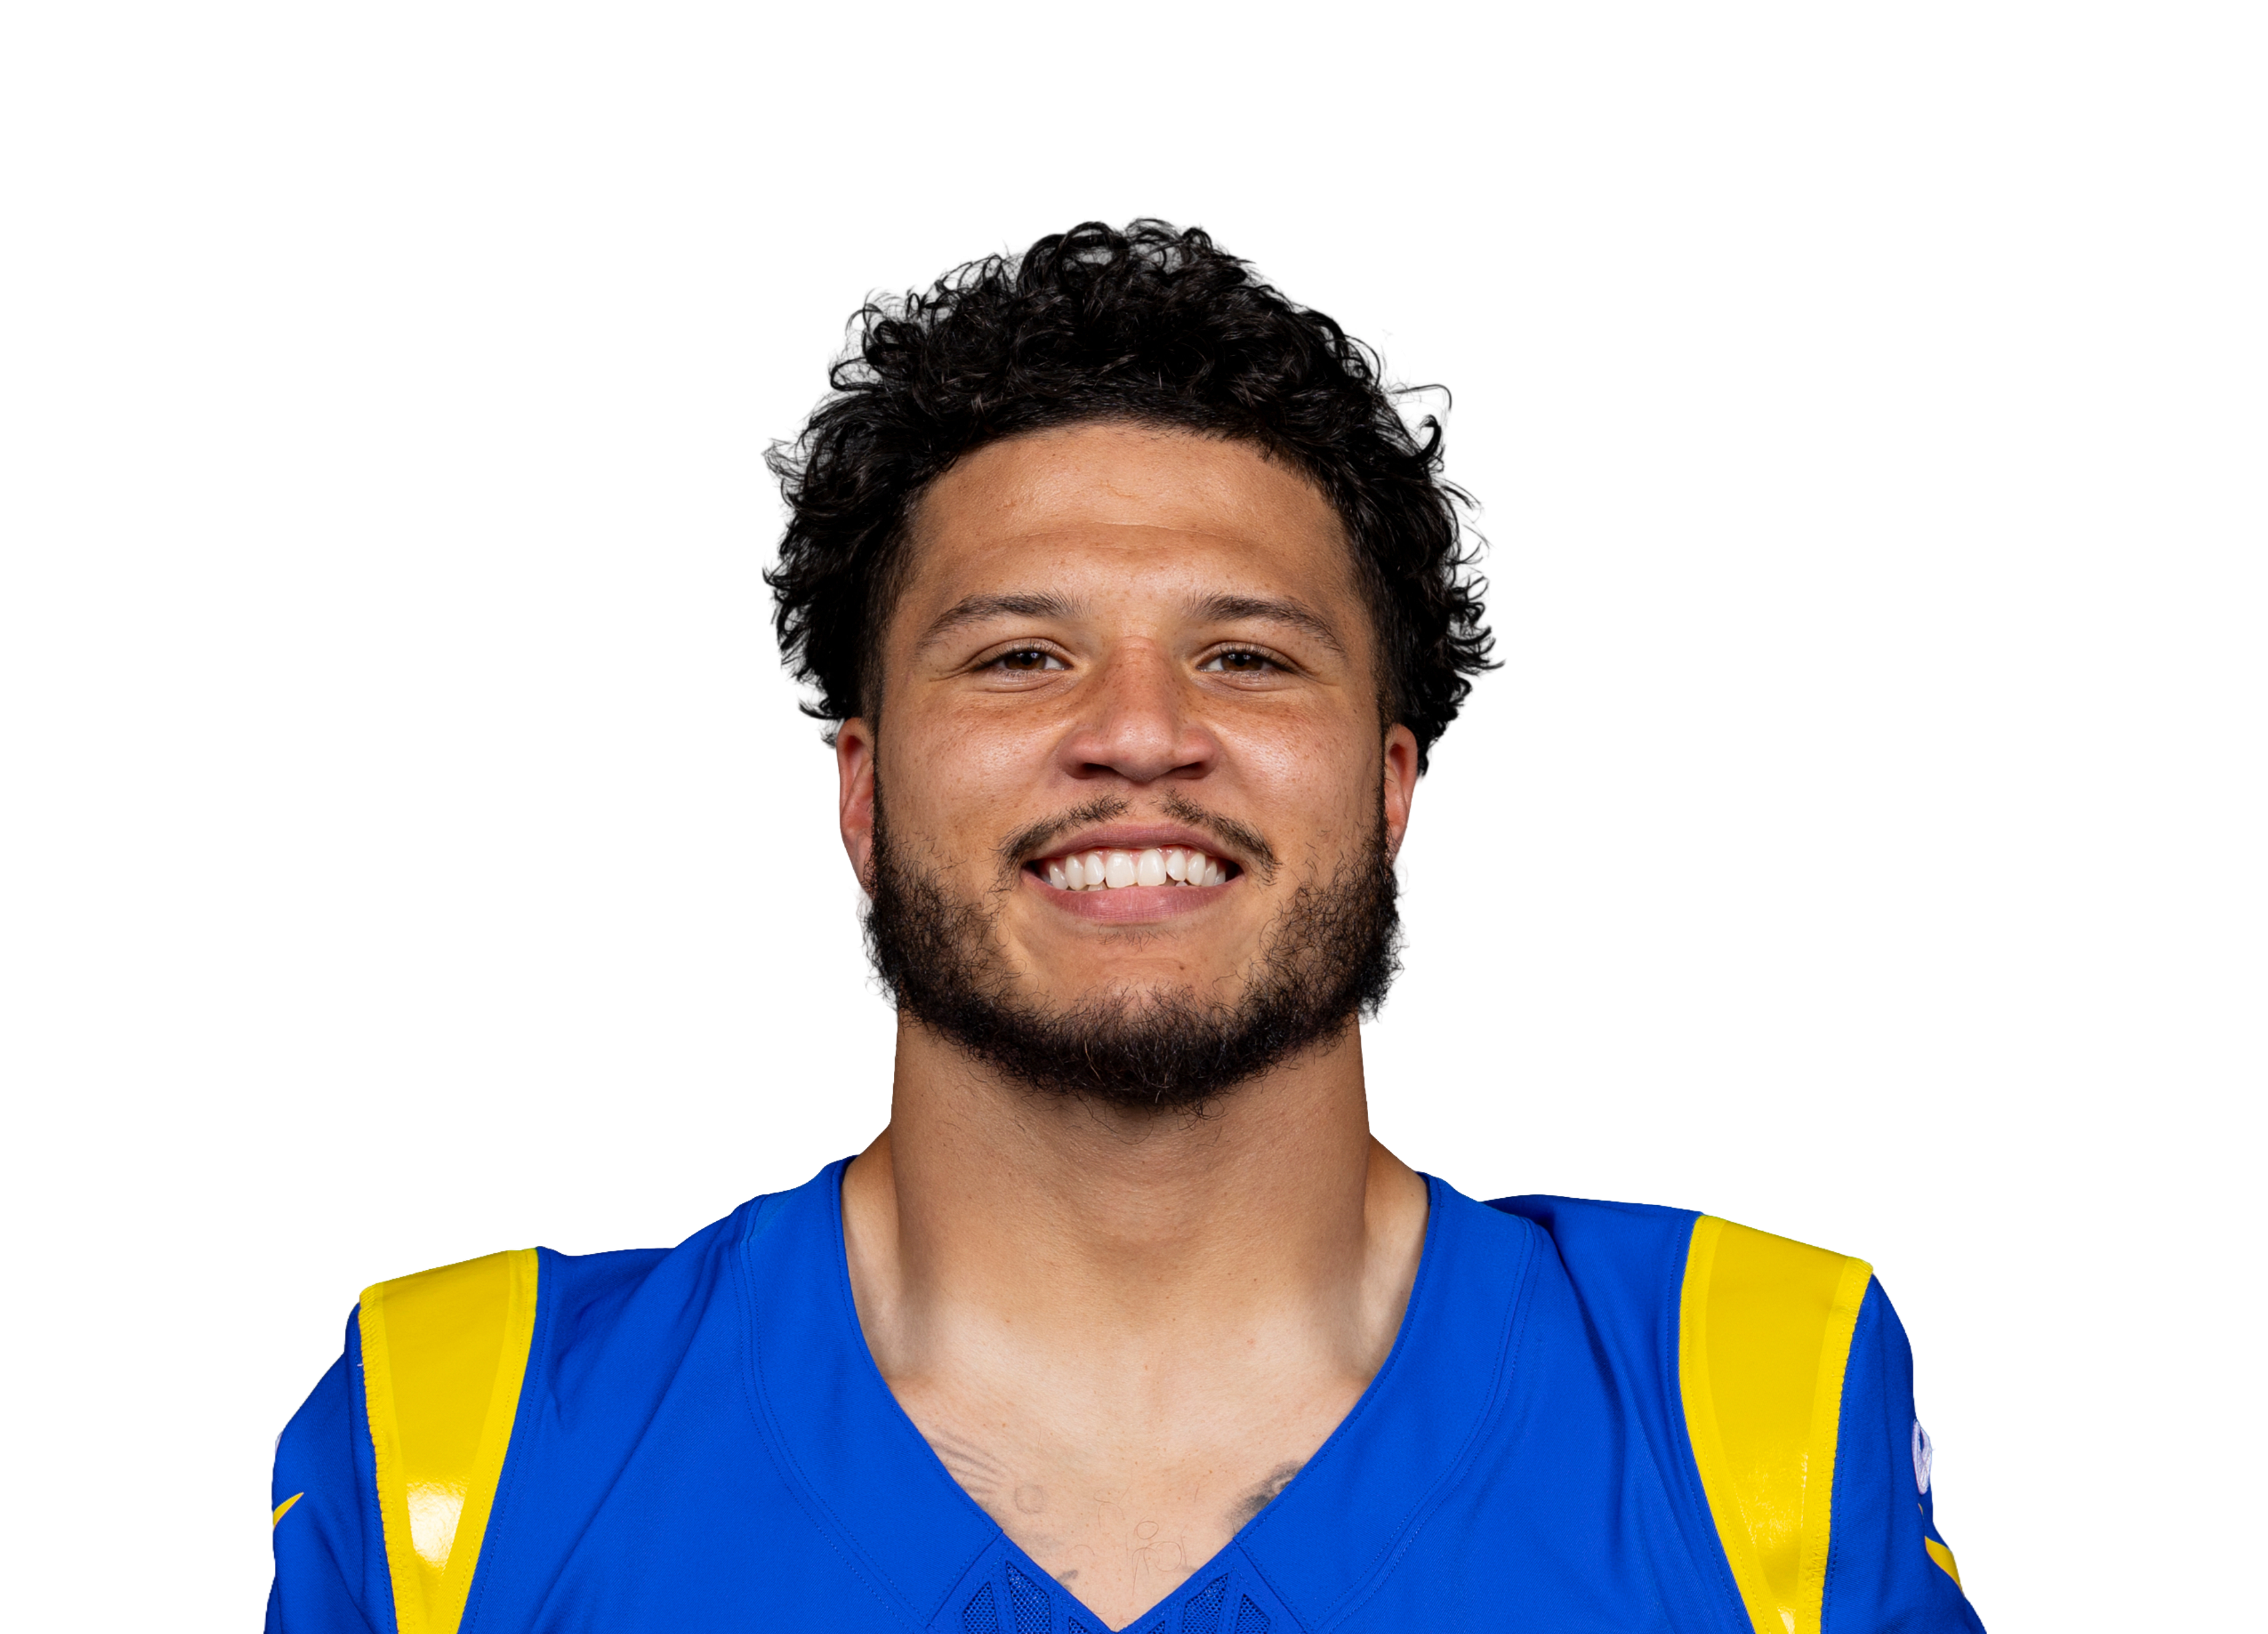 Blake Corumvs LA • Wk 10 | 20.9 | 17 | 100 | 1 | 3 | 19 |
| Blake Corum@ LA • Wk 6 | 14.0 | 9 | 42 | 0 | 2 | 18 |
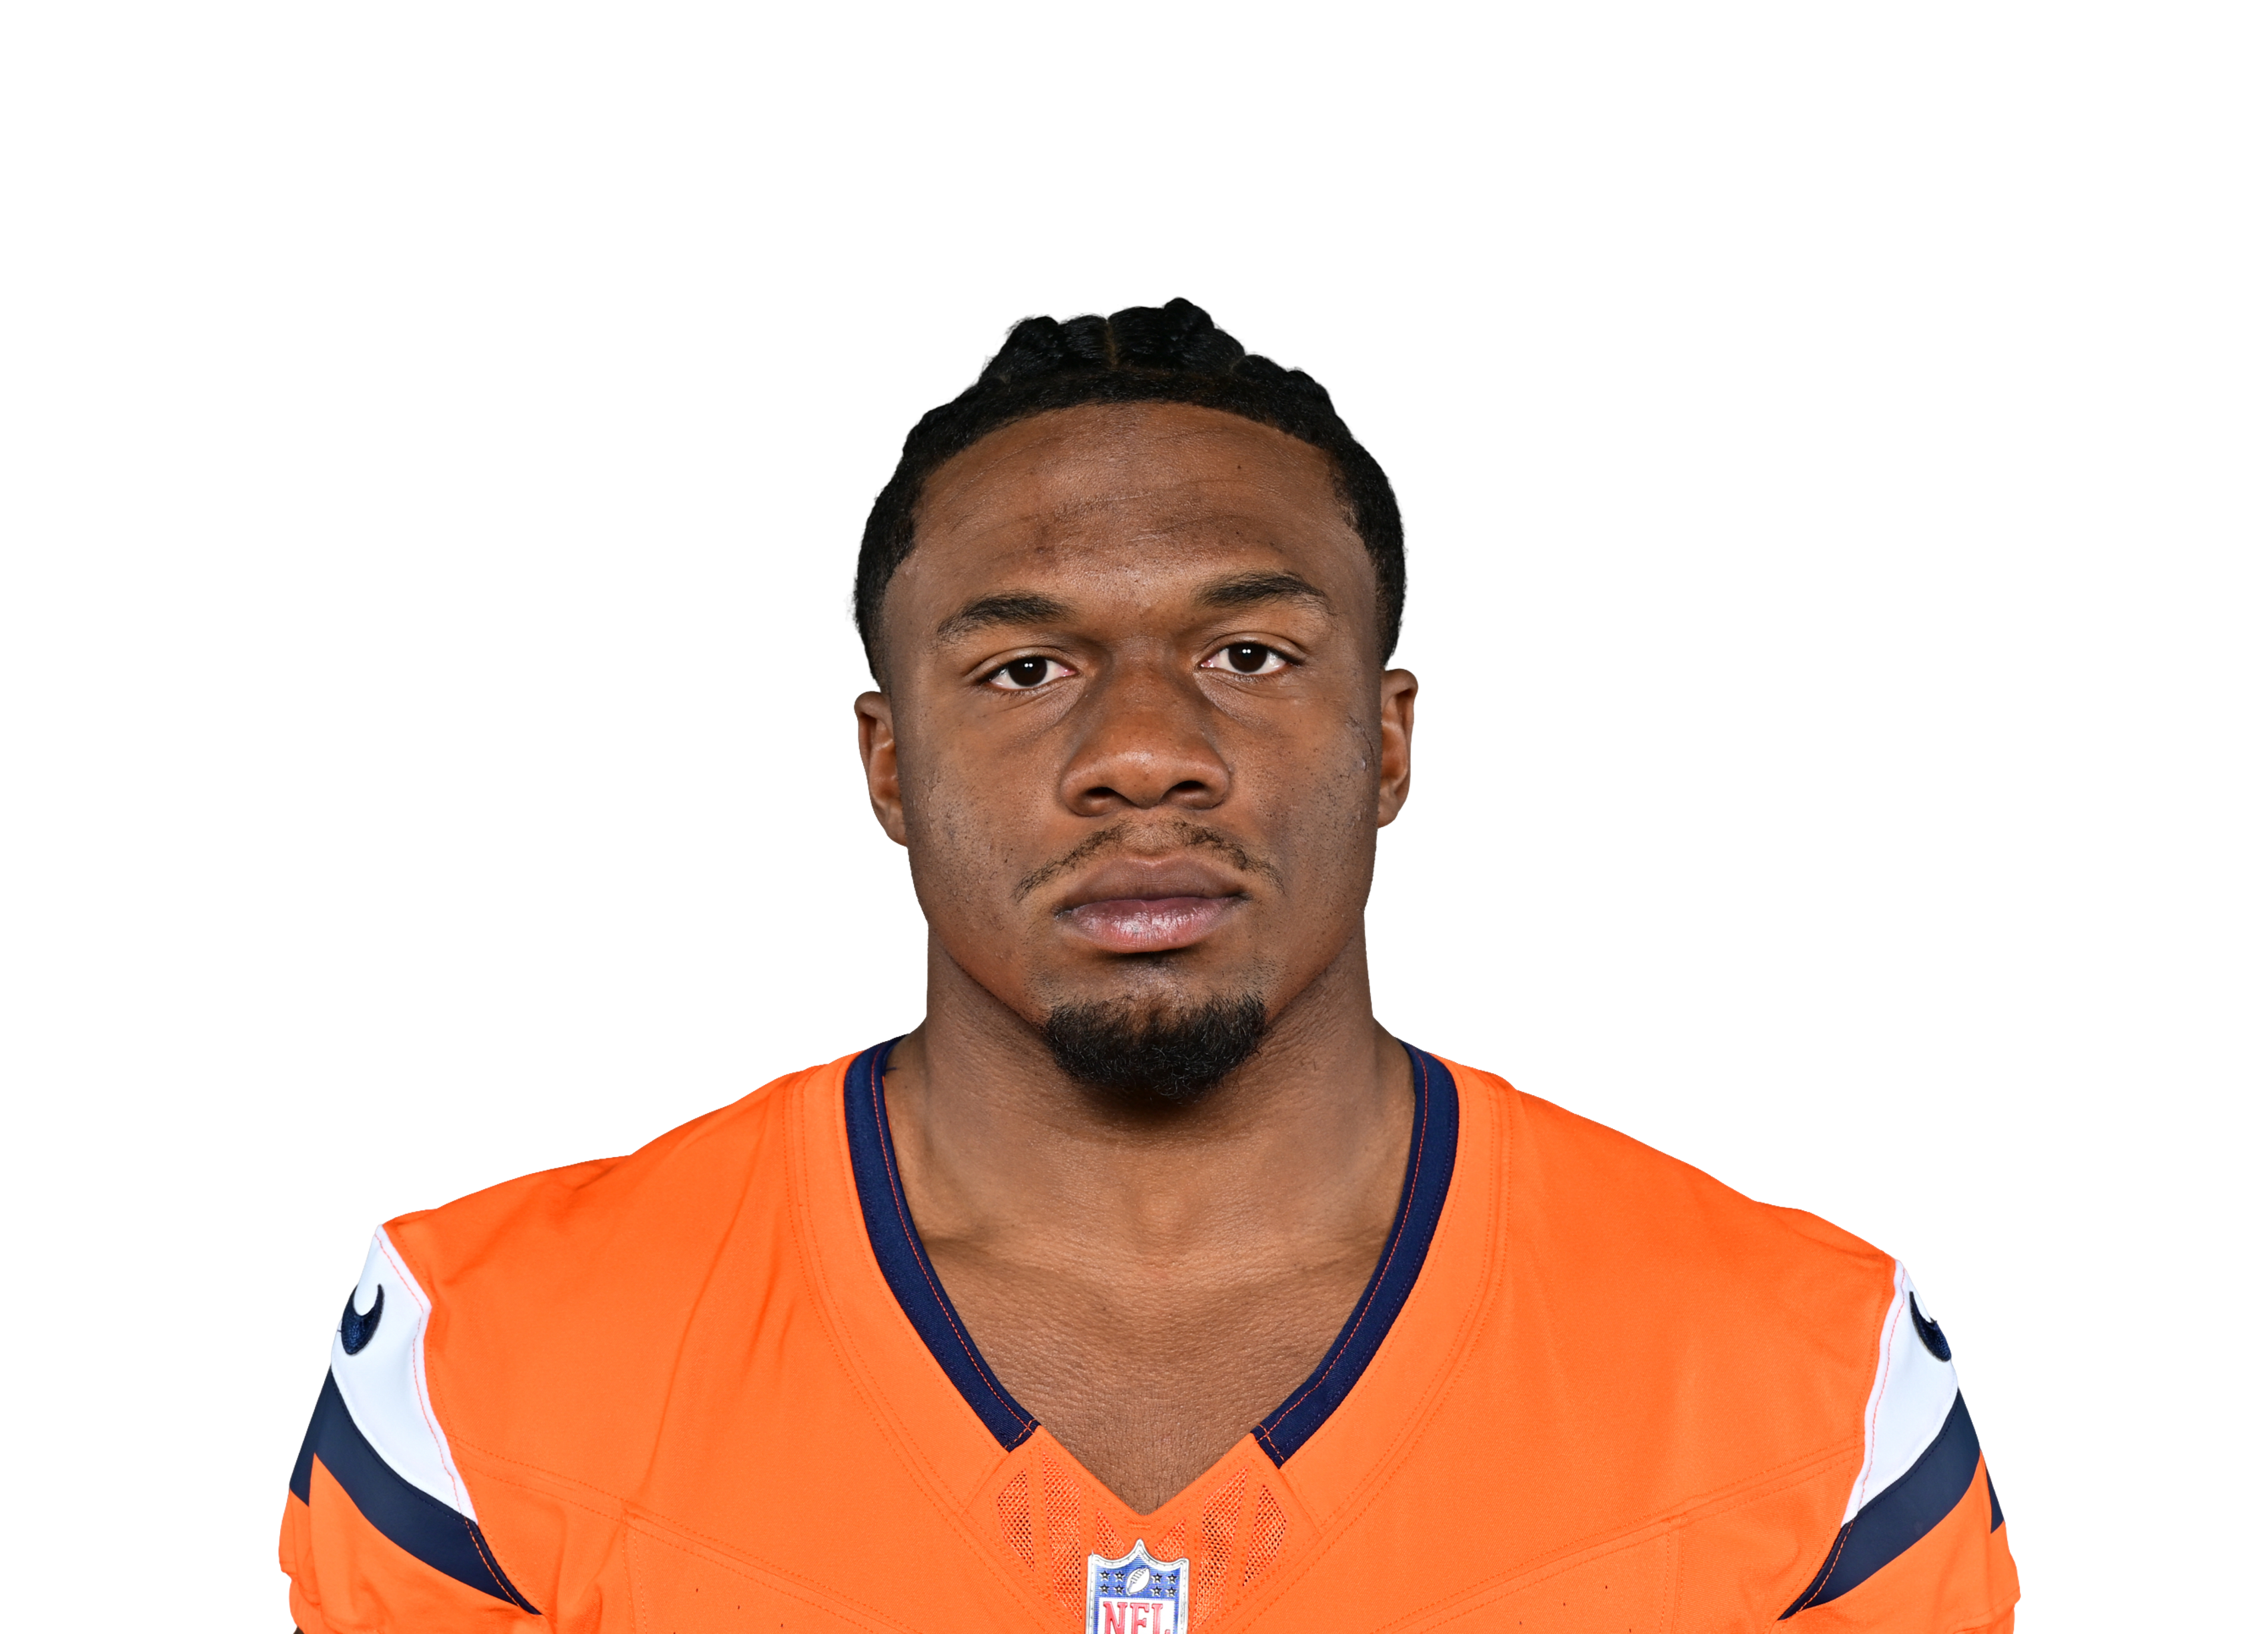 RJ Harveyvs DEN • Wk 7 | 14.0 | 3 | 6 | 0 | 2 | 54 |
 Jadarian Price@ SEA • Wk 9 | 11.8 | 9 | 24 | 0 | 4 | 54 |
 Kyren Williams@ LA • Wk 6 | 9.7 | 10 | 50 | 0 | 3 | 17 |
 Zach Charbonnet@ SEA • Wk 9 | 9.6 | 16 | 77 | 0 | 1 | 9 |
 Emanuel Wilsonvs SEA • Wk 2 | 9.2 | 21 | 92 | 0 | 0 | 0 |
 Jonah Colemanvs DEN • Wk 7 | 8.9 | 9 | 54 | 0 | 2 | 15 |
 Omarion Hampton@ LAC • Wk 1 | 8.3 | 12 | 43 | 1 | 0 | 0 |
 J.K. Dobbinsvs DEN • Wk 7 | 8.3 | 6 | 23 | 1 | 0 | 0 |
 Ronnie Riversvs LA • Wk 10 | 8.1 | 15 | 81 | 0 | 0 | 0 |
 Cam Skattebo@ NYG • Wk 4 | 7.6 | 18 | 58 | 0 | 1 | 8 |
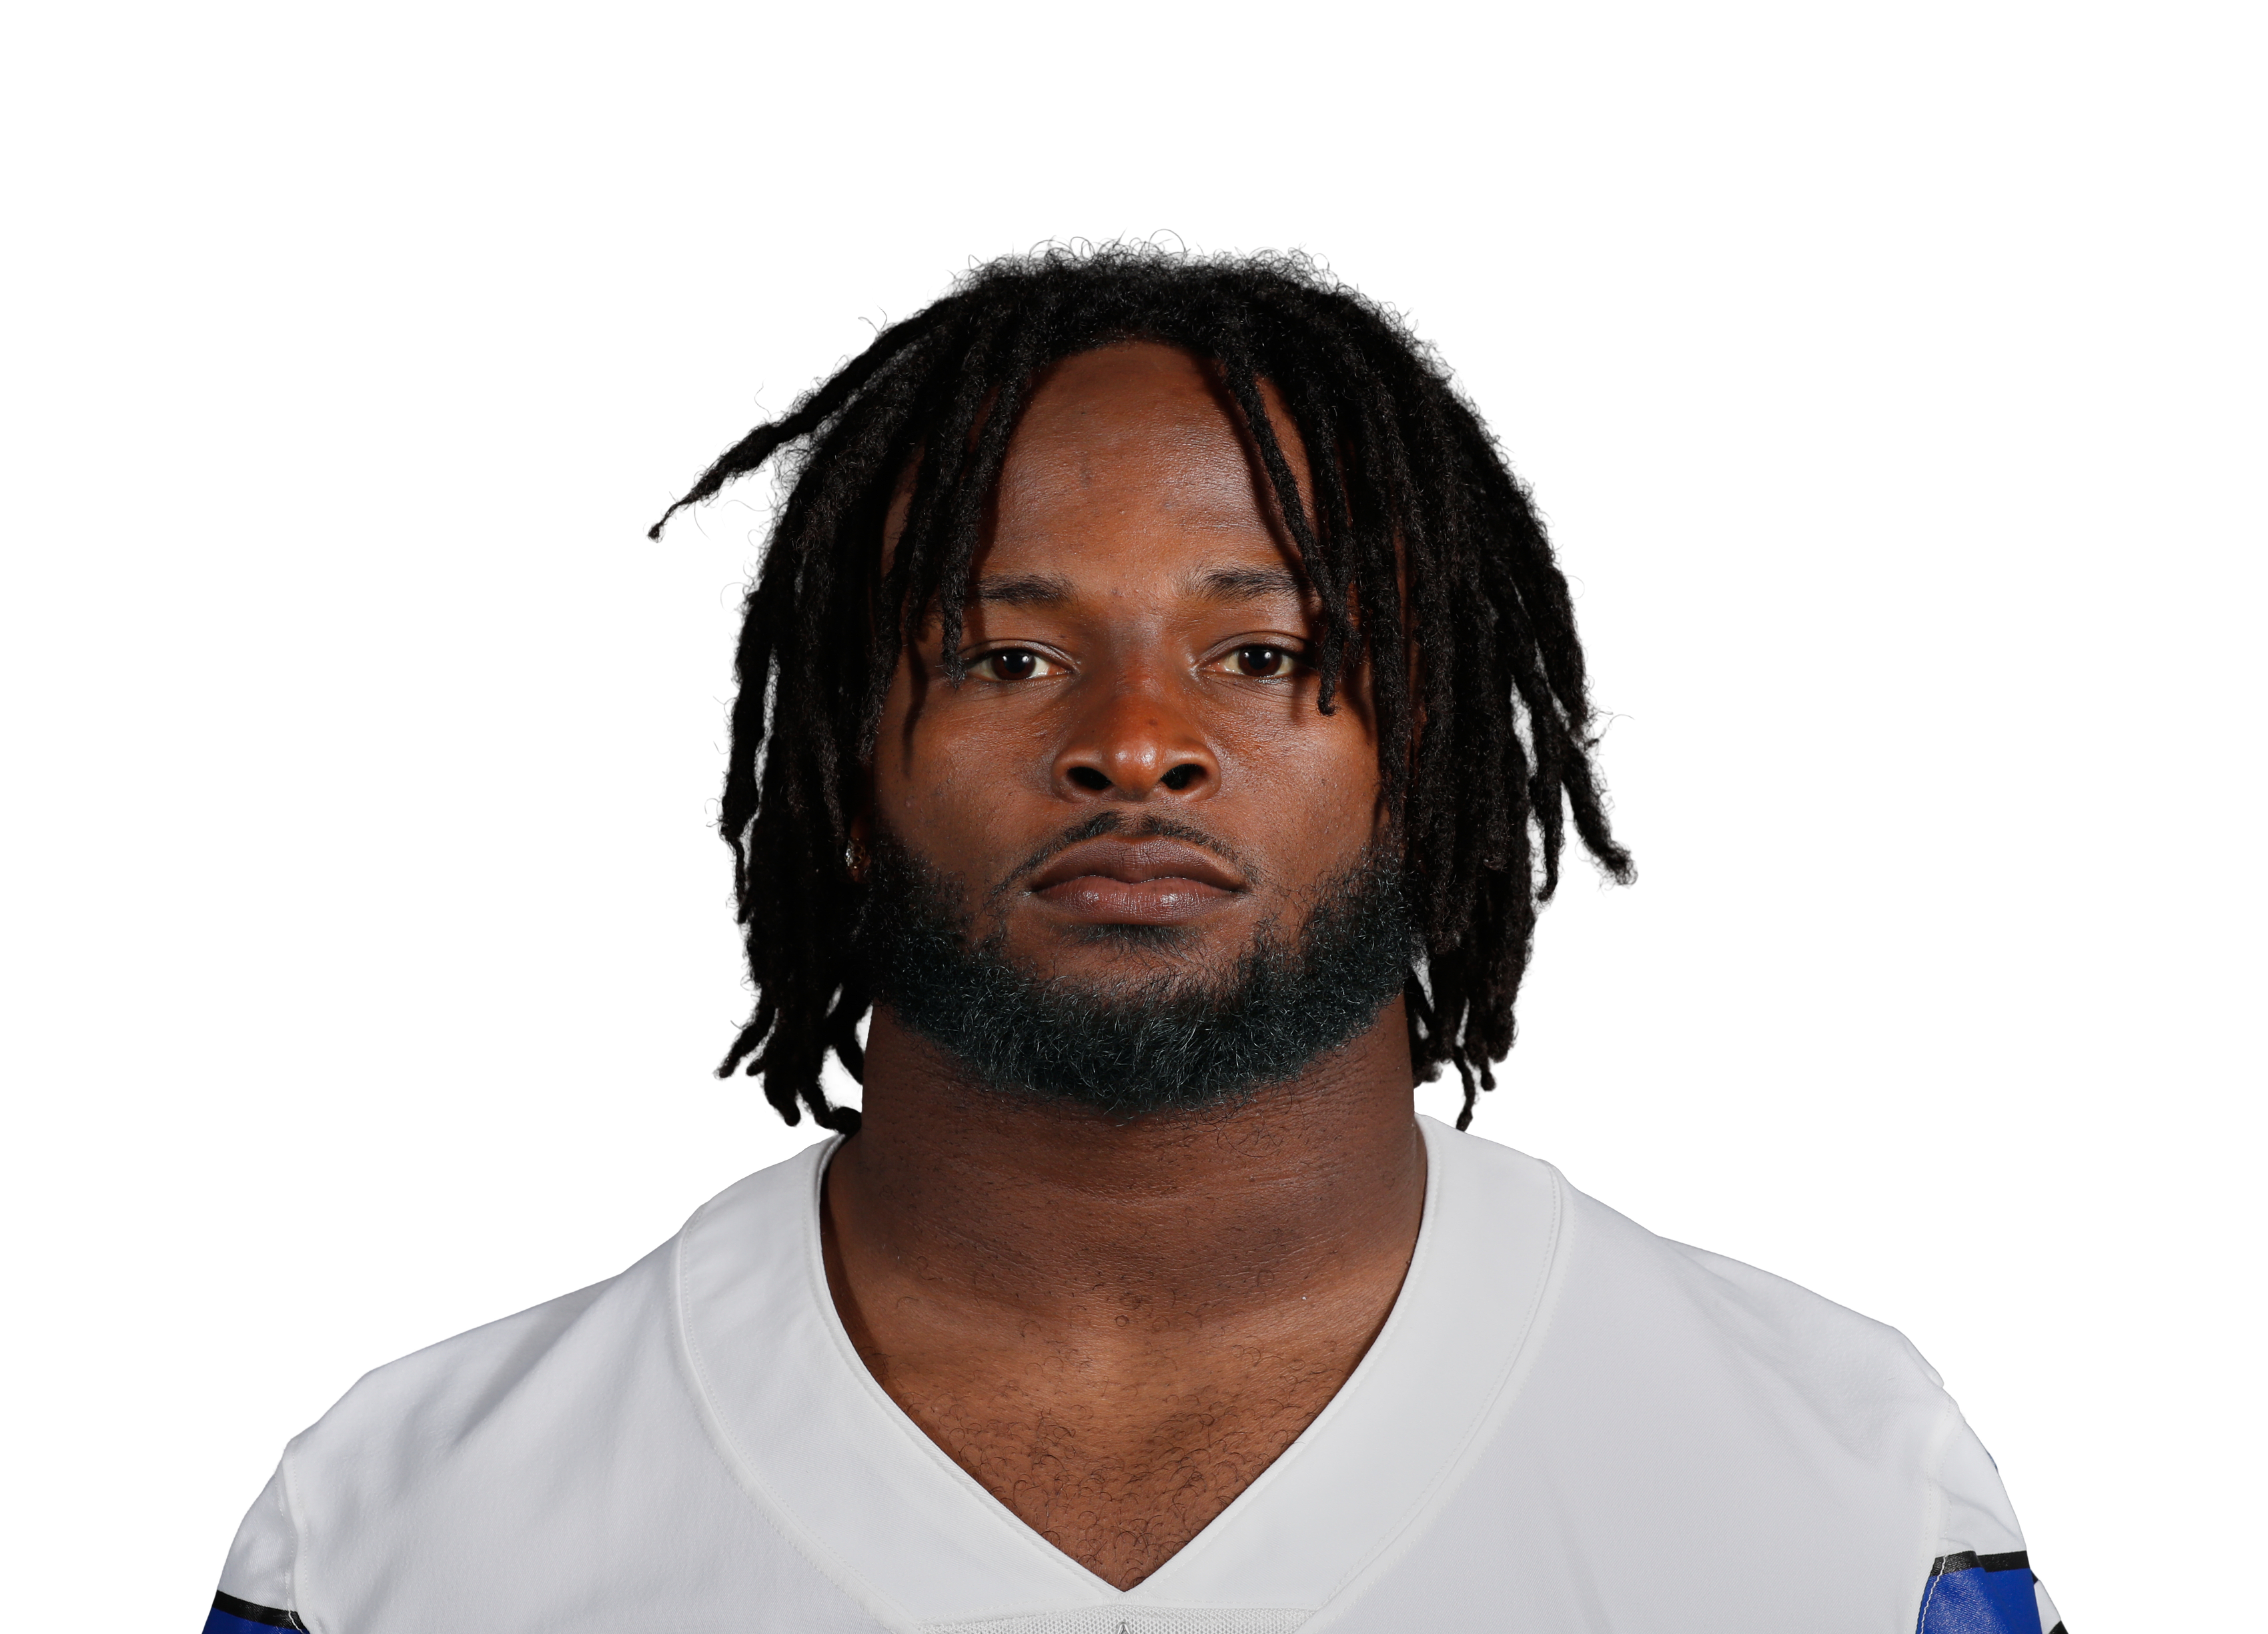 Javonte Williams@ DAL • Wk 8 | 6.7 | 24 | 56 | 0 | 1 | 1 |
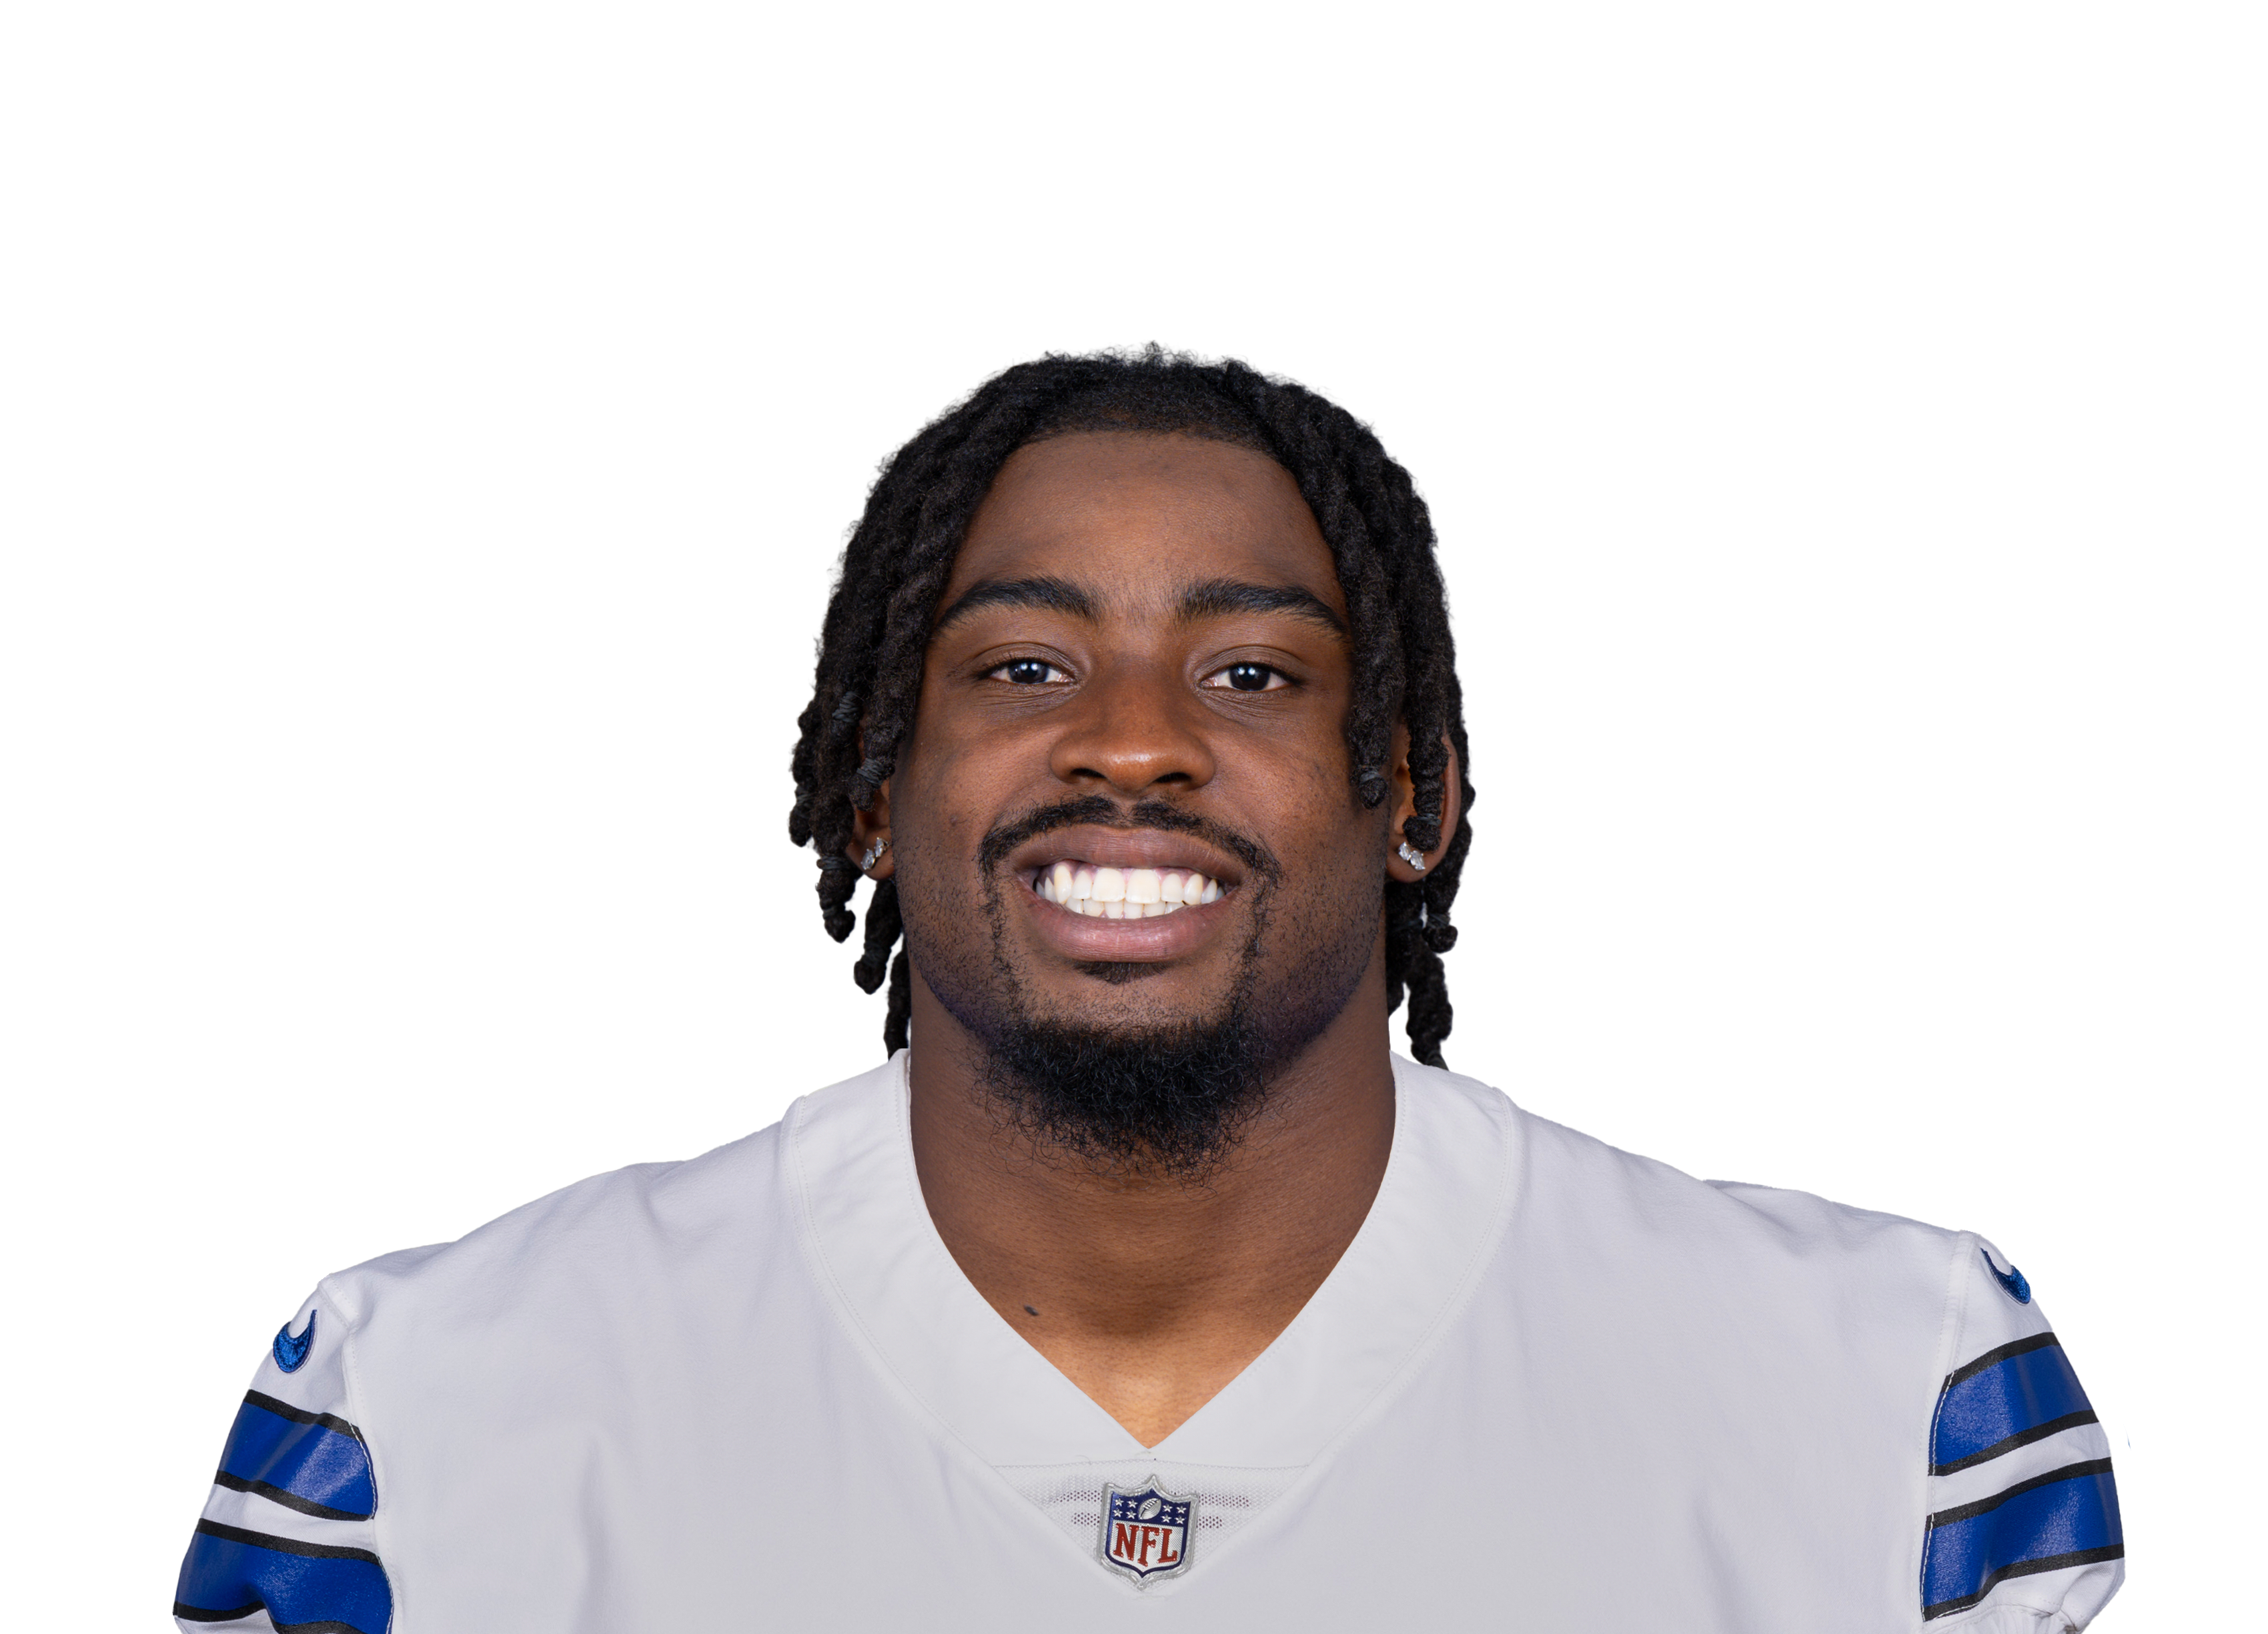 Tyler Goodson@ DAL • Wk 8 | 5.3 | 7 | 14 | 0 | 2 | 19 |
| Kyren Williamsvs LA • Wk 10 | 5.2 | 12 | 23 | 0 | 2 | 9 |
| Jadarian Pricevs SEA • Wk 2 | 5.0 | 13 | 52 | 0 | 1 | 8 |
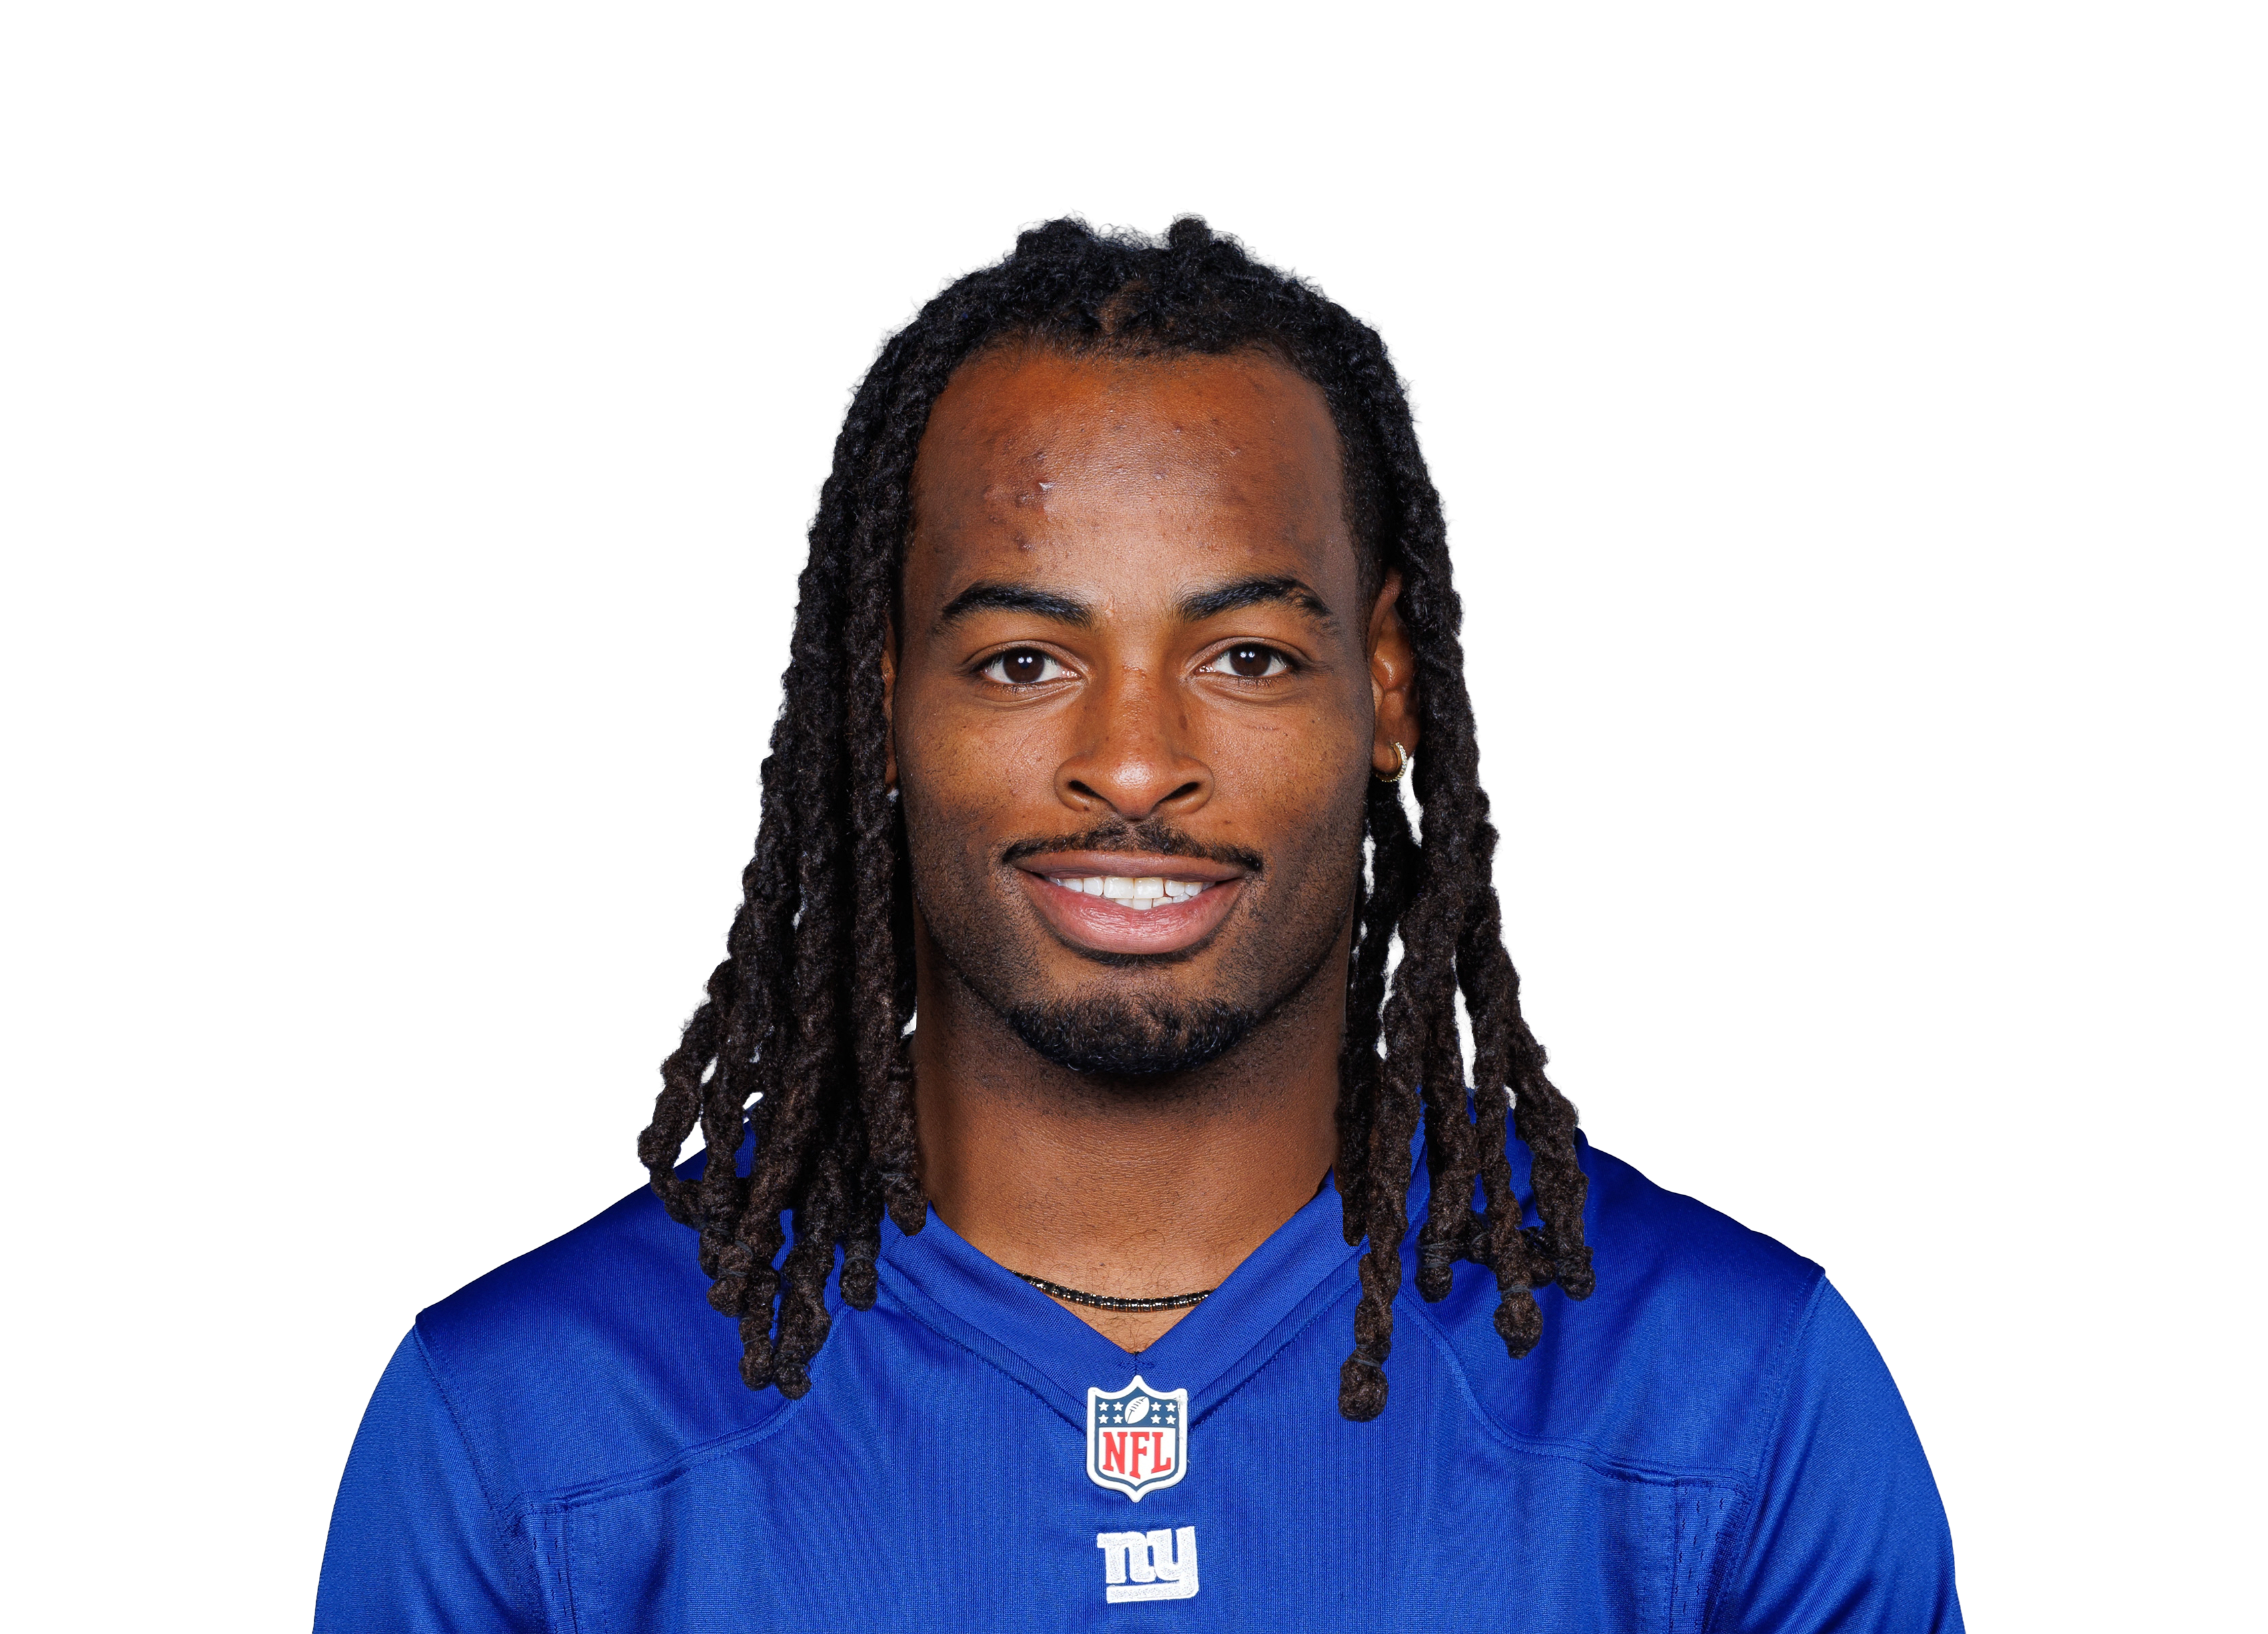 Najee Harris@ NYG • Wk 4 | 3.0 | 9 | 30 | 0 | 0 | 0 |
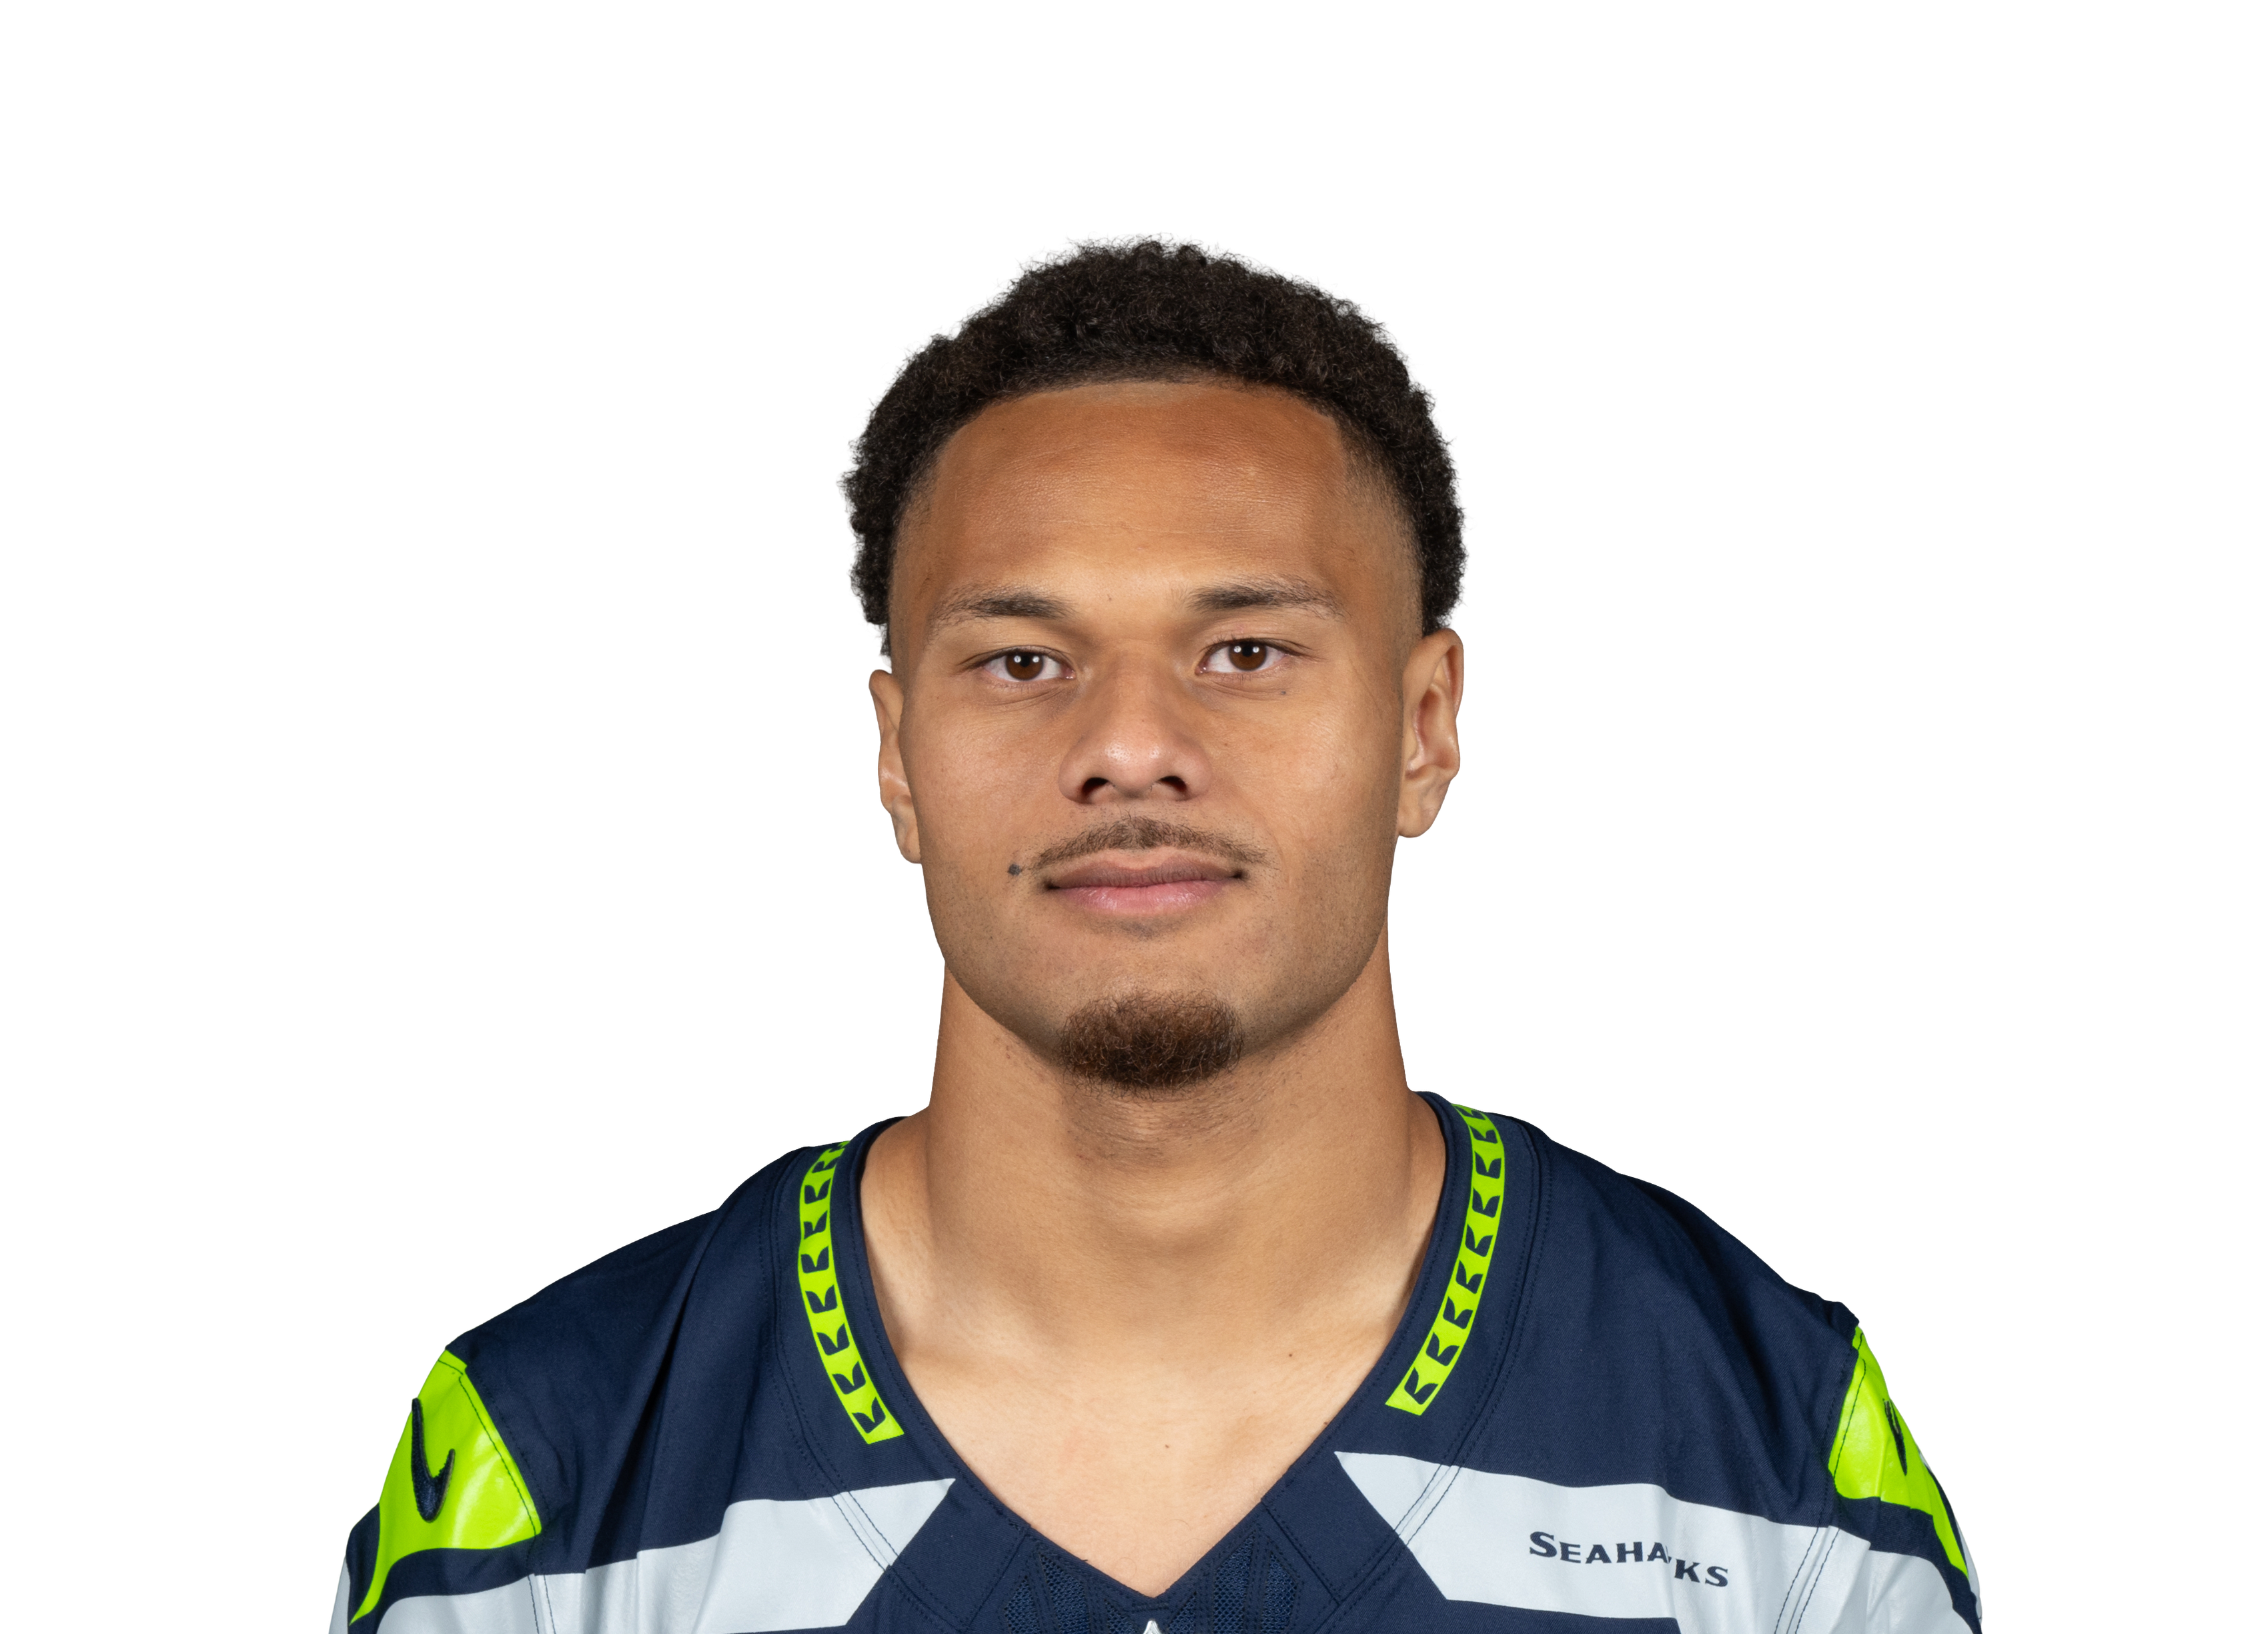 George Holanivs SEA • Wk 2 | 2.5 | 4 | 13 | 0 | 1 | 2 |
 Kaelon Black@ SF • Wk 3 | 1.7 | 4 | 17 | 0 | 0 | 0 |
 Patrick Ricard@ NYG • Wk 4 | 1.1 | 0 | 0 | 0 | 1 | 1 |
 Sione Vakivs DET • Wk 5 | 1.1 | 6 | 11 | 0 | 0 | 0 |
 Keaton Mitchell@ LAC • Wk 1 | 0.9 | 4 | 9 | 0 | 0 | 0 |
 Tyrone Tracy Jr.@ NYG • Wk 4 | -0.1 | 1 | -1 | 0 | 0 | 0 |
Fantasy points first, then the stats that matter for his position. Ring around each photo is that player's Mania Rating. Tap a name to open his profile.
| Player | W1 | W2 | W3 | W4 | W6 | W7 | W8 | W9 | W10 | Per game |
|---|---|---|---|---|---|---|---|---|---|---|
| Kenneth Walker III | 29191 yds46% touches68% snaps | 34178 yds47% touches82% snaps | 2073 yds42% touches73% snaps | 23179 yds43% touches75% snaps | 22139 yds39% touches74% snaps | 1957 yds40% touches74% snaps | 2684 yds42% touches81% snaps | 22143 yds36% touches65% snaps | — | 24.4131 yds a game • 5.4 per touch42% touches74% snaps |
| Emmett Johnson | 1068 yds16% touches36% snaps | 435 yds6% touches18% snaps | 617 yds13% touches27% snaps | 110 yds2% touches27% snaps | 624 yds11% touches30% snaps | 317 yds6% touches26% snaps | 6143 yds10% touches19% snaps | 634 yds10% touches30% snaps | 29171 yds48% touches88% snaps | 7.958 yds a game • 7.3 per touch13% touches33% snaps |
| Brashard Smith | — | 00 yds0% touches0% snaps | 14 yds2% touches8% snaps | — | — | — | — | — | — | 0.52 yds a game • 4.0 per touch1% touches4% snaps |
| Jaydn Ott | — | — | — | — | — | — | 00 yds0% touches0% snaps | 319 yds5% touches6% snaps | — | 1.510 yds a game • 6.3 per touch2% touches3% snaps |
| Nate Carter | — | — | — | — | — | — | — | — | 26 yds3% touches12% snaps | 2.06 yds a game • 3.0 per touch3% touches12% snaps |
| Ben VanSumeren | 00 yds0% touches4% snaps | — | 00 yds0% touches0% snaps | — | — | — | — | — | — | 0.00 yds a game0% touches2% snaps |
| Use | Game | Proj | PPR | Tgt | Rec | Rec Yd | Car | Rush Yd | TD | Snap |
|---|---|---|---|---|---|---|---|---|---|---|
W1 vs DEN | 11.6 | 34.1 | 6 | 3 | 18 | 23 | 173 | 2 | 68% | |
W2 vs IND | 19.0 | 23.8 | 10 | 6 | 61 | 24 | 117 | 0 | 82% | |
W3 vs MIA | 21.5 | 21.3 | 2 | 2 | 3 | 18 | 70 | 2 | 73% | |
W4 vs LV | 19.7 | 30.9 | 1 | 1 | 2 | 22 | 177 | 2 | 75% | |
W6 vs LAC | 19.5 | 27.9 | 3 | 2 | 11 | 19 | 128 | 2 | 74% | |
W7 vs SEA | 18.7 | 9.7 | 5 | 4 | 21 | 14 | 36 | 0 | 74% | |
| W8vs DEN | 17.1 | 12.4 | 5 | 4 | 15 | 21 | 69 | 0 | 81% | |
W9 vs NYJ | 20.3 | 36.3 | 4 | 4 | 41 | 18 | 102 | 3 | 65% |
Ranked against 41 backs with at least 60 carries. Ranks account for how much work each number is based on, so a perfect record on a few plays does not beat one over a full workload. Tap a stat to see the full ranking.
Kenneth Walker III
Pick a teammate with or without. Pick more than one to combine them, like a game without the QB and without the other back.
Out (Groin) • no Week 11 Rating • Est. return Nov 26 (Week 12, ESPN)1 teammate note ▾
| Player | W1 | W2 | W3 | W4 | W6 | W7 | W8 | W9 | W10 | Per game |
|---|---|---|---|---|---|---|---|---|---|---|
| Kenneth Walker III | 29191 yds46% touches68% snaps | 34178 yds47% touches82% snaps | 2073 yds42% touches73% snaps | 23179 yds43% touches75% snaps | 22139 yds39% touches74% snaps | 1957 yds40% touches74% snaps | 2684 yds42% touches81% snaps | 22143 yds36% touches65% snaps | — | 24.4131 yds a game • 5.4 per touch42% touches74% snaps |
| Emmett Johnson | 1068 yds16% touches36% snaps | 435 yds6% touches18% snaps | 617 yds13% touches27% snaps | 110 yds2% touches27% snaps | 624 yds11% touches30% snaps | 317 yds6% touches26% snaps | 6143 yds10% touches19% snaps | 634 yds10% touches30% snaps | 29171 yds48% touches88% snaps | 7.958 yds a game • 7.3 per touch13% touches33% snaps |
| Brashard Smith | — | 00 yds0% touches0% snaps | 14 yds2% touches8% snaps | — | — | — | — | — | — | 0.52 yds a game • 4.0 per touch1% touches4% snaps |
| Jaydn Ott | — | — | — | — | — | — | 00 yds0% touches0% snaps | 319 yds5% touches6% snaps | — | 1.510 yds a game • 6.3 per touch2% touches3% snaps |
| Nate Carter | — | — | — | — | — | — | — | — | 26 yds3% touches12% snaps | 2.06 yds a game • 3.0 per touch3% touches12% snaps |
| Ben VanSumeren | 00 yds0% touches4% snaps | — | 00 yds0% touches0% snaps | — | — | — | — | — | — | 0.00 yds a game0% touches2% snaps |
| Use | Game | Proj | PPR | Tgt | Rec | Rec Yd | Car | Rush Yd | TD | Snap |
|---|---|---|---|---|---|---|---|---|---|---|
| W1vs DEN | 11.6 | 34.1 | 6 | 3 | 18 | 23 | 173 | 2 | 68% | |
| W2vs IND | 19.0 | 23.8 | 10 | 6 | 61 | 24 | 117 | 0 | 82% | |
| W3vs MIA | 21.5 | 21.3 | 2 | 2 | 3 | 18 | 70 | 2 | 73% | |
| W4vs LV | 19.7 | 30.9 | 1 | 1 | 2 | 22 | 177 | 2 | 75% | |
| W6vs LAC | 19.5 | 27.9 | 3 | 2 | 11 | 19 | 128 | 2 | 74% | |
| W7vs SEA | 18.7 | 9.7 | 5 | 4 | 21 | 14 | 36 | 0 | 74% | |
| W8vs DEN | 17.1 | 12.4 | 5 | 4 | 15 | 21 | 69 | 0 | 81% | |
| W9vs NYJ | 20.3 | 36.3 | 4 | 4 | 41 | 18 | 102 | 3 | 65% |
Ranked against 41 backs with at least 60 carries. Ranks account for how much work each number is based on, so a perfect record on a few plays does not beat one over a full workload. Tap a stat to see the full ranking.
22.2 PPR points a game allowed to running backs, 14th most of 32 defenses.
| Player | PPR | Rush | Rush Yd | Rush TD | Rec | Rec Yd |
|---|---|---|---|---|---|---|
| Jahmyr Gibbsvs DET • Wk 5 | 37.7 | 25 | 151 | 2 | 5 | 56 |
| Christian McCaffrey@ SF • Wk 3 | 21.6 | 15 | 75 | 1 | 4 | 41 |
| Blake Corumvs LA • Wk 10 | 20.9 | 17 | 100 | 1 | 3 | 19 |
| Blake Corum@ LA • Wk 6 | 14.0 | 9 | 42 | 0 | 2 | 18 |
| RJ Harveyvs DEN • Wk 7 | 14.0 | 3 | 6 | 0 | 2 | 54 |
| Jadarian Price@ SEA • Wk 9 | 11.8 | 9 | 24 | 0 | 4 | 54 |
| Kyren Williams@ LA • Wk 6 | 9.7 | 10 | 50 | 0 | 3 | 17 |
| Zach Charbonnet@ SEA • Wk 9 | 9.6 | 16 | 77 | 0 | 1 | 9 |
| Emanuel Wilsonvs SEA • Wk 2 | 9.2 | 21 | 92 | 0 | 0 | 0 |
| Jonah Colemanvs DEN • Wk 7 | 8.9 | 9 | 54 | 0 | 2 | 15 |
| Omarion Hampton@ LAC • Wk 1 | 8.3 | 12 | 43 | 1 | 0 | 0 |
| J.K. Dobbinsvs DEN • Wk 7 | 8.3 | 6 | 23 | 1 | 0 | 0 |
| Ronnie Riversvs LA • Wk 10 | 8.1 | 15 | 81 | 0 | 0 | 0 |
| Cam Skattebo@ NYG • Wk 4 | 7.6 | 18 | 58 | 0 | 1 | 8 |
| Javonte Williams@ DAL • Wk 8 | 6.7 | 24 | 56 | 0 | 1 | 1 |
| Tyler Goodson@ DAL • Wk 8 | 5.3 | 7 | 14 | 0 | 2 | 19 |
| Kyren Williamsvs LA • Wk 10 | 5.2 | 12 | 23 | 0 | 2 | 9 |
| Jadarian Pricevs SEA • Wk 2 | 5.0 | 13 | 52 | 0 | 1 | 8 |
| Najee Harris@ NYG • Wk 4 | 3.0 | 9 | 30 | 0 | 0 | 0 |
| George Holanivs SEA • Wk 2 | 2.5 | 4 | 13 | 0 | 1 | 2 |
| Kaelon Black@ SF • Wk 3 | 1.7 | 4 | 17 | 0 | 0 | 0 |
| Patrick Ricard@ NYG • Wk 4 | 1.1 | 0 | 0 | 0 | 1 | 1 |
| Sione Vakivs DET • Wk 5 | 1.1 | 6 | 11 | 0 | 0 | 0 |
| Keaton Mitchell@ LAC • Wk 1 | 0.9 | 4 | 9 | 0 | 0 | 0 |
| Tyrone Tracy Jr.@ NYG • Wk 4 | -0.1 | 1 | -1 | 0 | 0 | 0 |
Fantasy points first, then the stats that matter for his position. Ring around each photo is that player's Mania Rating. Tap a name to open his profile.