
53.2MANIA OVERALL
MANIA RATING • DEPTH
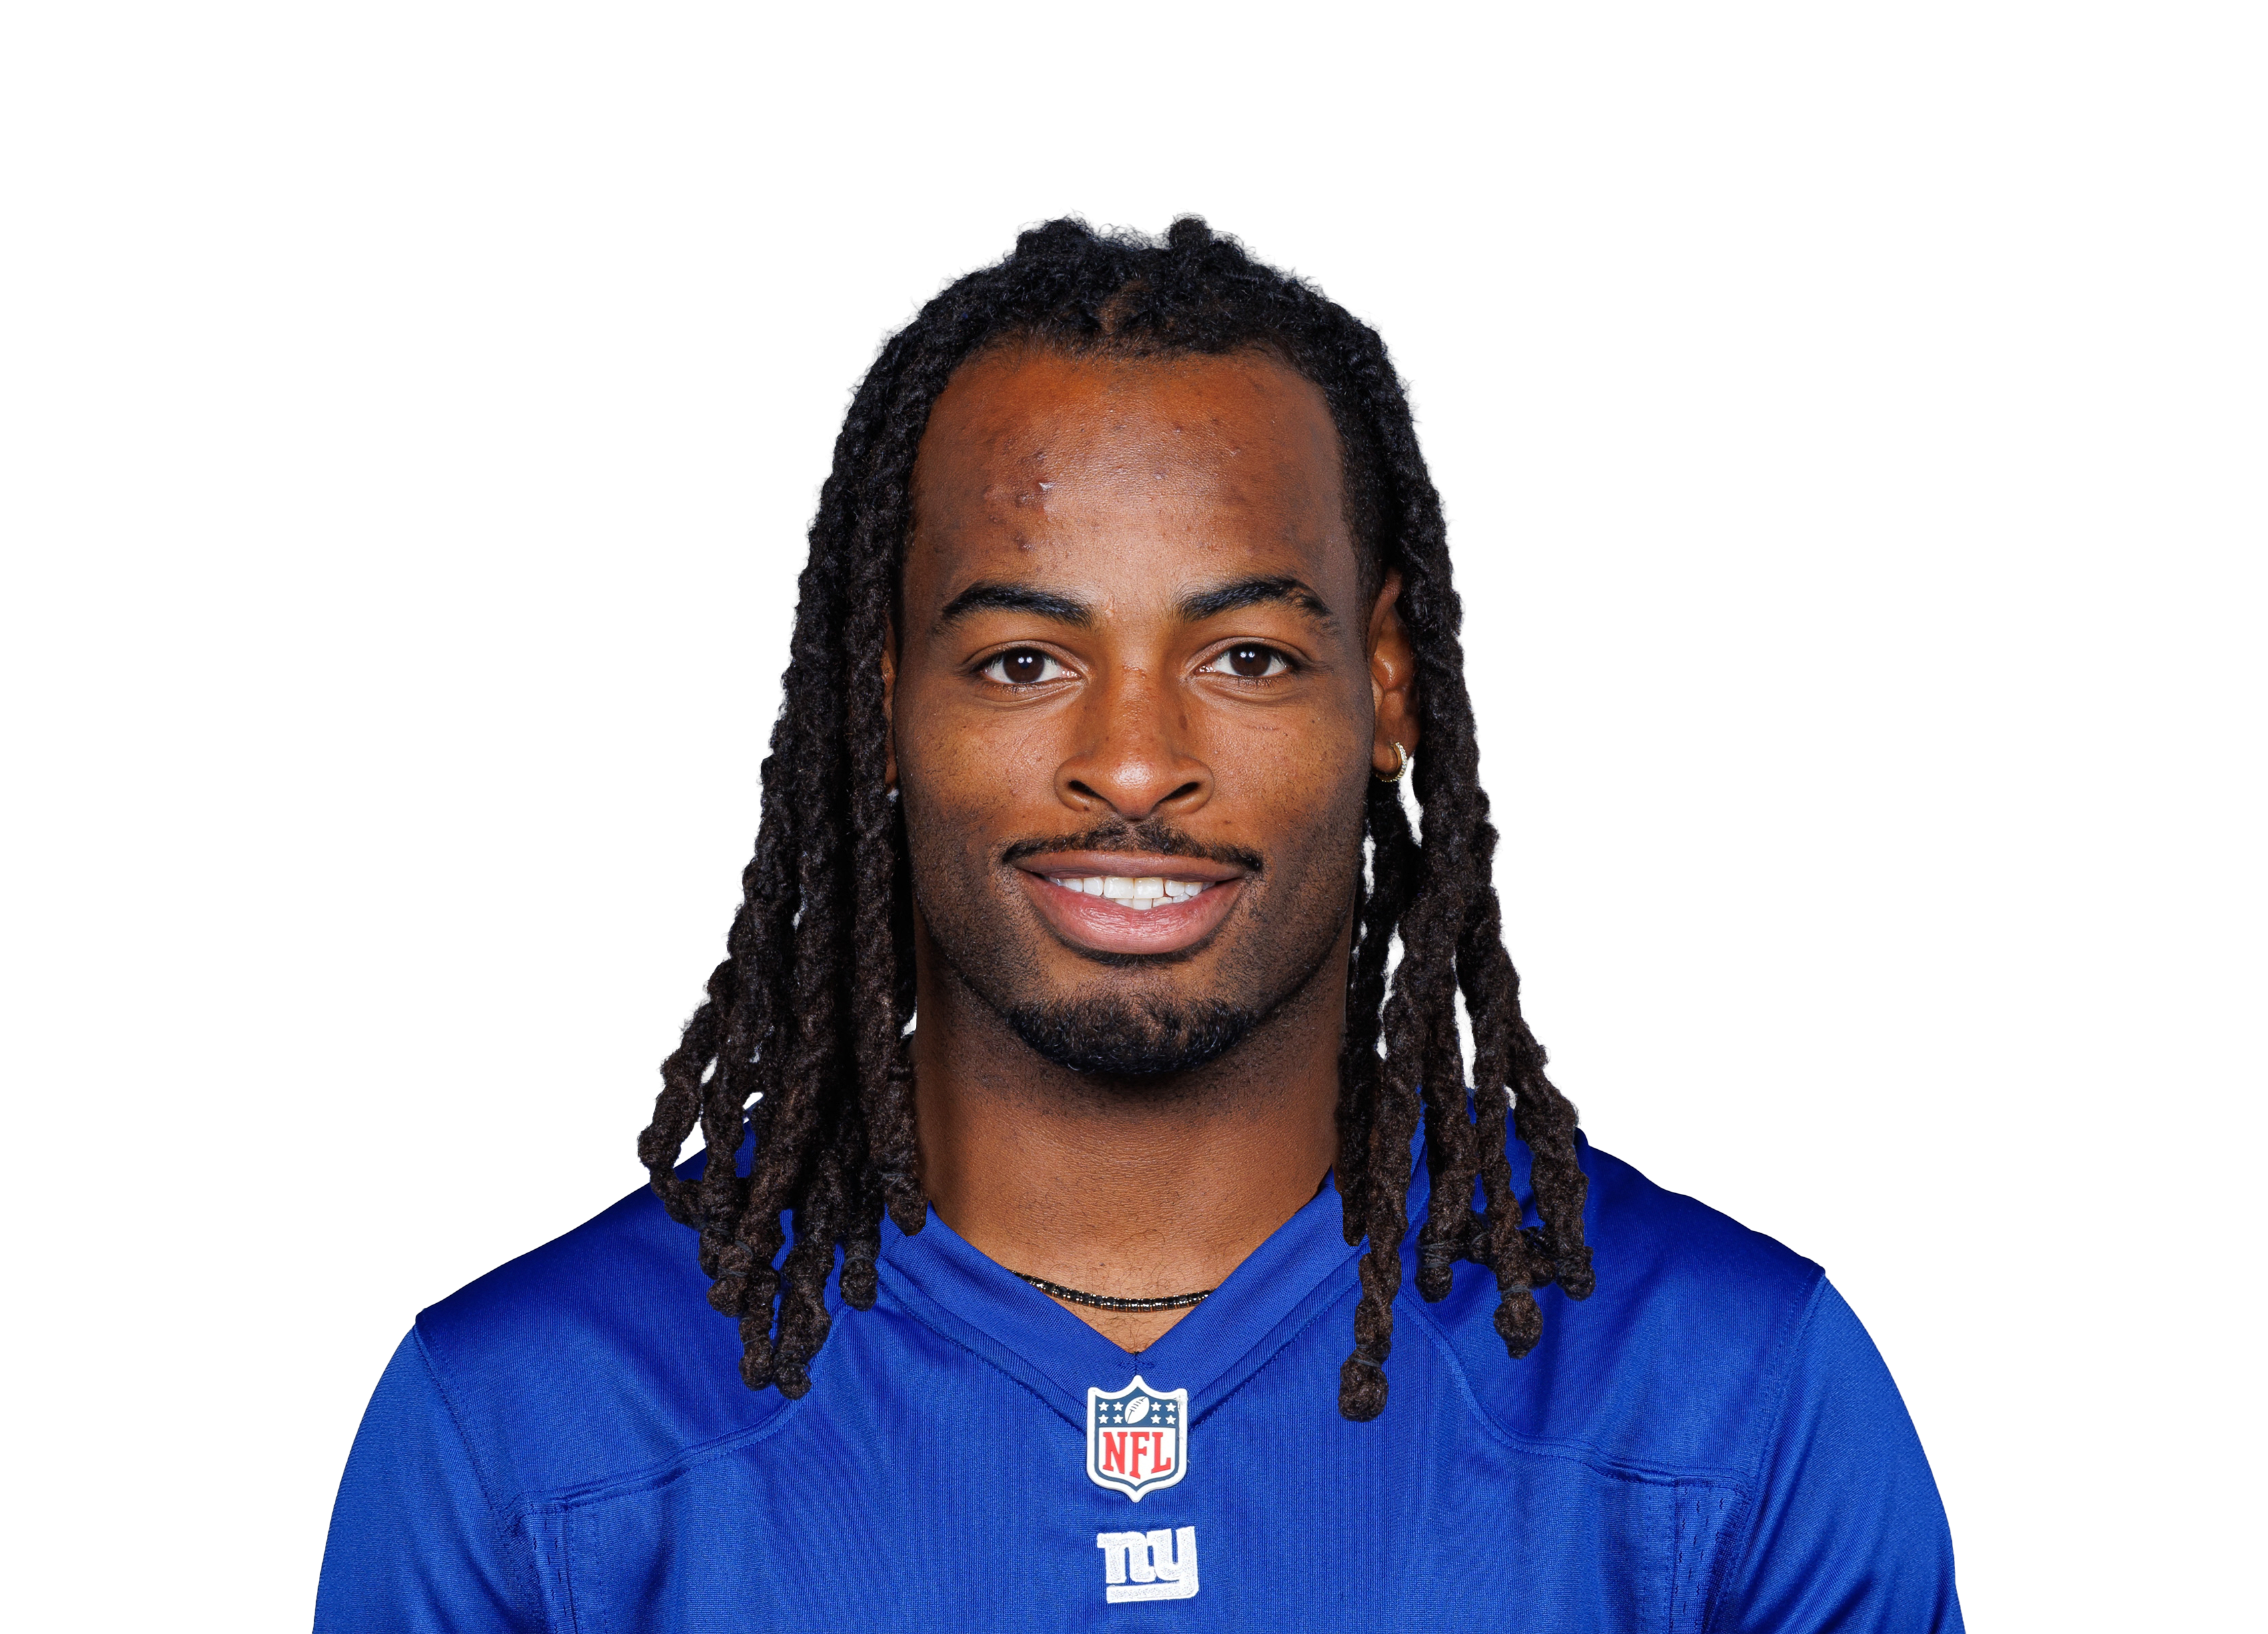
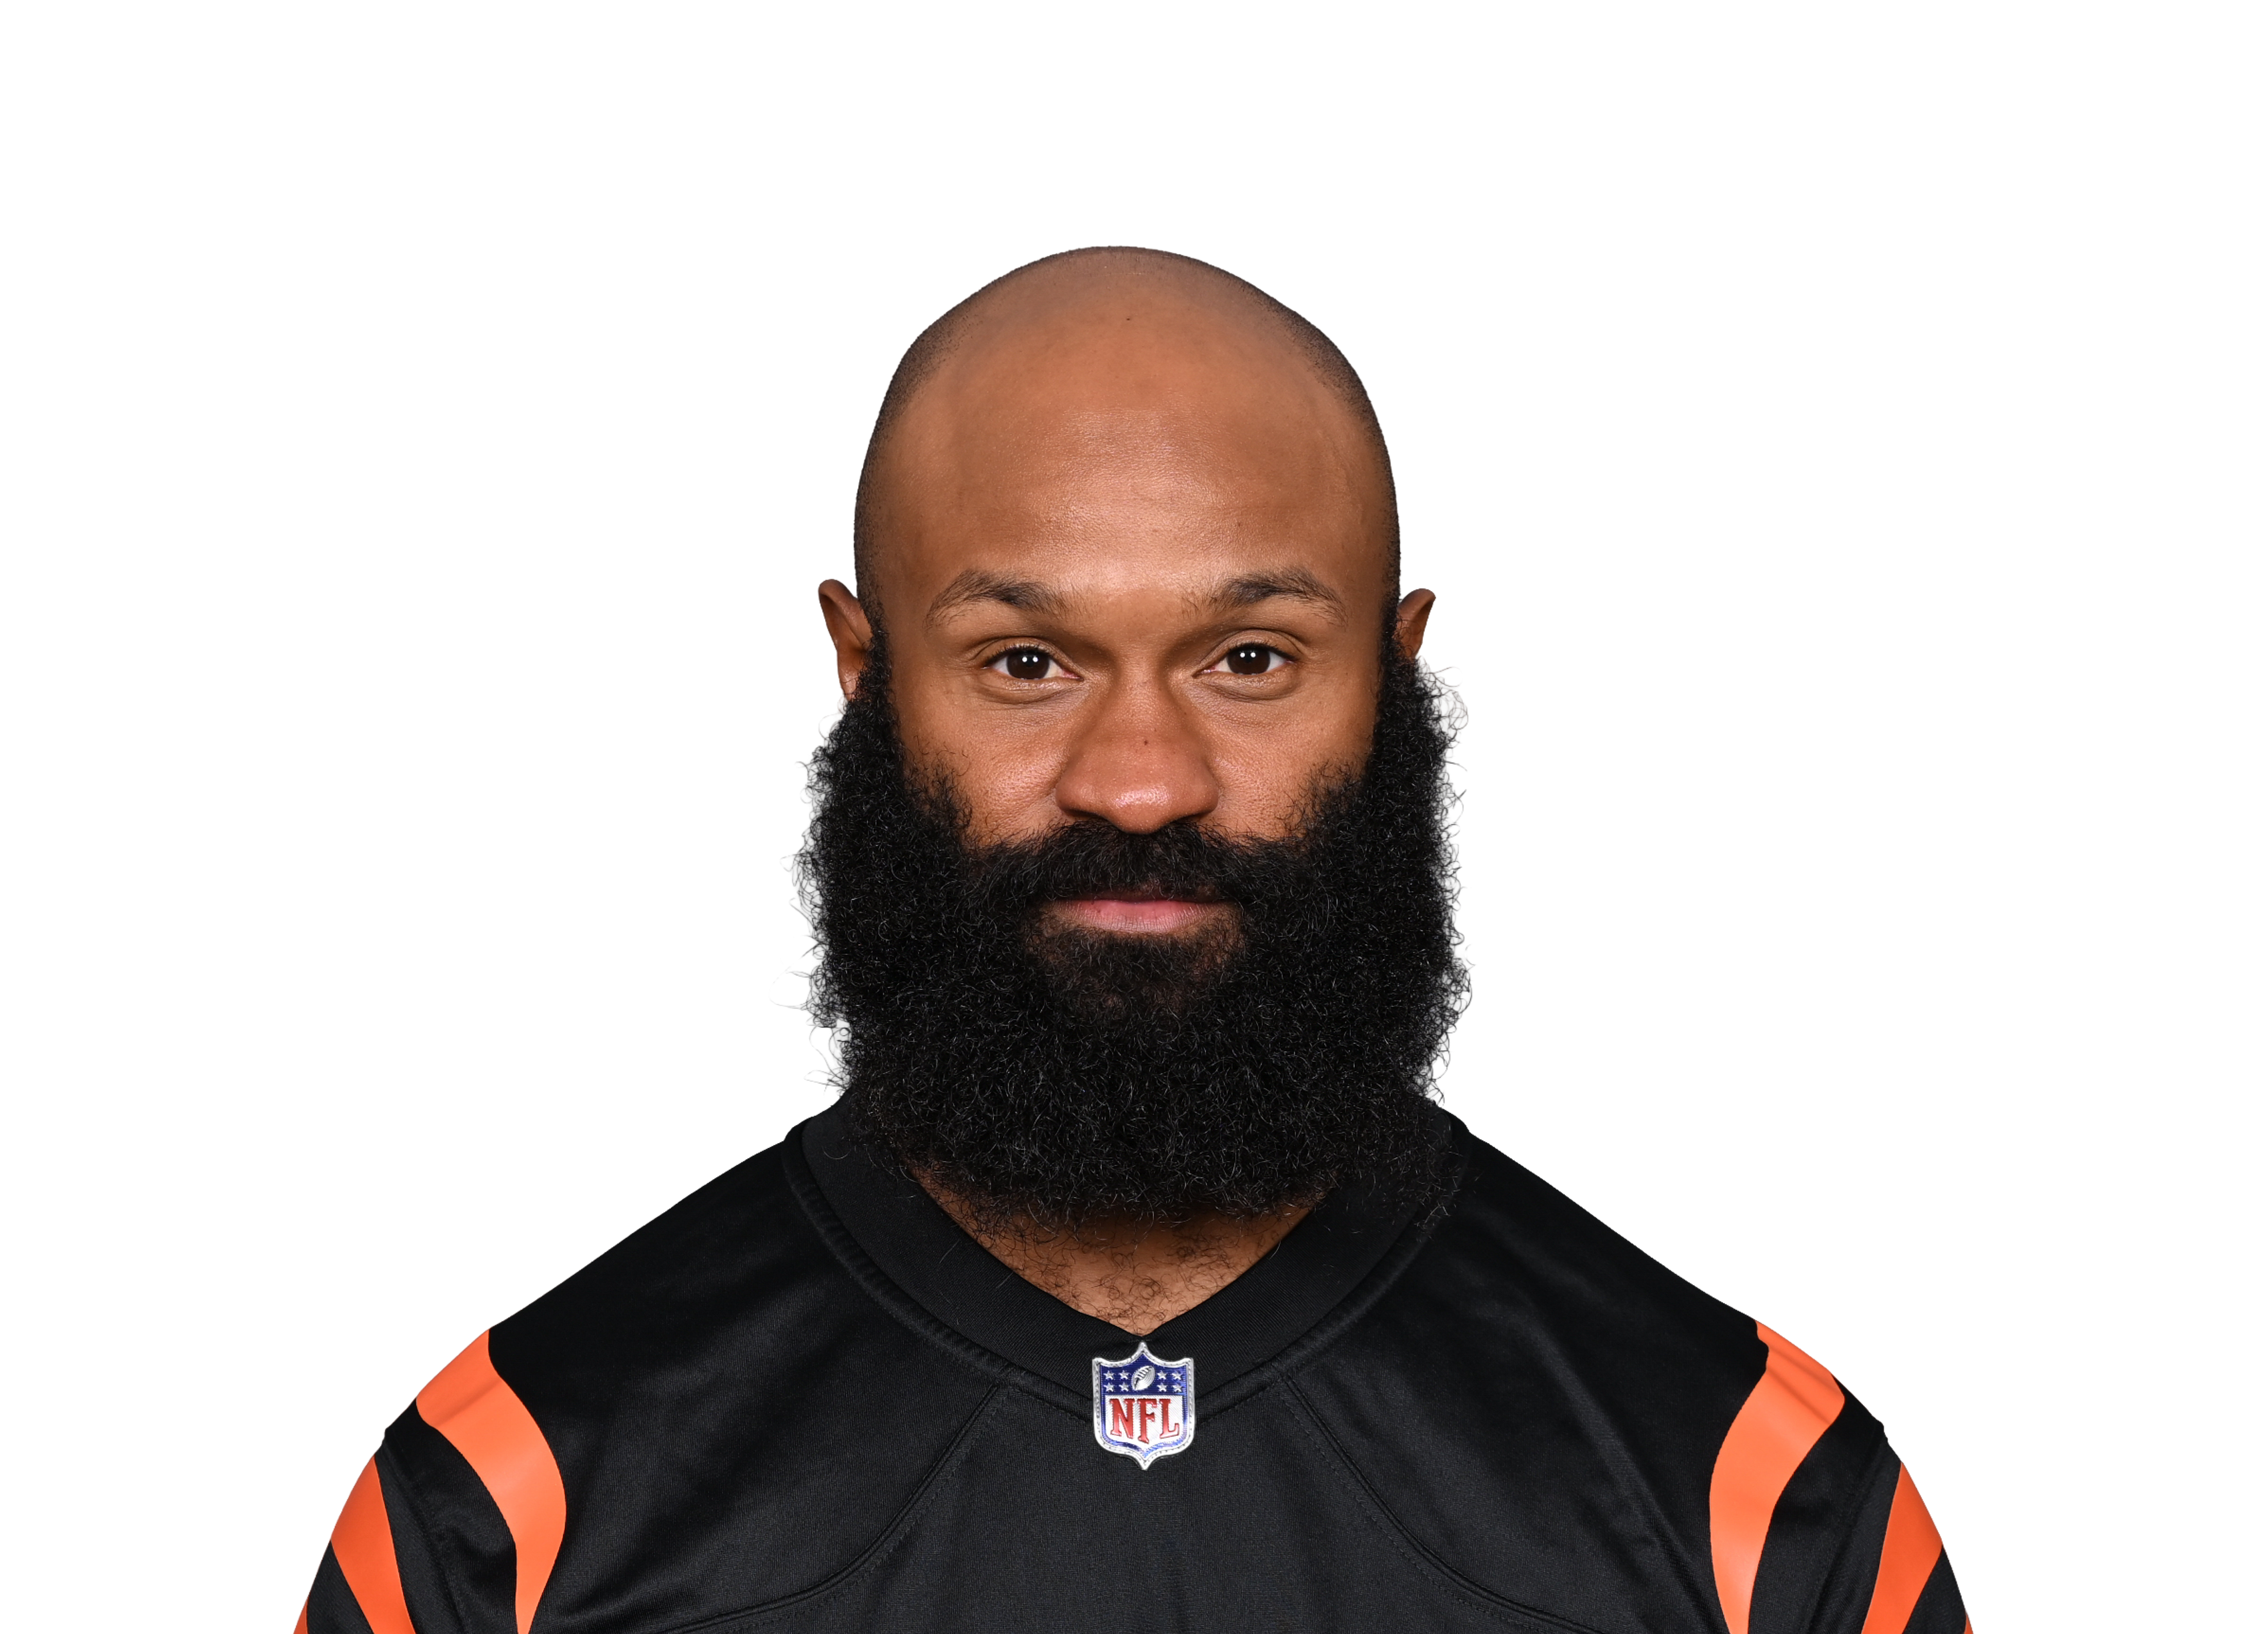
Najee Harris
 NYG • RB • 5 games
#298 OverallRB90#4 RB on NYGAge 28
54.3WEEK 11 RATINGStart value vs JAX
2.8WEEK 11 PROJECTIONPPR
11%TOUCH SHARE10th percentile
17.2%SNAP SHARE1st percentile
Games counted
Untick or tick any game and Mania Rating, matchup and Week 11 Rating all recalculate. Official Mania Rating 53.2.
Teammate injuries shift his Week 11 Rating1 teammate note ▾
Tyrone Tracy Jr. (RB, Injured reserve) +0.9 • without him that work was worth 4.6 pts vs 2.6 with (4 games)
Injury report updated Sat Nov 21, 6:30 AM ET
Week 11 Rating = recent role + opponent + the latest injury report (updated Sat Nov 21, 6:30 AM ET). Check final inactives before you set your lineup.
Mania breakdown
Fantasy Production4
Touch Volume5
Backfield Control0
Goal-Line / Red-Zone32
Per-Touch Efficiency16
Mania breakdown
Percentile among RBs. 100 is the best, 50 is average.
How many fantasy points and total yards he is actually producing, compared with players at his position. Ranks better than 4% of RBs.
How many carries and targets he gets per game compared with other running backs. Ranks better than 5% of RBs.
How much of his team backfield he owns: share of touches plus snap share. Ranks better than 0% of RBs.
Scoring-position work: red-zone carries, goal-line carries (inside the 5) and red-zone targets. Ranks better than 32% of RBs.
What he produces with each touch instead of just rewarding volume: fantasy points per touch, yards per carry and catch rate. Ranks better than 16% of RBs.
Top 30%MiddleBottom 40%Tap a category to see what it means.
Week 11 projection
2.8
projected points
Floor 0.0 · Ceiling 7.6
-0.4Game script
0.0Matchup
-0.1Injuries
Week 11 projection
NYGVSPPR
 JAX
Tough matchup • JAX is #27 in points allowed to RBs
2.8
projected pointsRushing 4.9 carries, 19 yds • Receiving 0.4 targets, 0.4 catches, 0 yds • 0.09 TD
Floor 0.04 of 5 games land hereCeiling 7.6
-0.4Game script
0.0Matchup
-0.1Injuries
How this is built
Recent and last-season usage, the Vegas spread and total, how this defense treats his position, and the injury report (teammates out, QB out). The three boxes show how many points each moved it. When sportsbook player lines are posted (Wednesday to Sunday) they are blended in, leaning on them most for new starters and players with few games. PPR scoring only. Tested on past seasons it is about 5% closer than a plain season average.
Week 11 matchup
vs JAX
Tough matchup
Adjustment-2.1 pts
Allows to RBs27th most
Week11
Week 11 matchup
vs JAX
-0.5Rating boost
Neutral matchup27th easiest of 32 defenses for RBs
ToughEasy
18.8PPR a game JAX allows to RBs
5.9Similar players, usual PPR a game
5.7Same players against JAX
Players with a role like his scored 5.7 PPR a game against JAX, versus 5.9 in their usual games (-2%). That moves his Week 11 Rating by -0.5. It is a small sample this early, so it counts for little.
How running backs did against JAX
18.8 PPR points a game allowed to running backs, 27th most of 32 defenses.
| Player | PPR | Rush | Rush Yd | Rush TD | Rec | Rec Yd |
|---|---|---|---|---|---|---|
 Tony Pollard@ TEN • Wk 10 | 23.9 | 9 | 33 | 0 | 8 | 66 |
 Chase Brown@ CIN • Wk 4 | 19.1 | 9 | 10 | 0 | 11 | 71 |
 Justice Hill@ BAL • Wk 9 | 18.2 | 9 | 85 | 1 | 3 | 7 |
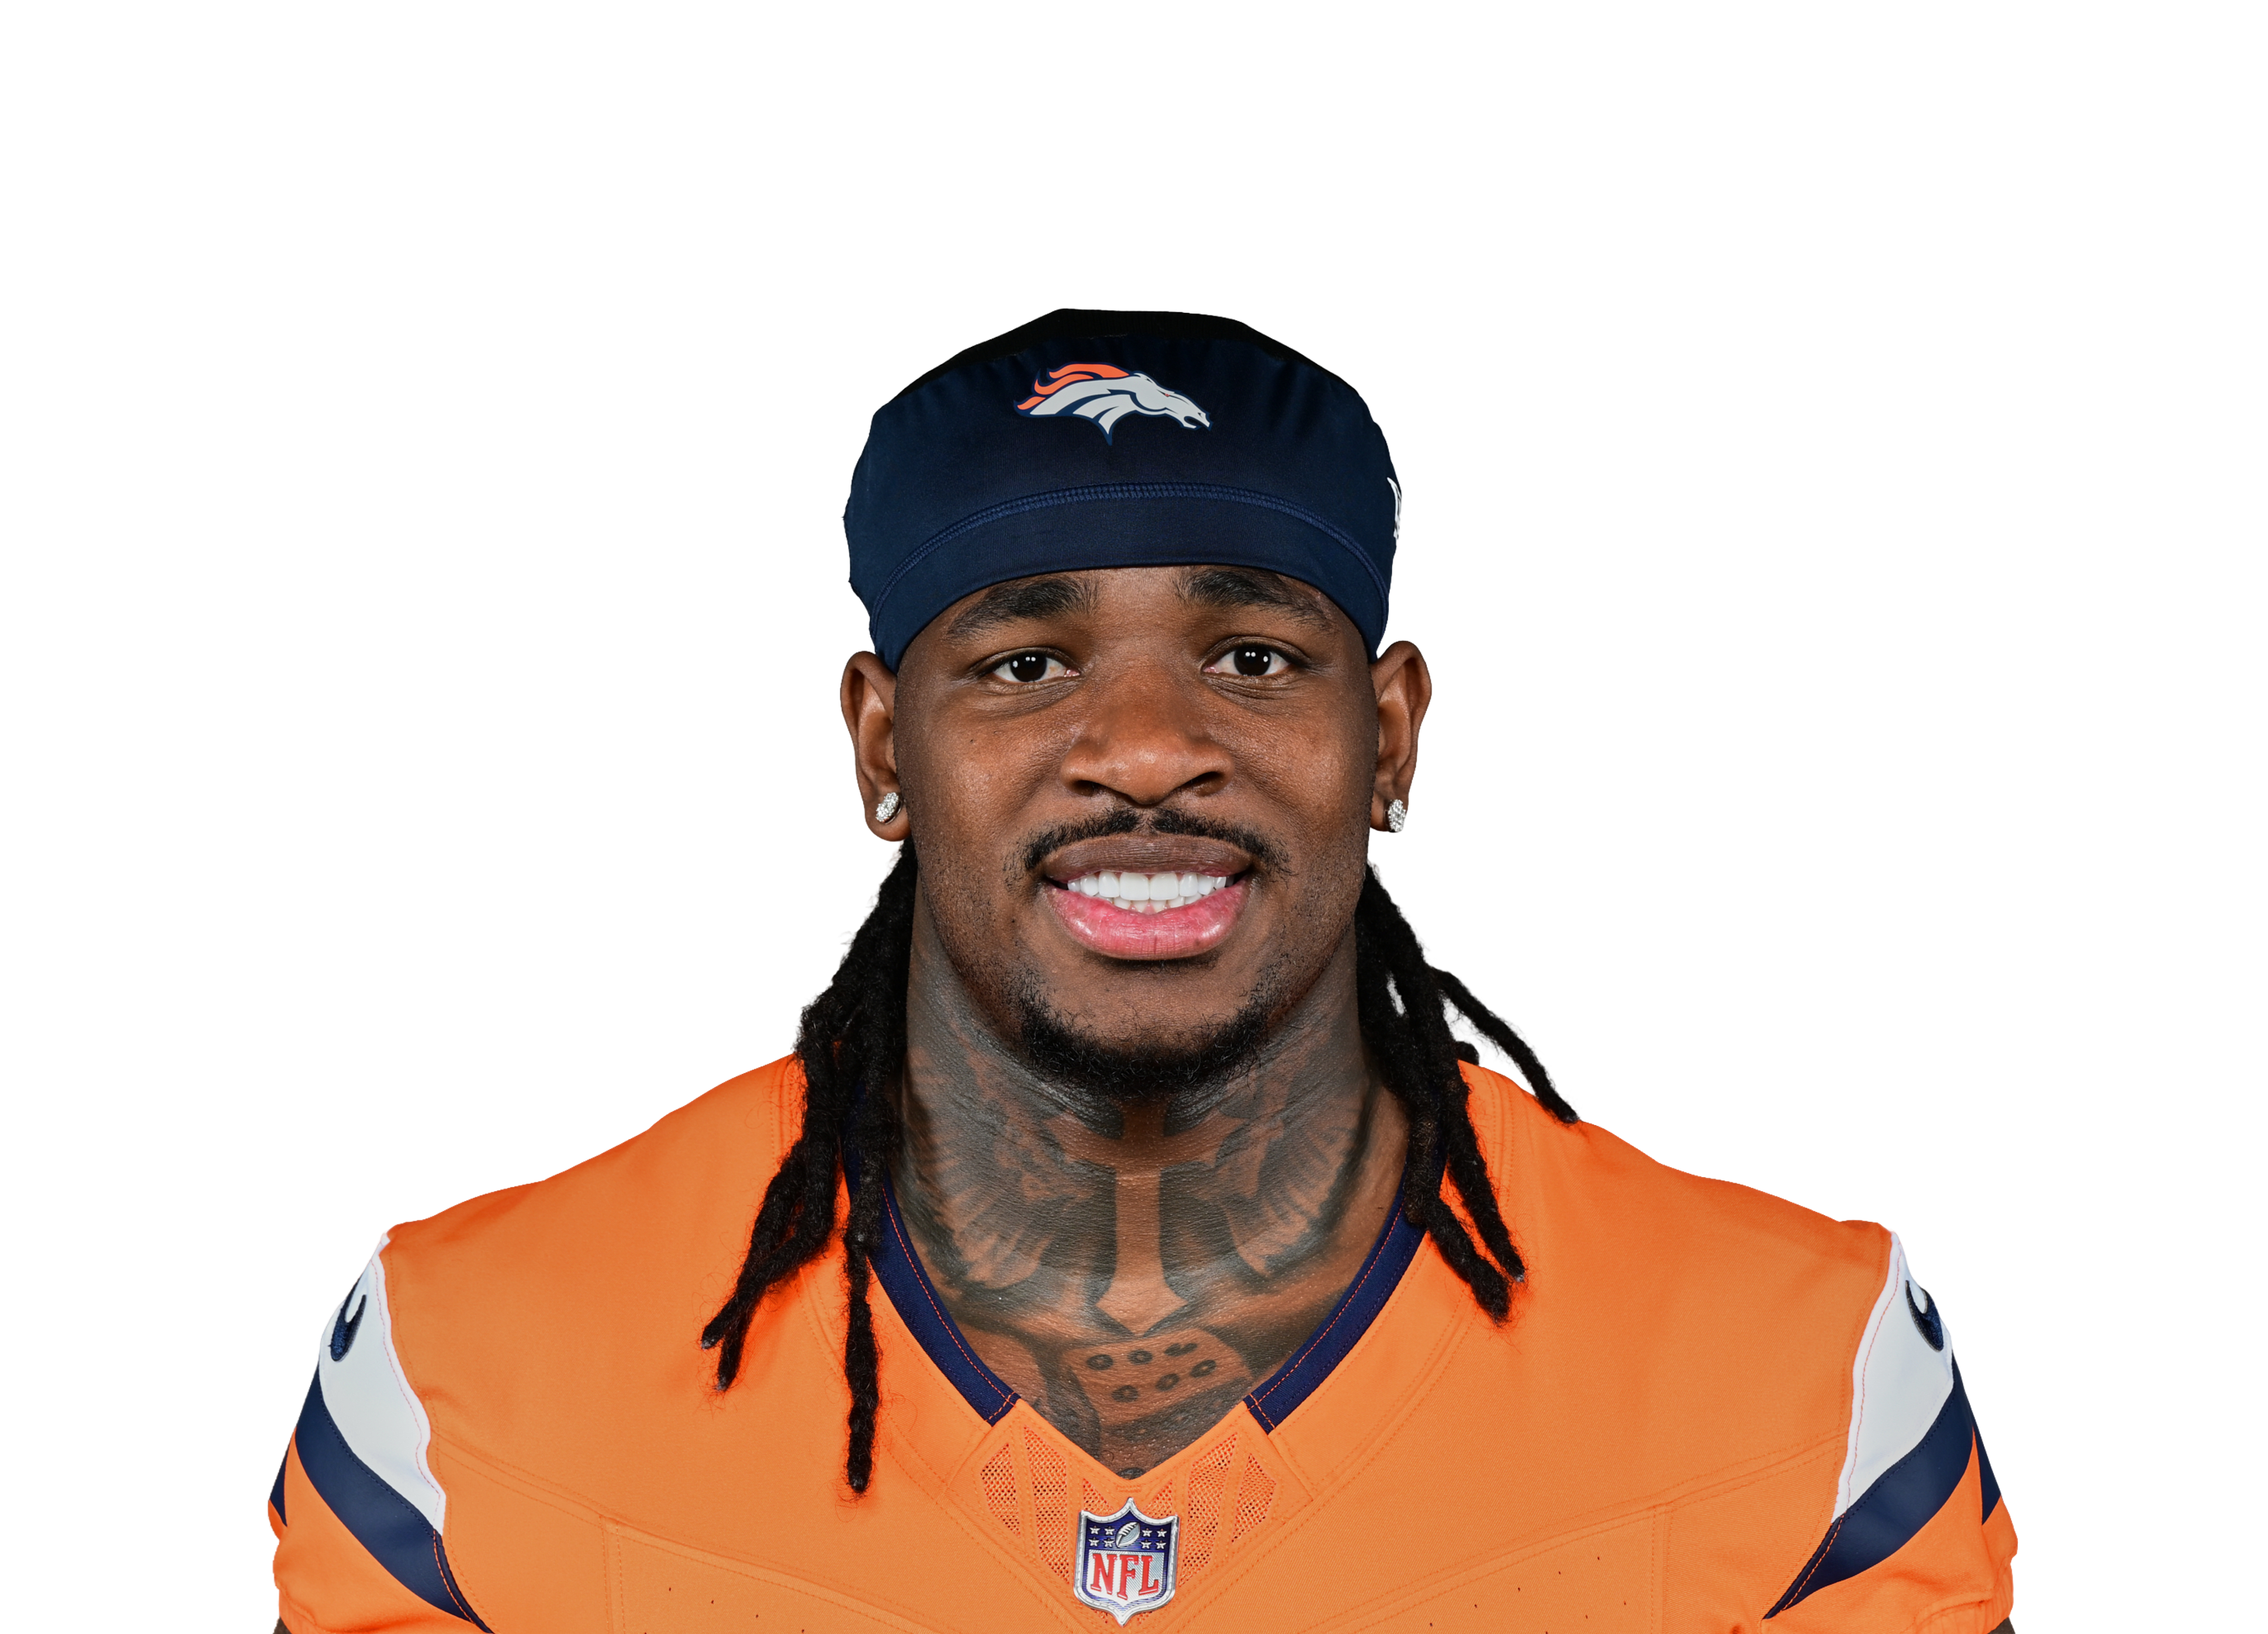 Jonah Coleman@ DEN • Wk 2 | 14.8 | 10 | 39 | 1 | 3 | 19 |
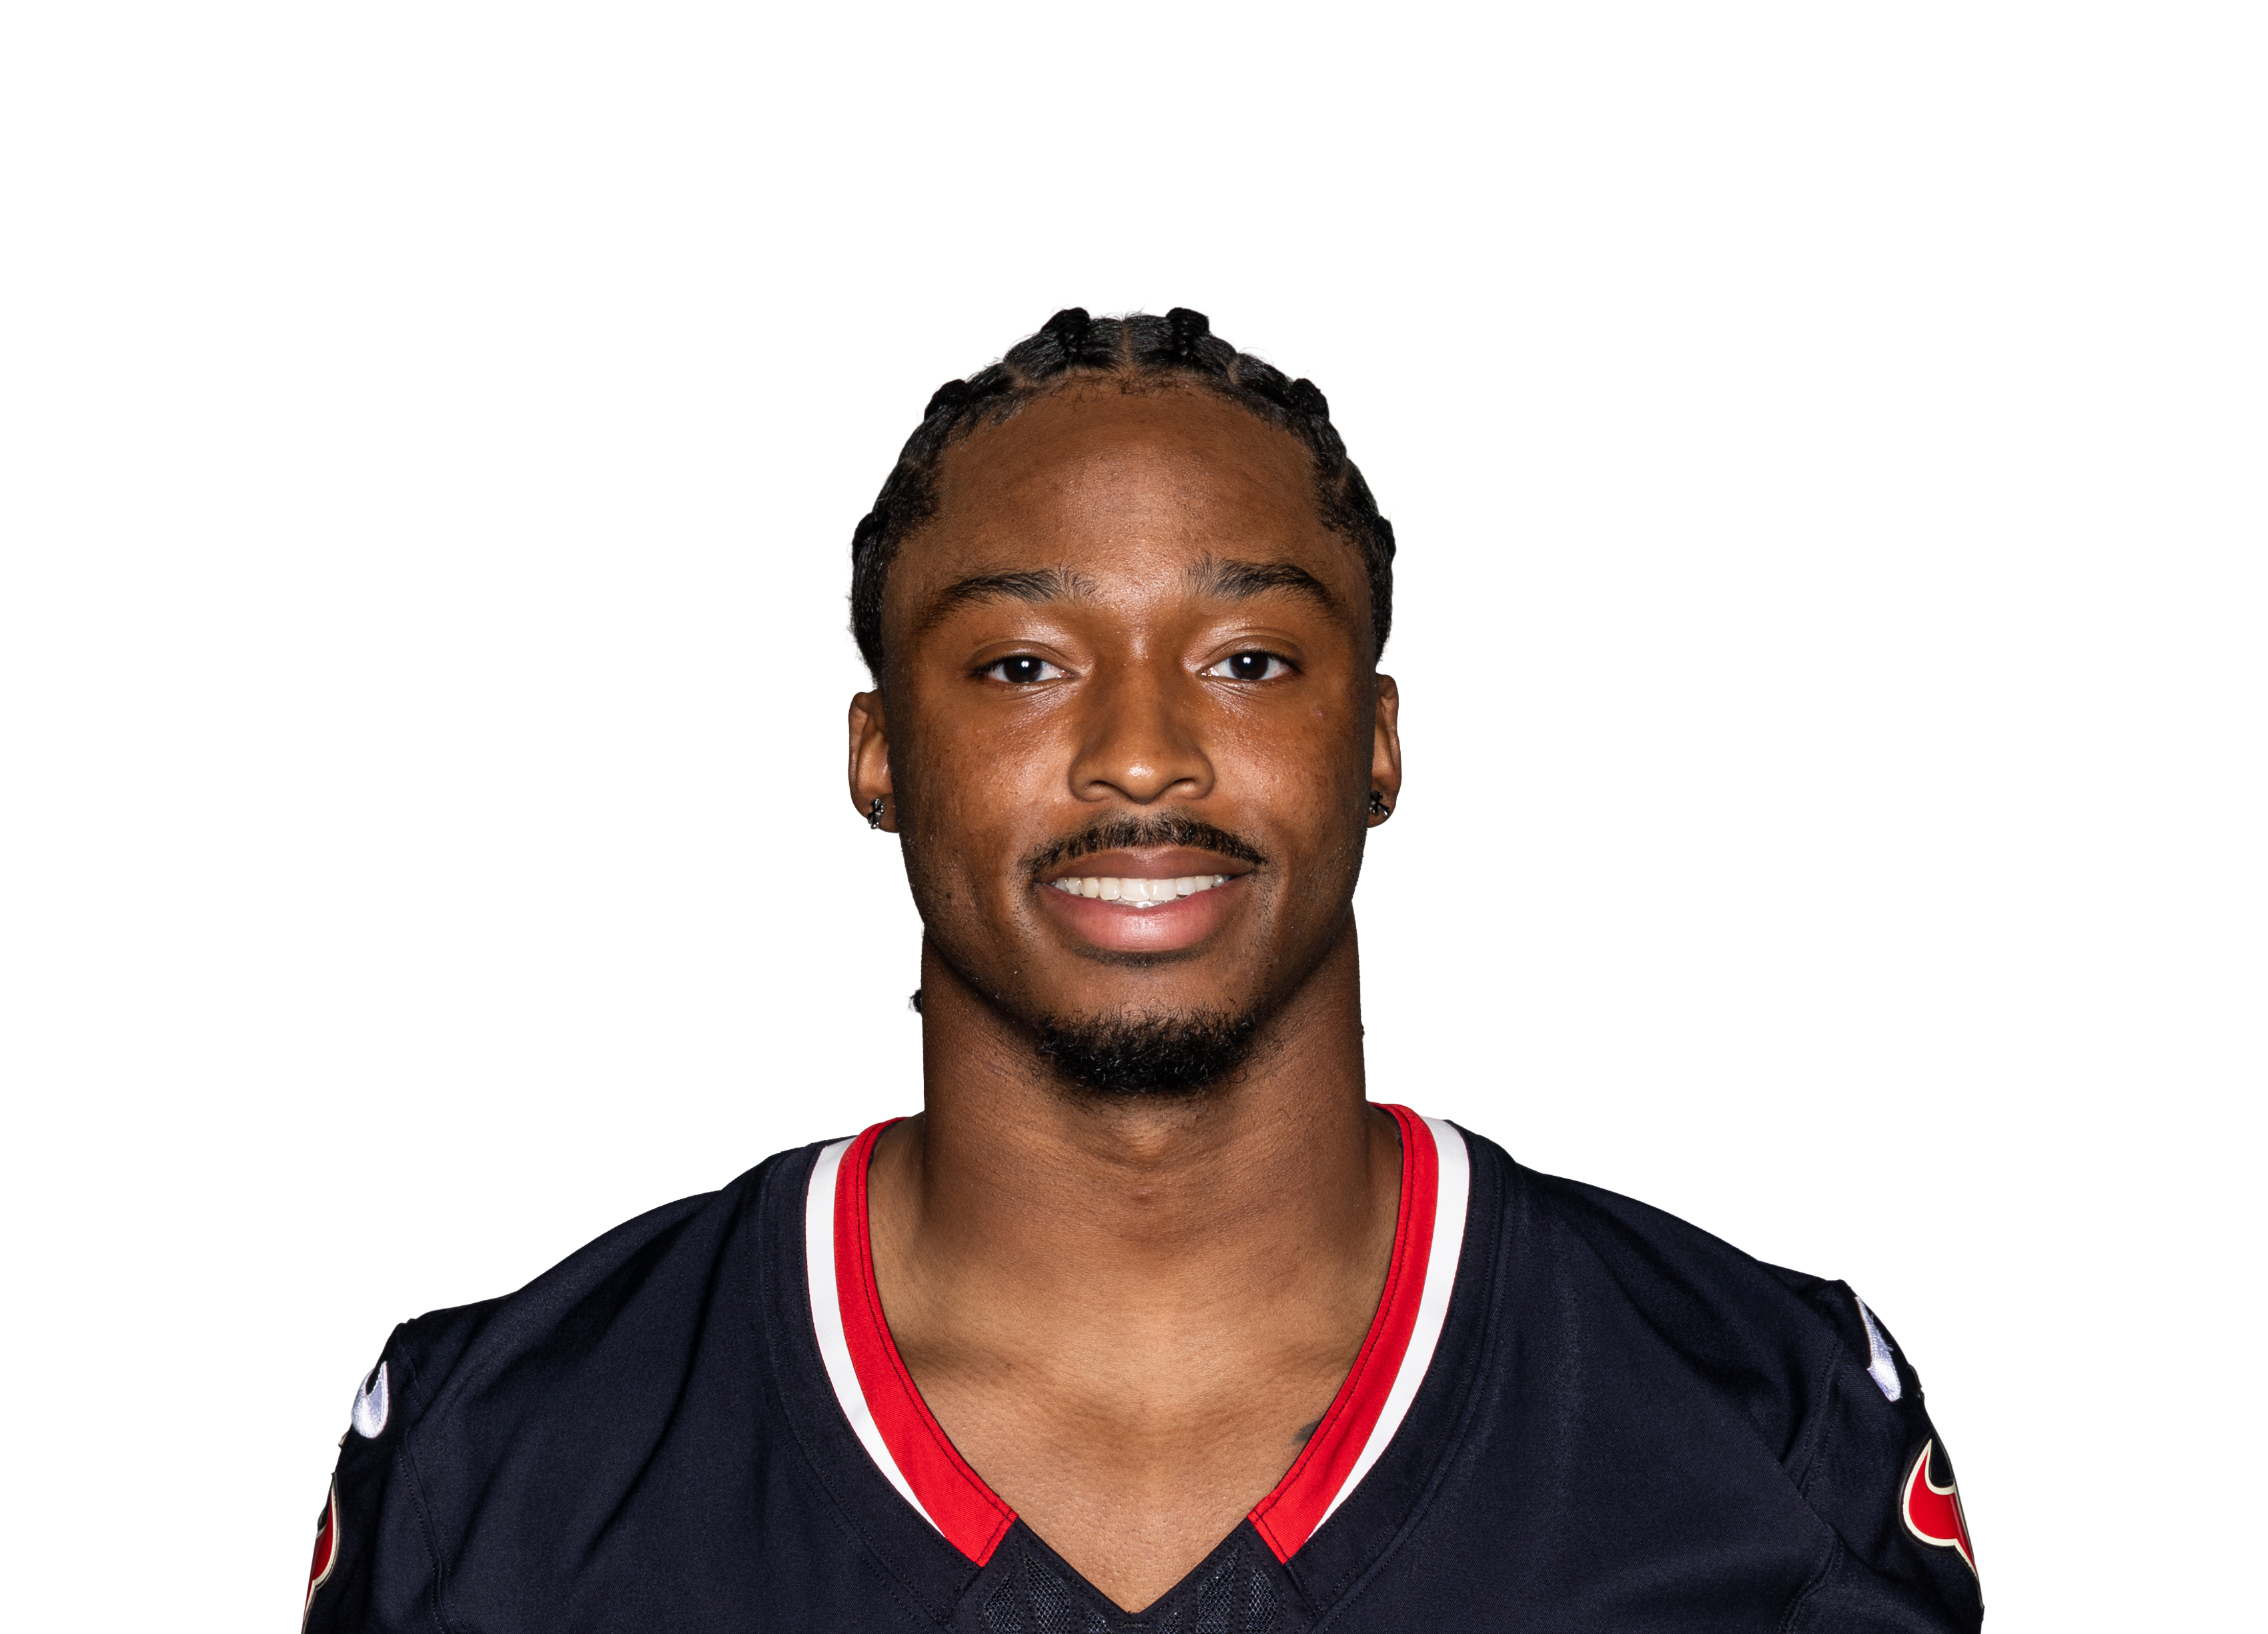 Jawhar Jordanvs HOU • Wk 6 | 12.0 | 6 | 43 | 1 | 1 | 7 |
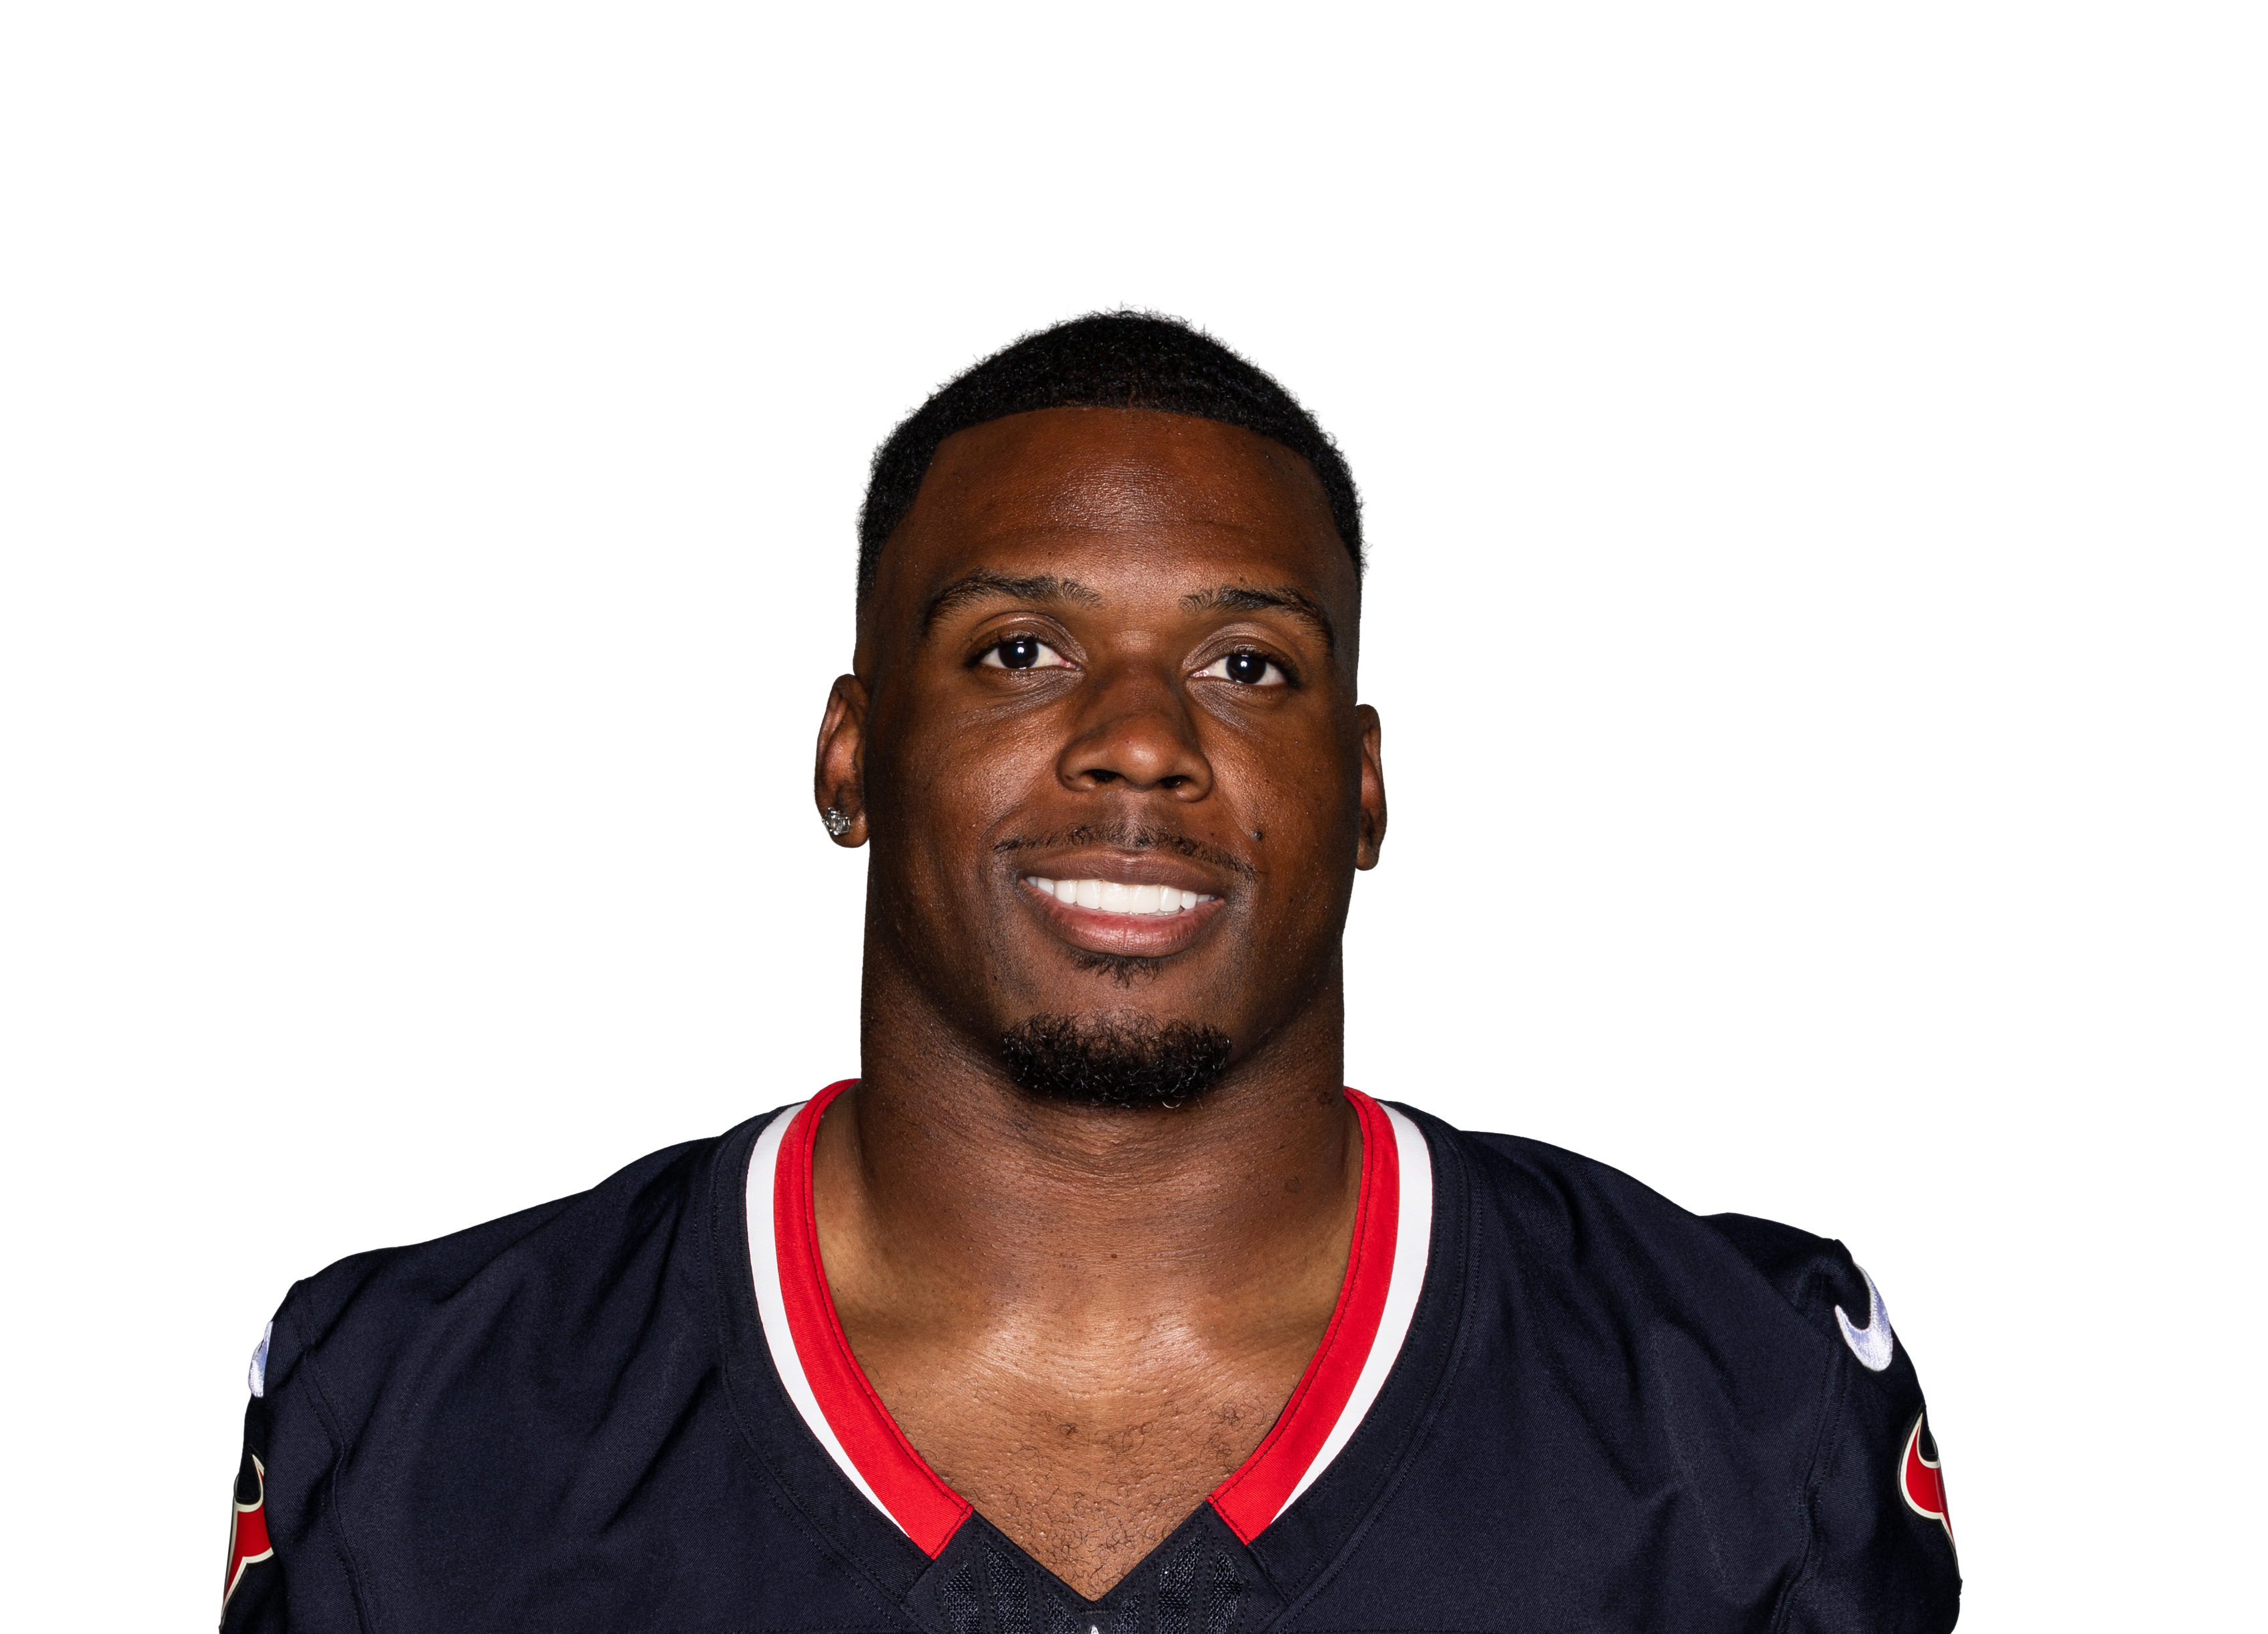 Woody Marksvs HOU • Wk 6 | 10.1 | 15 | 56 | 0 | 2 | 25 |
 Will Shipleyvs PHI • Wk 5 | 8.3 | 5 | 6 | 1 | 1 | 7 |
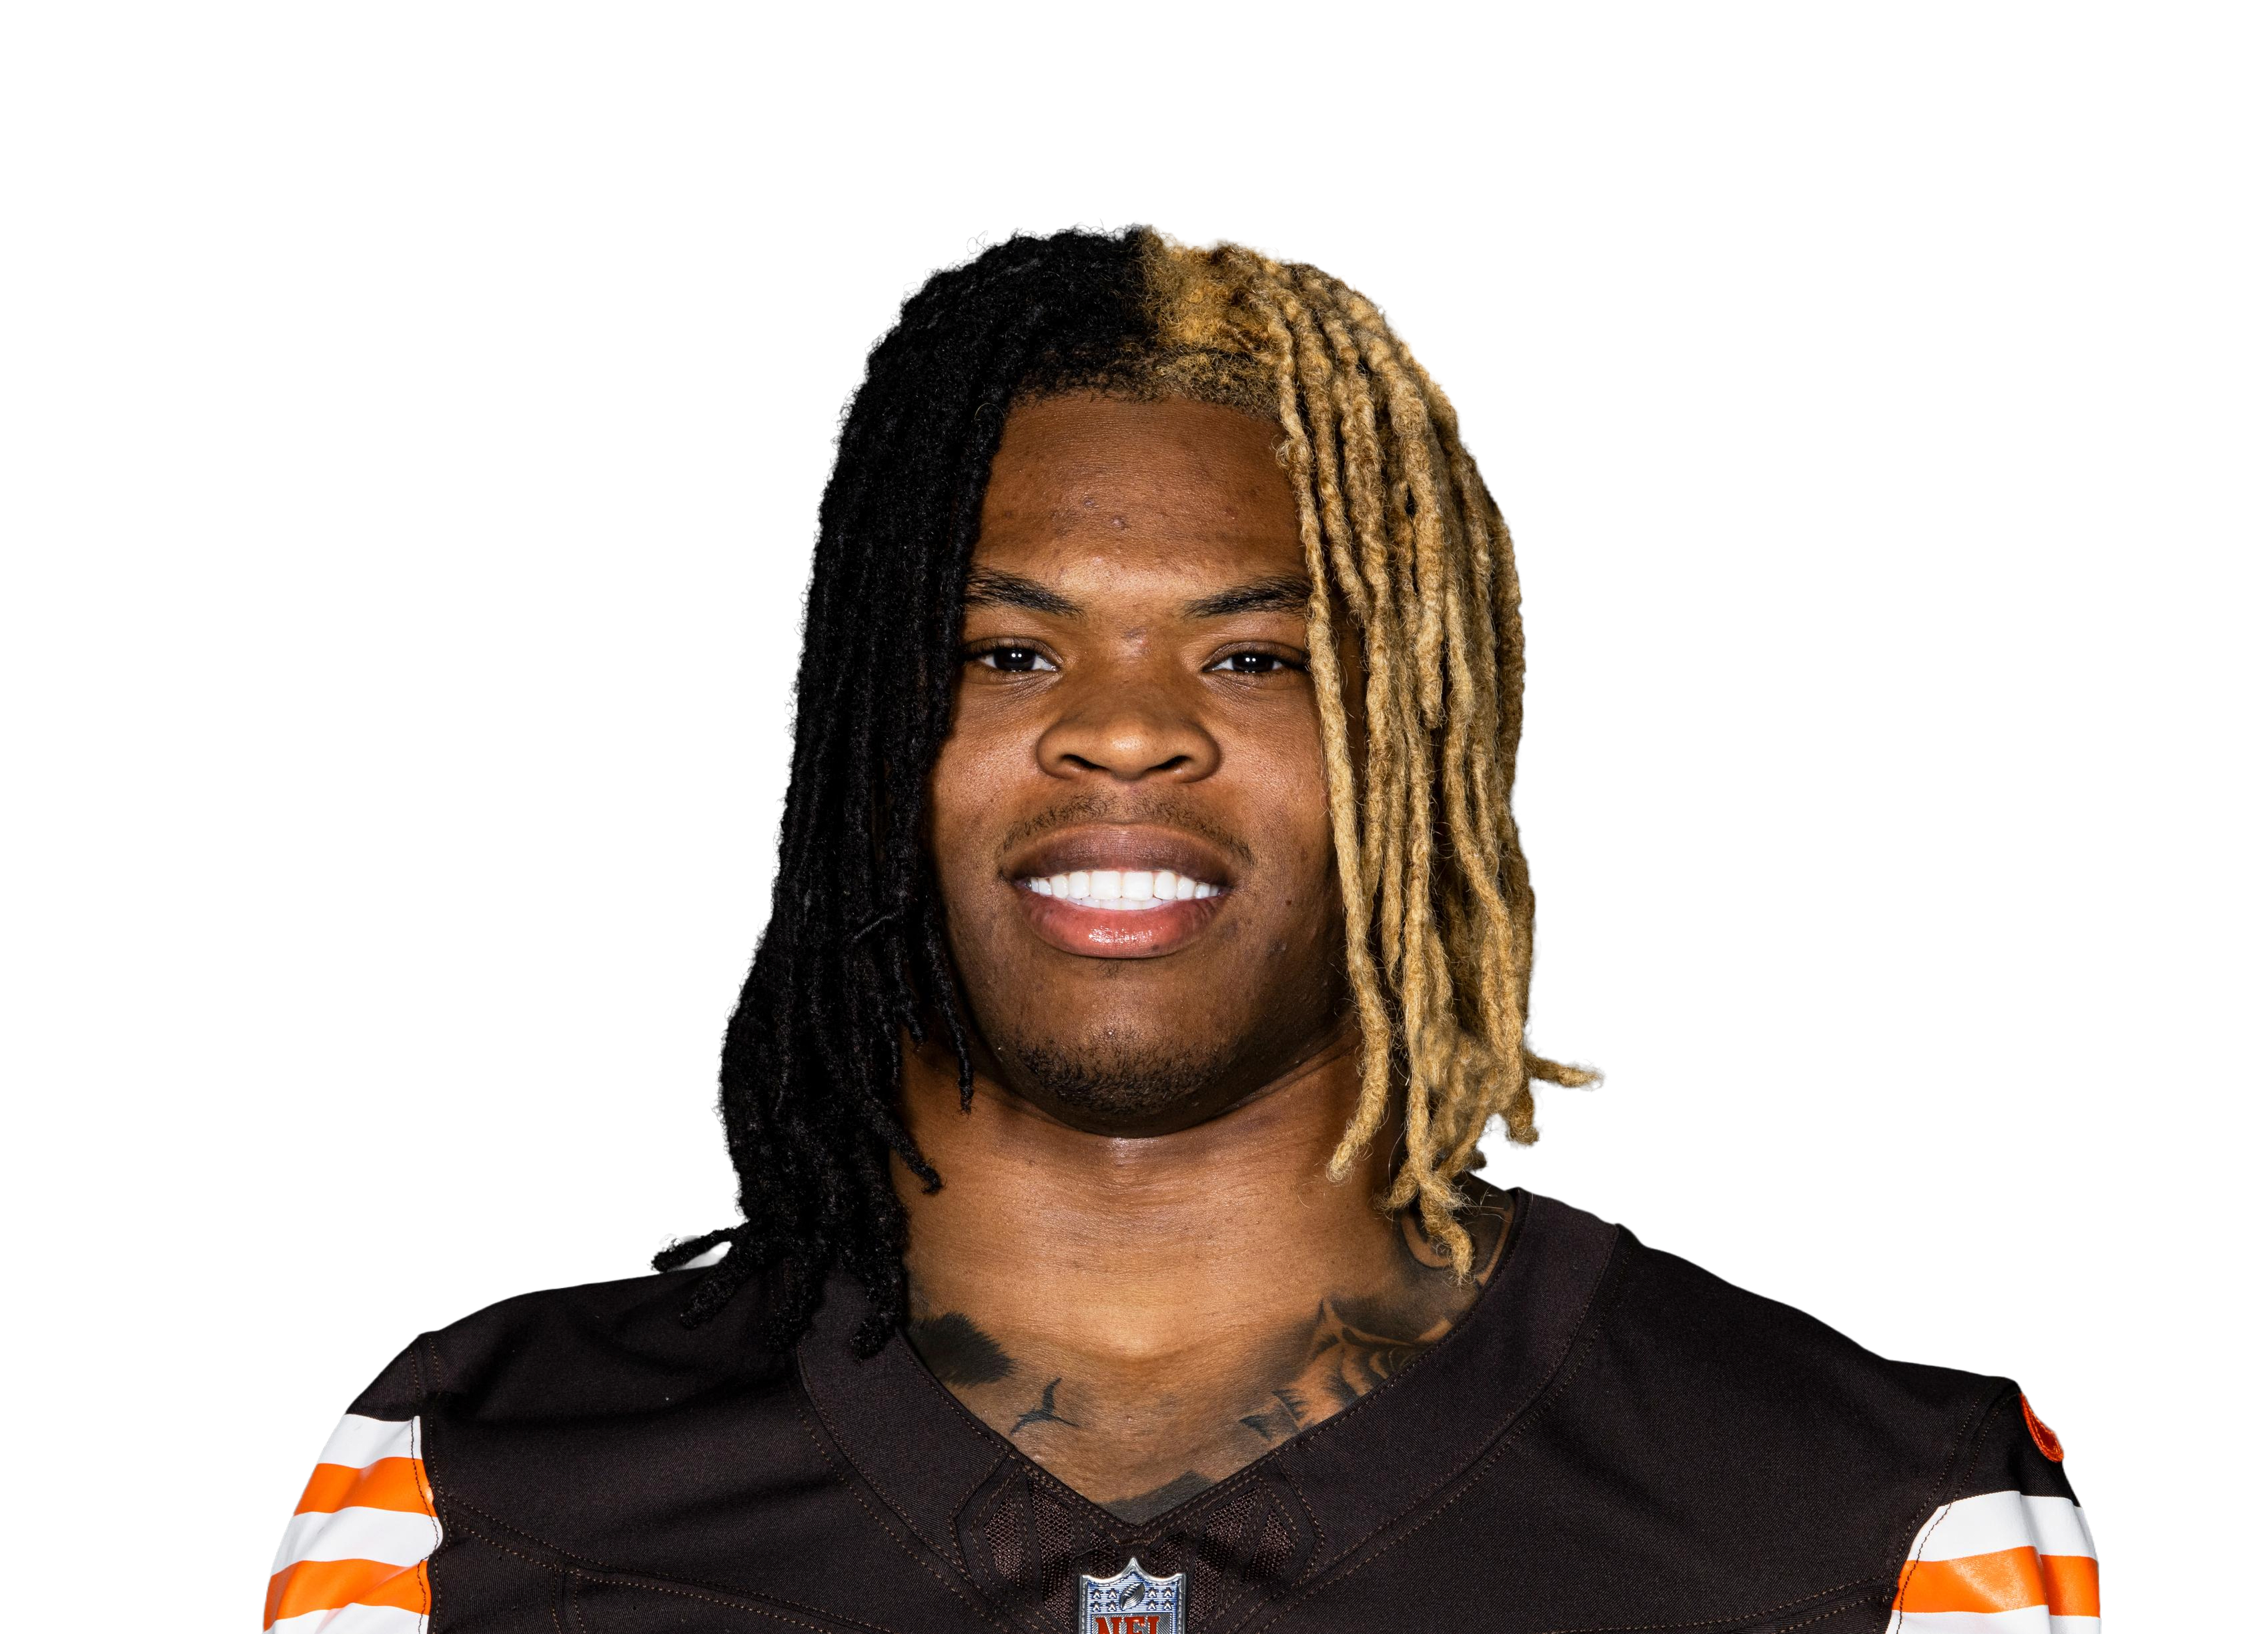 Quinshon Judkinsvs CLE • Wk 1 | 7.0 | 12 | 33 | 0 | 2 | 17 |
 Rhamondre Stevensonvs NE • Wk 3 | 6.8 | 7 | 22 | 0 | 3 | 16 |
 Jonathan Taylorvs IND • Wk 8 | 6.7 | 8 | 23 | 0 | 4 | 24 |
 Raheim Sandersvs CLE • Wk 1 | 5.6 | 1 | 1 | 0 | 3 | 25 |
 Derrick Henry@ BAL • Wk 9 | 5.6 | 17 | 57 | 0 | 0 | 0 |
 Tyler Badie@ DEN • Wk 2 | 4.9 | 1 | 1 | 0 | 2 | 28 |
 DJ Giddensvs IND • Wk 8 | 4.3 | 6 | 43 | 0 | 0 | 0 |
 TreVeyon Hendersonvs NE • Wk 3 | 3.9 | 8 | 23 | 0 | 1 | 6 |
 Tyjae Spears@ TEN • Wk 10 | 3.8 | 4 | 28 | 0 | 1 | 0 |
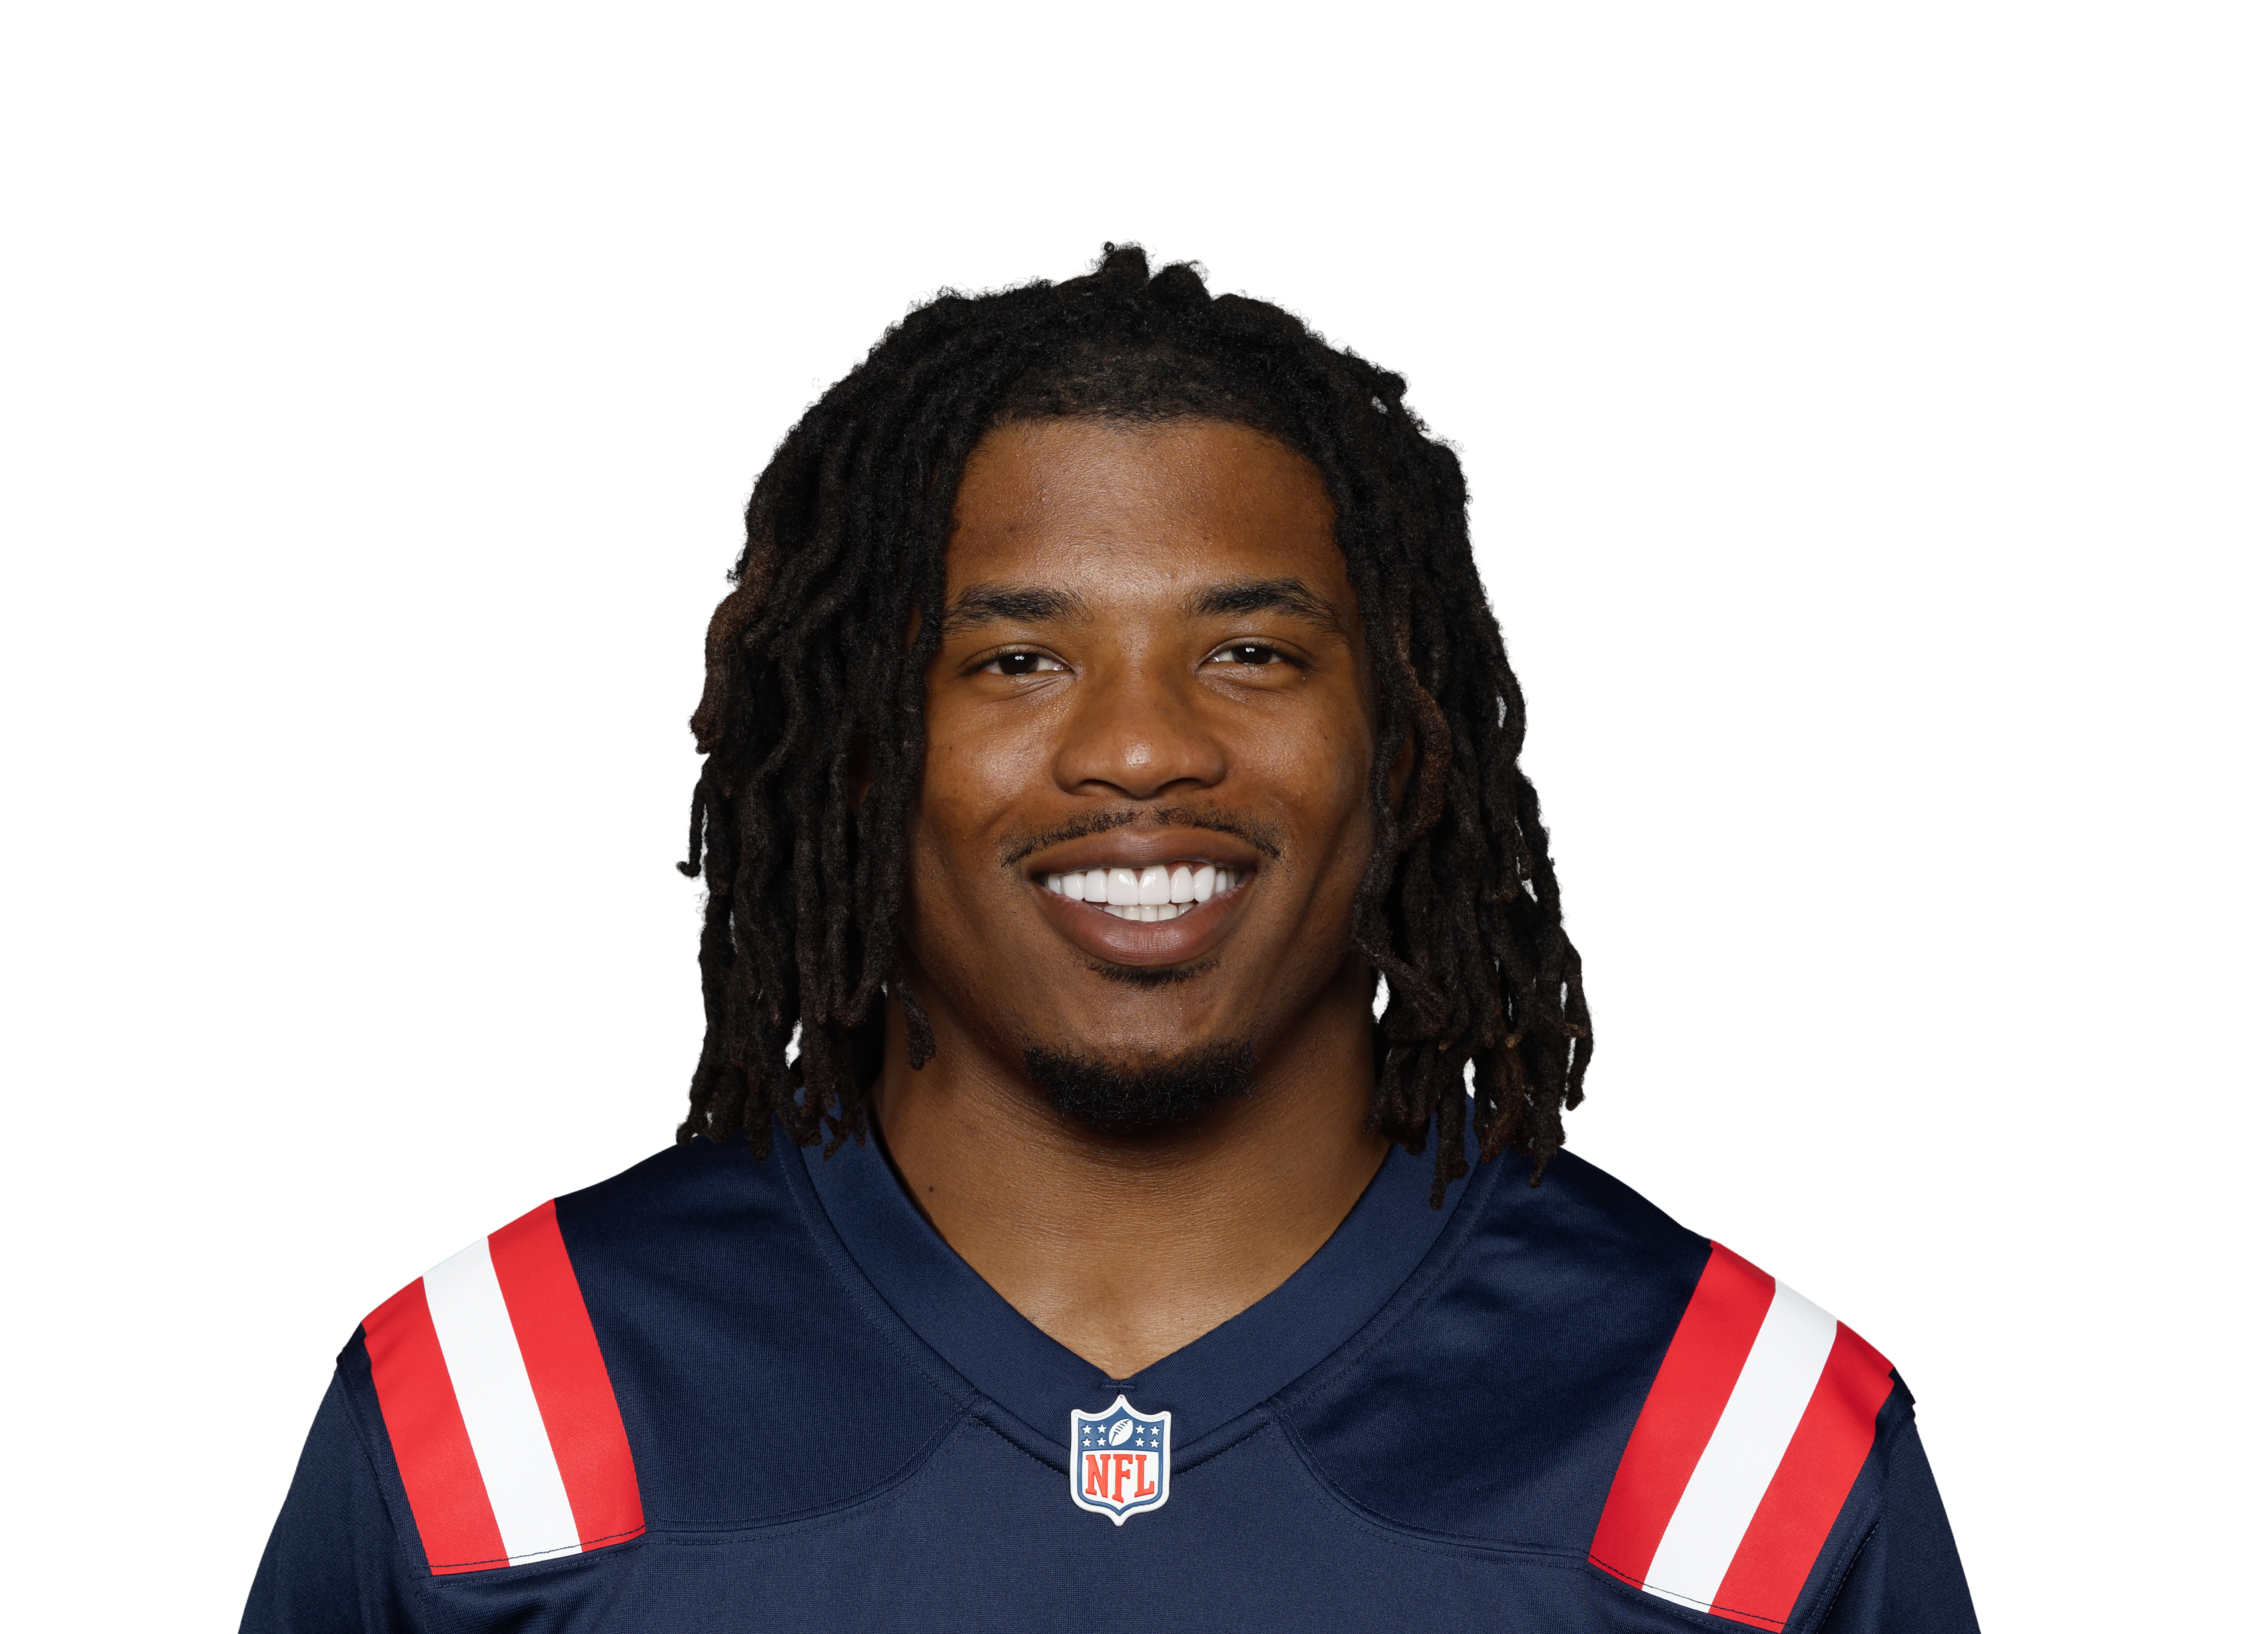 Corey Kinervs NE • Wk 3 | 3.7 | 6 | 18 | 0 | 1 | 9 |
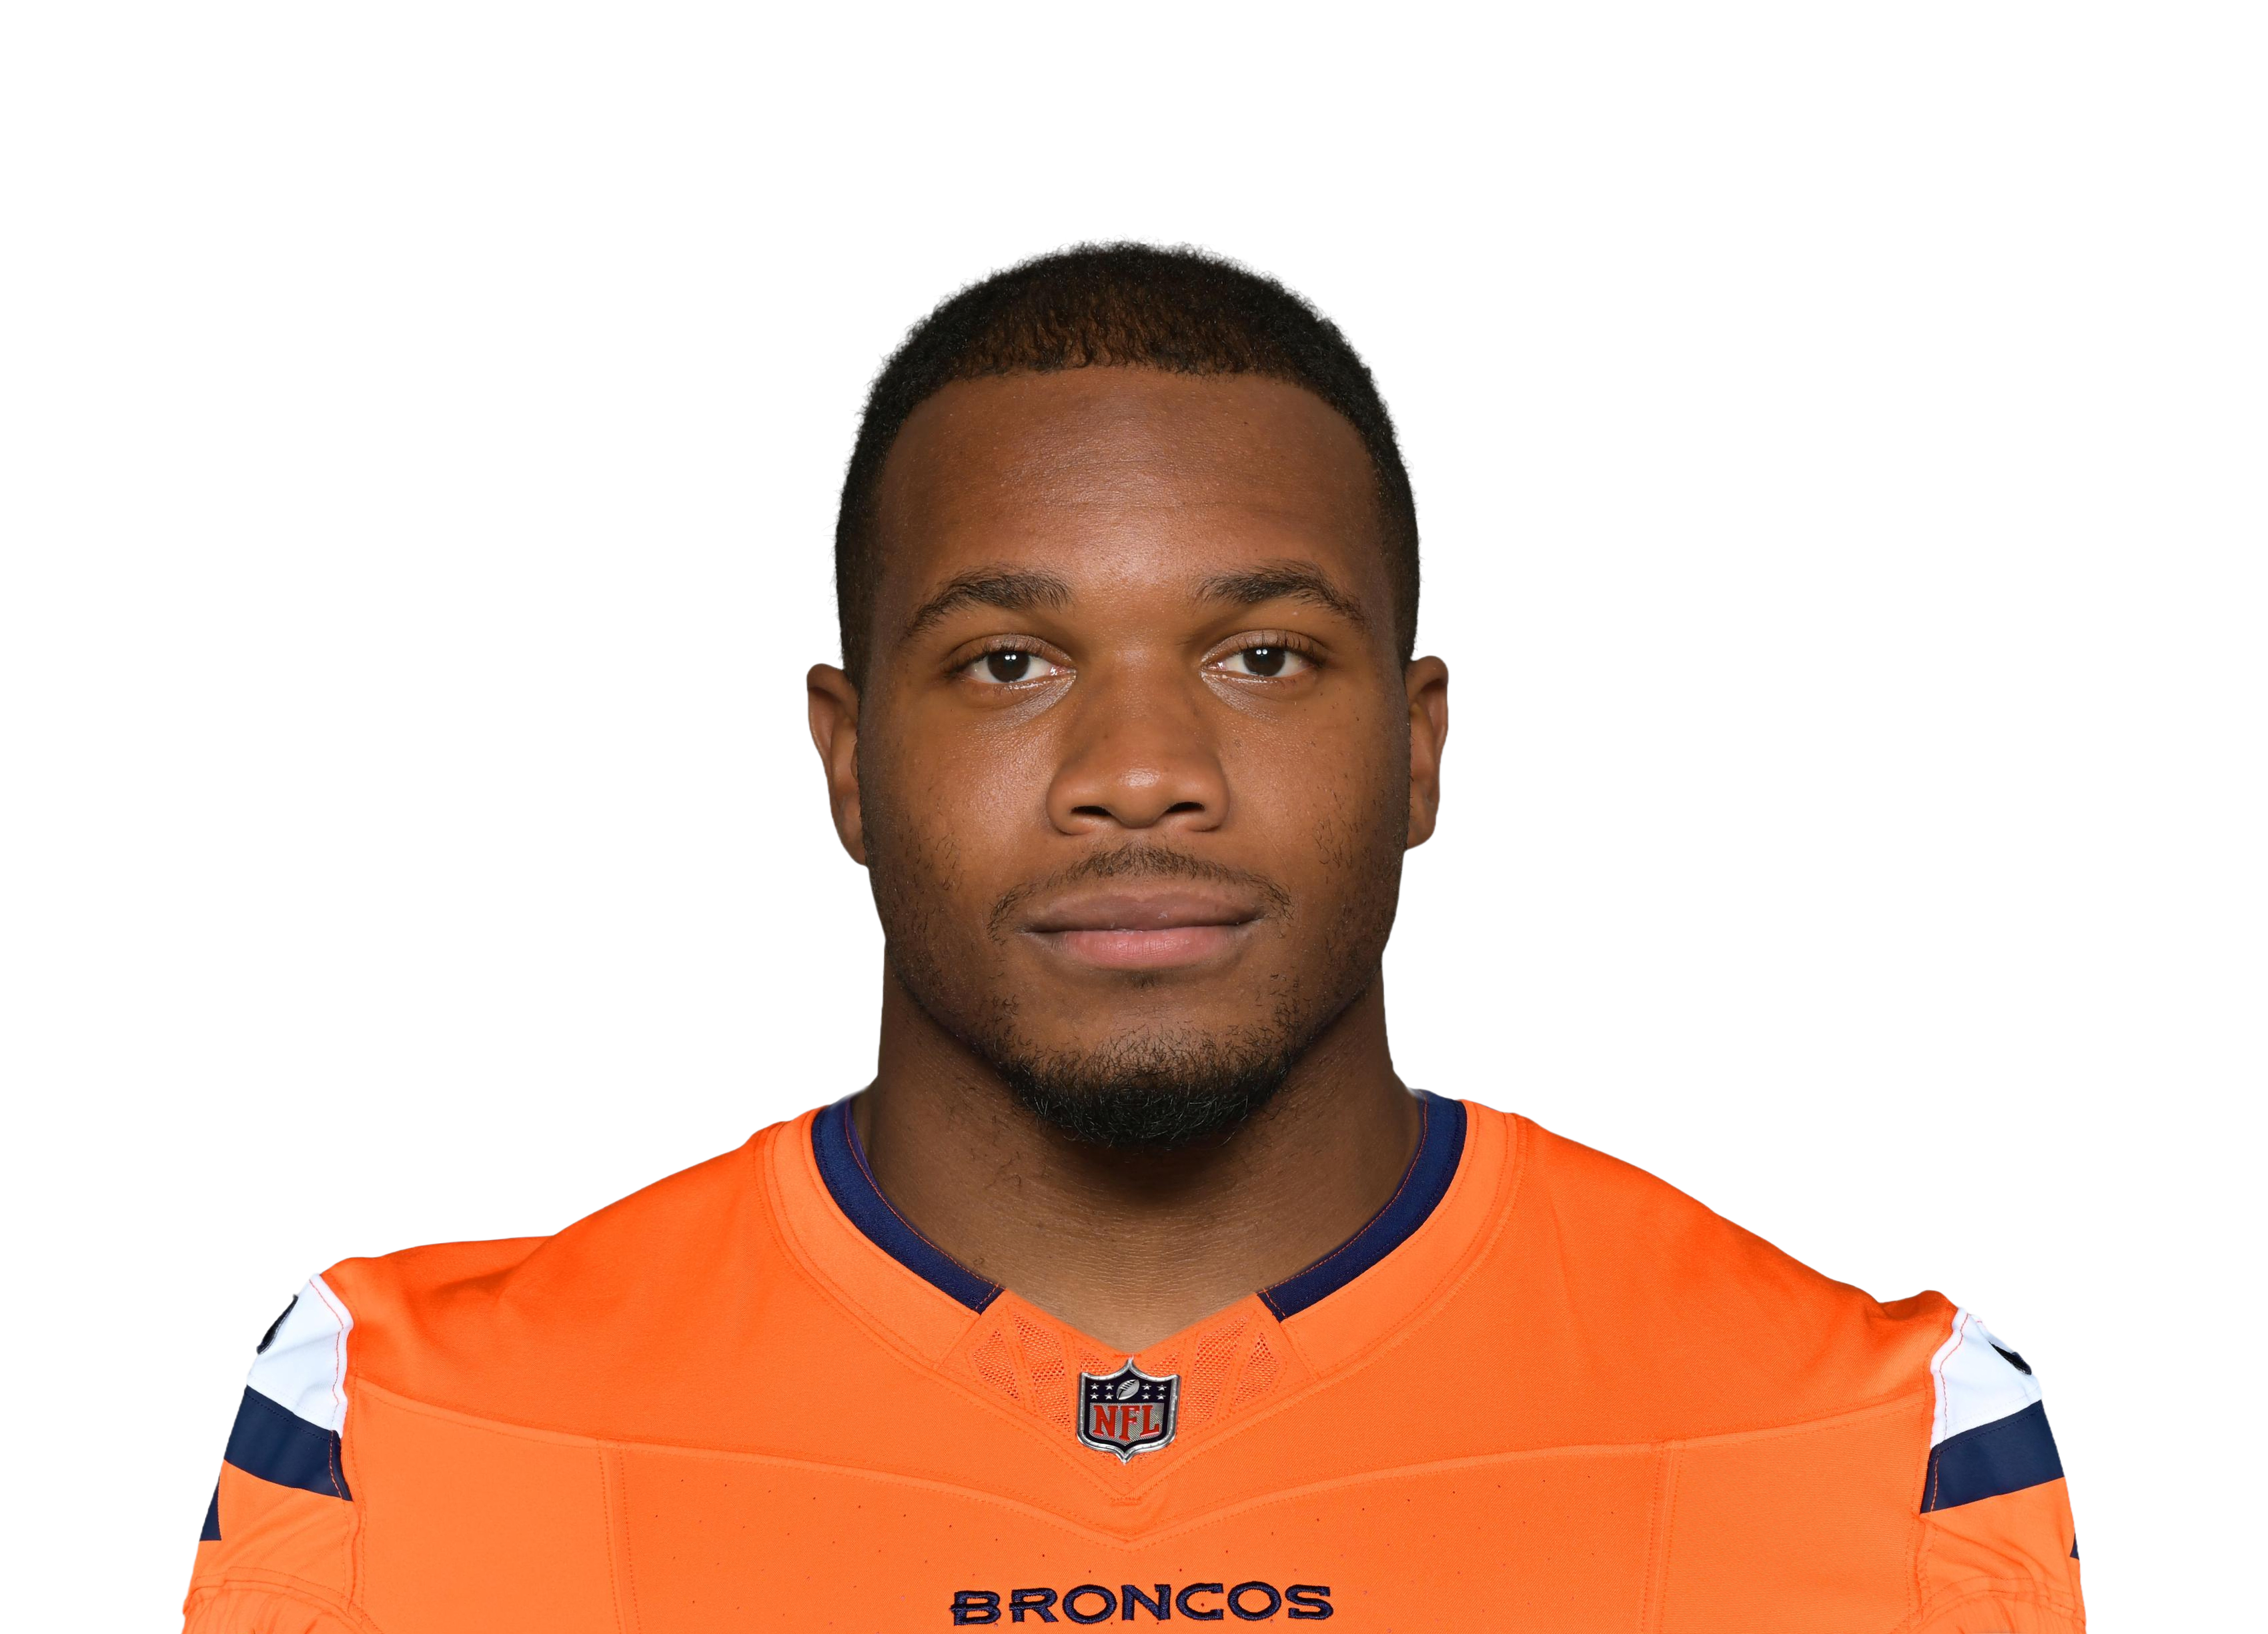 J.K. Dobbins@ DEN • Wk 2 | 3.6 | 10 | 36 | 0 | 0 | 0 |
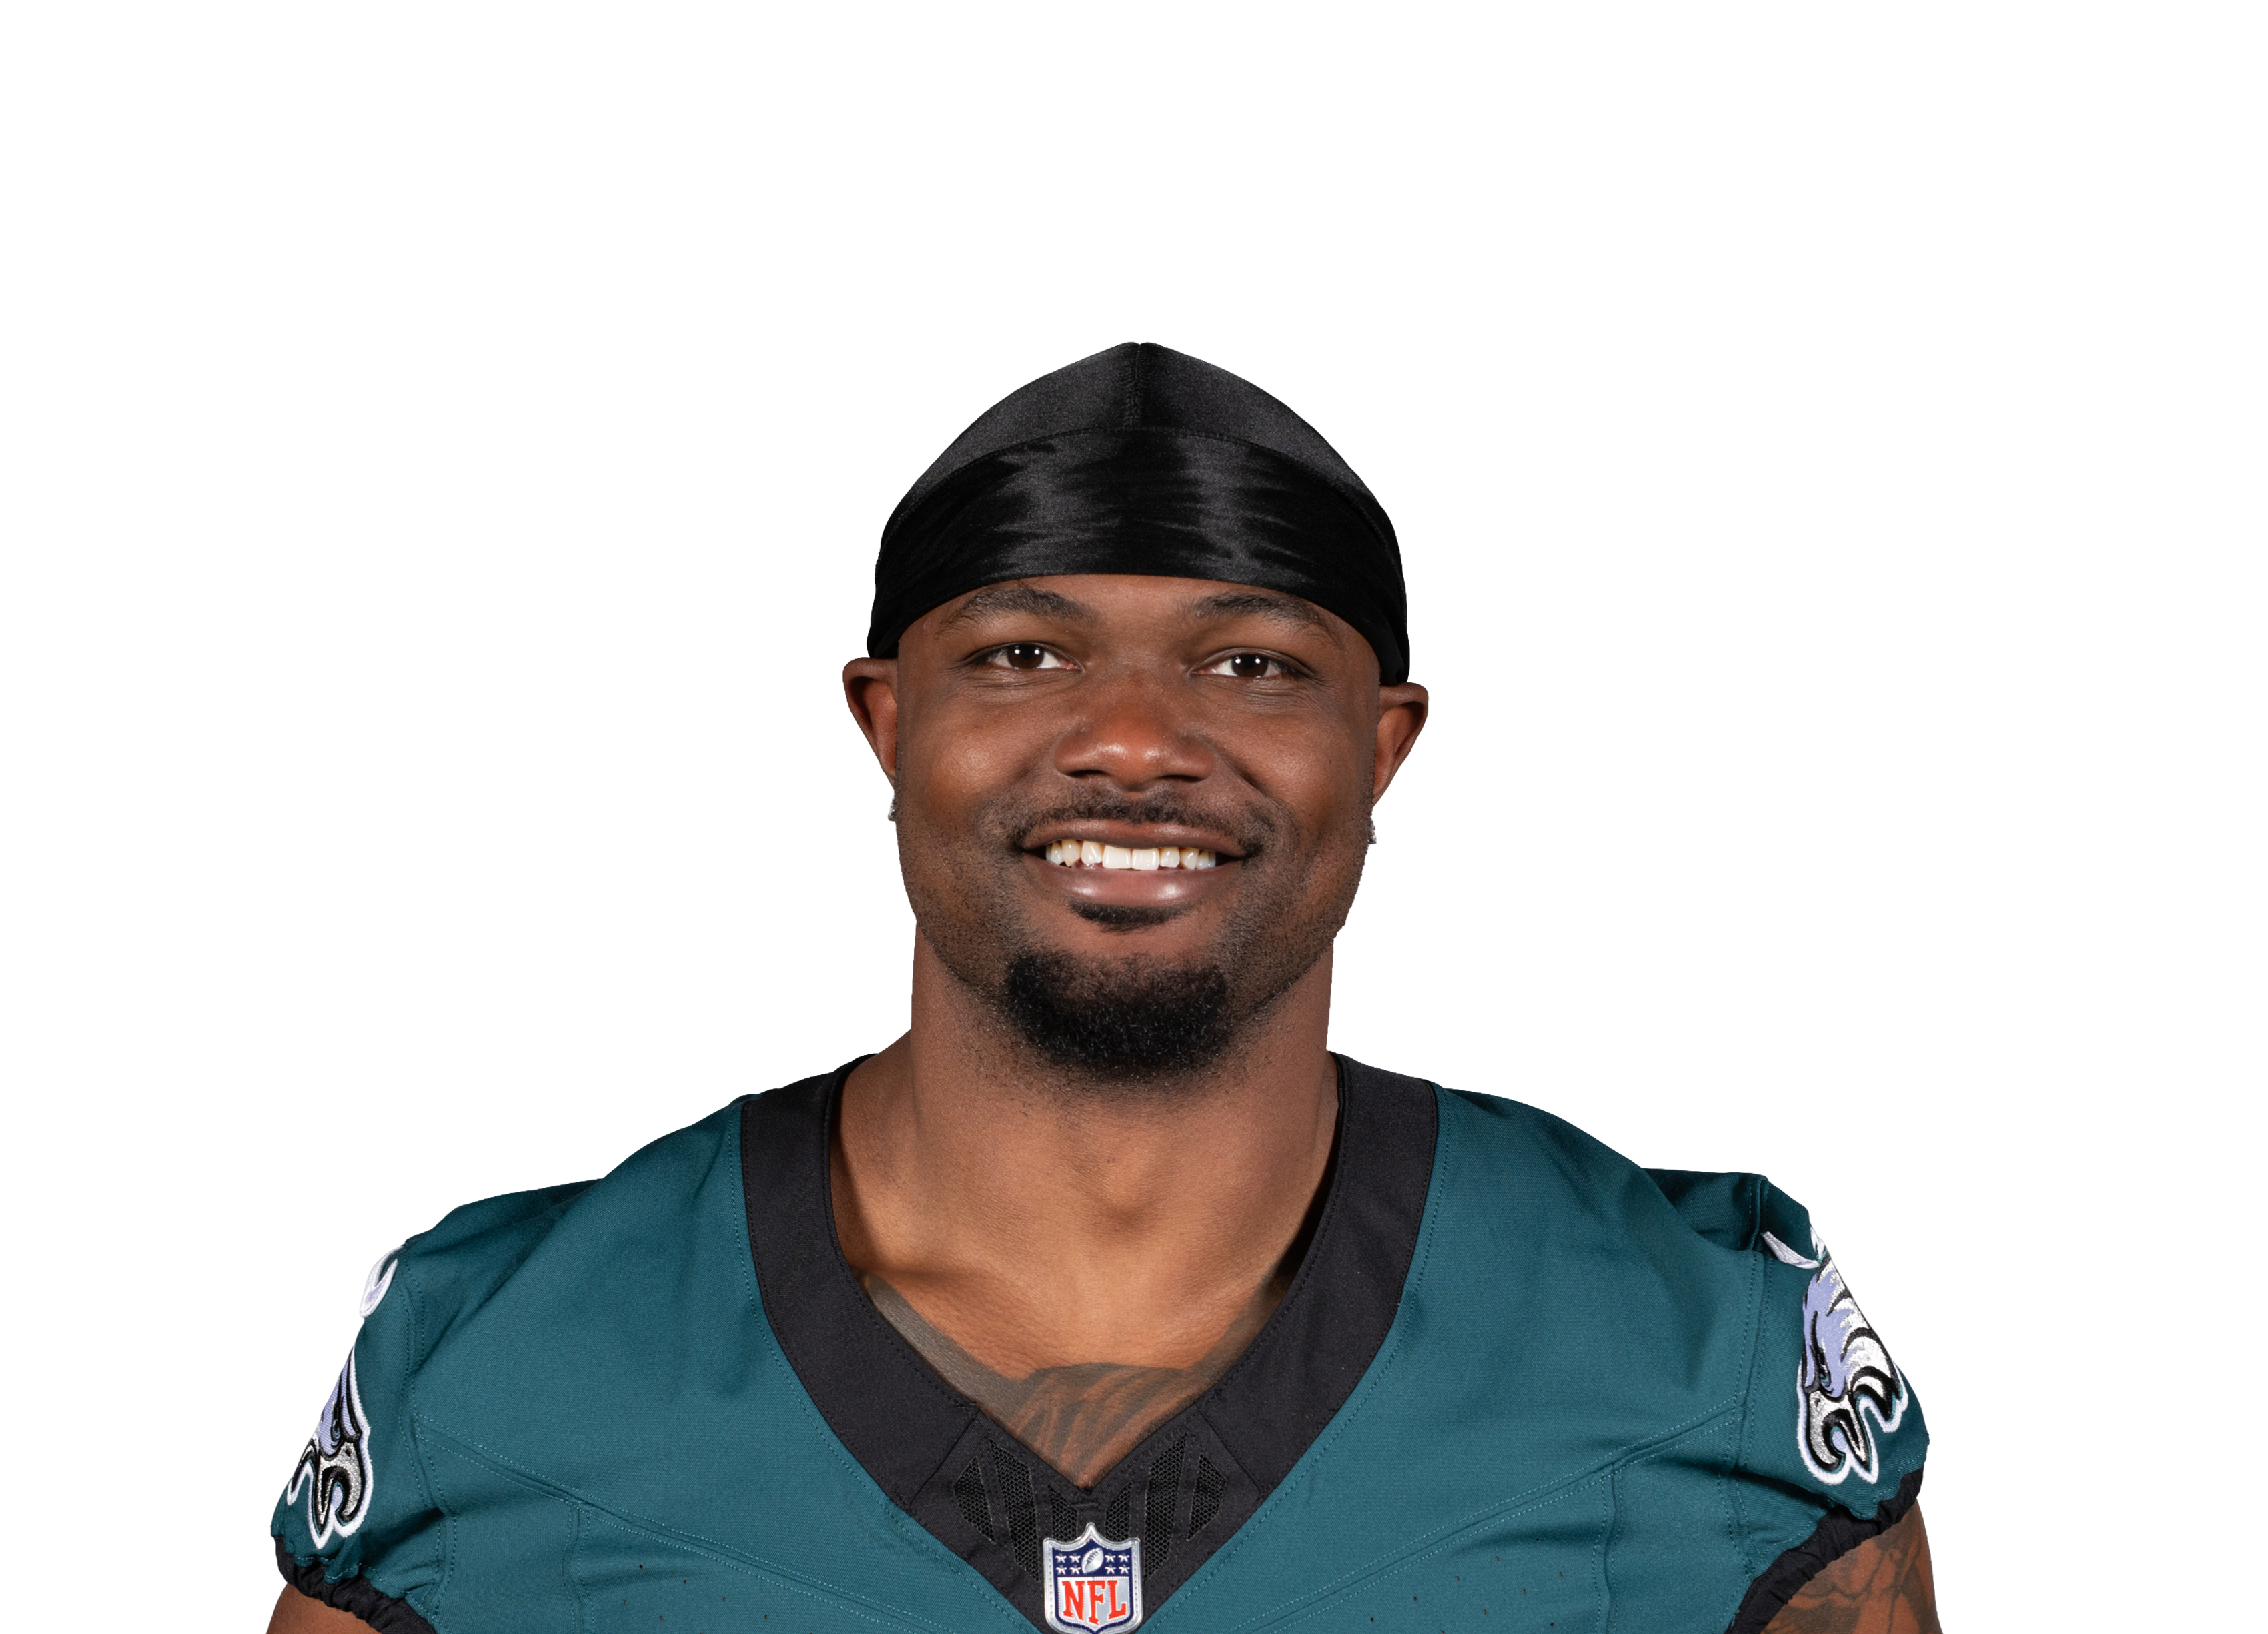 Dameon Piercevs PHI • Wk 5 | 3.2 | 11 | 14 | 0 | 2 | -2 |
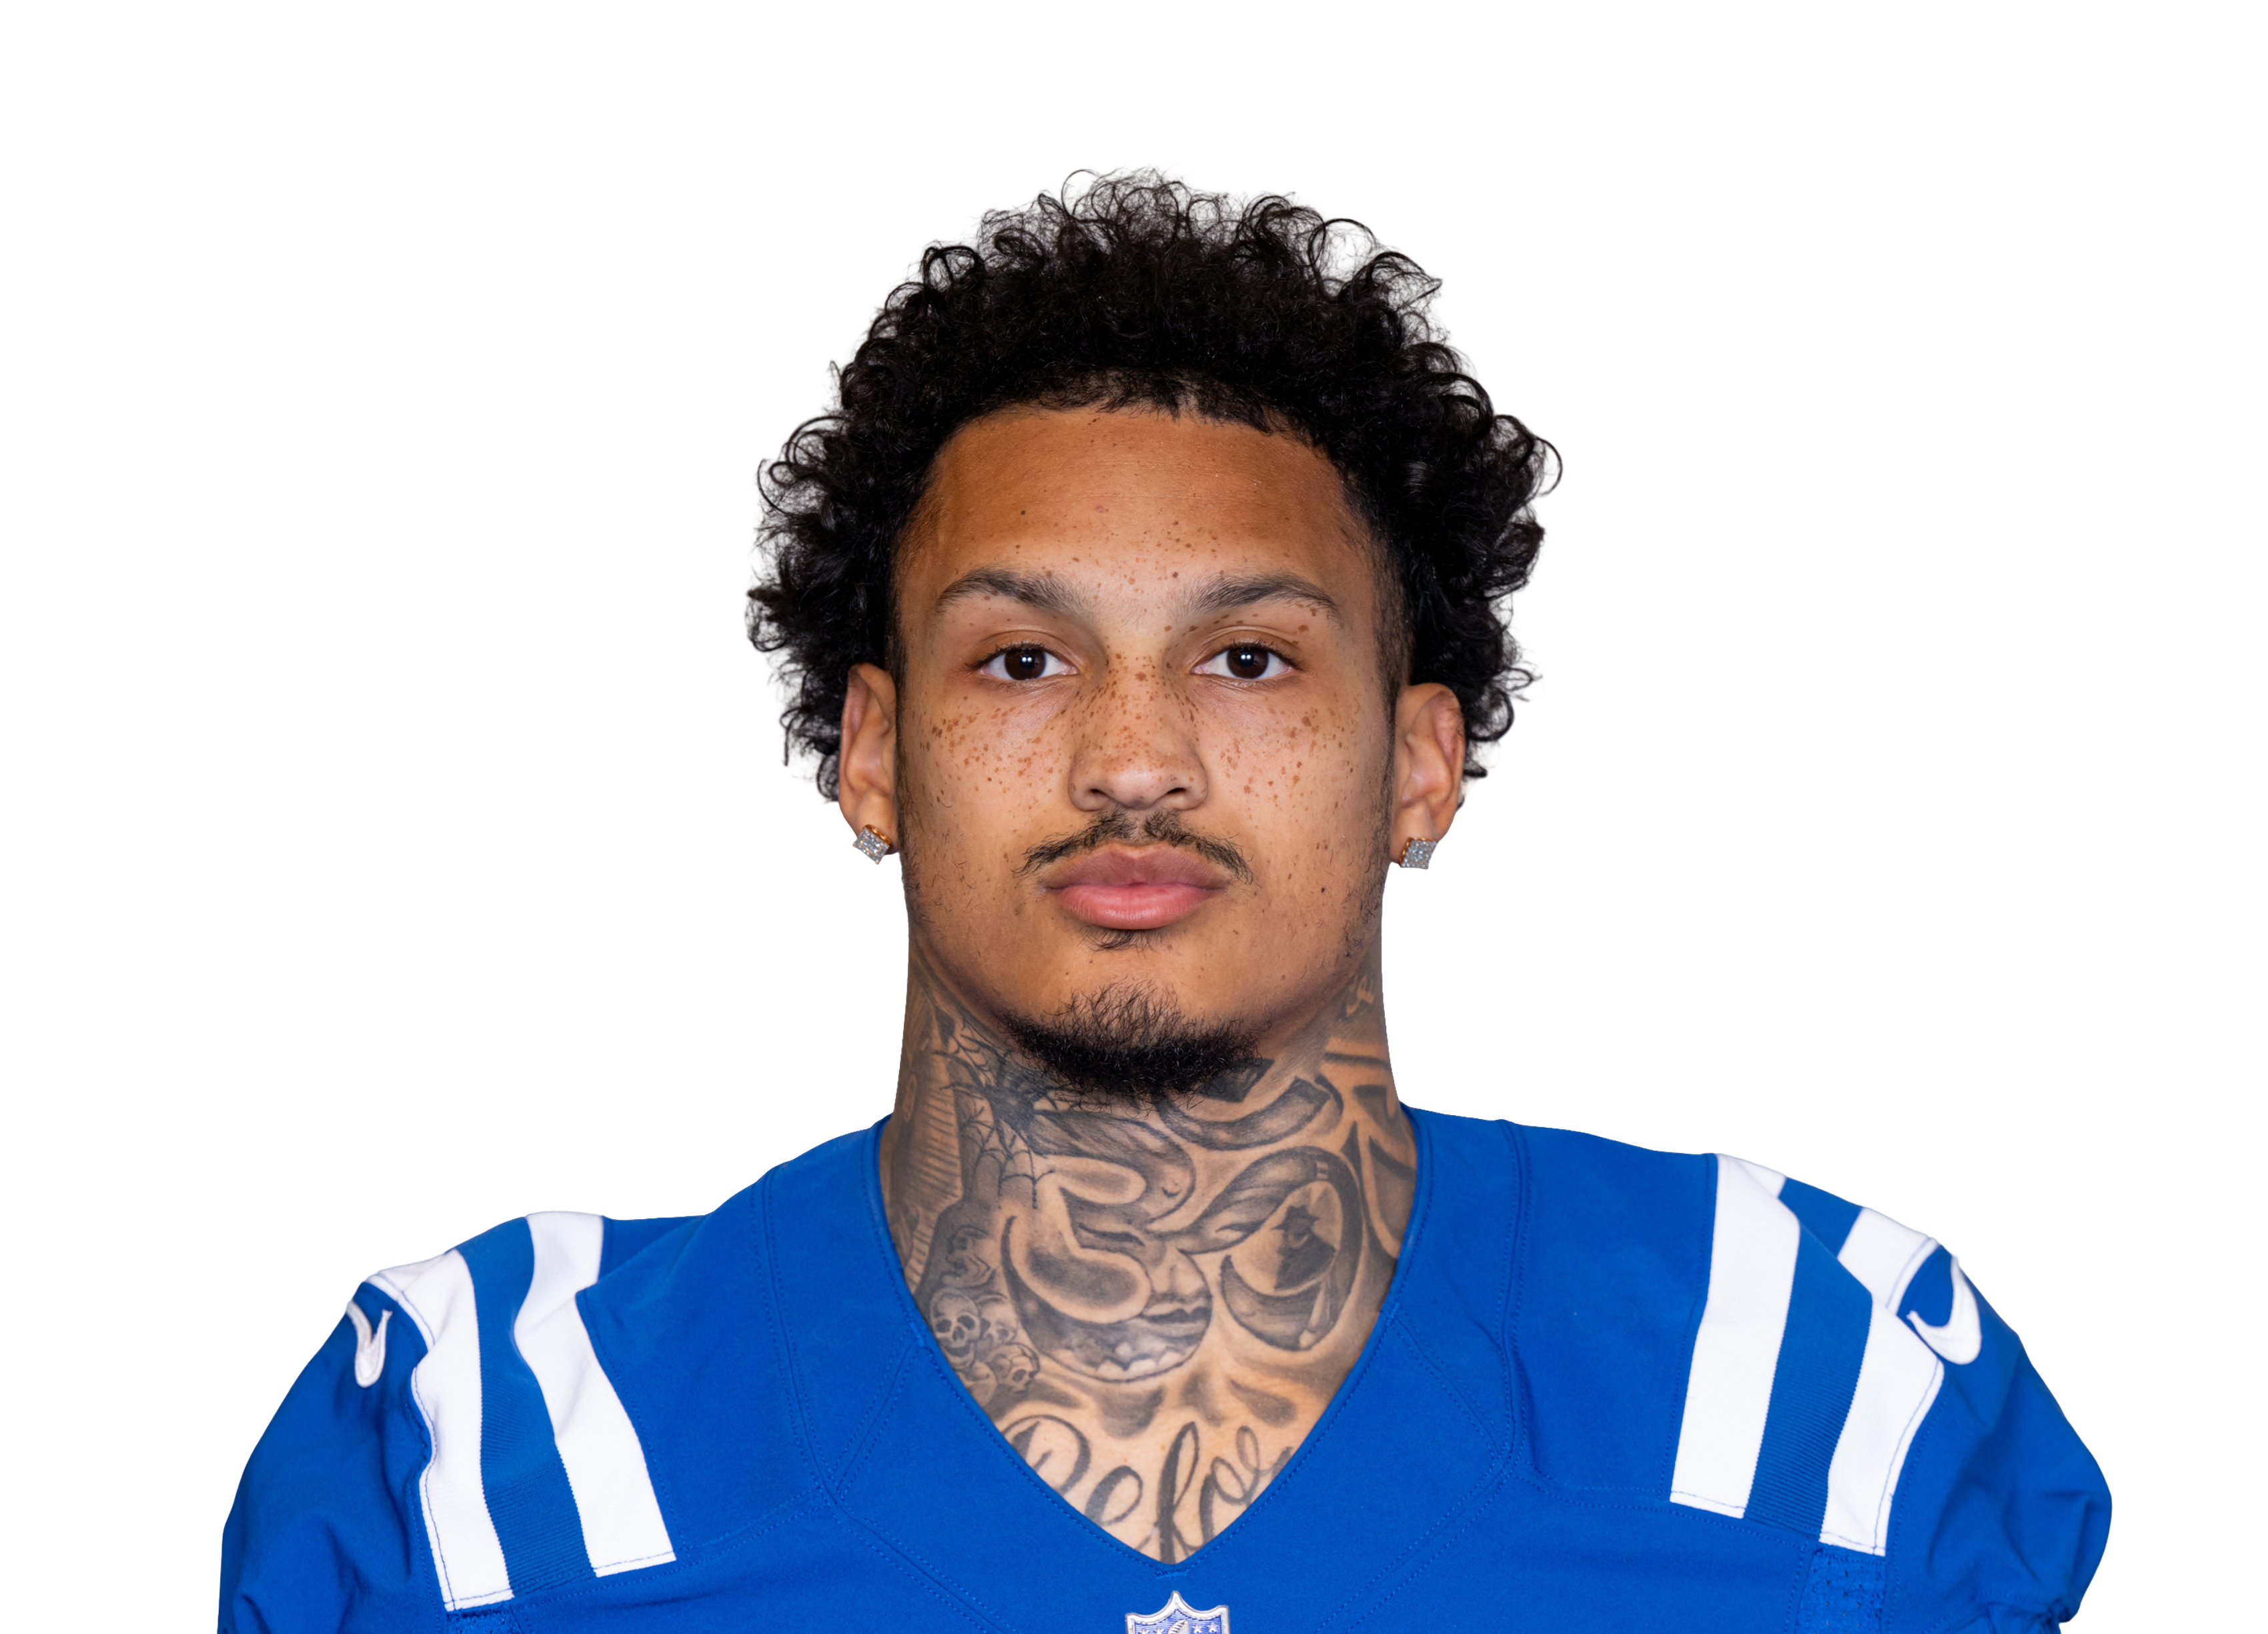 Seth McGowanvs IND • Wk 8 | 2.9 | 5 | 29 | 0 | 0 | 0 |
 Samaje Perine@ CIN • Wk 4 | 0.7 | 3 | 7 | 0 | 0 | 0 |
Fantasy points first, then the stats that matter for his position. Ring around each photo is that player's Mania Rating. Tap a name to open his profile.
Usage
Snaps
17%
Touch share
11%
Carries/G
6.2
PPR/G
2.3
By the numbers
PPR / Game
2.3
4th percentileRB avg 10.9
Rushing Attempts / Game
6.2
23rd percentileRB avg 11
Rush Yards / Game
19.8
19th percentileRB avg 45.2
Targets / Game
0.2
1st percentileRB avg 2.9
Scrimmage Yards / Game
20.8
7th percentileRB avg 61.1
Share of Team Touches
10.8%
10th percentileRB avg 23.9%
Red-Zone Carries / Game
1.4
37th percentileRB avg 2
Goal-Line Carries / Game
0.4
51st percentileRB avg 0.6
Red-Zone Targets / Game
0
22nd percentileRB avg 0.4
End-Zone Targets / Game
0
81st percentileRB avg 0
Snap Share
17.2%
0th percentileRB avg 51.4%
TDs / Game
0
19th percentileRB avg 0.5
NYG RB room
C. Skattebo32%
D. Singletary15%
N. Harris11%
T. Tracy Jr.6%
G. Desrosiers3%
Share of touches
NYG RB room, week by week
Touches = carries + targets. Switch to look at just carries or just targets.
| Player | W1 | W2 | W3 | W4 | W5 | W6 | W7 | W9 | W10 | Per game |
|---|---|---|---|---|---|---|---|---|---|---|
| Cam Skattebo | 1881 yds27% touches61% snaps | 1655 yds30% touches59% snaps | 24100 yds44% touches77% snaps | 1966 yds33% touches64% snaps | 1671 yds20% touches63% snaps | — | 18121 yds30% touches56% snaps | — | 22122 yds36% touches89% snaps | 19.088 yds a game • 4.6 per touch32% touches67% snaps |
| Devin Singletary | 1038 yds15% touches36% snaps | 49 yds8% touches26% snaps | — | — | — | 533 yds8% touches40% snaps | 855 yds13% touches29% snaps | 2439 yds41% touches93% snaps | 13 yds2% touches8% snaps | 8.730 yds a game • 3.4 per touch14% touches39% snaps |
| Tyrone Tracy Jr. | 214 yds3% touches3% snaps | 00 yds0% touches2% snaps | 13 yds2% touches2% snaps | 1-1 yds2% touches18% snaps | 631 yds8% touches19% snaps | 945 yds14% touches38% snaps | 717 yds12% touches15% snaps | — | — | 3.716 yds a game • 4.2 per touch6% touches14% snaps |
| Najee Harris | — | 46 yds8% touches14% snaps | 952 yds17% touches22% snaps | 930 yds16% touches18% snaps | 614 yds8% touches18% snaps | 42 yds6% touches14% snaps | — | — | — | 6.421 yds a game • 3.3 per touch11% touches17% snaps |
| Patrick Ricard | 10 yds2% touches54% snaps | — | — | 21 yds4% touches46% snaps | — | — | — | — | — | 1.51 yds a game • 0.3 per touch3% touches50% snaps |
| Gregory Desrosiers | — | — | — | — | — | — | — | 320 yds5% touches7% snaps | 00 yds0% touches0% snaps | 1.510 yds a game • 6.7 per touch3% touches4% snaps |
Each cell is the count that week with his yards on those touches plus his share of the team and his snap percentage. Click a name to open that player.
Game log
Games5
PPR/G2.3
Game log
Harris avg 2.3NFL top 30 RBs avg 15.7
Solid dot is what he scored. Hollow dot is our projection before the game.
| Use | Game | Proj | PPR | Tgt | Rec | Rec Yd | Car | Rush Yd | TD | Snap |
|---|---|---|---|---|---|---|---|---|---|---|
W2 vs LA | 3.1 | 0.6 | 0 | 0 | 0 | 4 | 6 | 0 | 14% | |
W3 vs TEN | 3.0 | 5.2 | 0 | 0 | 0 | 9 | 52 | 0 | 22% | |
W4 vs ARI | 3.5 | 3 | 0 | 0 | 0 | 9 | 30 | 0 | 18% | |
W5 vs WAS | 3.5 | 2.4 | 1 | 1 | 5 | 5 | 9 | 0 | 18% | |
W6 vs NO | 4.0 | 0.2 | 0 | 0 | 0 | 4 | 2 | 0 | 14% |
Opponent color:Easy defense for RBsAverageTough
Schedule ahead
11 JAX12 IND13 SF14 SEA15 CLE16 DET17 DAL18 PHI
Green easier, red tougher
Schedule ahead
Colored by what each defense has given up to RBs so far. Green is an easier matchup, red is a tougher one.
Wk 11 JAXWk 12 INDWk 13 SFWk 14 SEAWk 15 CLEWk 16 DETWk 17 DALWk 18 PHISee every team's RB schedule ›
StatPer gameSeasonRank
Overall
Games—531›
PPR points2.311.45›
Receiving
Targets0.211›
Catches0.211›
Receiving yards153›
Yards per target5—47›
Yards per catch3.2—31›
Rushing
Carries6.23123›
Rush yards19.89919›
Scrimmage yards20.81047›
Usage
Snap %17%—1›
Target share %0.4%—1›
Touch share %10.8%—10›
Carry share %27.2%—50›
Air yards share %0.1%262›
Scoring chances
Red-zone carries1.4—37›
Goal-line carries0.4—51›
Tap any stat to see everyone ranked. Bars: green top 30%, yellow middle, red bottom 40%.
Advanced stats
Not ranked yet. Needs 60 carries and he has 31.
Fumbles lostOne
1 this season
53.2
Mania Rating
Overall profile • Depth
54.3
Week 11 Rating
Start value vs JAX
Najee Harris
NYG • RB • 5 games#298 OverallRB90#4 RB on NYGAge 28
Week 11 projection 2.8 PPR ›
RB63 this week
This weekRB63
Games counted
Untick or tick any game and Mania Rating, matchup and Week 11 Rating all recalculate. Official Mania Rating 53.2.
Teammate injuries shift his Week 11 Rating1 teammate note ▾
Tyrone Tracy Jr. (RB, Injured reserve) +0.9 • without him that work was worth 4.6 pts vs 2.6 with (4 games)
Injury report updated Sat Nov 21, 6:30 AM ET
Week 11 Rating = recent role + opponent + the latest injury report (updated Sat Nov 21, 6:30 AM ET). Check final inactives before you set your lineup.
Week 11 projection
2.8
projected points
Floor 0.0 · Ceiling 7.6
-0.4Game script
0.0Matchup
-0.1Injuries
Week 11 projection
NYGVSPPR
JAXTough matchup • JAX is #27 in points allowed to RBs
2.8
projected pointsRushing 4.9 carries, 19 yds • Receiving 0.4 targets, 0.4 catches, 0 yds • 0.09 TD
Floor 0.04 of 5 games land hereCeiling 7.6
-0.4Game script
0.0Matchup
-0.1Injuries
How this is built
Recent and last-season usage, the Vegas spread and total, how this defense treats his position, and the injury report (teammates out, QB out). The three boxes show how many points each moved it. When sportsbook player lines are posted (Wednesday to Sunday) they are blended in, leaning on them most for new starters and players with few games. PPR scoring only. Tested on past seasons it is about 5% closer than a plain season average.
NYG RB room
C. Skattebo32%
D. Singletary15%
N. Harris11%
T. Tracy Jr.6%
G. Desrosiers3%
Share of touches
NYG RB room, week by week
Touches = carries + targets. Switch to look at just carries or just targets.
| Player | W1 | W2 | W3 | W4 | W5 | W6 | W7 | W9 | W10 | Per game |
|---|---|---|---|---|---|---|---|---|---|---|
| Cam Skattebo | 1881 yds27% touches61% snaps | 1655 yds30% touches59% snaps | 24100 yds44% touches77% snaps | 1966 yds33% touches64% snaps | 1671 yds20% touches63% snaps | — | 18121 yds30% touches56% snaps | — | 22122 yds36% touches89% snaps | 19.088 yds a game • 4.6 per touch32% touches67% snaps |
| Devin Singletary | 1038 yds15% touches36% snaps | 49 yds8% touches26% snaps | — | — | — | 533 yds8% touches40% snaps | 855 yds13% touches29% snaps | 2439 yds41% touches93% snaps | 13 yds2% touches8% snaps | 8.730 yds a game • 3.4 per touch14% touches39% snaps |
| Tyrone Tracy Jr. | 214 yds3% touches3% snaps | 00 yds0% touches2% snaps | 13 yds2% touches2% snaps | 1-1 yds2% touches18% snaps | 631 yds8% touches19% snaps | 945 yds14% touches38% snaps | 717 yds12% touches15% snaps | — | — | 3.716 yds a game • 4.2 per touch6% touches14% snaps |
| Najee Harris | — | 46 yds8% touches14% snaps | 952 yds17% touches22% snaps | 930 yds16% touches18% snaps | 614 yds8% touches18% snaps | 42 yds6% touches14% snaps | — | — | — | 6.421 yds a game • 3.3 per touch11% touches17% snaps |
| Patrick Ricard | 10 yds2% touches54% snaps | — | — | 21 yds4% touches46% snaps | — | — | — | — | — | 1.51 yds a game • 0.3 per touch3% touches50% snaps |
| Gregory Desrosiers | — | — | — | — | — | — | — | 320 yds5% touches7% snaps | 00 yds0% touches0% snaps | 1.510 yds a game • 6.7 per touch3% touches4% snaps |
Each cell is the count that week with his yards on those touches plus his share of the team and his snap percentage. Click a name to open that player.
Game log
Games5
PPR/G2.3
Game log
Harris avg 2.3NFL top 30 RBs avg 15.7
Solid dot is what he scored. Hollow dot is our projection before the game.
| Use | Game | Proj | PPR | Tgt | Rec | Rec Yd | Car | Rush Yd | TD | Snap |
|---|---|---|---|---|---|---|---|---|---|---|
| W2vs LA | 3.1 | 0.6 | 0 | 0 | 0 | 4 | 6 | 0 | 14% | |
| W3vs TEN | 3.0 | 5.2 | 0 | 0 | 0 | 9 | 52 | 0 | 22% | |
| W4vs ARI | 3.5 | 3 | 0 | 0 | 0 | 9 | 30 | 0 | 18% | |
| W5vs WAS | 3.5 | 2.4 | 1 | 1 | 5 | 5 | 9 | 0 | 18% | |
| W6vs NO | 4.0 | 0.2 | 0 | 0 | 0 | 4 | 2 | 0 | 14% |
Opponent color:Easy defense for RBsAverageTough
Schedule ahead
11 JAX12 IND13 SF14 SEA15 CLE16 DET17 DAL18 PHI
Green easier, red tougher
Schedule ahead
Colored by what each defense has given up to RBs so far. Green is an easier matchup, red is a tougher one.
Wk 11 JAXWk 12 INDWk 13 SFWk 14 SEAWk 15 CLEWk 16 DETWk 17 DALWk 18 PHISee every team's RB schedule ›
StatPer gameSeasonRank
Overall
Games—531›
PPR points2.311.45›
Receiving
Targets0.211›
Catches0.211›
Receiving yards153›
Yards per target5—47›
Yards per catch3.2—31›
Rushing
Carries6.23123›
Rush yards19.89919›
Scrimmage yards20.81047›
Usage
Snap %17%—1›
Target share %0.4%—1›
Touch share %10.8%—10›
Carry share %27.2%—50›
Air yards share %0.1%262›
Scoring chances
Red-zone carries1.4—37›
Goal-line carries0.4—51›
Tap any stat to see everyone ranked. Bars: green top 30%, yellow middle, red bottom 40%.
Advanced stats
Not ranked yet. Needs 60 carries and he has 31.
Fumbles lostOne
1 this season
Mania breakdown
Fantasy Production4
Touch Volume5
Backfield Control0
Goal-Line / Red-Zone32
Per-Touch Efficiency16
Mania breakdown
Percentile among RBs. 100 is the best, 50 is average.
How many fantasy points and total yards he is actually producing, compared with players at his position. Ranks better than 4% of RBs.
How many carries and targets he gets per game compared with other running backs. Ranks better than 5% of RBs.
How much of his team backfield he owns: share of touches plus snap share. Ranks better than 0% of RBs.
Scoring-position work: red-zone carries, goal-line carries (inside the 5) and red-zone targets. Ranks better than 32% of RBs.
What he produces with each touch instead of just rewarding volume: fantasy points per touch, yards per carry and catch rate. Ranks better than 16% of RBs.
Top 30%MiddleBottom 40%Tap a category to see what it means.
Week 11 matchup
vs JAX
Tough matchup
Adjustment-2.1 pts
Allows to RBs27th most
Week11
Week 11 matchup
vs JAX
-0.5Rating boost
Neutral matchup27th easiest of 32 defenses for RBs
ToughEasy
18.8PPR a game JAX allows to RBs
5.9Similar players, usual PPR a game
5.7Same players against JAX
Players with a role like his scored 5.7 PPR a game against JAX, versus 5.9 in their usual games (-2%). That moves his Week 11 Rating by -0.5. It is a small sample this early, so it counts for little.
How running backs did against JAX
18.8 PPR points a game allowed to running backs, 27th most of 32 defenses.
| Player | PPR | Rush | Rush Yd | Rush TD | Rec | Rec Yd |
|---|---|---|---|---|---|---|
| Tony Pollard@ TEN • Wk 10 | 23.9 | 9 | 33 | 0 | 8 | 66 |
| Chase Brown@ CIN • Wk 4 | 19.1 | 9 | 10 | 0 | 11 | 71 |
| Justice Hill@ BAL • Wk 9 | 18.2 | 9 | 85 | 1 | 3 | 7 |
| Jonah Coleman@ DEN • Wk 2 | 14.8 | 10 | 39 | 1 | 3 | 19 |
| Jawhar Jordanvs HOU • Wk 6 | 12.0 | 6 | 43 | 1 | 1 | 7 |
| Woody Marksvs HOU • Wk 6 | 10.1 | 15 | 56 | 0 | 2 | 25 |
| Will Shipleyvs PHI • Wk 5 | 8.3 | 5 | 6 | 1 | 1 | 7 |
| Quinshon Judkinsvs CLE • Wk 1 | 7.0 | 12 | 33 | 0 | 2 | 17 |
| Rhamondre Stevensonvs NE • Wk 3 | 6.8 | 7 | 22 | 0 | 3 | 16 |
| Jonathan Taylorvs IND • Wk 8 | 6.7 | 8 | 23 | 0 | 4 | 24 |
| Raheim Sandersvs CLE • Wk 1 | 5.6 | 1 | 1 | 0 | 3 | 25 |
| Derrick Henry@ BAL • Wk 9 | 5.6 | 17 | 57 | 0 | 0 | 0 |
| Tyler Badie@ DEN • Wk 2 | 4.9 | 1 | 1 | 0 | 2 | 28 |
| DJ Giddensvs IND • Wk 8 | 4.3 | 6 | 43 | 0 | 0 | 0 |
| TreVeyon Hendersonvs NE • Wk 3 | 3.9 | 8 | 23 | 0 | 1 | 6 |
| Tyjae Spears@ TEN • Wk 10 | 3.8 | 4 | 28 | 0 | 1 | 0 |
| Corey Kinervs NE • Wk 3 | 3.7 | 6 | 18 | 0 | 1 | 9 |
| J.K. Dobbins@ DEN • Wk 2 | 3.6 | 10 | 36 | 0 | 0 | 0 |
| Dameon Piercevs PHI • Wk 5 | 3.2 | 11 | 14 | 0 | 2 | -2 |
| Seth McGowanvs IND • Wk 8 | 2.9 | 5 | 29 | 0 | 0 | 0 |
| Samaje Perine@ CIN • Wk 4 | 0.7 | 3 | 7 | 0 | 0 | 0 |
Fantasy points first, then the stats that matter for his position. Ring around each photo is that player's Mania Rating. Tap a name to open his profile.
Usage
Snaps
17%
Touch share
11%
Carries/G
6.2
PPR/G
2.3
By the numbers
PPR / Game
2.3
4th percentileRB avg 10.9
Rushing Attempts / Game
6.2
23rd percentileRB avg 11
Rush Yards / Game
19.8
19th percentileRB avg 45.2
Targets / Game
0.2
1st percentileRB avg 2.9
Scrimmage Yards / Game
20.8
7th percentileRB avg 61.1
Share of Team Touches
10.8%
10th percentileRB avg 23.9%
Red-Zone Carries / Game
1.4
37th percentileRB avg 2
Goal-Line Carries / Game
0.4
51st percentileRB avg 0.6
Red-Zone Targets / Game
0
22nd percentileRB avg 0.4
End-Zone Targets / Game
0
81st percentileRB avg 0
Snap Share
17.2%
0th percentileRB avg 51.4%
TDs / Game
0
19th percentileRB avg 0.5