
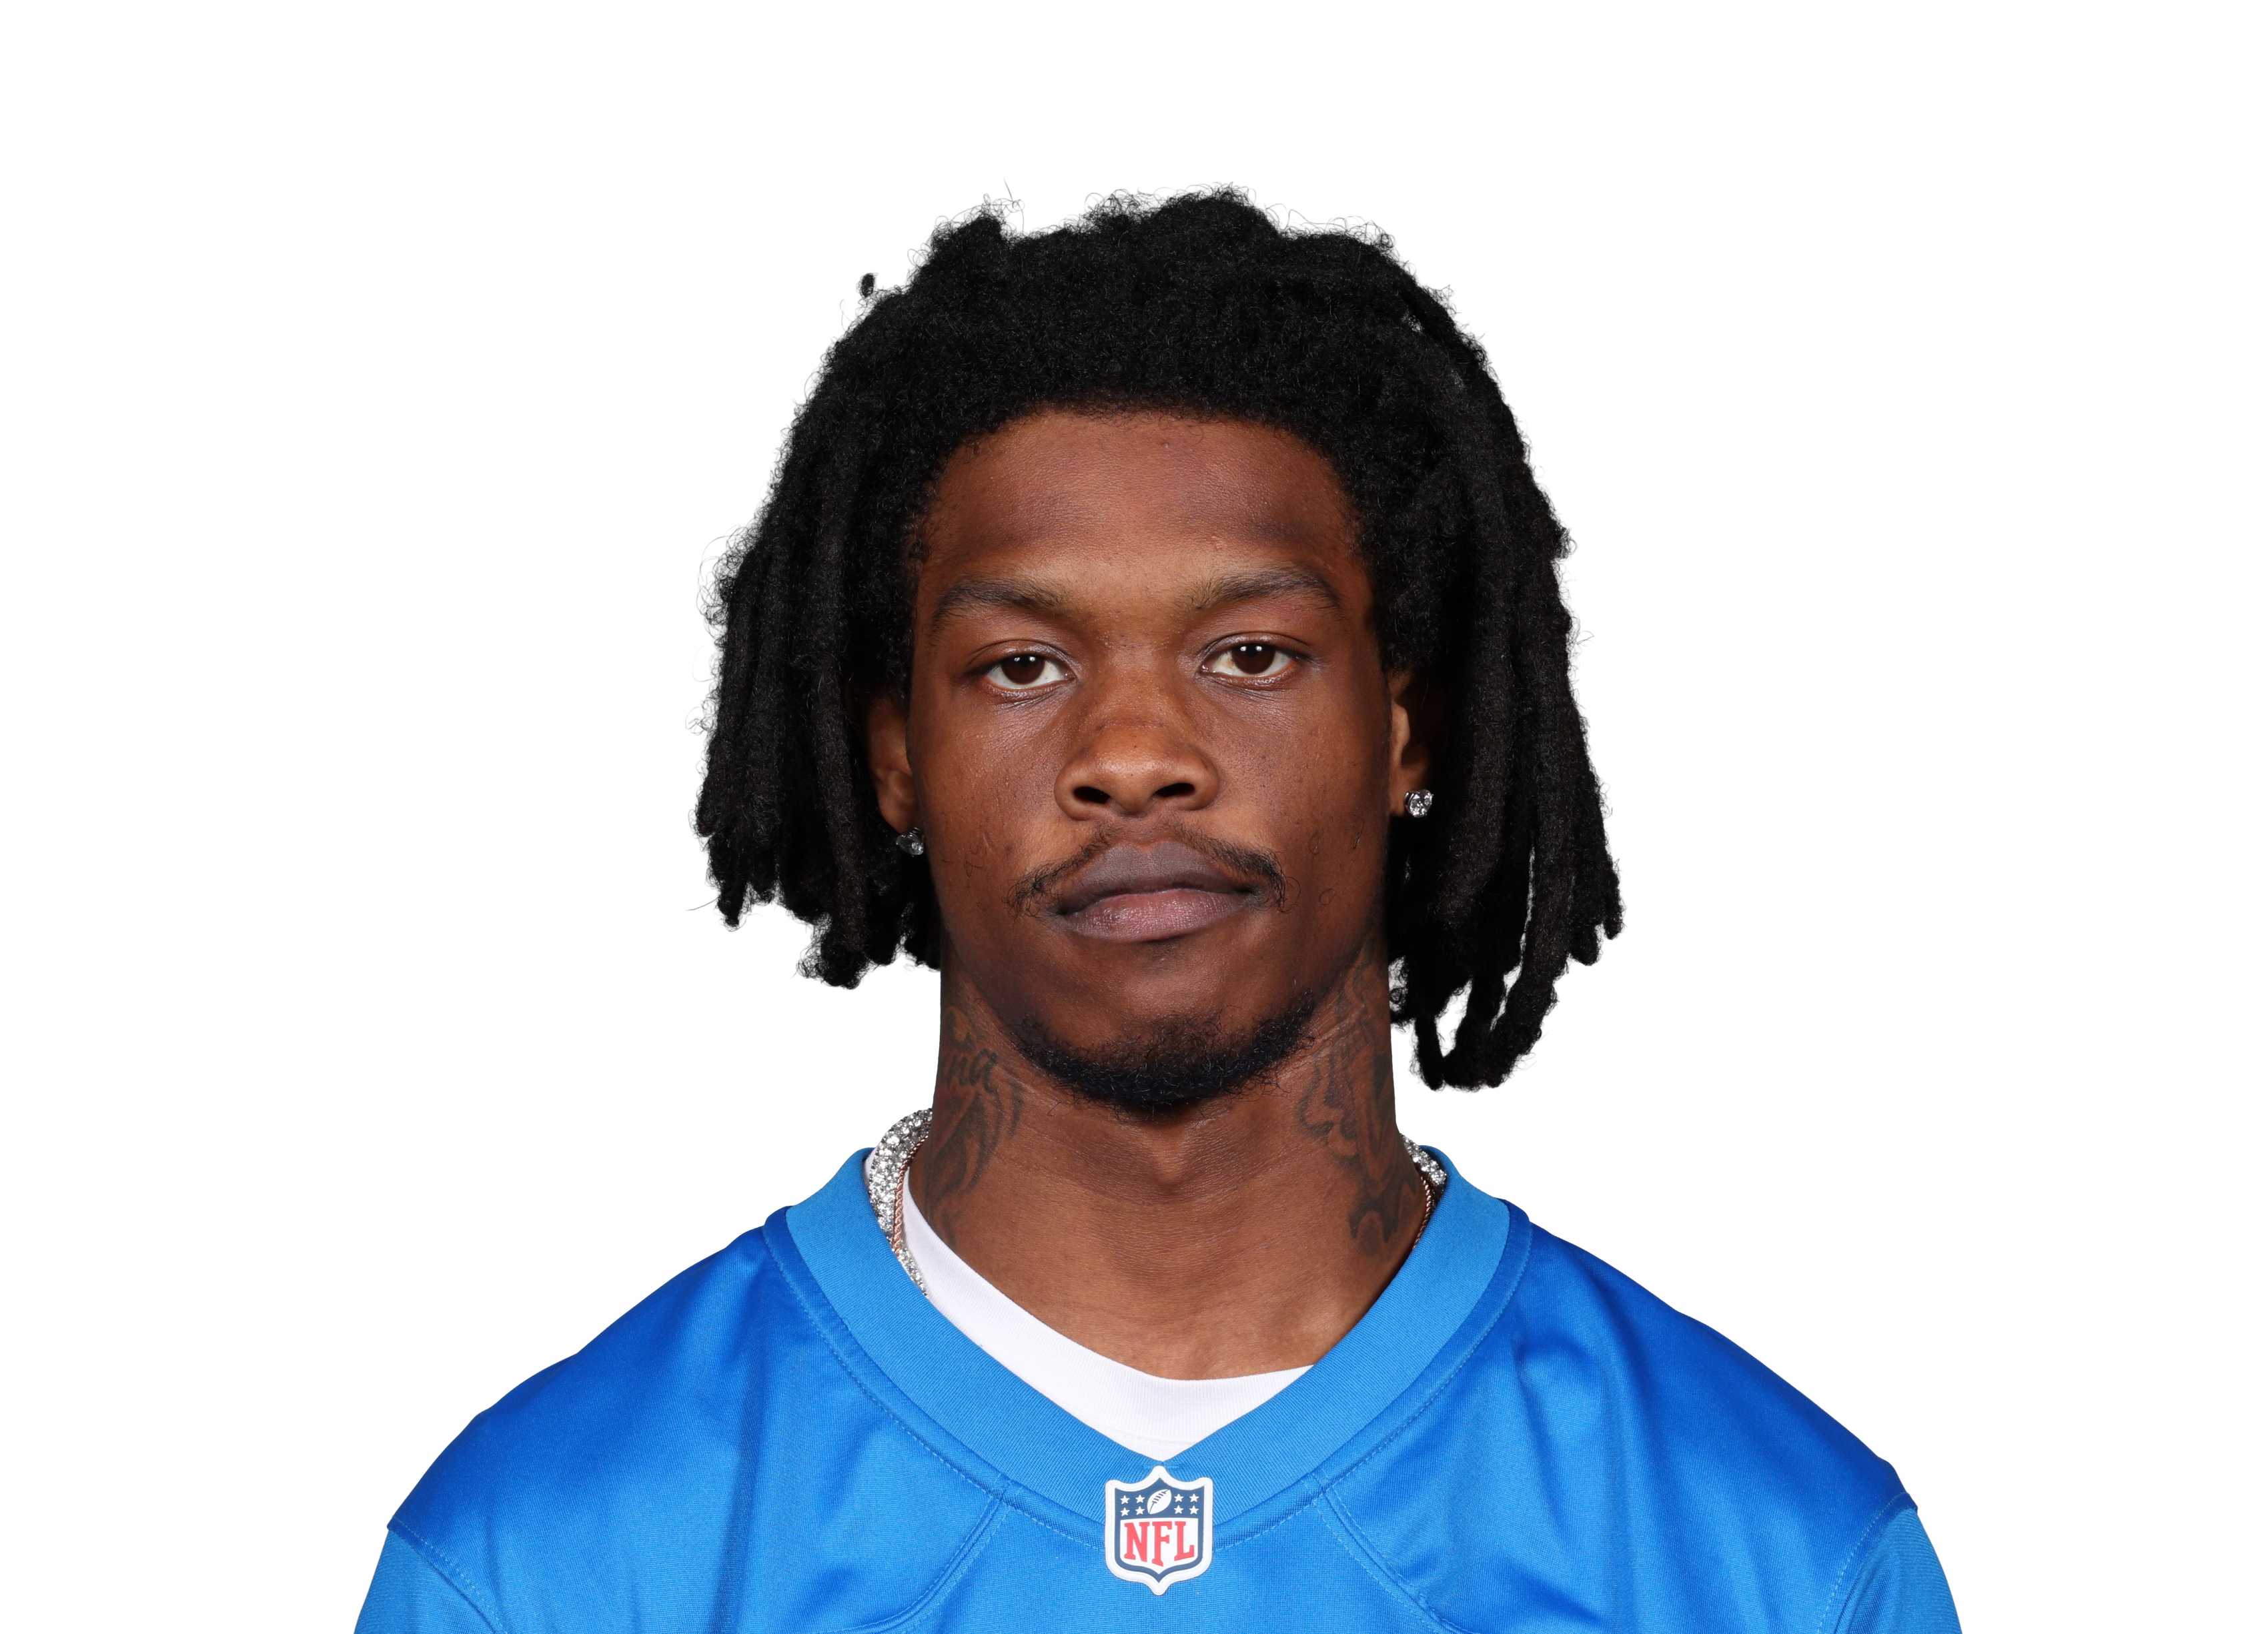
Jameson Williams
 DET • WR • 9 games
Pick a teammate with or without. Pick more than one to combine them, like a game without the QB and without the other back.
DET TB
How this is built
29.8 PPR points a game allowed to wide receivers, 23rd most of 32 defenses.
| Player | PPR | Tgt | Rec | Rec Yd | Rec TD | Rush Yd |
|---|---|---|---|---|---|---|
 George Pickens@ DAL • Wk 5 | 28.0 | 13 | 9 | 130 | 1 | 0 |
 Germie Bernardvs PIT • Wk 6 | 25.7 | 12 | 11 | 87 | 1 | 0 |
 Luther Burden III@ CHI • Wk 9 | 20.7 | 10 | 7 | 97 | 1 | 0 |
 Denzel Bostonvs CLE • Wk 2 | 20.5 | 7 | 5 | 95 | 1 | 0 |
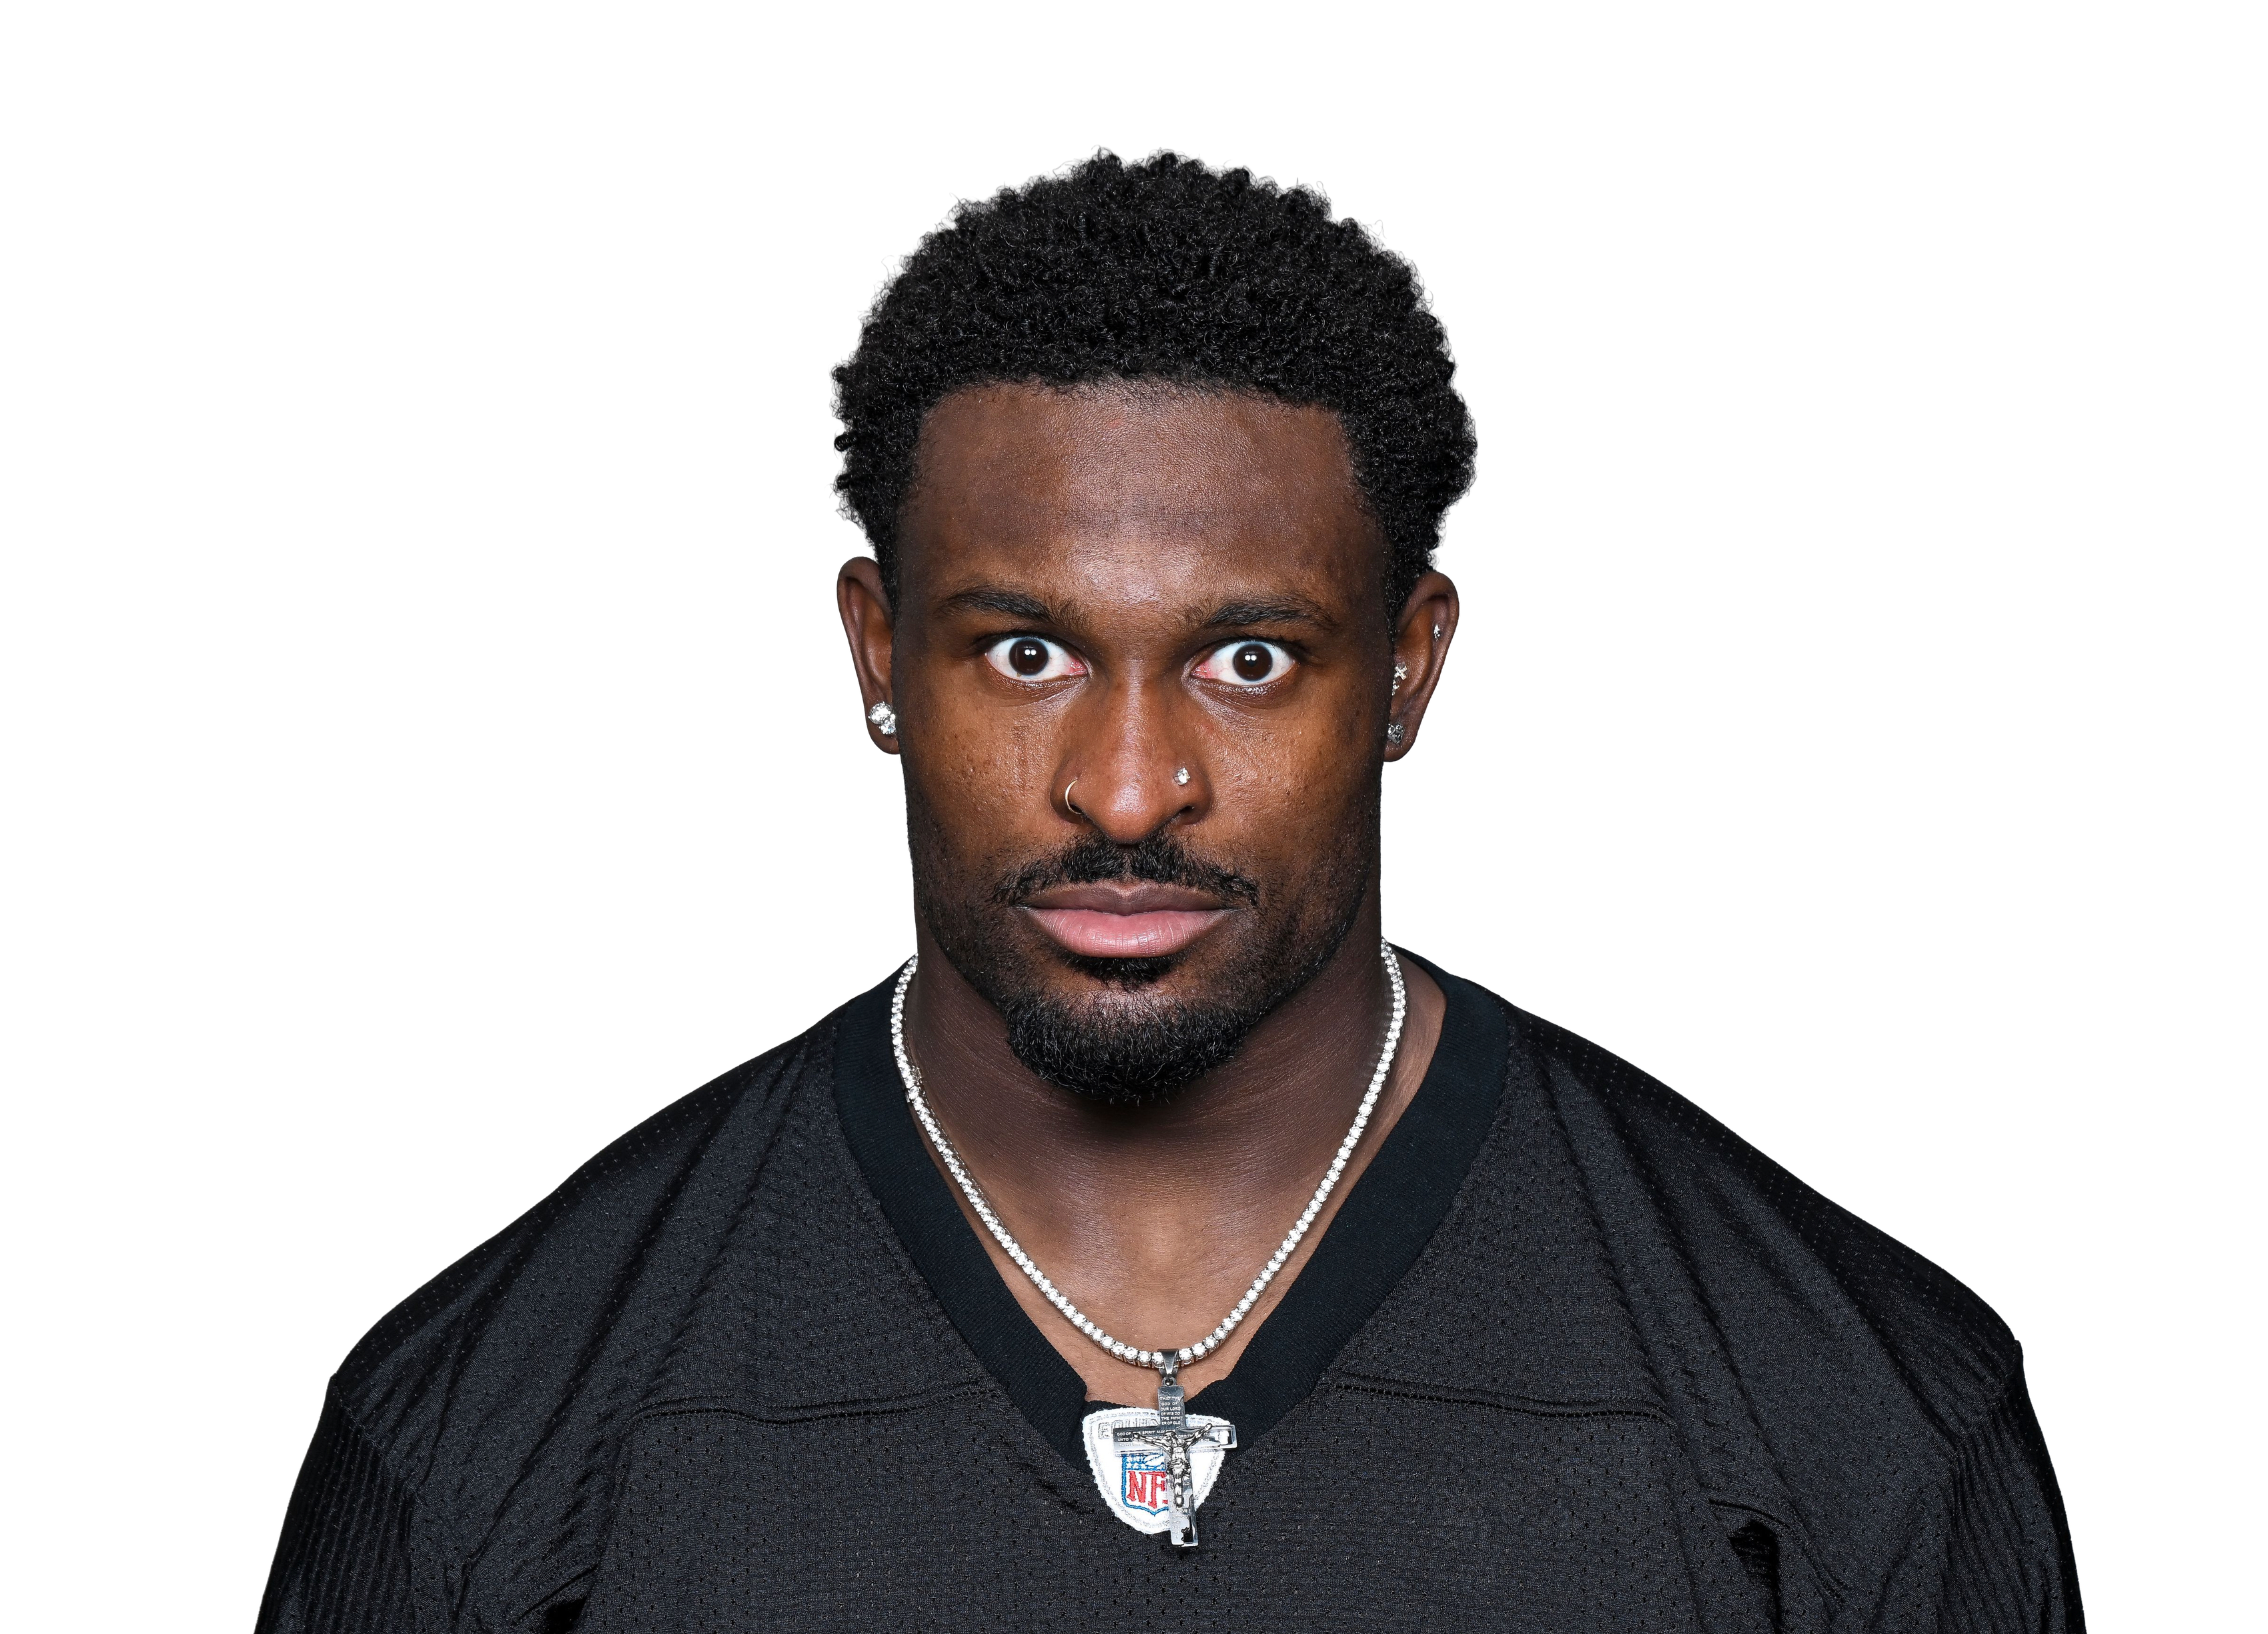 DK Metcalfvs PIT • Wk 6 | 20.3 | 15 | 11 | 93 | 0 | 0 |
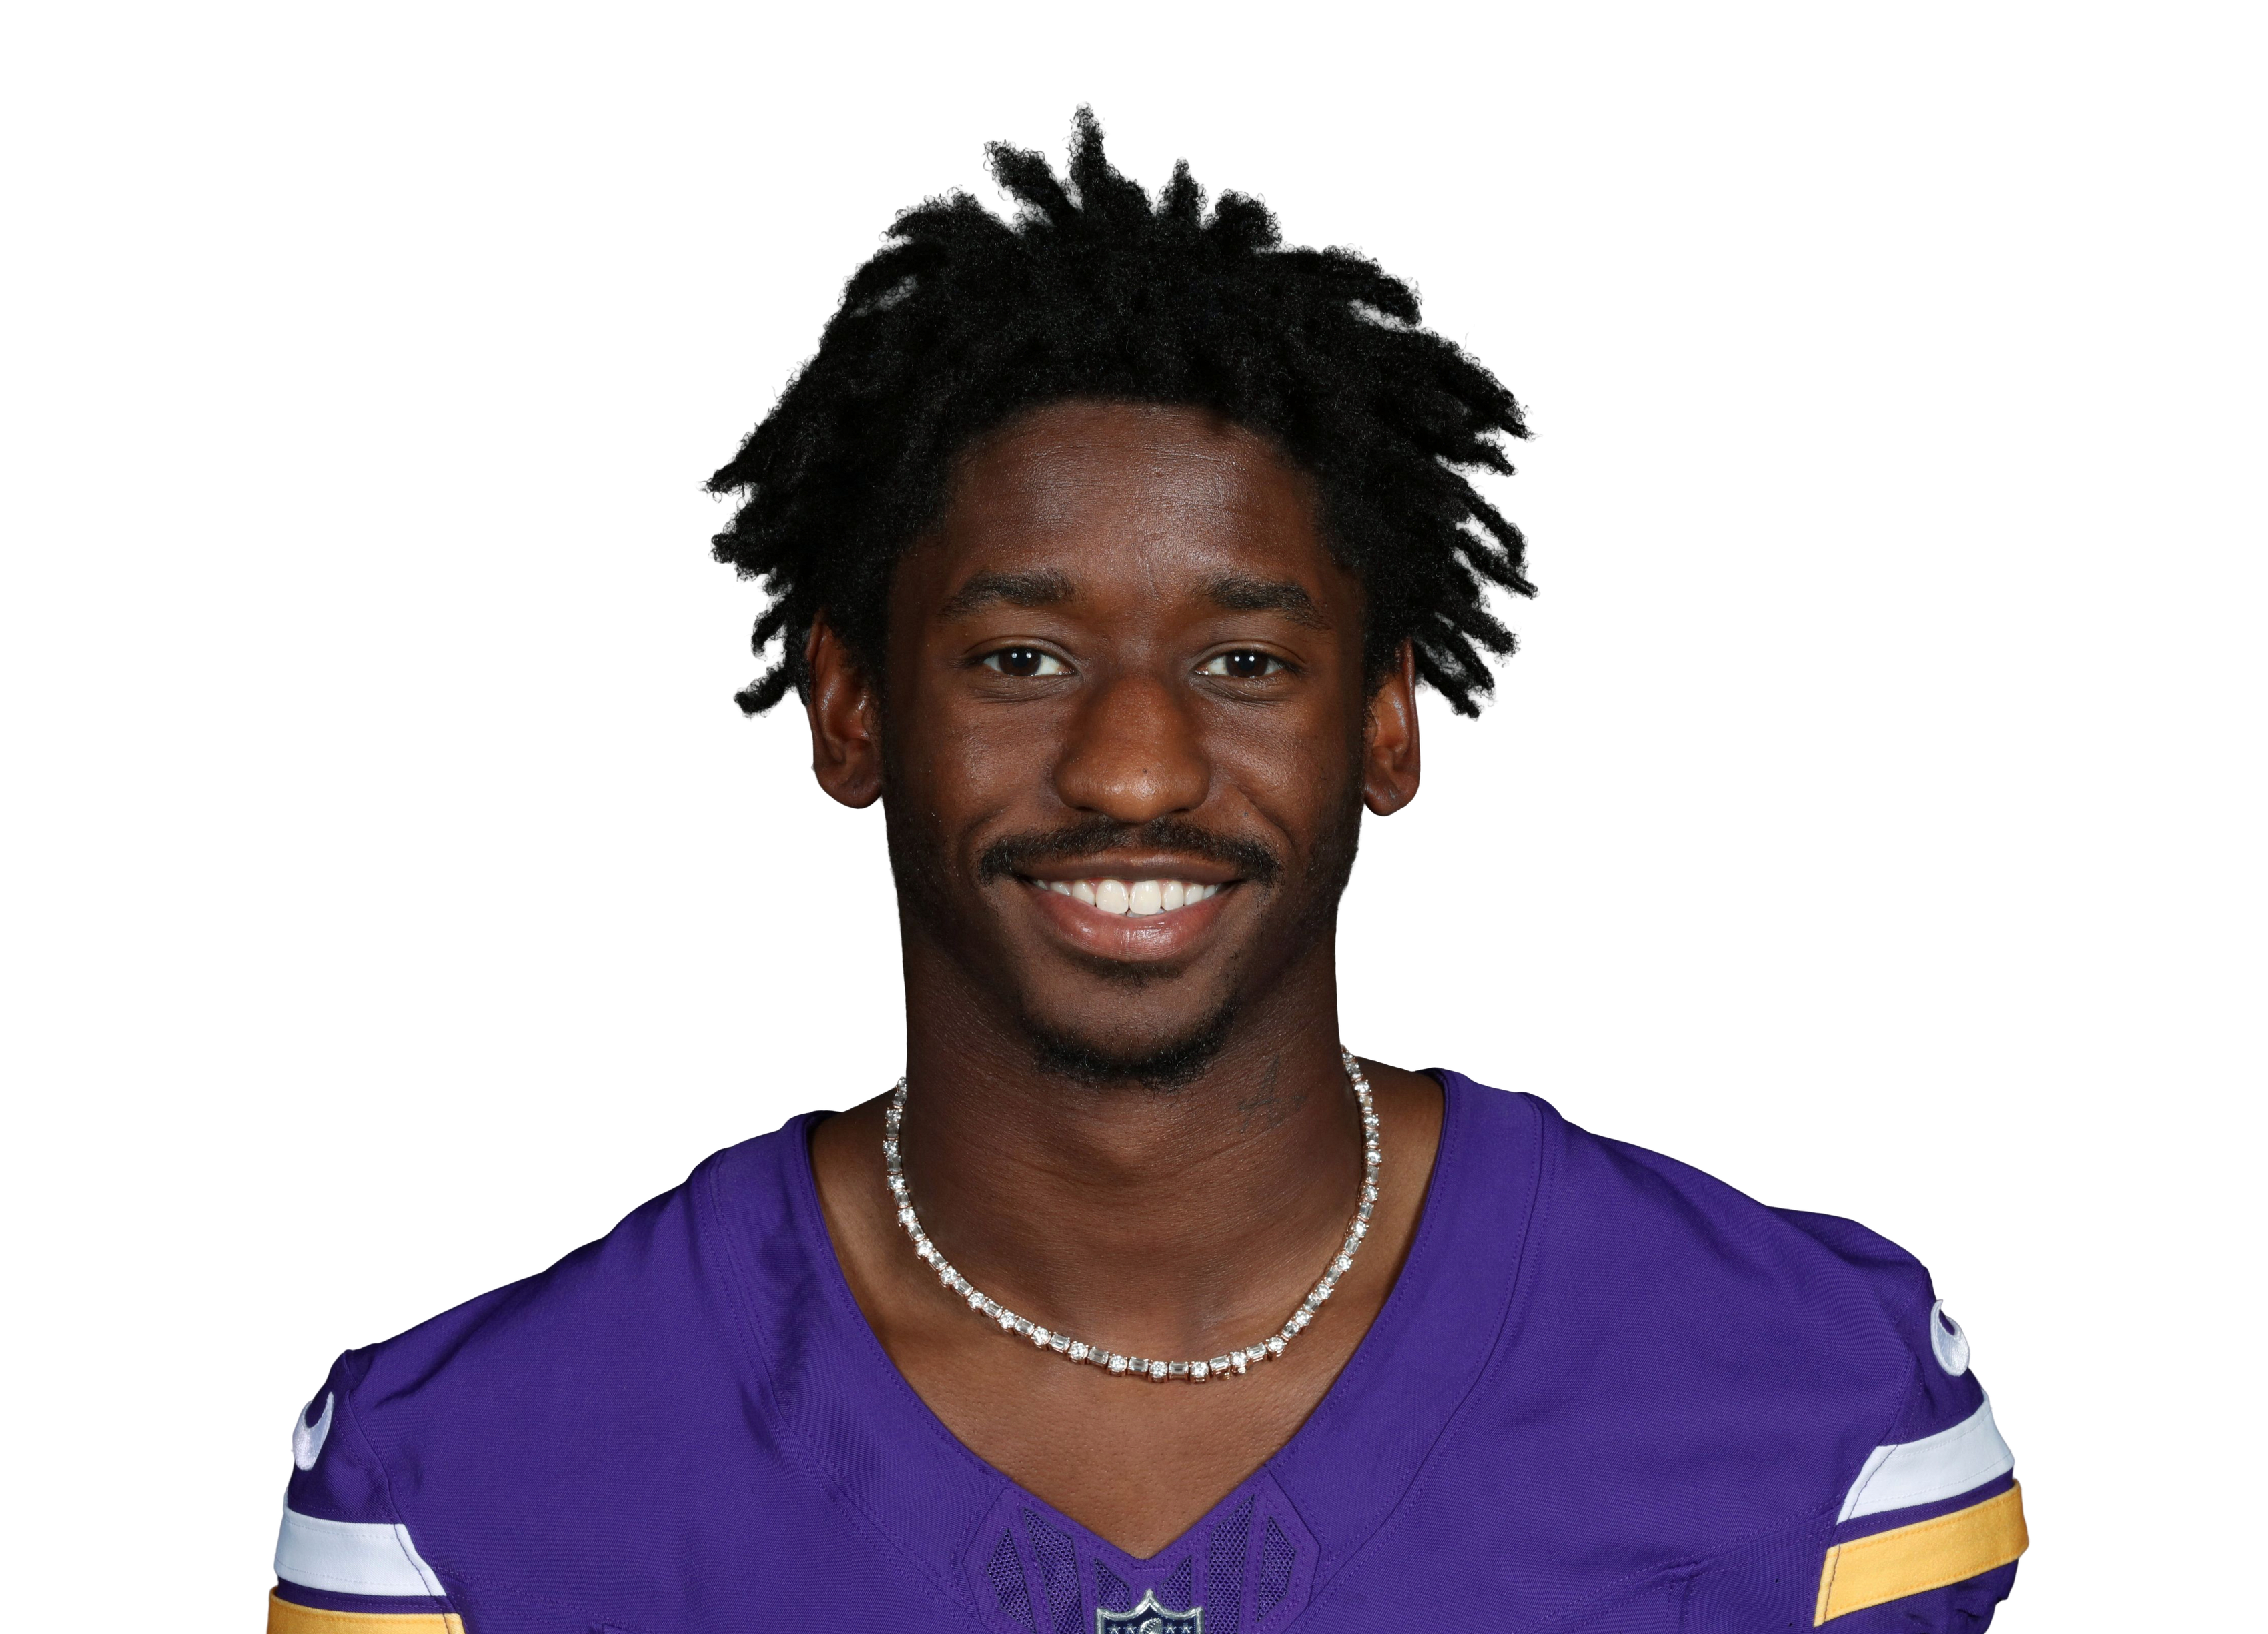 Jordan Addisonvs MIN • Wk 3 | 20.0 | 9 | 5 | 90 | 1 | 0 |
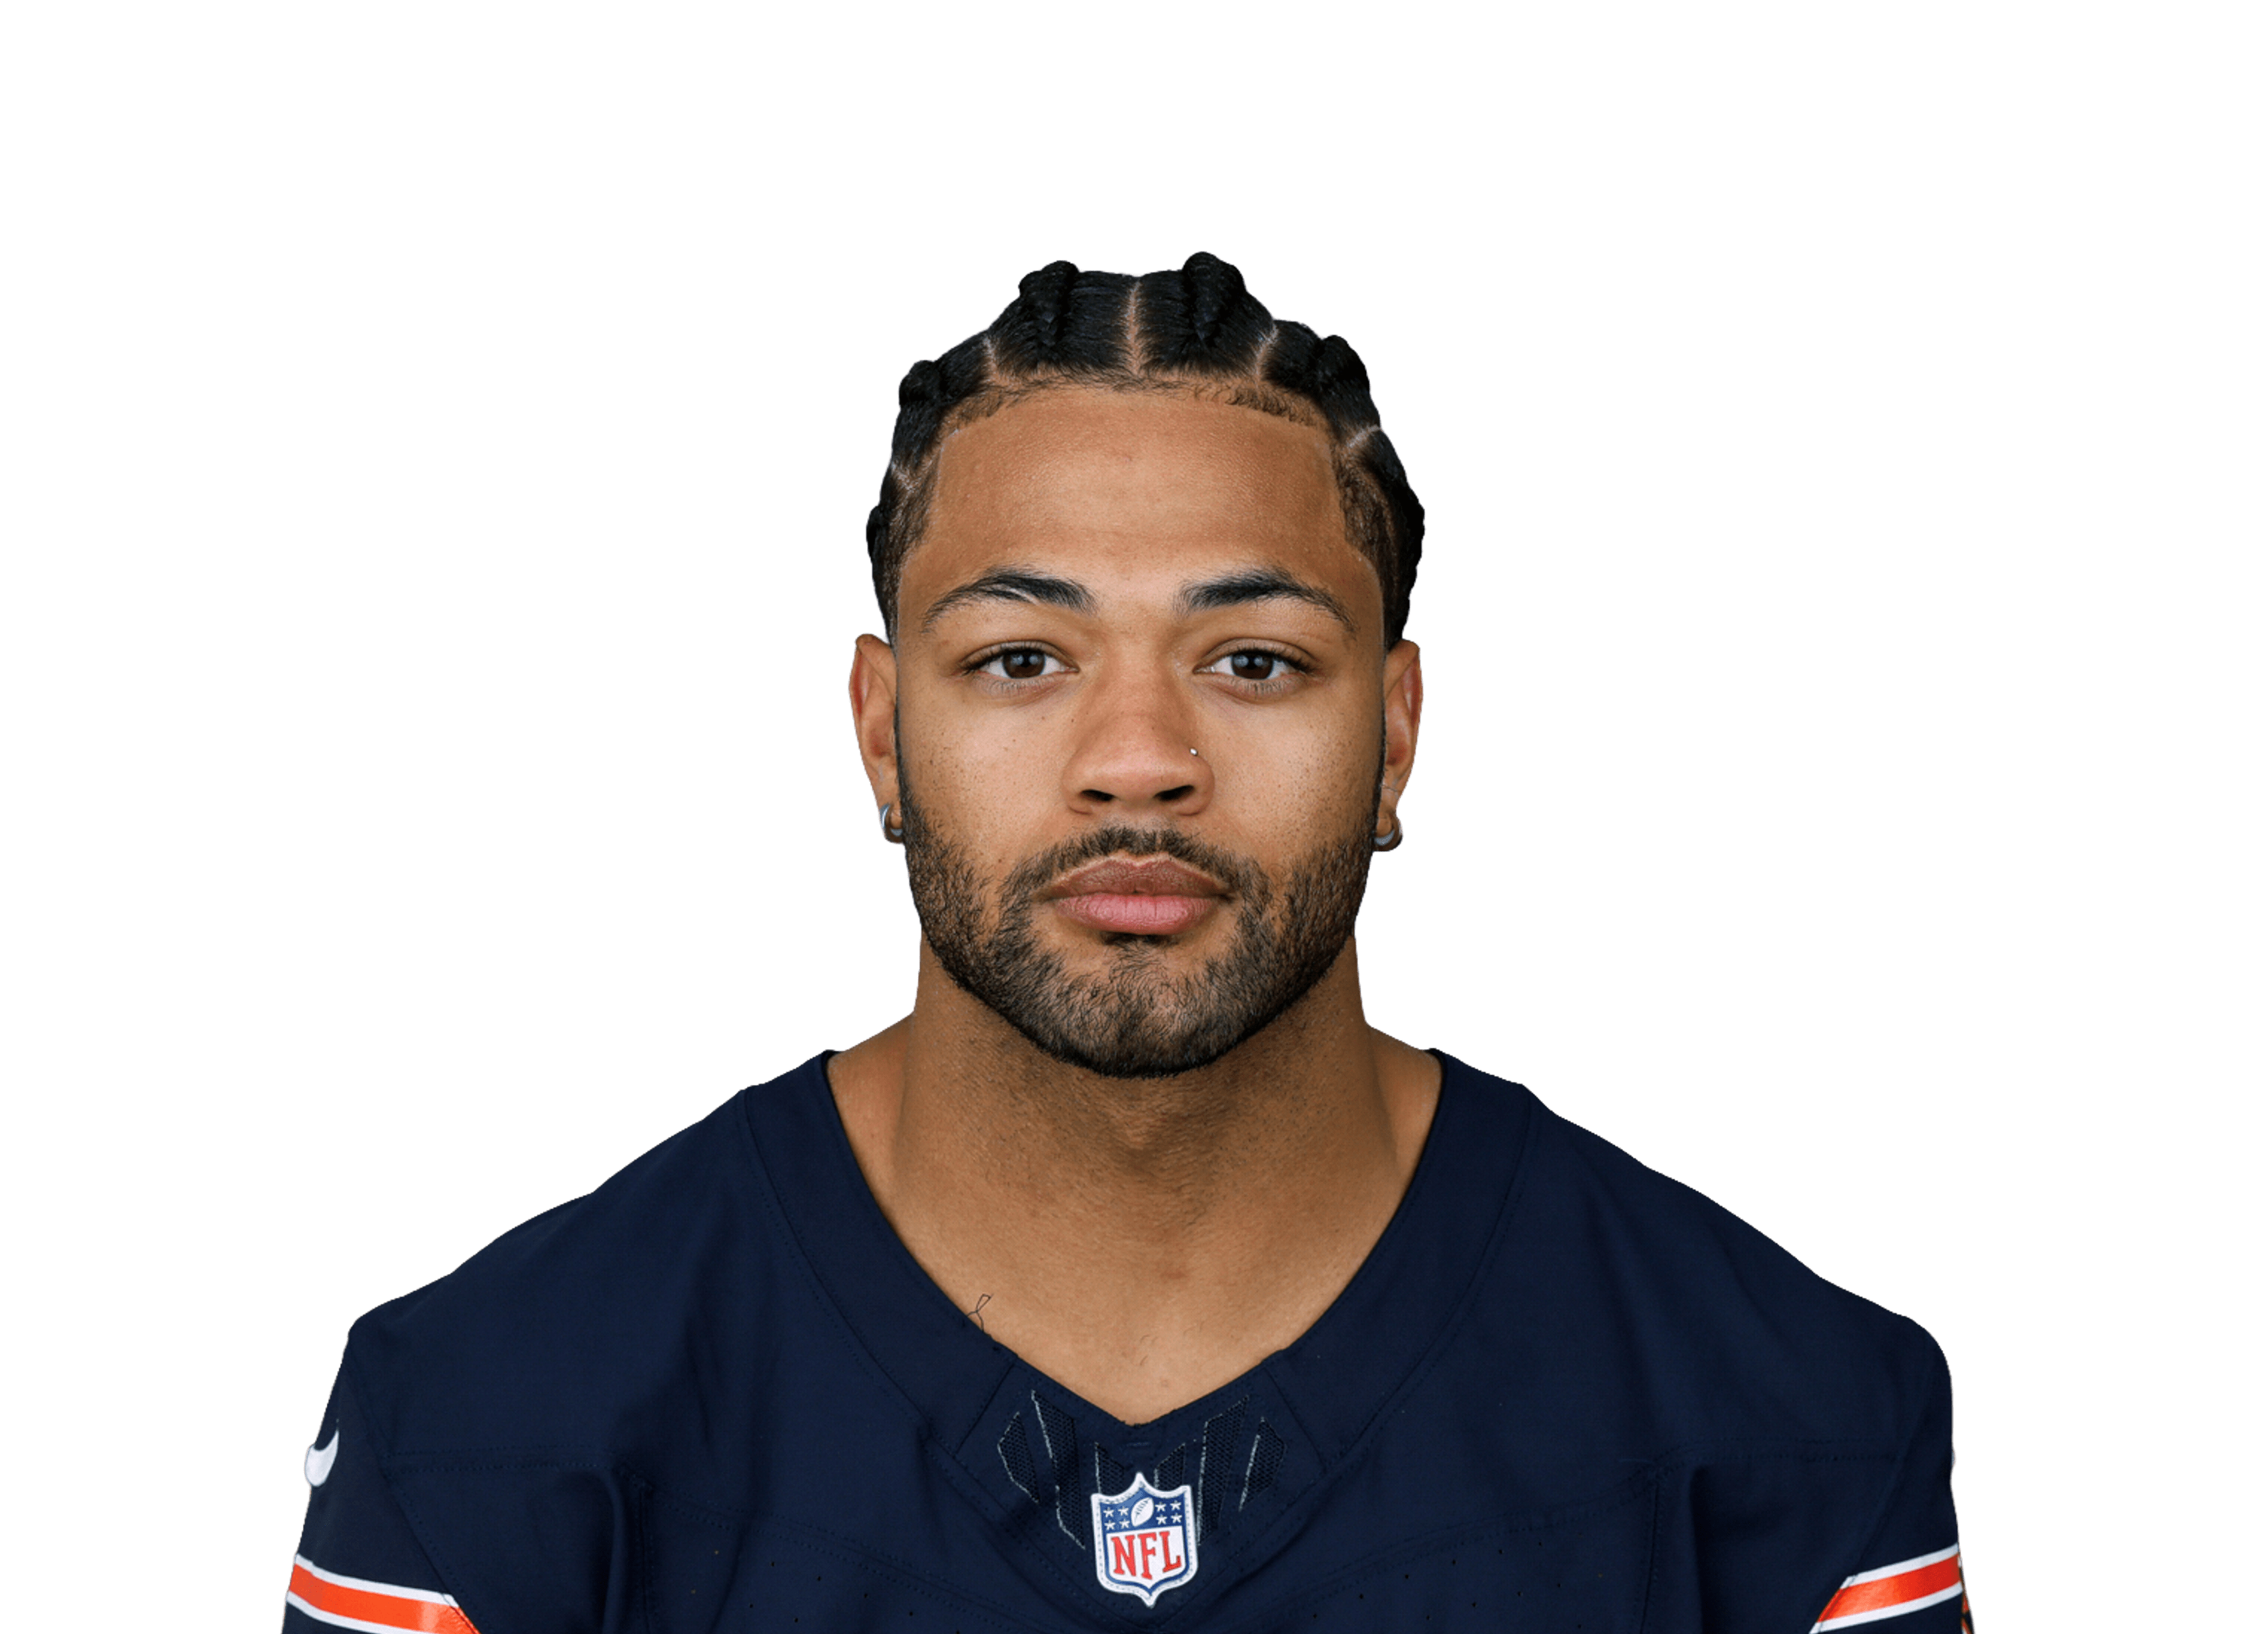 Rome Odunze@ CHI • Wk 9 | 16.0 | 7 | 4 | 60 | 1 | 0 |
 Ryan Flournoy@ DAL • Wk 5 | 12.0 | 4 | 3 | 90 | 0 | 0 |
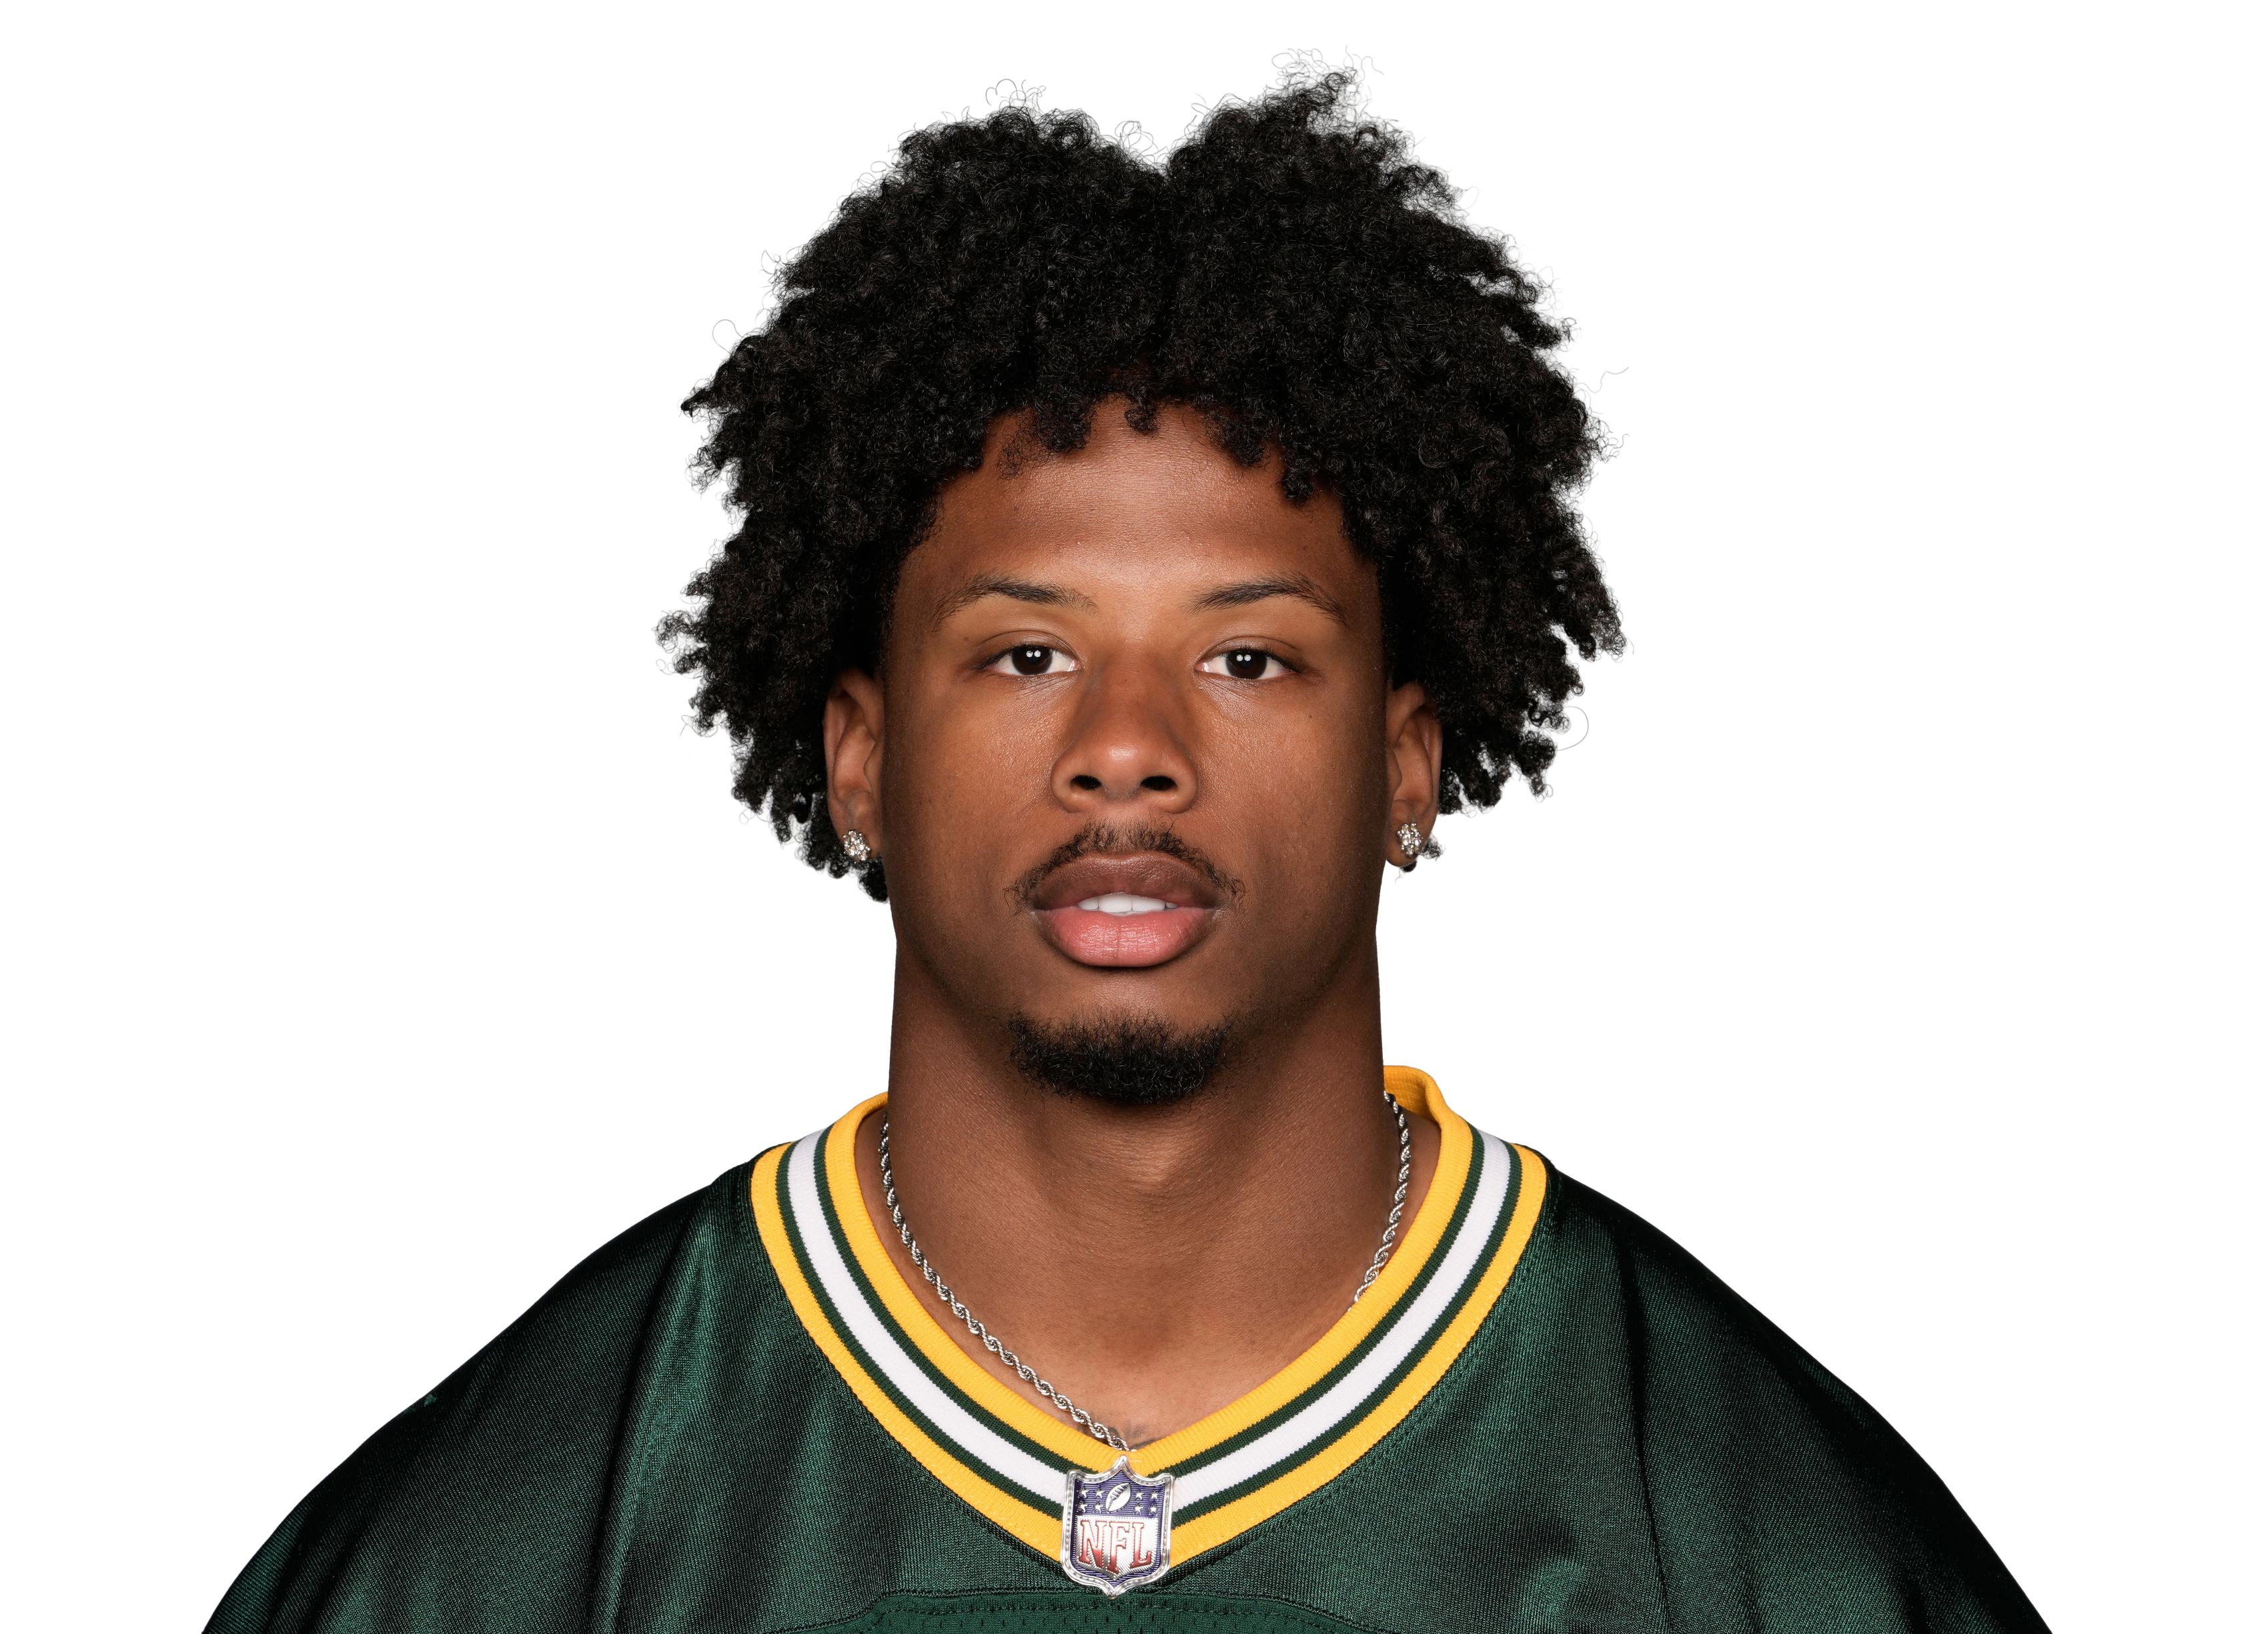 Matthew Goldenvs GB • Wk 4 | 11.7 | 7 | 3 | 21 | 1 | 6 |
 Jahan Dotsonvs ATL • Wk 8 | 11.5 | 5 | 2 | 95 | 0 | 0 |
 Tee Higgins@ CIN • Wk 1 | 8.9 | 6 | 3 | 59 | 0 | 0 |
 KC Concepcionvs CLE • Wk 2 | 8.2 | 6 | 6 | 28 | 0 | -6 |
 Tetairoa McMillan@ CAR • Wk 7 | 8.0 | 6 | 4 | 40 | 0 | 0 |
 Christian Watsonvs GB • Wk 4 | 7.7 | 3 | 3 | 47 | 0 | 0 |
 Kalif Raymond@ CHI • Wk 9 | 7.2 | 7 | 4 | 32 | 0 | 0 |
 Justin Jeffersonvs MIN • Wk 3 | 5.2 | 2 | 2 | 32 | 0 | 0 |
 KaVontae Turpin@ DAL • Wk 5 | 4.2 | 4 | 2 | 22 | 0 | 0 |
 Jonathan Mingo@ DAL • Wk 5 | 4.0 | 4 | 2 | 20 | 0 | 0 |
 John Metchie III@ CAR • Wk 7 | 4.0 | 4 | 2 | 20 | 0 | 0 |
 Dohnte Meyers@ CIN • Wk 1 | 3.8 | 1 | 1 | 18 | 0 | 10 |
 Ja'Marr Chase@ CIN • Wk 1 | 3.2 | 4 | 2 | 12 | 0 | 0 |
 Andrei Iosivas@ CIN • Wk 1 | 3.2 | 3 | 2 | 12 | 0 | 0 |
 CeeDee Lamb@ DAL • Wk 5 | 2.9 | 5 | 2 | 9 | 0 | 0 |
 Zavion Thomas@ CHI • Wk 9 | 2.3 | 2 | 1 | 13 | 0 | 0 |
 Isaiah Bondvs CLE • Wk 2 | 2.0 | 1 | 1 | 10 | 0 | 0 |
 Jalen Coker@ CAR • Wk 7 | 1.9 | 4 | 1 | 9 | 0 | 0 |
 Drake Londonvs ATL • Wk 8 | 1.8 | 6 | 1 | 8 | 0 | 0 |
 Olamide Zaccheausvs ATL • Wk 8 | 1.4 | 2 | 1 | 4 | 0 | 0 |
 Jauan Jenningsvs MIN • Wk 3 | 1.1 | 2 | 1 | 1 | 0 | 0 |
 Skyy Moorevs GB • Wk 4 | 0.8 | 2 | 1 | -2 | 0 | 0 |
 Jerry Jeudyvs CLE • Wk 2 | 0.0 | 1 | 0 | 0 | 0 | 0 |
 Tai Feltonvs MIN • Wk 3 | 0.0 | 2 | 0 | 0 | 0 | 0 |
 Bo Meltonvs GB • Wk 4 | 0.0 | 1 | 0 | 0 | 0 | 0 |
 J. Michael Sturdivantvs GB • Wk 4 | 0.0 | 1 | 0 | 0 | 0 | 0 |
 David Moore@ CAR • Wk 7 | 0.0 | 1 | 0 | 0 | 0 | 0 |
 Brycen Tremayne@ CAR • Wk 7 | 0.0 | 1 | 0 | 0 | 0 | 0 |
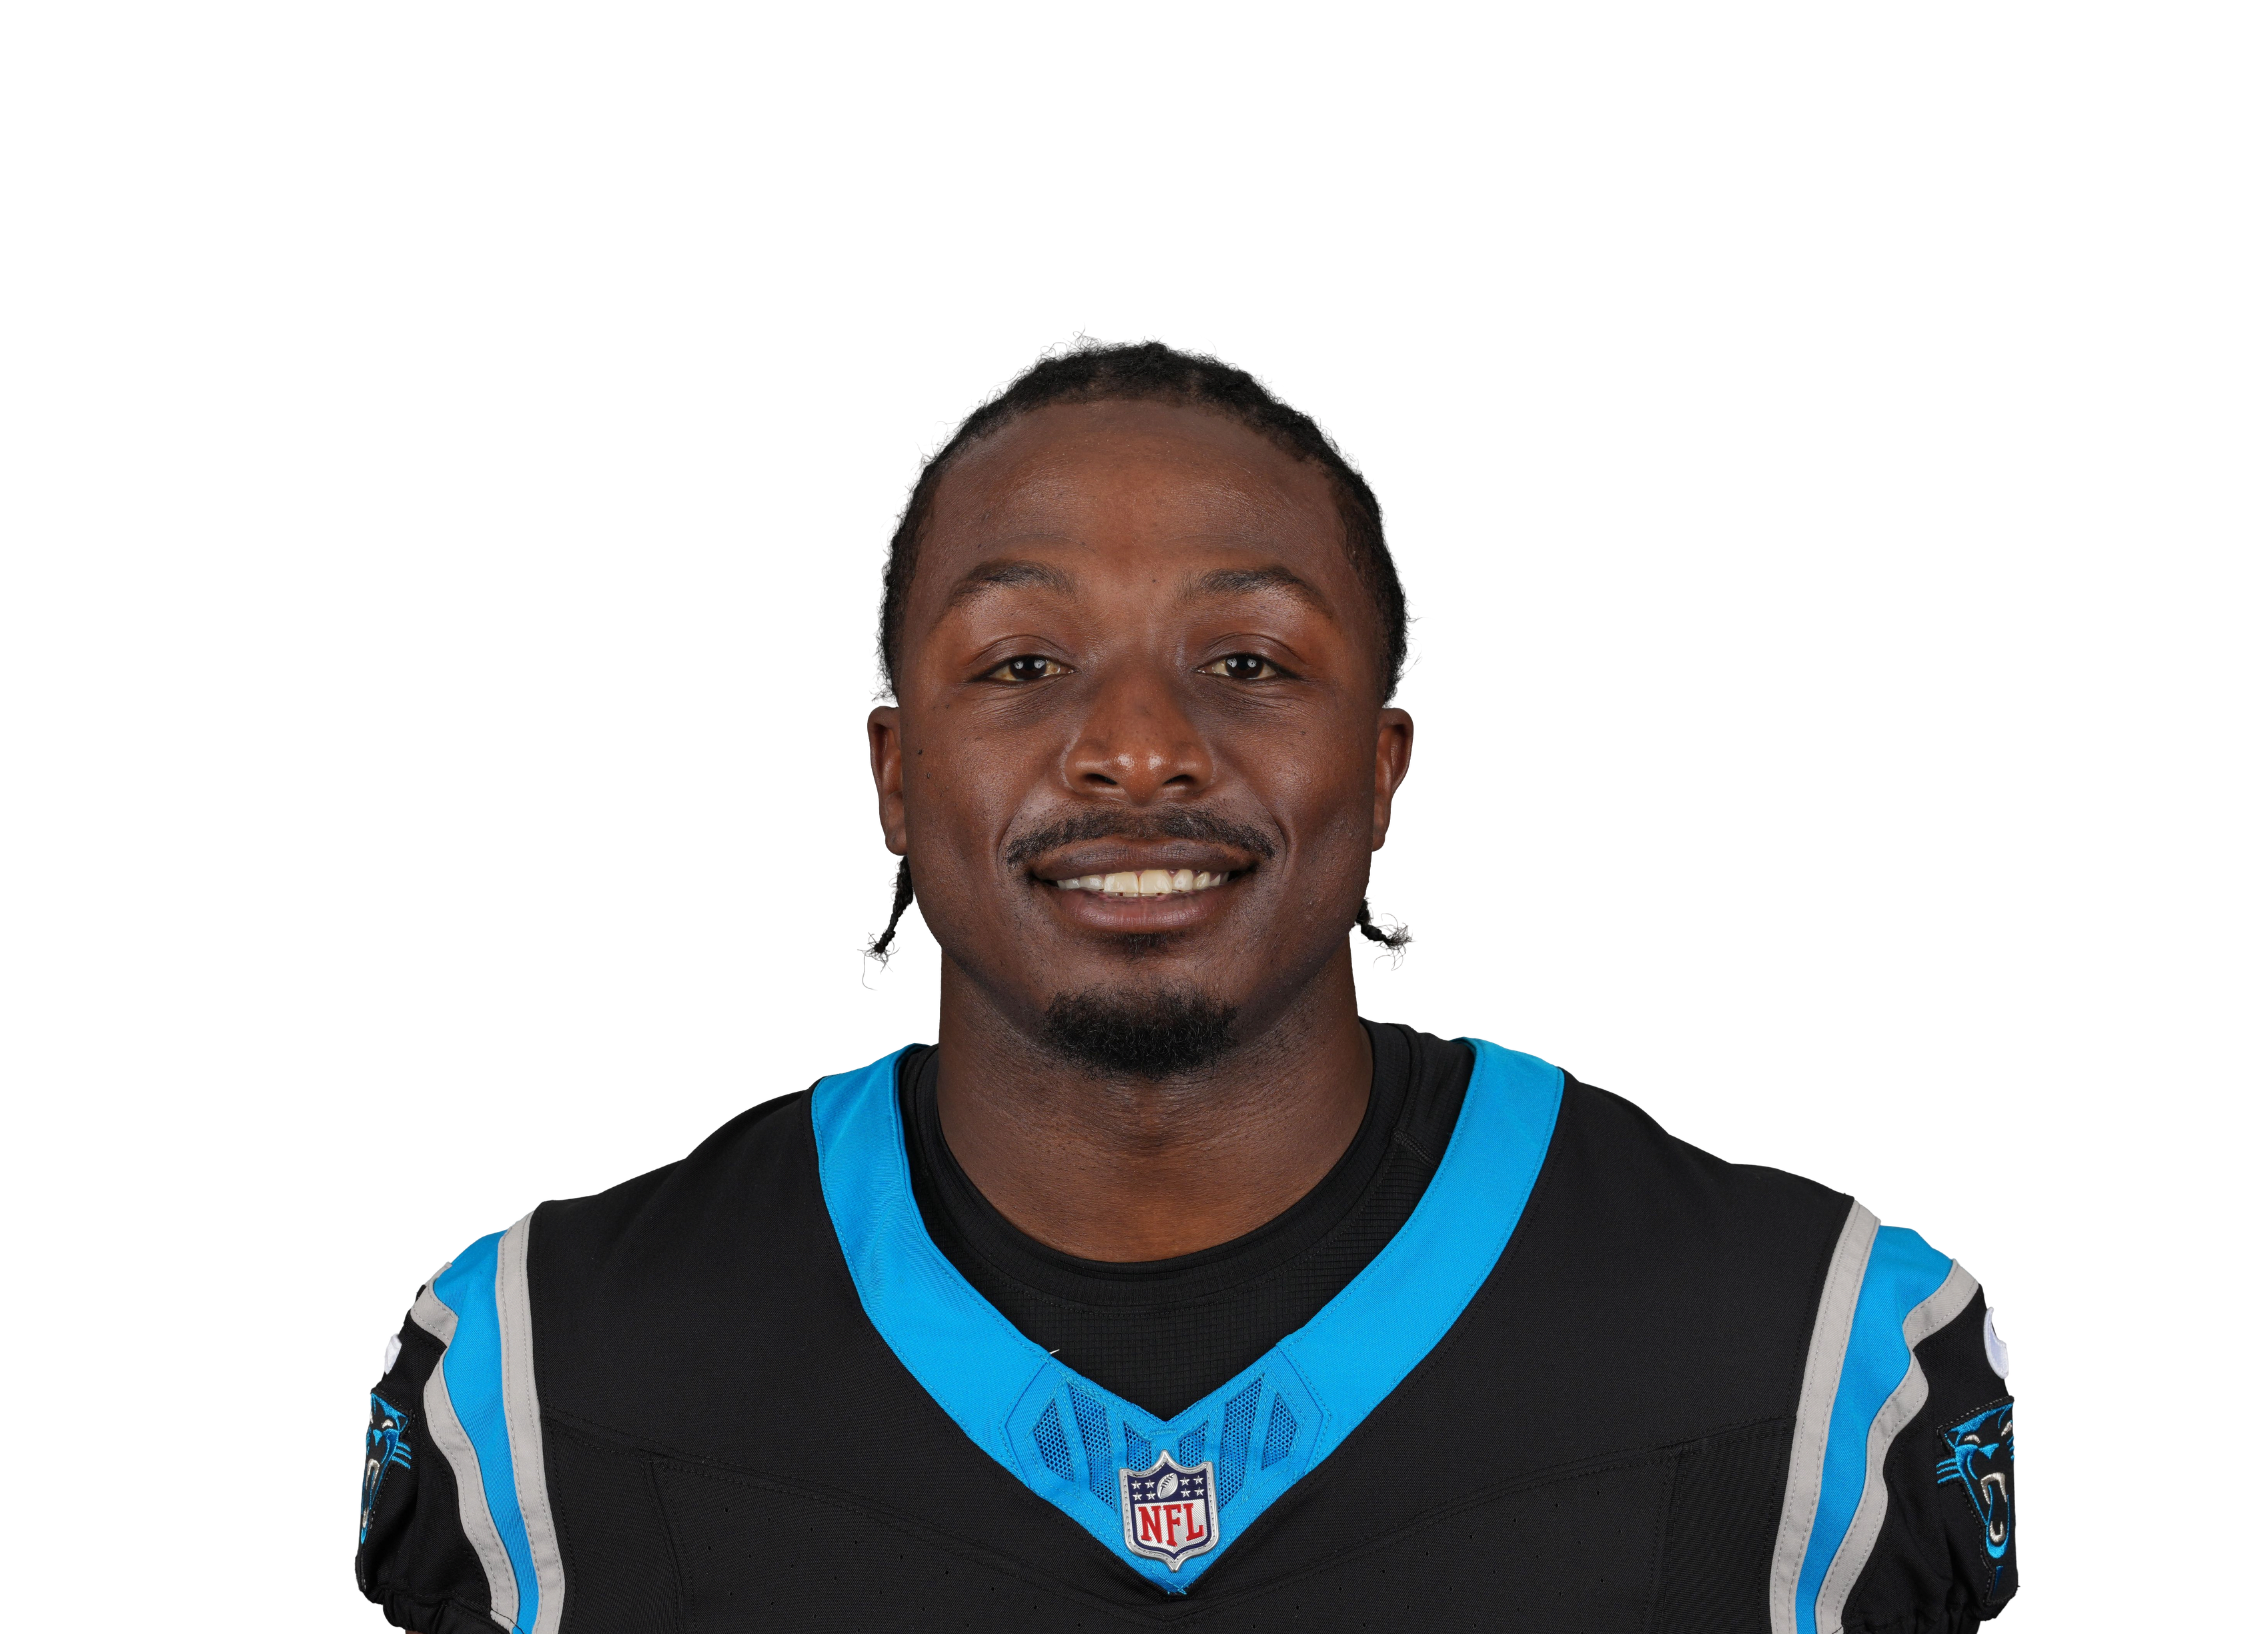
Fantasy points first, then the stats that matter for his position. Ring around each photo is that player's Mania Rating. Tap a name to open his profile.
| Player | W1 | W2 | W3 | W4 | W5 | W7 | W8 | W9 | W10 | Per game |
|---|---|---|---|---|---|---|---|---|---|---|
| Amon-Ra St. Brown | 1467 yds36% targets90% snaps | 13142 yds34% targets95% snaps | 819 yds26% targets74% snaps | 1175 yds22% targets96% snaps | 1169 yds38% targets86% snaps | 11153 yds36% targets78% snaps | 846 yds32% targets72% snaps | 1086 yds40% targets75% snaps | 598 yds16% targets66% snaps | 10.184 yds a game • 8.3 per target31% targets81% snaps |
| Jameson Williams | 945 yds23% targets84% snaps | 433 yds11% targets97% snaps | 449 yds13% targets82% snaps | 8102 yds16% targets99% snaps | 447 yds14% targets89% snaps | 991 yds29% targets84% snaps | 670 yds24% targets83% snaps | 231 yds8% targets83% snaps | 750 yds22% targets79% snaps | 5.958 yds a game • 9.8 per target18% targets87% snaps |
| Isaac TeSlaa | 10 yds3% targets68% snaps | 526 yds13% targets75% snaps | 366 yds10% targets48% snaps | 895 yds16% targets82% snaps | 20 yds7% targets39% snaps | 210 yds7% targets49% snaps | — | 29 yds8% targets53% snaps | 519 yds16% targets65% snaps | 3.528 yds a game • 8.0 per target10% targets60% snaps |
| Tay Martin | 00 yds0% targets0% snaps | 00 yds0% targets0% snaps | — | 00 yds0% targets0% snaps | 00 yds0% targets5% snaps | — | 00 yds0% targets3% snaps | 111 yds4% targets3% snaps | 00 yds0% targets15% snaps | 0.12 yds a game • 11.0 per target1% targets4% snaps |
| DeAndre Carter | — | — | — | — | — | 00 yds0% targets0% snaps | 00 yds0% targets0% snaps | 15 yds4% targets3% snaps | 00 yds0% targets7% snaps | 0.31 yds a game • 5.0 per target1% targets3% snaps |
| Tom Kennedy | 00 yds0% targets0% snaps | 00 yds0% targets0% snaps | 00 yds0% targets0% snaps | 00 yds0% targets1% snaps | 00 yds0% targets0% snaps | — | — | — | — | 0.00 yds a game0% targets0% snaps |
| Use | Game | Proj | PPR | Tgt | Rec | Rec Yd | Car | Rush Yd | TD | Snap |
|---|---|---|---|---|---|---|---|---|---|---|
W1 vs NO | 12.3 | 8.5 | 9 | 4 | 45 | 0 | 0 | 0 | 84% | |
W2 vs BUF | 11.8 | 5.3 | 4 | 2 | 33 | 0 | 0 | 0 | 97% | |
W3 vs NYJ | 11.1 | 8.9 | 4 | 4 | 49 | 0 | 0 | 0 | 82% | |
W4 vs CAR | 11.1 | 16.2 | 8 | 6 | 102 | 0 | 0 | 0 | 99% | |
W5 vs ARI | 13.2 | 18.7 | 4 | 2 | 47 | 0 | 0 | 2 | 89% | |
W7 vs GB | 11.9 | 26.1 | 9 | 5 | 91 | 0 | 0 | 2 | 84% | |
W8 vs MIN | 11.7 | 17 | 6 | 4 | 70 | 0 | 0 | 1 | 83% | |
W9 vs MIA | 12.6 | 5 | 2 | 1 | 31 | 1 | 9 | 0 | 83% | |
W10 vs NE | 11.6 | 9 | 7 | 4 | 50 | 0 | 0 | 0 | 79% |
Ranked against 64 WRs with at least 35 targets. He is still a small sample (53 targets), so his ranks lean toward average. Ranks account for how much work each number is based on, so a perfect record on a few plays does not beat one over a full workload. Tap a stat to see the full ranking.
Jameson Williams
DET • WR • 9 gamesPick a teammate with or without. Pick more than one to combine them, like a game without the QB and without the other back.
DETTBHow this is built
| Player | W1 | W2 | W3 | W4 | W5 | W7 | W8 | W9 | W10 | Per game |
|---|---|---|---|---|---|---|---|---|---|---|
| Amon-Ra St. Brown | 1467 yds36% targets90% snaps | 13142 yds34% targets95% snaps | 819 yds26% targets74% snaps | 1175 yds22% targets96% snaps | 1169 yds38% targets86% snaps | 11153 yds36% targets78% snaps | 846 yds32% targets72% snaps | 1086 yds40% targets75% snaps | 598 yds16% targets66% snaps | 10.184 yds a game • 8.3 per target31% targets81% snaps |
| Jameson Williams | 945 yds23% targets84% snaps | 433 yds11% targets97% snaps | 449 yds13% targets82% snaps | 8102 yds16% targets99% snaps | 447 yds14% targets89% snaps | 991 yds29% targets84% snaps | 670 yds24% targets83% snaps | 231 yds8% targets83% snaps | 750 yds22% targets79% snaps | 5.958 yds a game • 9.8 per target18% targets87% snaps |
| Isaac TeSlaa | 10 yds3% targets68% snaps | 526 yds13% targets75% snaps | 366 yds10% targets48% snaps | 895 yds16% targets82% snaps | 20 yds7% targets39% snaps | 210 yds7% targets49% snaps | — | 29 yds8% targets53% snaps | 519 yds16% targets65% snaps | 3.528 yds a game • 8.0 per target10% targets60% snaps |
| Tay Martin | 00 yds0% targets0% snaps | 00 yds0% targets0% snaps | — | 00 yds0% targets0% snaps | 00 yds0% targets5% snaps | — | 00 yds0% targets3% snaps | 111 yds4% targets3% snaps | 00 yds0% targets15% snaps | 0.12 yds a game • 11.0 per target1% targets4% snaps |
| DeAndre Carter | — | — | — | — | — | 00 yds0% targets0% snaps | 00 yds0% targets0% snaps | 15 yds4% targets3% snaps | 00 yds0% targets7% snaps | 0.31 yds a game • 5.0 per target1% targets3% snaps |
| Tom Kennedy | 00 yds0% targets0% snaps | 00 yds0% targets0% snaps | 00 yds0% targets0% snaps | 00 yds0% targets1% snaps | 00 yds0% targets0% snaps | — | — | — | — | 0.00 yds a game0% targets0% snaps |
| Use | Game | Proj | PPR | Tgt | Rec | Rec Yd | Car | Rush Yd | TD | Snap |
|---|---|---|---|---|---|---|---|---|---|---|
| W1vs NO | 12.3 | 8.5 | 9 | 4 | 45 | 0 | 0 | 0 | 84% | |
| W2vs BUF | 11.8 | 5.3 | 4 | 2 | 33 | 0 | 0 | 0 | 97% | |
| W3vs NYJ | 11.1 | 8.9 | 4 | 4 | 49 | 0 | 0 | 0 | 82% | |
| W4vs CAR | 11.1 | 16.2 | 8 | 6 | 102 | 0 | 0 | 0 | 99% | |
| W5vs ARI | 13.2 | 18.7 | 4 | 2 | 47 | 0 | 0 | 2 | 89% | |
| W7vs GB | 11.9 | 26.1 | 9 | 5 | 91 | 0 | 0 | 2 | 84% | |
| W8vs MIN | 11.7 | 17 | 6 | 4 | 70 | 0 | 0 | 1 | 83% | |
| W9vs MIA | 12.6 | 5 | 2 | 1 | 31 | 1 | 9 | 0 | 83% | |
| W10vs NE | 11.6 | 9 | 7 | 4 | 50 | 0 | 0 | 0 | 79% |
Ranked against 64 WRs with at least 35 targets. He is still a small sample (53 targets), so his ranks lean toward average. Ranks account for how much work each number is based on, so a perfect record on a few plays does not beat one over a full workload. Tap a stat to see the full ranking.
29.8 PPR points a game allowed to wide receivers, 23rd most of 32 defenses.
| Player | PPR | Tgt | Rec | Rec Yd | Rec TD | Rush Yd |
|---|---|---|---|---|---|---|
| George Pickens@ DAL • Wk 5 | 28.0 | 13 | 9 | 130 | 1 | 0 |
| Germie Bernardvs PIT • Wk 6 | 25.7 | 12 | 11 | 87 | 1 | 0 |
| Luther Burden III@ CHI • Wk 9 | 20.7 | 10 | 7 | 97 | 1 | 0 |
| Denzel Bostonvs CLE • Wk 2 | 20.5 | 7 | 5 | 95 | 1 | 0 |
| DK Metcalfvs PIT • Wk 6 | 20.3 | 15 | 11 | 93 | 0 | 0 |
| Jordan Addisonvs MIN • Wk 3 | 20.0 | 9 | 5 | 90 | 1 | 0 |
| Rome Odunze@ CHI • Wk 9 | 16.0 | 7 | 4 | 60 | 1 | 0 |
| Ryan Flournoy@ DAL • Wk 5 | 12.0 | 4 | 3 | 90 | 0 | 0 |
| Matthew Goldenvs GB • Wk 4 | 11.7 | 7 | 3 | 21 | 1 | 6 |
| Jahan Dotsonvs ATL • Wk 8 | 11.5 | 5 | 2 | 95 | 0 | 0 |
| Tee Higgins@ CIN • Wk 1 | 8.9 | 6 | 3 | 59 | 0 | 0 |
| KC Concepcionvs CLE • Wk 2 | 8.2 | 6 | 6 | 28 | 0 | -6 |
| Tetairoa McMillan@ CAR • Wk 7 | 8.0 | 6 | 4 | 40 | 0 | 0 |
| Christian Watsonvs GB • Wk 4 | 7.7 | 3 | 3 | 47 | 0 | 0 |
| Kalif Raymond@ CHI • Wk 9 | 7.2 | 7 | 4 | 32 | 0 | 0 |
| Justin Jeffersonvs MIN • Wk 3 | 5.2 | 2 | 2 | 32 | 0 | 0 |
| KaVontae Turpin@ DAL • Wk 5 | 4.2 | 4 | 2 | 22 | 0 | 0 |
| Jonathan Mingo@ DAL • Wk 5 | 4.0 | 4 | 2 | 20 | 0 | 0 |
| John Metchie III@ CAR • Wk 7 | 4.0 | 4 | 2 | 20 | 0 | 0 |
| Dohnte Meyers@ CIN • Wk 1 | 3.8 | 1 | 1 | 18 | 0 | 10 |
| Ja'Marr Chase@ CIN • Wk 1 | 3.2 | 4 | 2 | 12 | 0 | 0 |
| Andrei Iosivas@ CIN • Wk 1 | 3.2 | 3 | 2 | 12 | 0 | 0 |
| CeeDee Lamb@ DAL • Wk 5 | 2.9 | 5 | 2 | 9 | 0 | 0 |
| Zavion Thomas@ CHI • Wk 9 | 2.3 | 2 | 1 | 13 | 0 | 0 |
| Isaiah Bondvs CLE • Wk 2 | 2.0 | 1 | 1 | 10 | 0 | 0 |
| Jalen Coker@ CAR • Wk 7 | 1.9 | 4 | 1 | 9 | 0 | 0 |
| Drake Londonvs ATL • Wk 8 | 1.8 | 6 | 1 | 8 | 0 | 0 |
| Olamide Zaccheausvs ATL • Wk 8 | 1.4 | 2 | 1 | 4 | 0 | 0 |
| Jauan Jenningsvs MIN • Wk 3 | 1.1 | 2 | 1 | 1 | 0 | 0 |
| Skyy Moorevs GB • Wk 4 | 0.8 | 2 | 1 | -2 | 0 | 0 |
| Jerry Jeudyvs CLE • Wk 2 | 0.0 | 1 | 0 | 0 | 0 | 0 |
| Tai Feltonvs MIN • Wk 3 | 0.0 | 2 | 0 | 0 | 0 | 0 |
| Bo Meltonvs GB • Wk 4 | 0.0 | 1 | 0 | 0 | 0 | 0 |
| J. Michael Sturdivantvs GB • Wk 4 | 0.0 | 1 | 0 | 0 | 0 | 0 |
| David Moore@ CAR • Wk 7 | 0.0 | 1 | 0 | 0 | 0 | 0 |
| Brycen Tremayne@ CAR • Wk 7 | 0.0 | 1 | 0 | 0 | 0 | 0 |
Fantasy points first, then the stats that matter for his position. Ring around each photo is that player's Mania Rating. Tap a name to open his profile.