
LAC
67.7MANIA RATINGOverall profile · Starter
MANIA RATING • STARTER
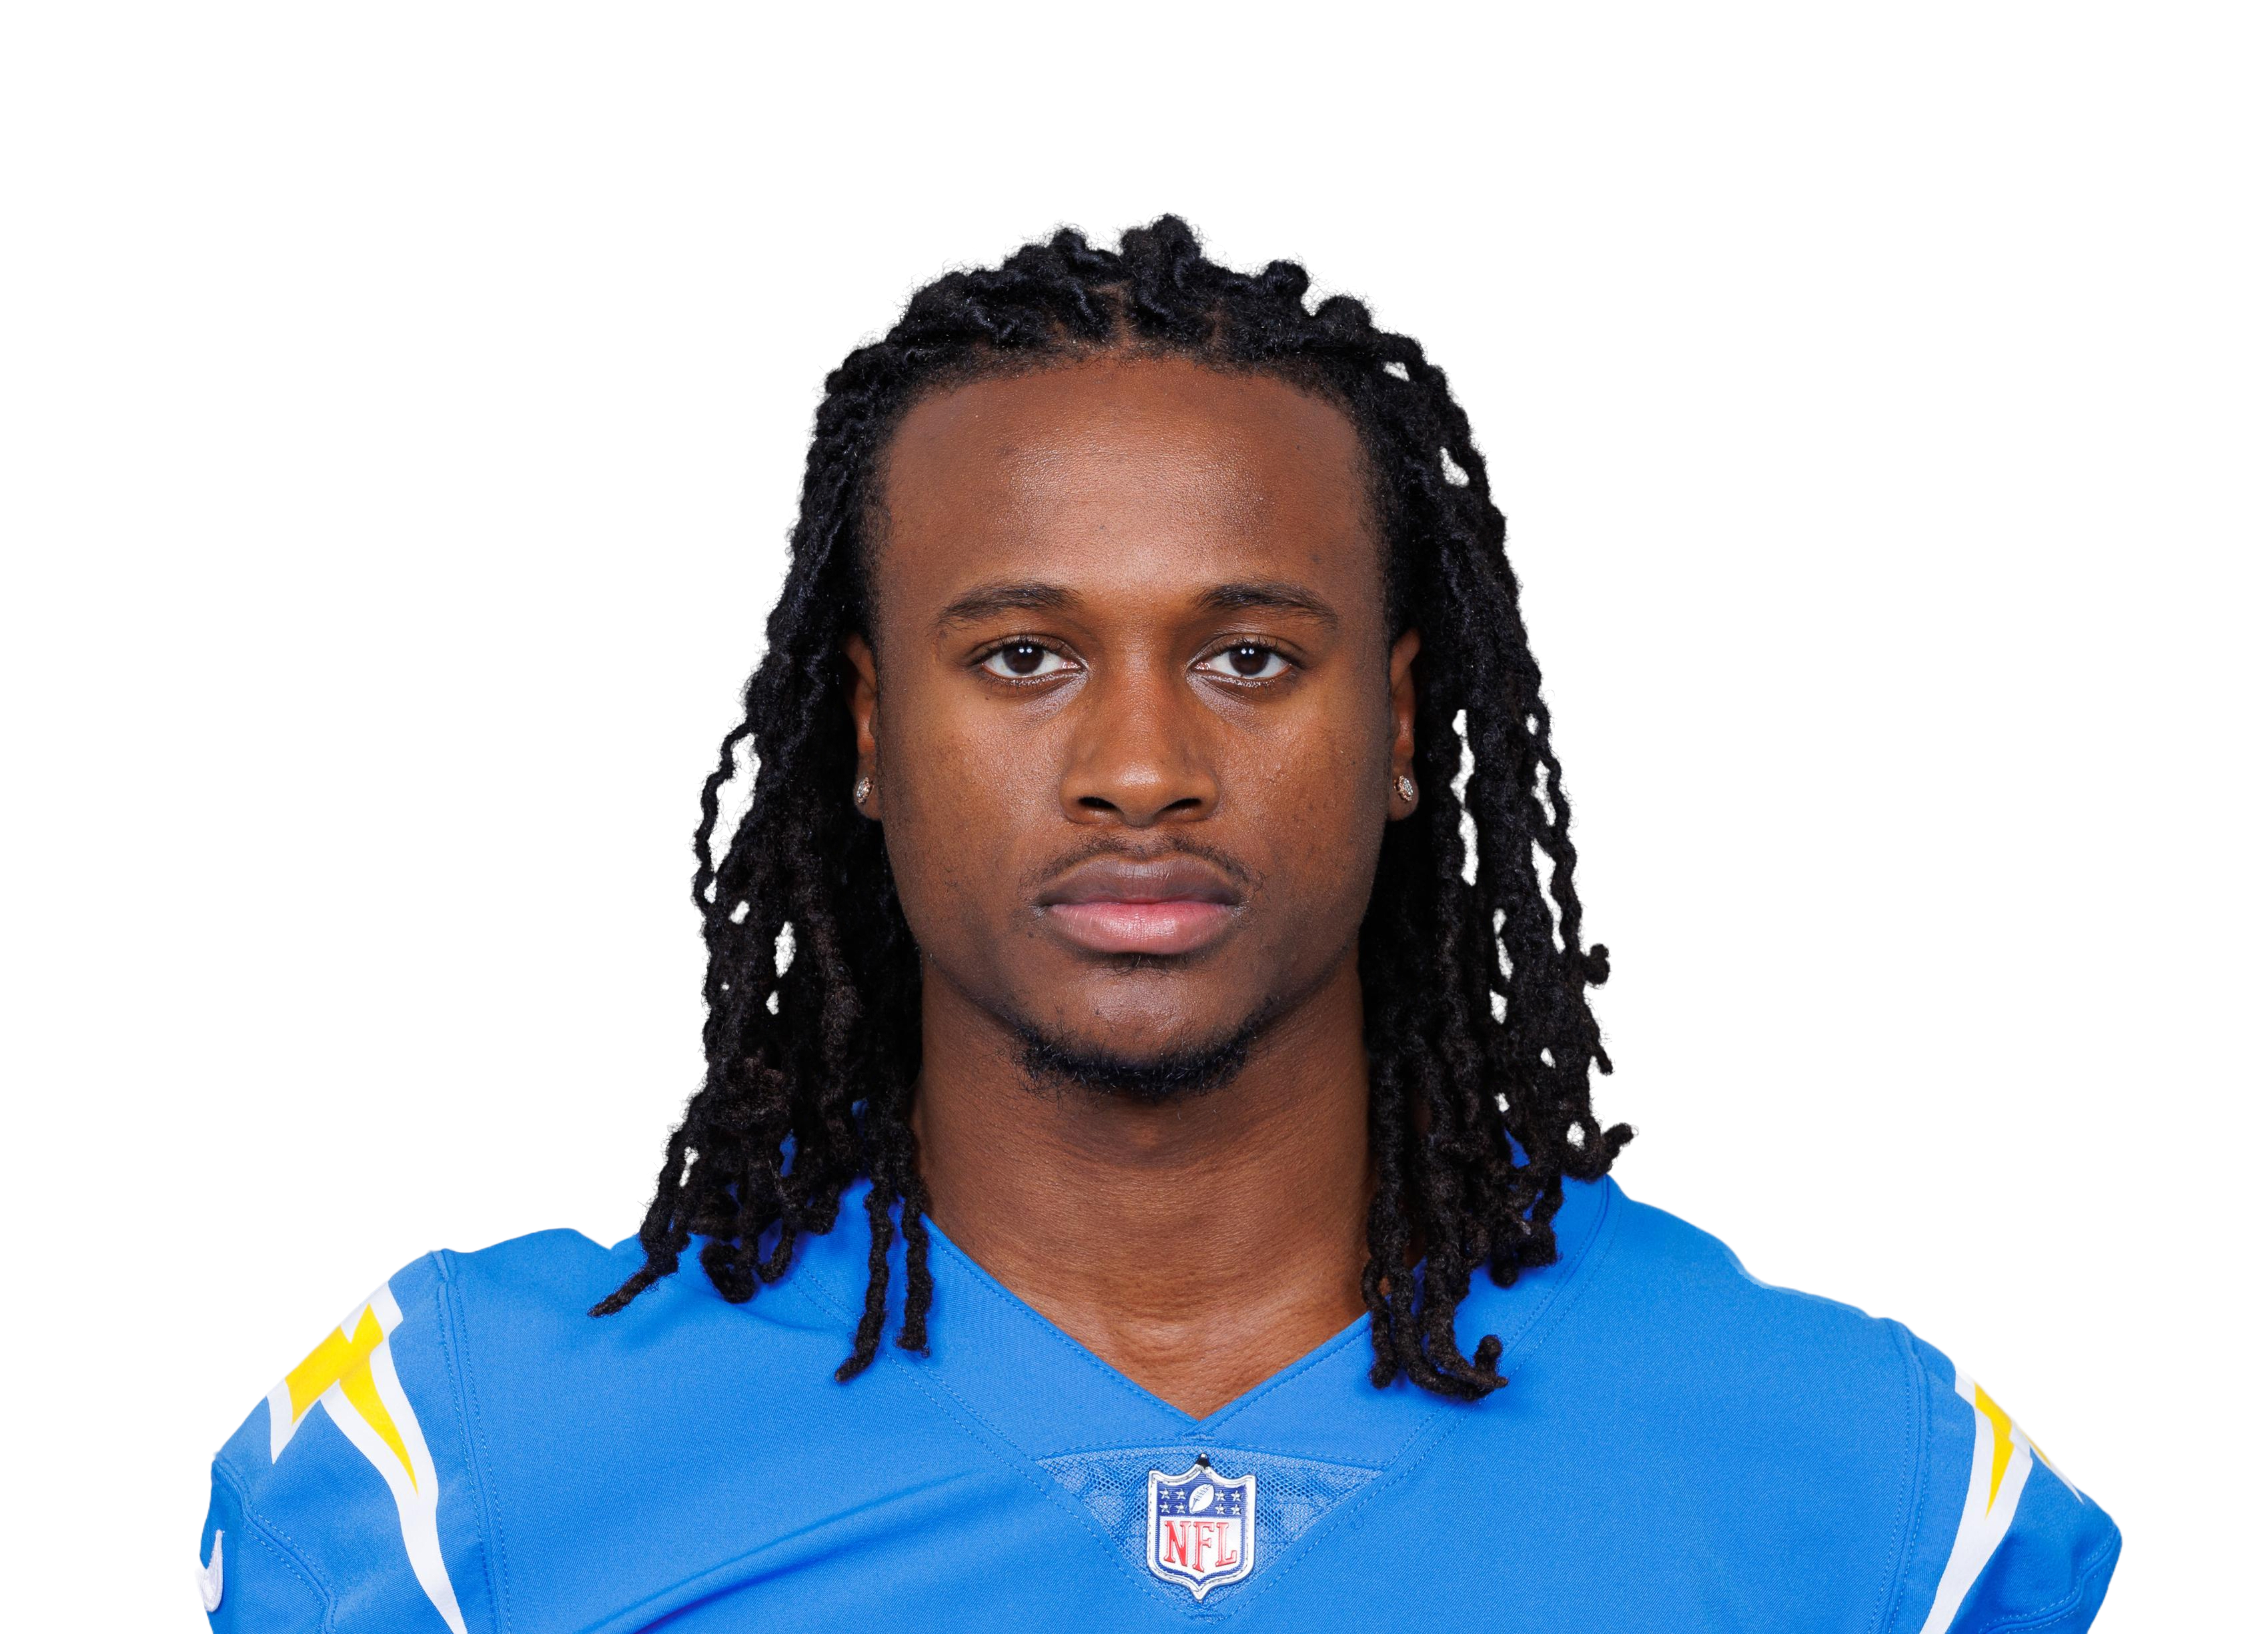
KeAndre Lambert-Smith
#163 OverallWR87#4 WR on LACDepth WR5 ›Age 25
64.8WEEK 11 RATINGStart value vs NYJ
6.2WEEK 11 PROJECTIONPPR
14%TARGET SHARE51st percentile
53.7%SNAP SHARE31st percentile
Games counted
Untick or tick any game and Mania Rating, matchup and Week 11 Rating all recalculate. Official Mania Rating 67.7.
Teammate injuries shift his Week 11 Rating1 teammate note ▾
Ladd McConkey (WR, Questionable) +4.9 • without him that work was worth 9.8 pts vs 0 with (2 games)
Injury report updated Sat Nov 21, 6:30 AM ET
Week 11 Rating = recent role + opponent + the latest injury report (updated Sat Nov 21, 6:30 AM ET). Check final inactives before you set your lineup.
Mania breakdown
Fantasy Production29
Target Volume51
Team Target Role49
Red-Zone Threat62
Per-Target Efficiency11
Mania breakdown
Percentile among WRs. 100 is the best, 50 is average.
How many fantasy points and total yards he is actually producing, compared with players at his position. Ranks better than 29% of WRs.
How often he is targeted: targets per game, receptions and his share of the team targets. Ranks better than 51% of WRs.
How big a slice of his team passing game belongs to him: target share, air-yard share and snaps. Ranks better than 49% of WRs.
How often the offense uses him near the goal line: red-zone targets and end-zone targets. Ranks better than 62% of WRs.
What he produces with each chance instead of just rewarding volume: yards per target, catch rate and fantasy points per opportunity. Ranks better than 11% of WRs.
Top 30%MiddleBottom 40%Tap a category to see what it means.
Week 11 projection
6.2
projected points
Floor 0.6 · Ceiling 13.2
0.0Game script
-0.1Matchup
+0.5Injuries
Week 11 projection
 LAC
VSPPR
 NYJ
Tough matchup • NYJ is #26 in points allowed to WRs
6.2
projected pointsReceiving 3.8 targets, 2.3 catches, 30 yds • 0.17 TD
Floor 0.64 of 5 games land hereCeiling 13.2
0.0Game script
-0.1Matchup
+0.5Injuries
How this is built
Recent and last-season usage, the Vegas spread and total, how this defense treats his position, and the injury report (teammates out, QB out). The three boxes show how many points each moved it. When sportsbook player lines are posted (Wednesday to Sunday) they are blended in, leaning on them most for new starters and players with few games. PPR scoring only. Tested on past seasons it is about 5% closer than a plain season average.
Week 11 matchup
vs NYJ
Good matchup
Adjustment+1.5 pts
Allows to WRs26th most
Week11
Week 11 matchup
vs NYJ
+2.1Rating boost
Good matchup26th easiest of 32 defenses for WRs
ToughEasy
28.3PPR a game NYJ allows to WRs
7.8Similar players, usual PPR a game
11.8Same players against NYJ
Players with a role like his scored 11.8 PPR a game against NYJ, versus 7.8 in their usual games (+51%). That moves his Week 11 Rating by +2.1.
How wide receivers did against NYJ
28.4 PPR points a game allowed to wide receivers, 26th most of 32 defenses.
| Player | PPR | Tgt | Rec | Rec Yd | Rec TD | Rush Yd |
|---|---|---|---|---|---|---|
 Caleb Douglasvs MIA • Wk 7 | 21.0 | 3 | 2 | 70 | 2 | 0 |
 DeMario Douglas@ NE • Wk 6 | 19.6 | 8 | 7 | 86 | 1 | 0 |
 DJ Moorevs BUF • Wk 10 | 19.4 | 6 | 4 | 90 | 1 | 4 |
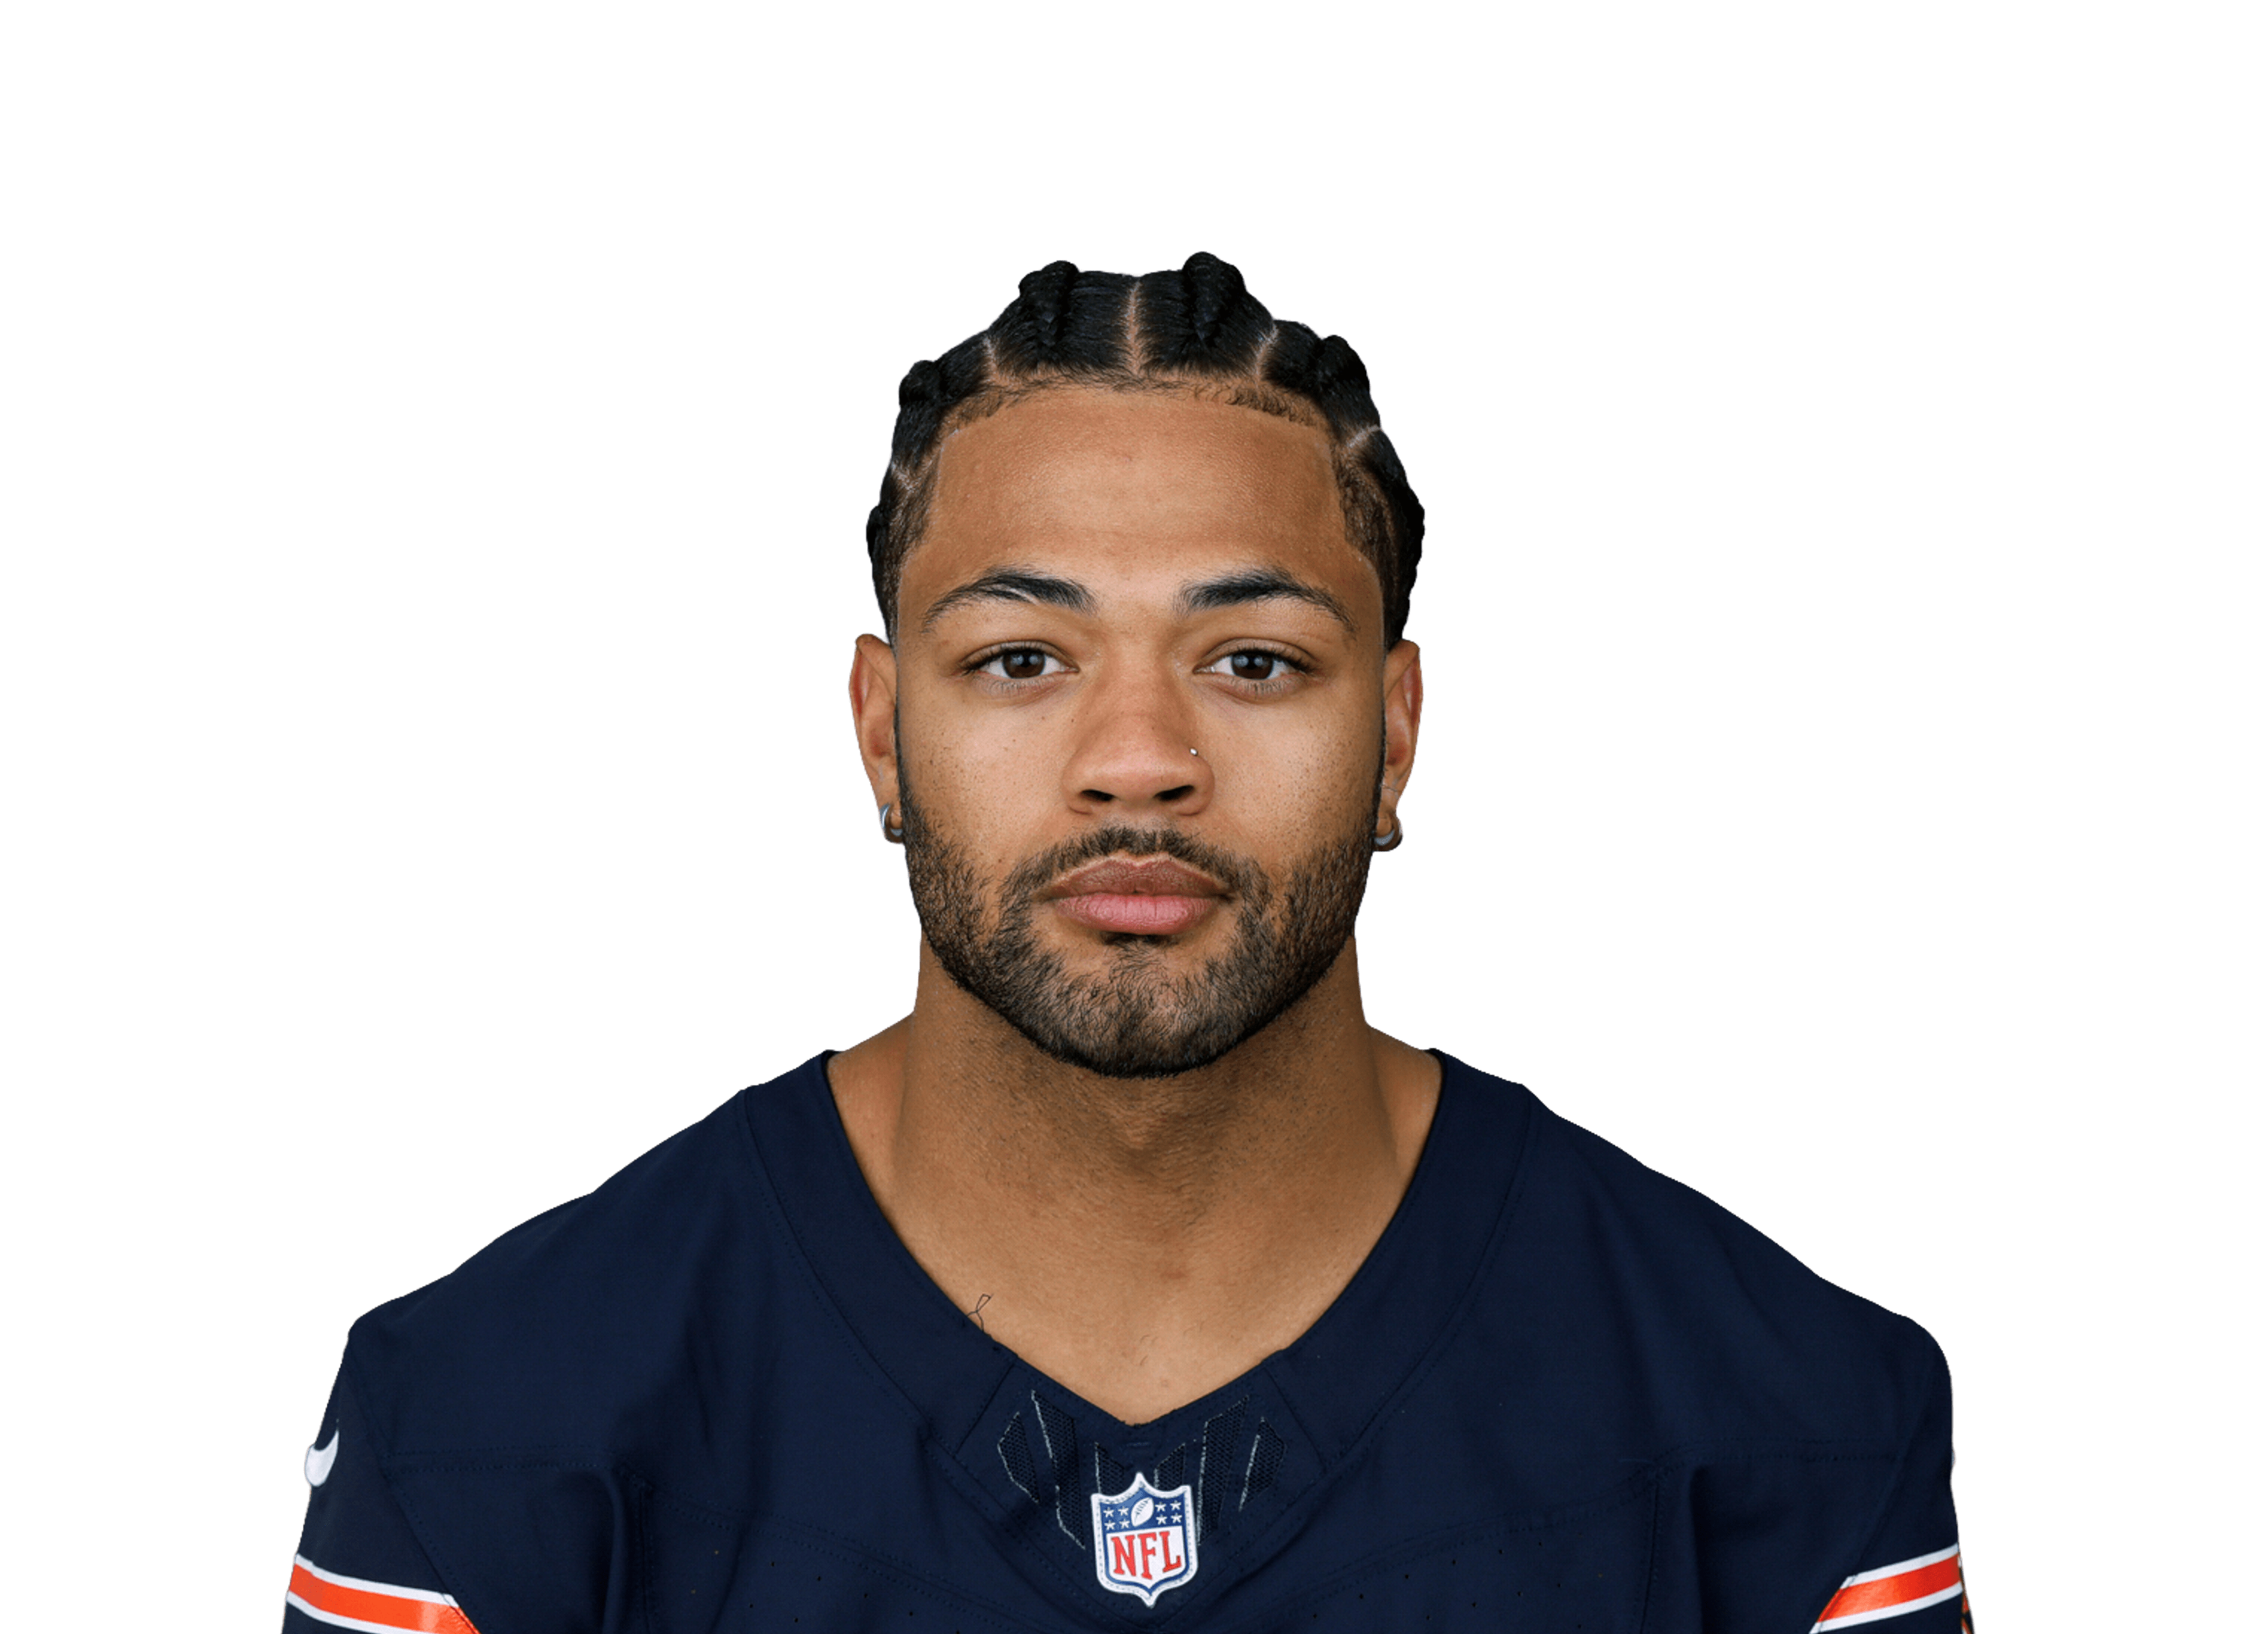 Rome Odunze@ CHI • Wk 4 | 15.4 | 7 | 6 | 94 | 0 | 0 |
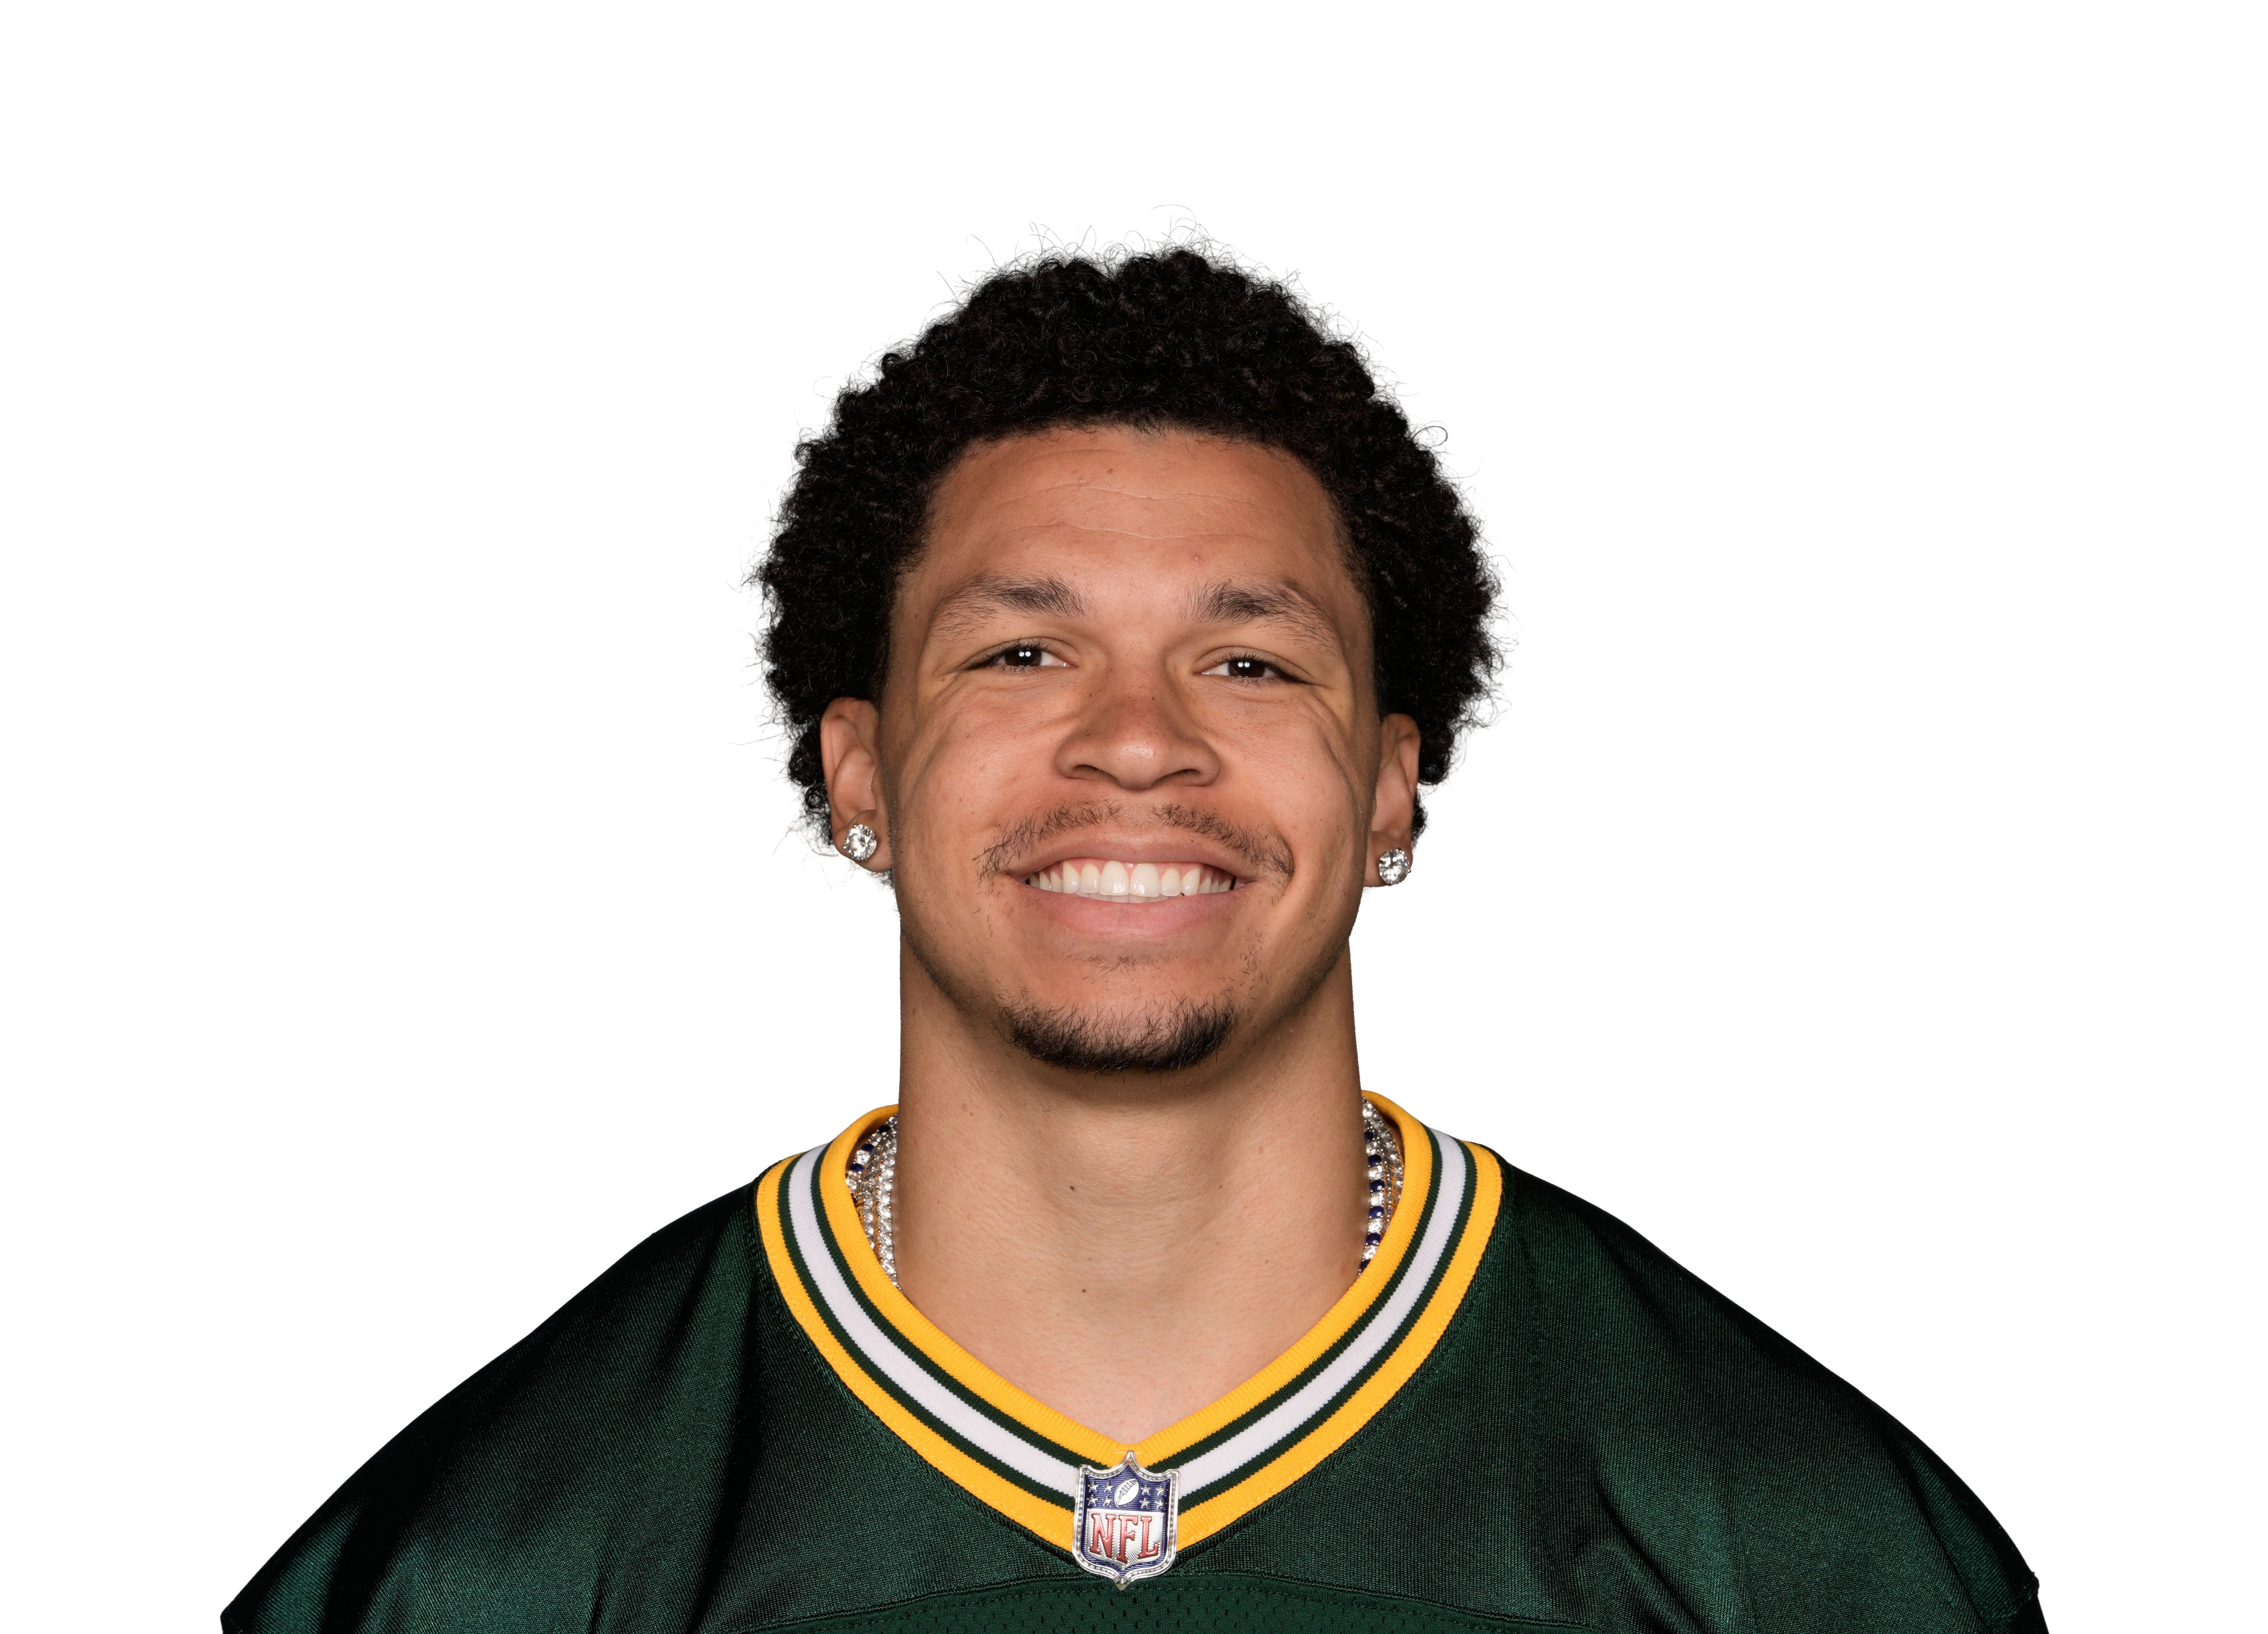 Christian Watsonvs GB • Wk 2 | 14.1 | 11 | 4 | 41 | 1 | 0 |
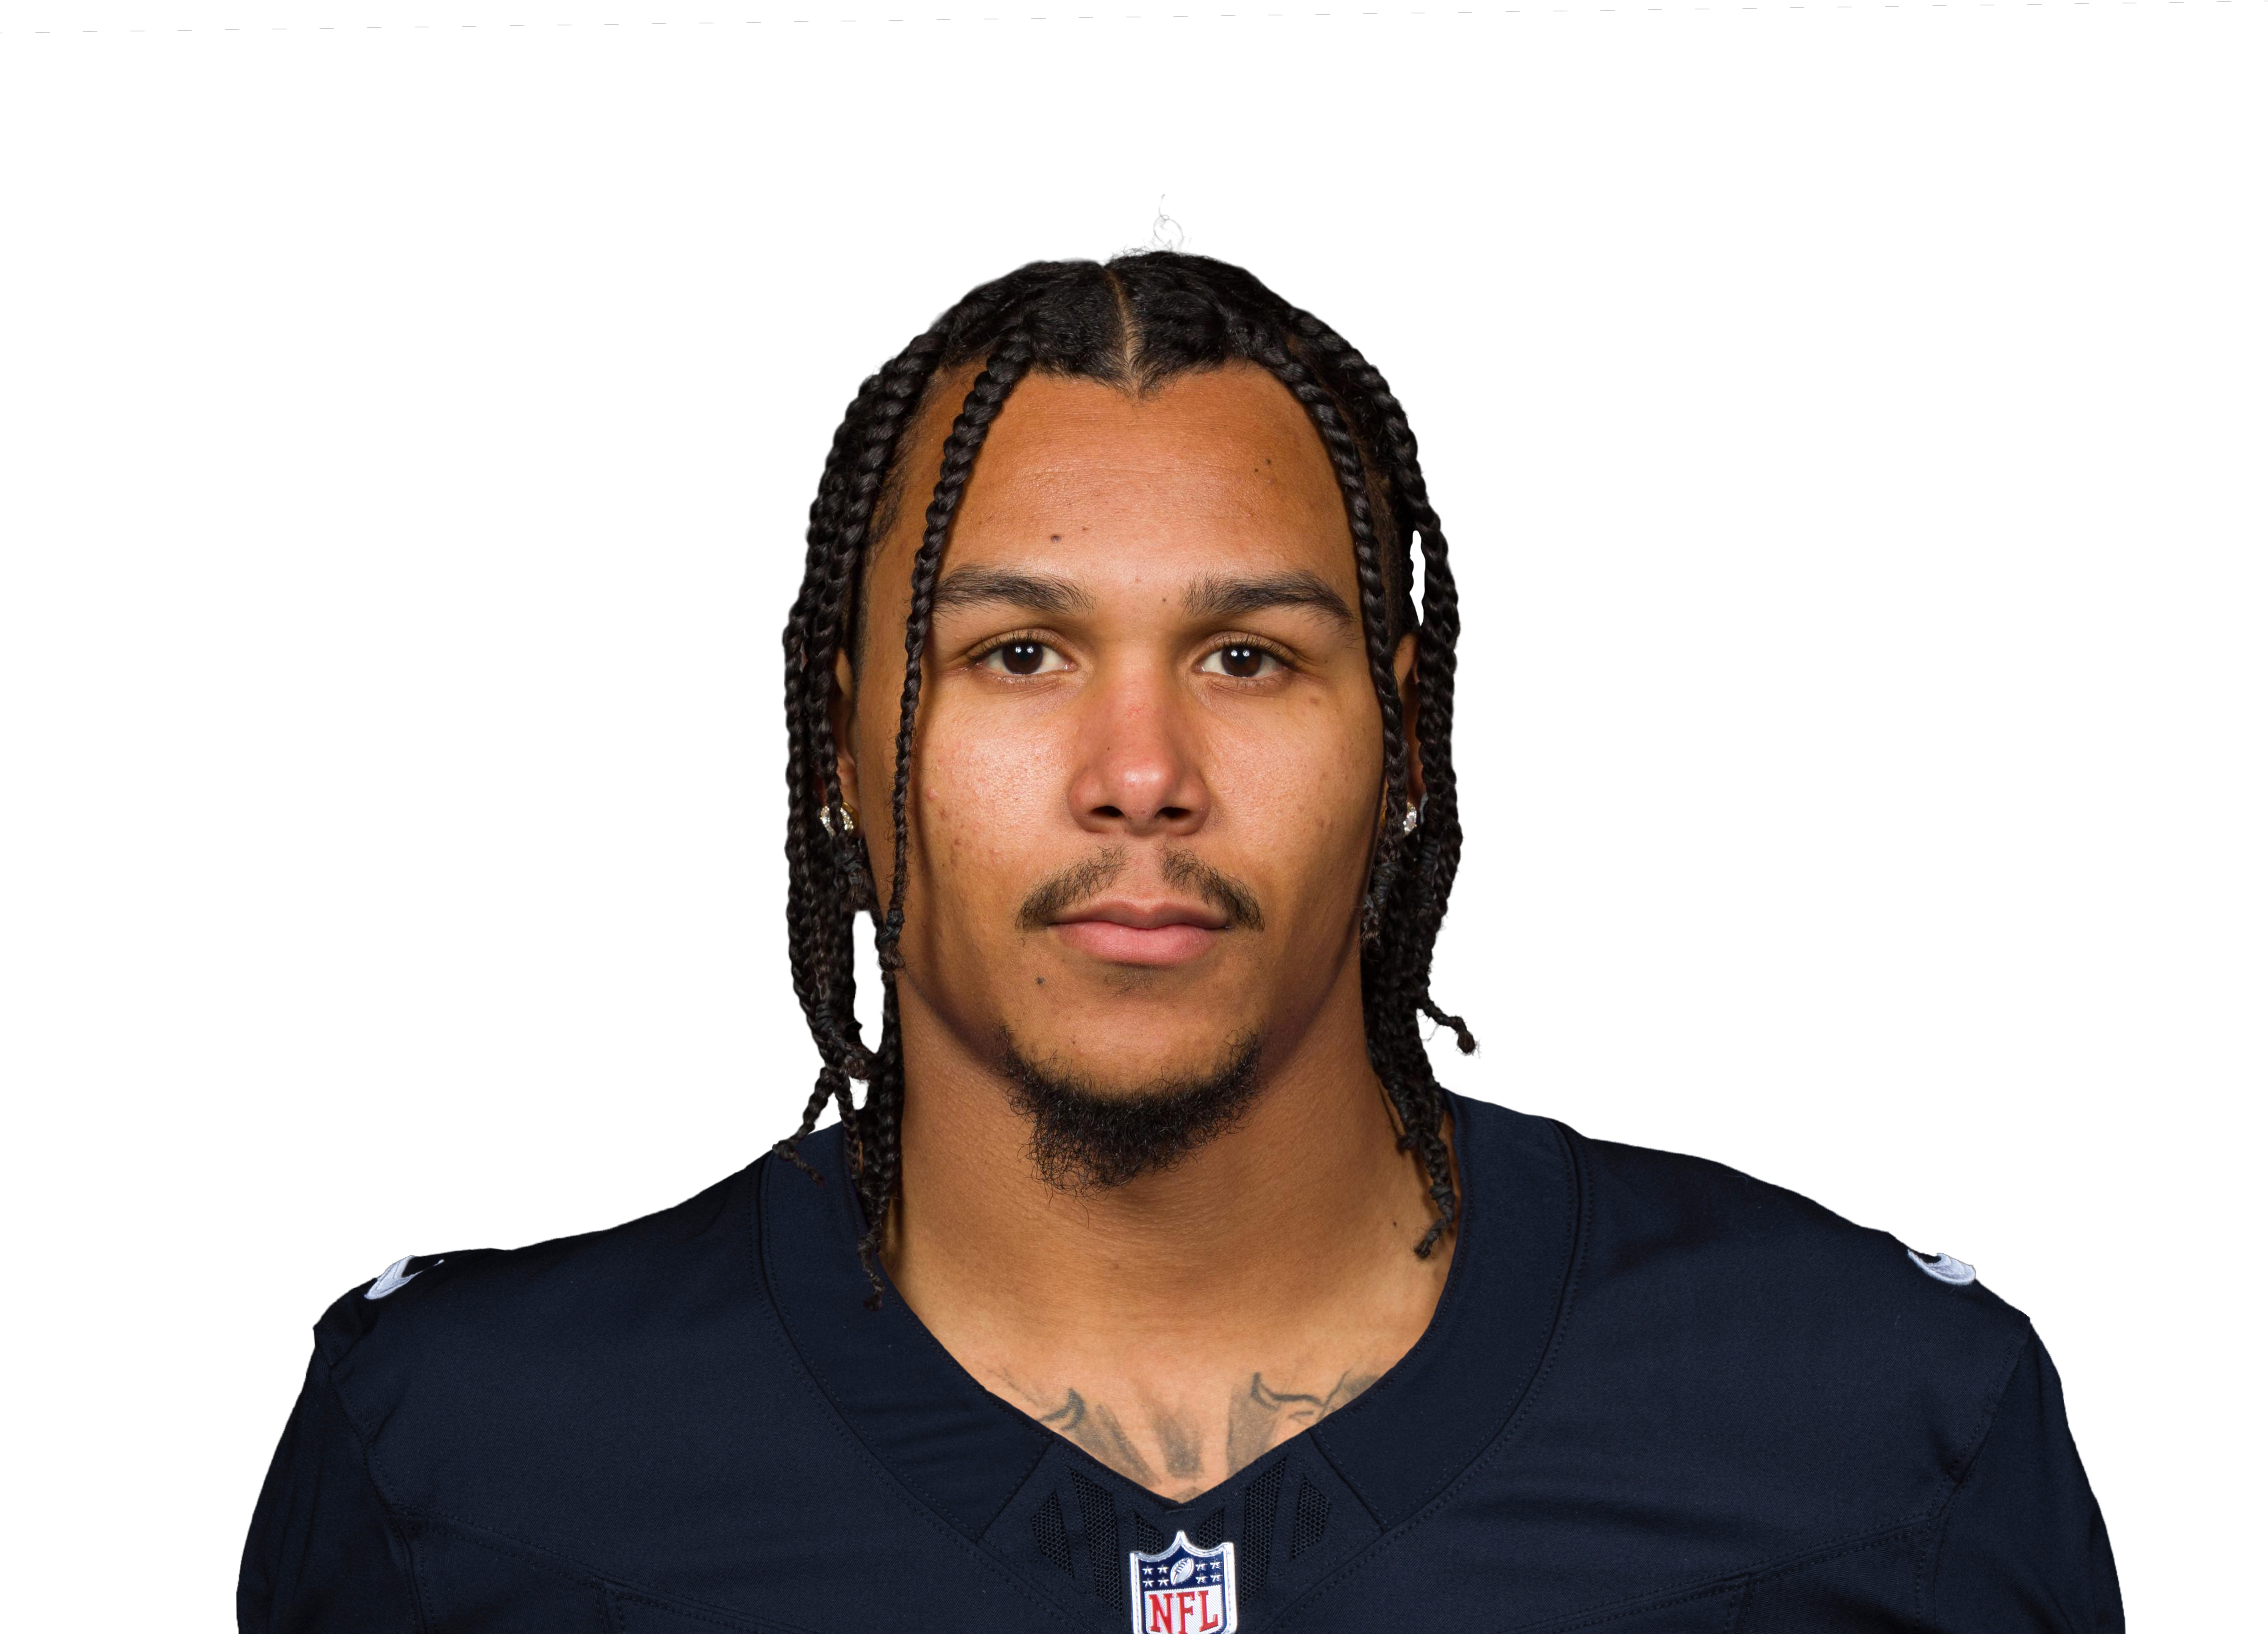 Jalen Nailorvs LV • Wk 8 | 13.8 | 4 | 4 | 38 | 1 | 0 |
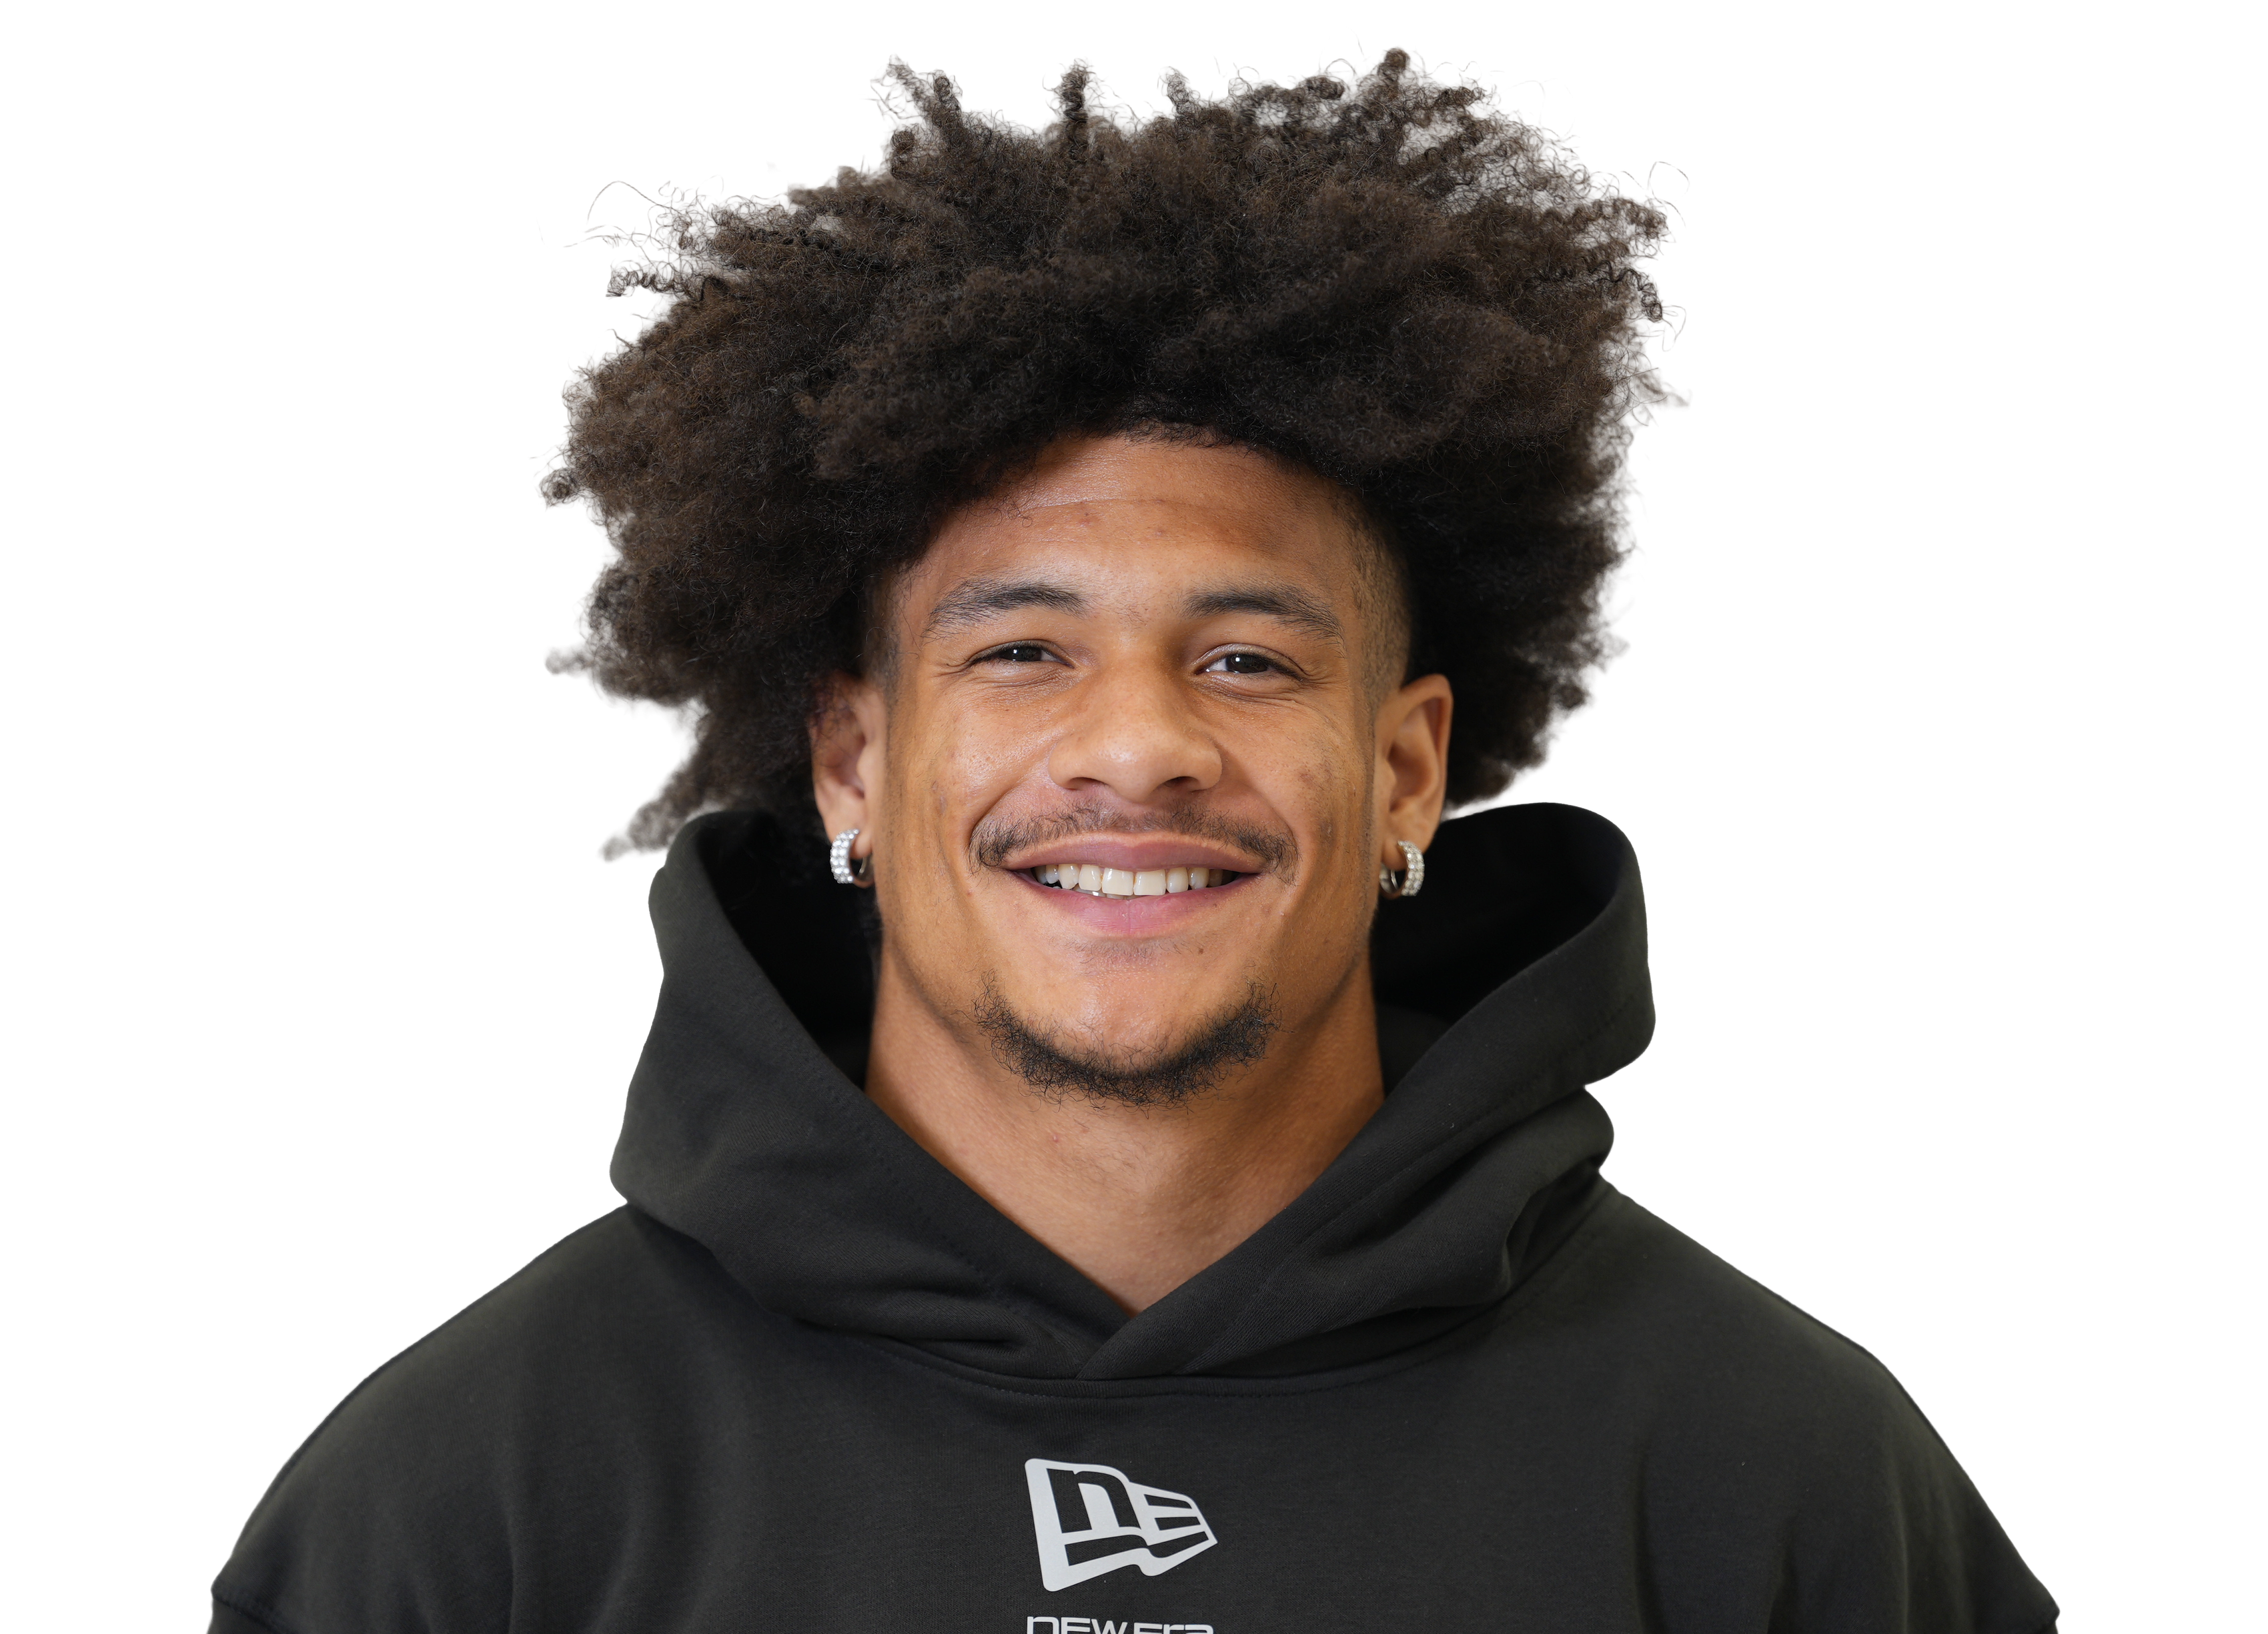 Denzel Bostonvs CLE • Wk 5 | 13.6 | 7 | 3 | 46 | 1 | 0 |
 Amon-Ra St. Brown@ DET • Wk 3 | 11.9 | 8 | 4 | 19 | 1 | 0 |
 Luther Burden III@ CHI • Wk 4 | 11.4 | 6 | 4 | 63 | 0 | 11 |
 Romeo Doubs@ NE • Wk 6 | 11.2 | 1 | 1 | 42 | 1 | 0 |
 Xavier Worthy@ KC • Wk 9 | 10.8 | 6 | 6 | 48 | 0 | 0 |
 Isaiah Bondvs CLE • Wk 5 | 10.4 | 7 | 3 | 74 | 0 | 0 |
 Rashee Rice@ KC • Wk 9 | 9.9 | 7 | 5 | 49 | 0 | 0 |
 Matthew Goldenvs GB • Wk 2 | 9.8 | 6 | 4 | 58 | 0 | 0 |
 Isaac TeSlaa@ DET • Wk 3 | 9.6 | 3 | 3 | 66 | 0 | 0 |
 Jameson Williams@ DET • Wk 3 | 8.9 | 4 | 4 | 49 | 0 | 0 |
 Wan'Dale Robinson@ TEN • Wk 1 | 8.8 | 6 | 5 | 38 | 0 | 0 |
 Elic Ayomanor@ TEN • Wk 1 | 8.1 | 3 | 1 | 11 | 1 | 0 |
 Carnell Tate@ TEN • Wk 1 | 7.8 | 6 | 4 | 38 | 0 | 0 |
 Khalil Shakirvs BUF • Wk 10 | 7.5 | 3 | 2 | 26 | 0 | 29 |
 Malik Washingtonvs MIA • Wk 7 | 6.5 | 3 | 3 | 27 | 0 | 8 |
 A.J. Brown@ NE • Wk 6 | 5.7 | 10 | 3 | 27 | 0 | 0 |
 Chris Bellvs MIA • Wk 7 | 5.5 | 4 | 3 | 25 | 0 | 0 |
 Jerry Jeudyvs CLE • Wk 5 | 4.9 | 7 | 3 | 19 | 0 | 0 |
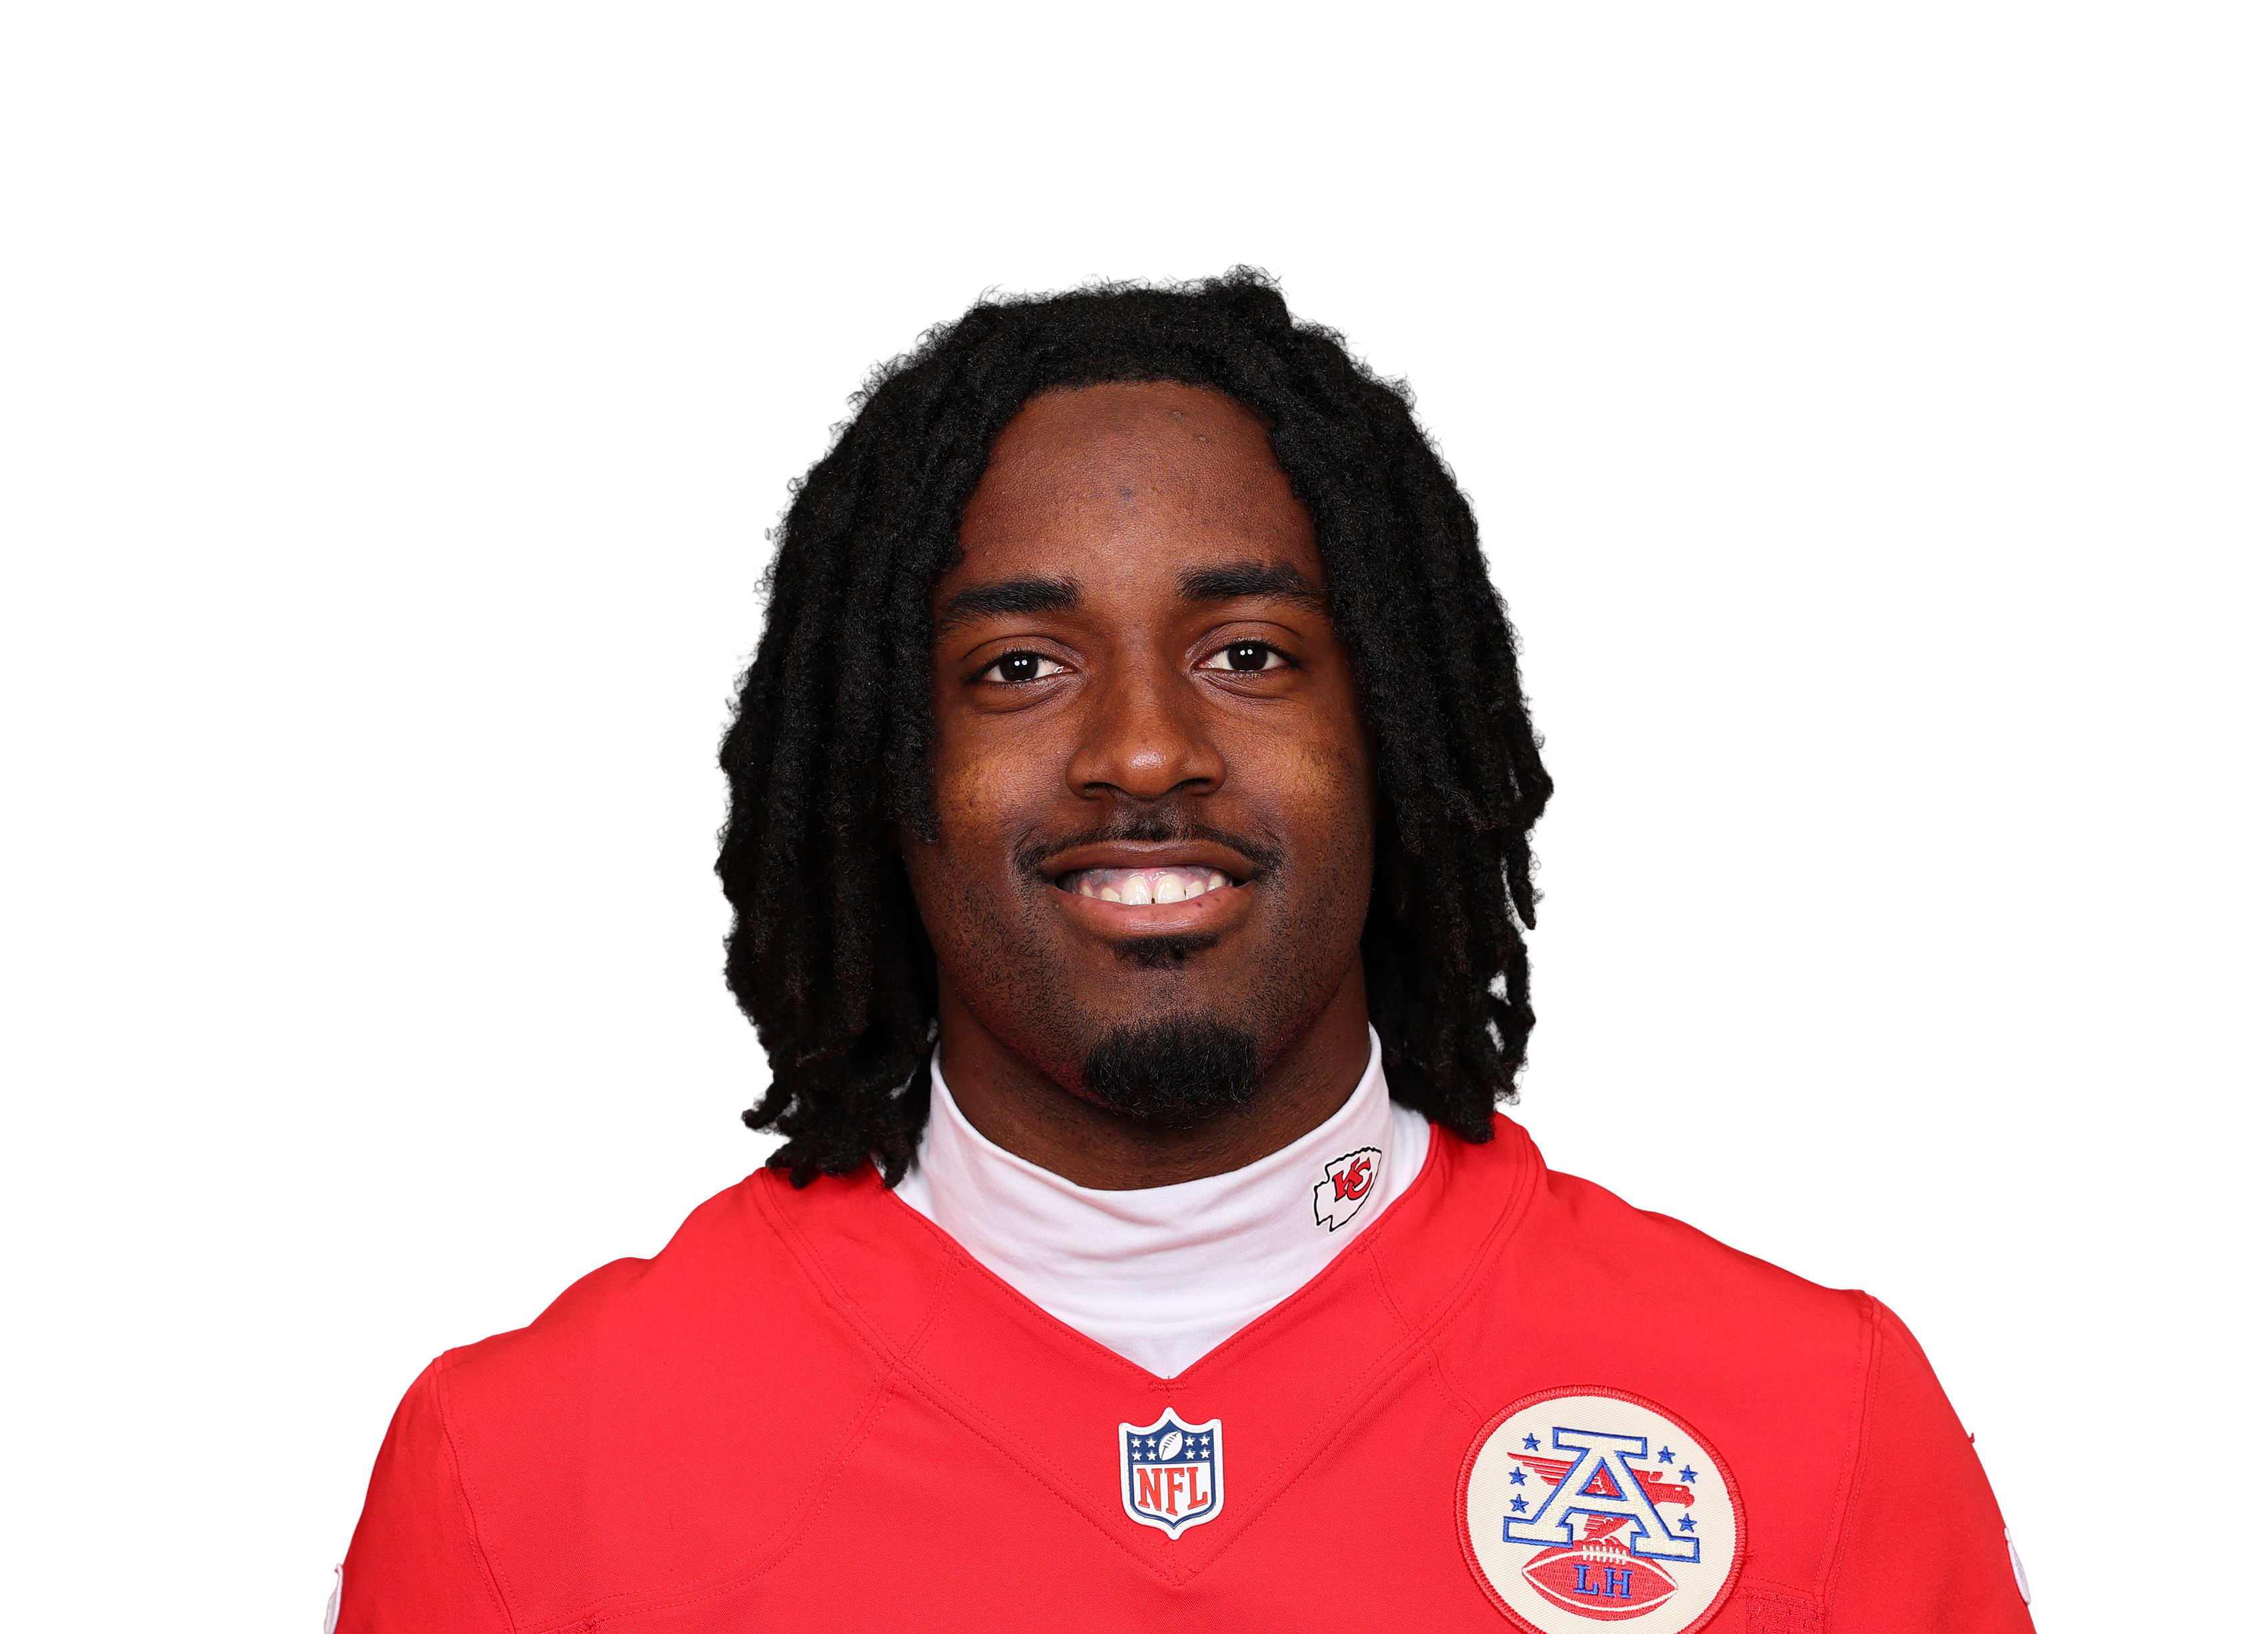 Jalen Royals@ KC • Wk 9 | 3.8 | 2 | 2 | 18 | 0 | 0 |
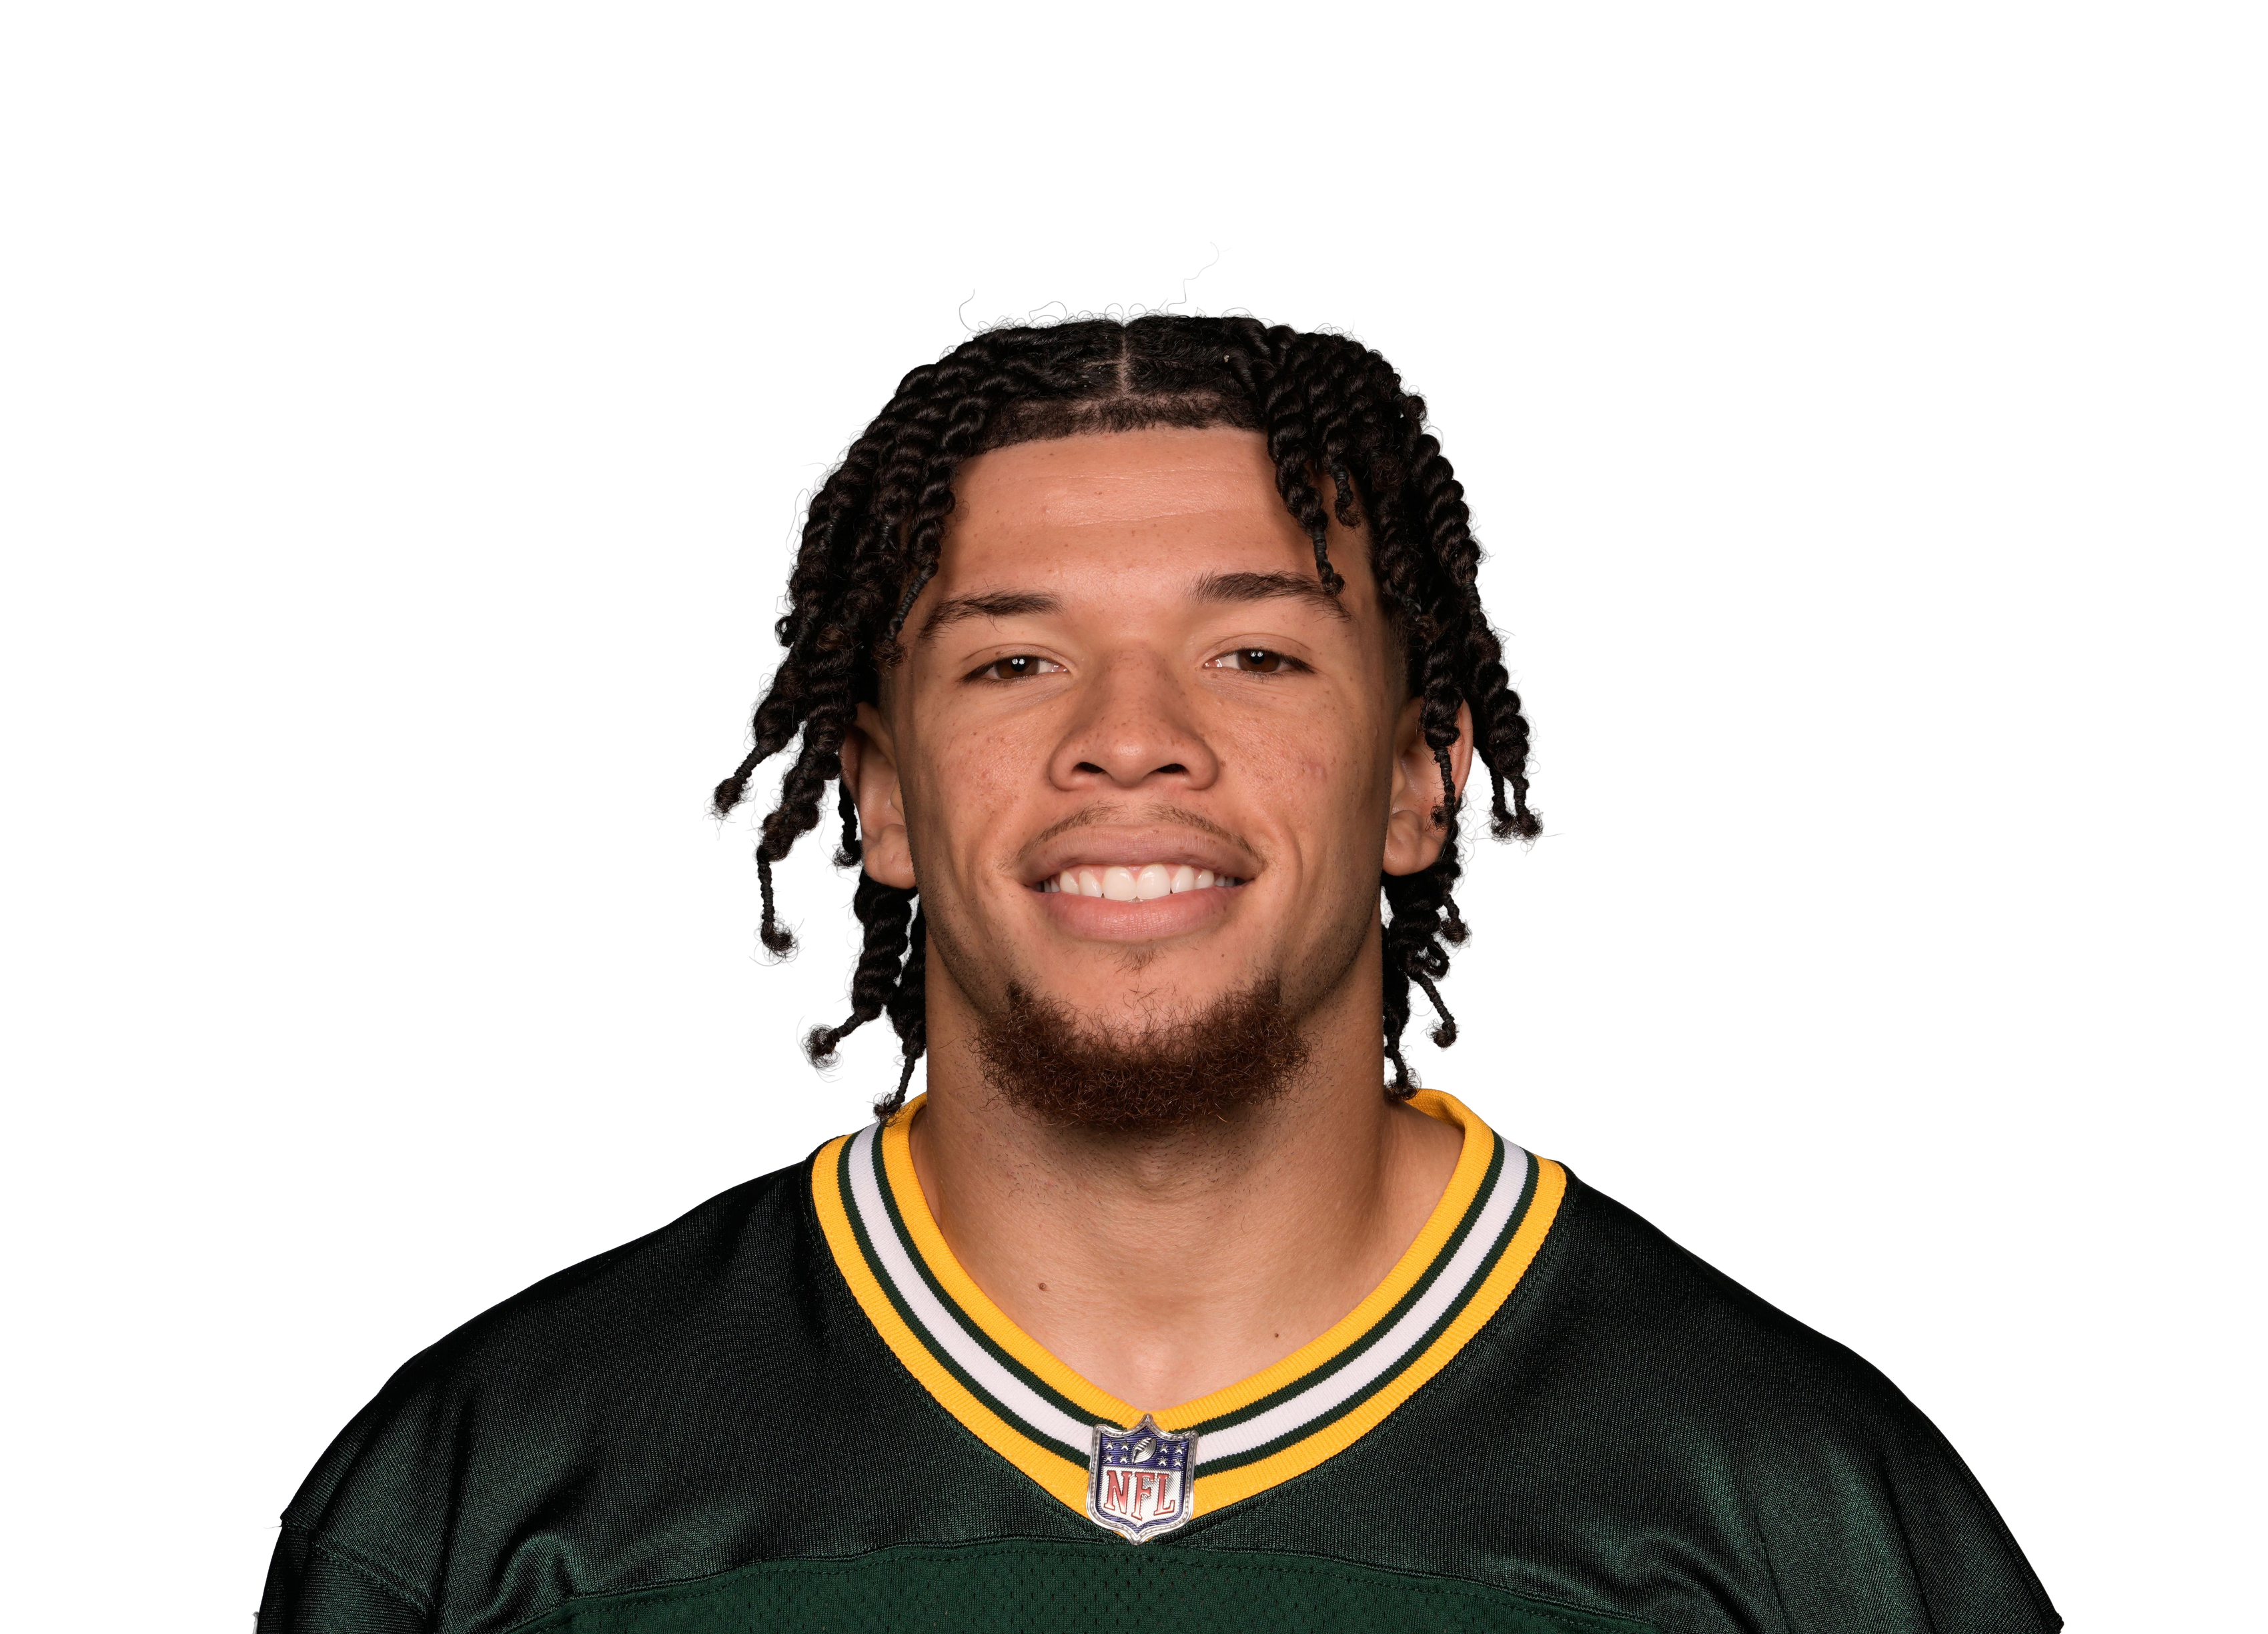 Skyy Moorevs GB • Wk 2 | 2.6 | 3 | 2 | 6 | 0 | 0 |
 Kalif Raymond@ CHI • Wk 4 | 2.6 | 2 | 2 | 6 | 0 | 0 |
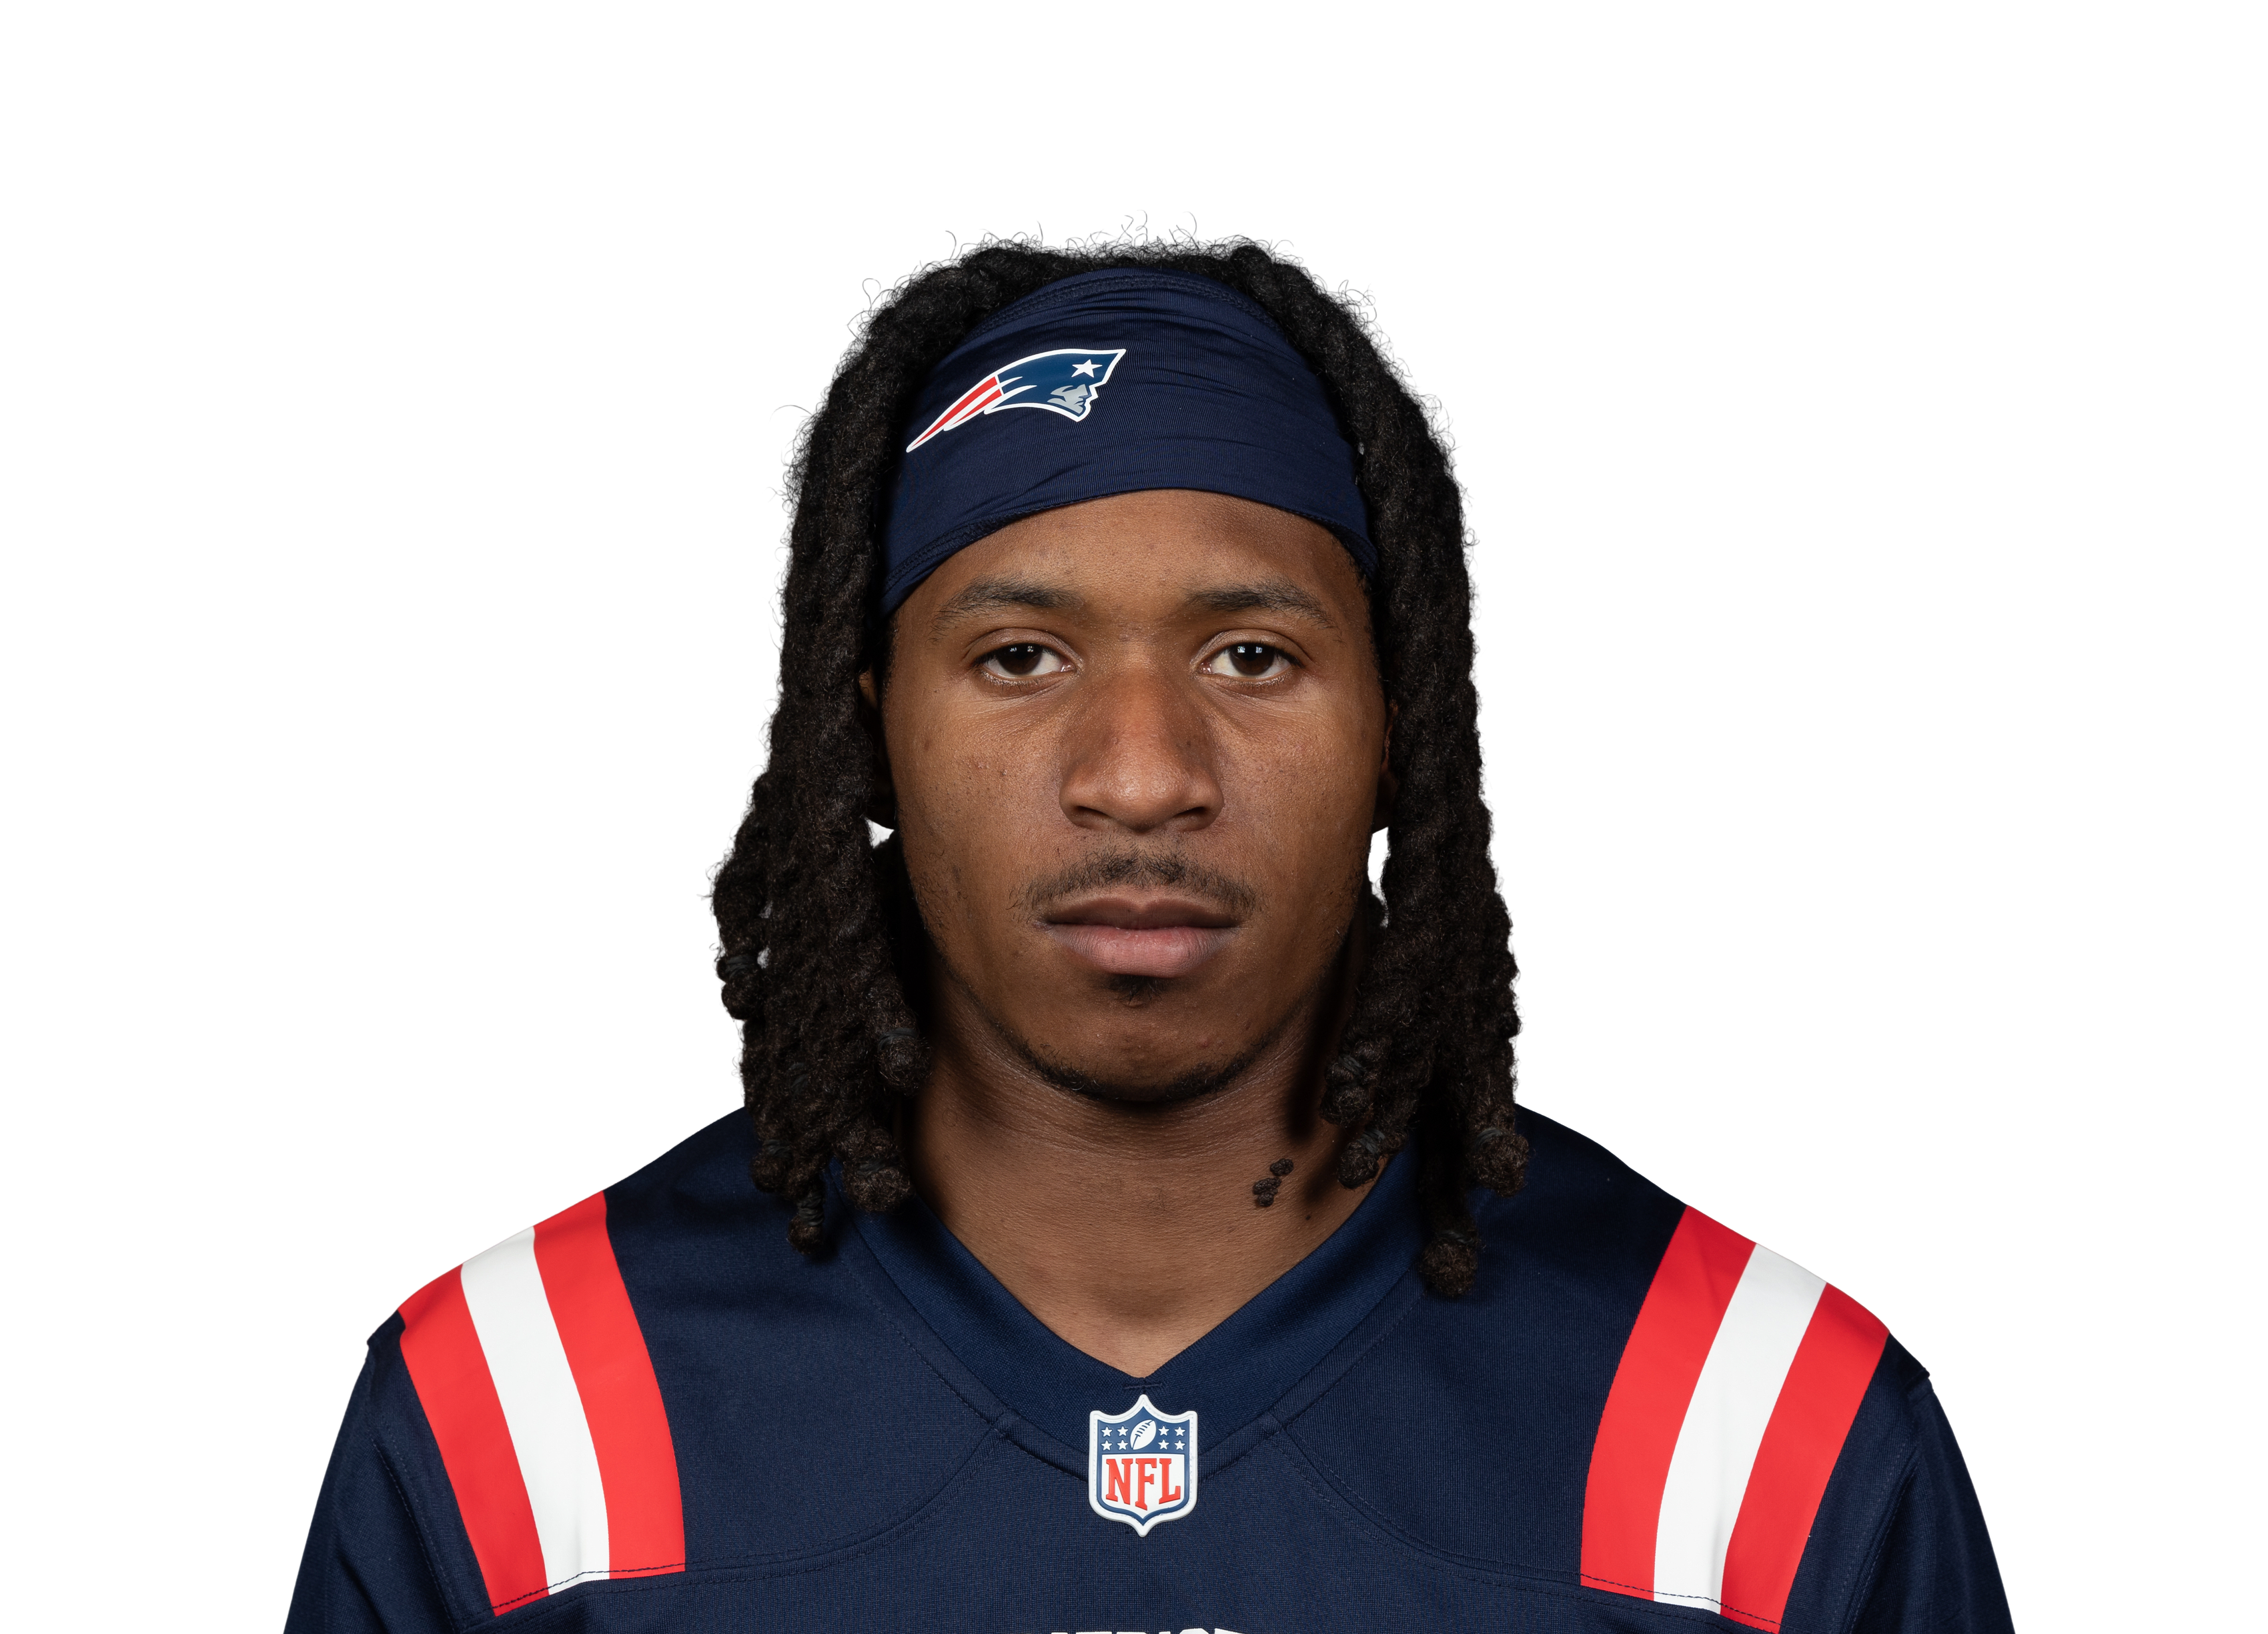 Kyle Williams@ NE • Wk 6 | 2.2 | 1 | 1 | 12 | 0 | 0 |
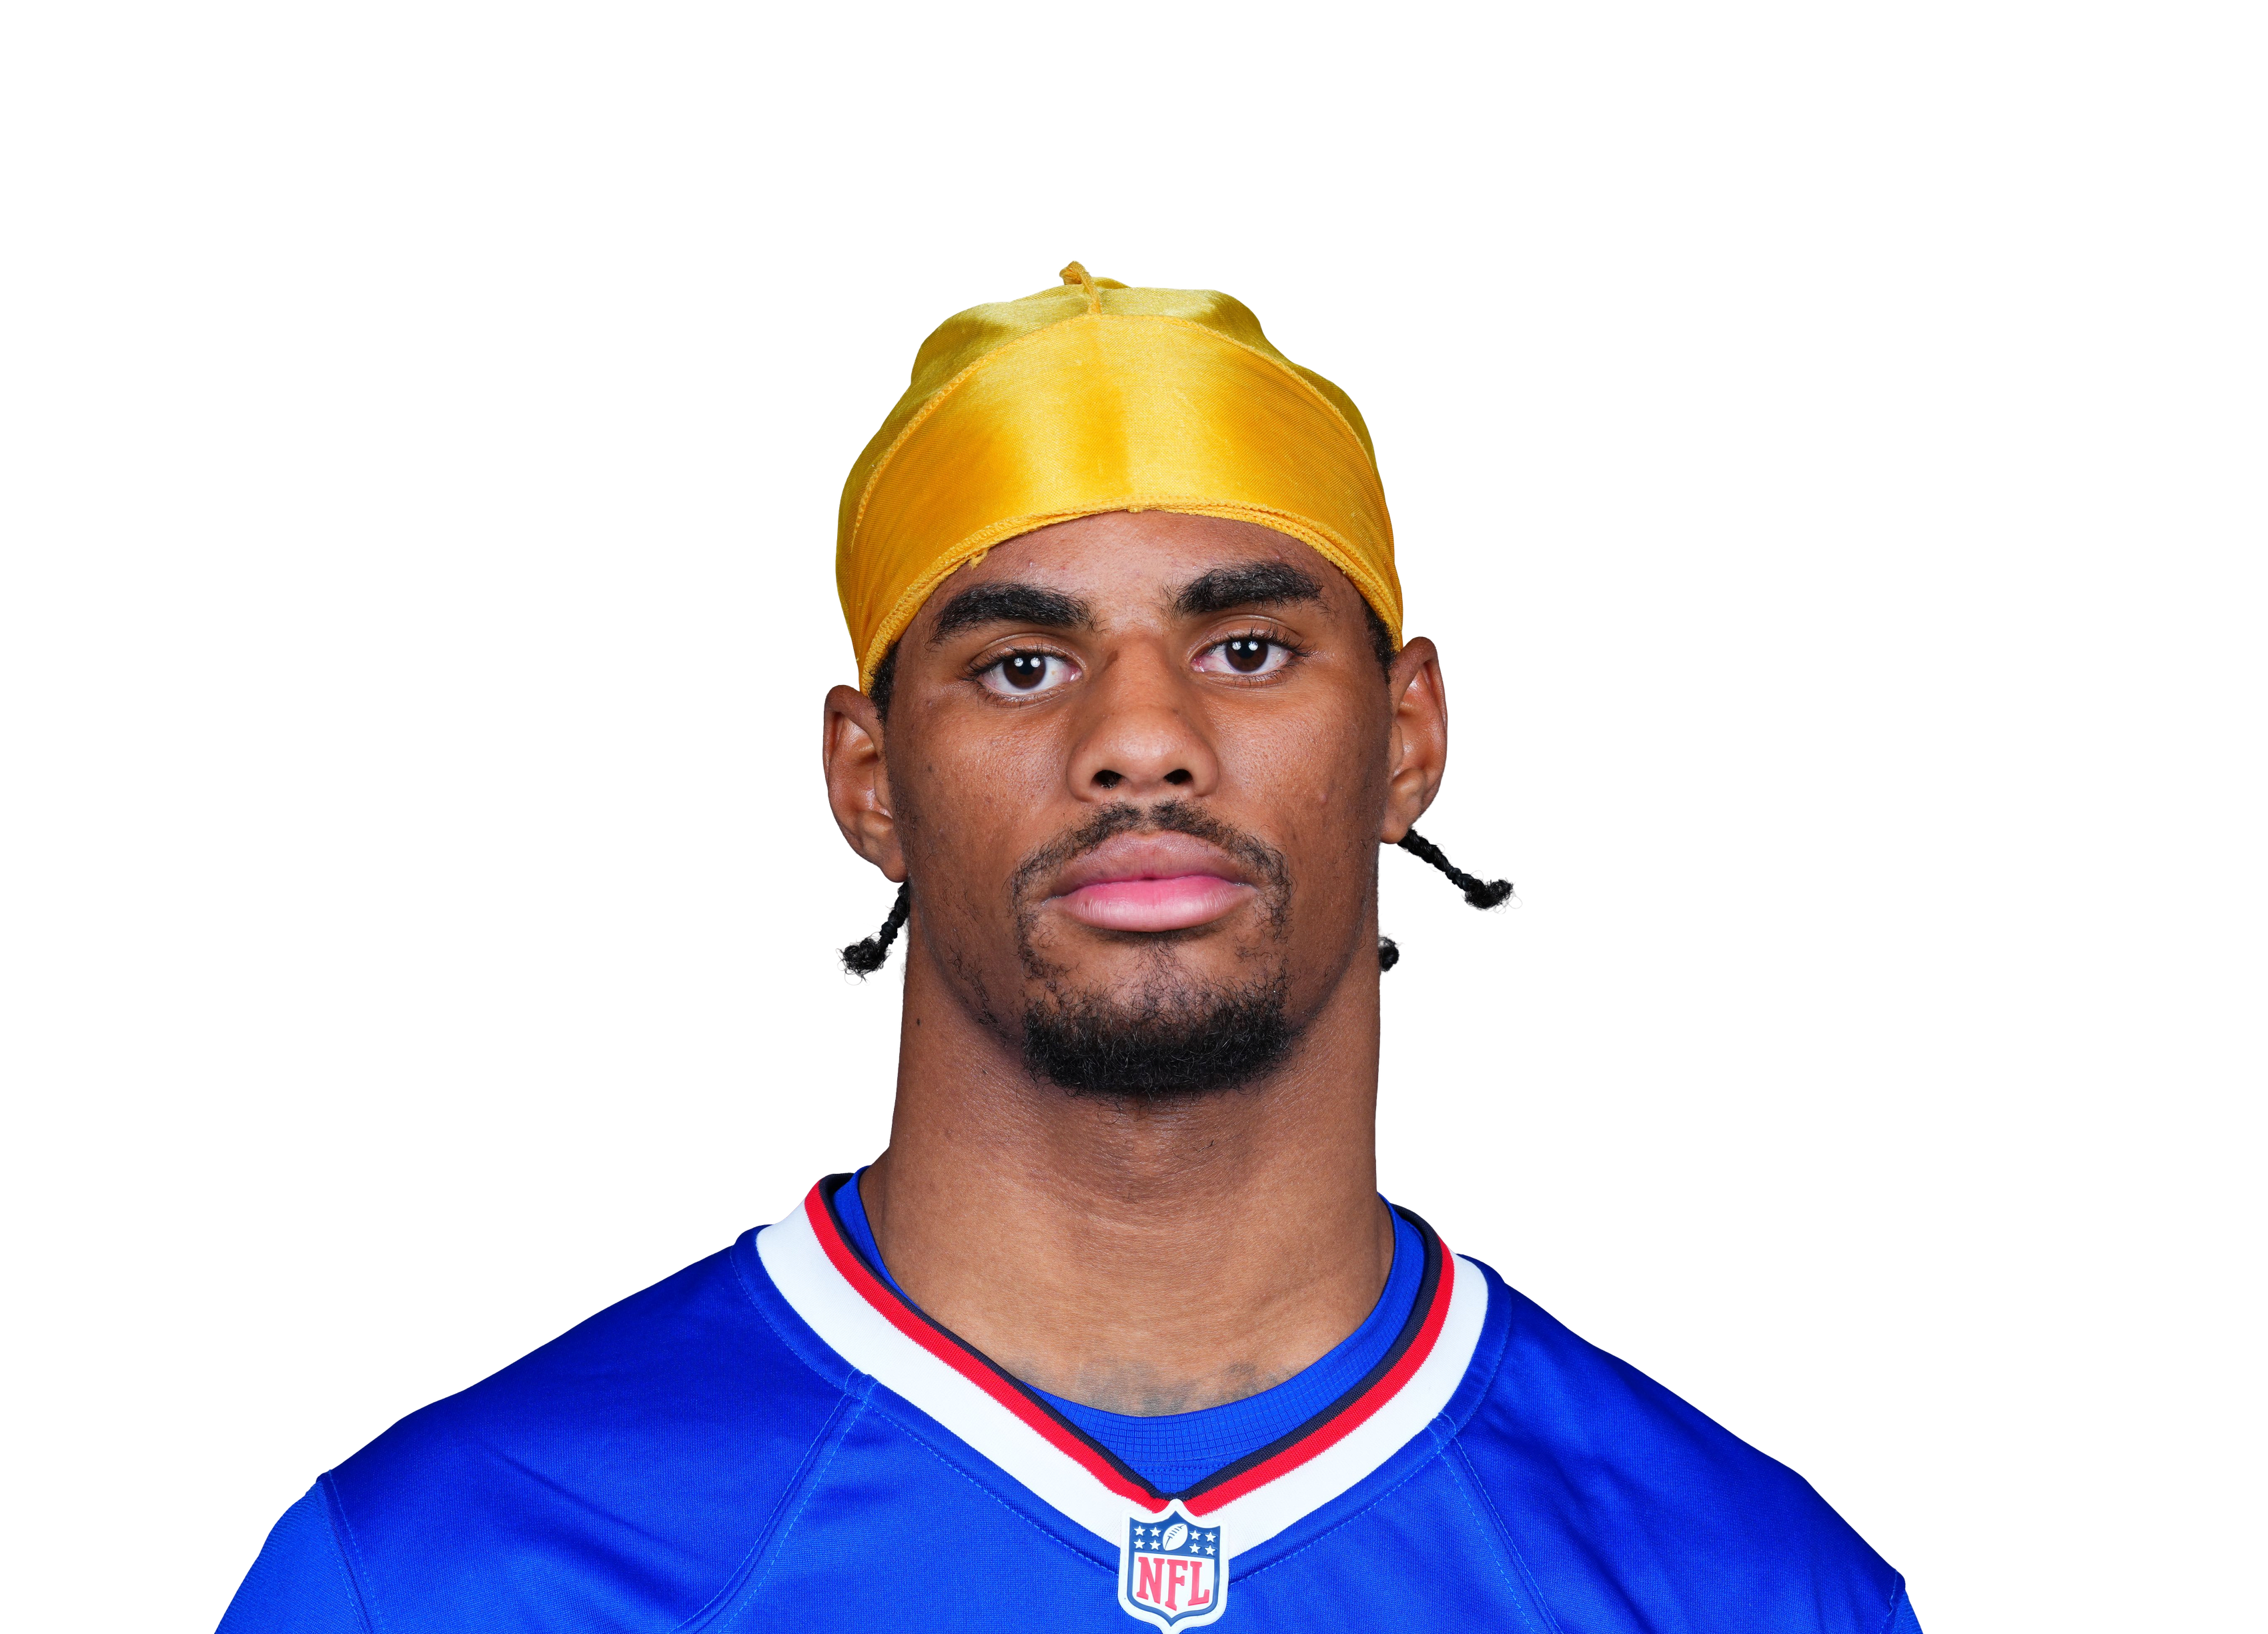 Keon Colemanvs BUF • Wk 10 | 2.1 | 3 | 1 | 11 | 0 | 0 |
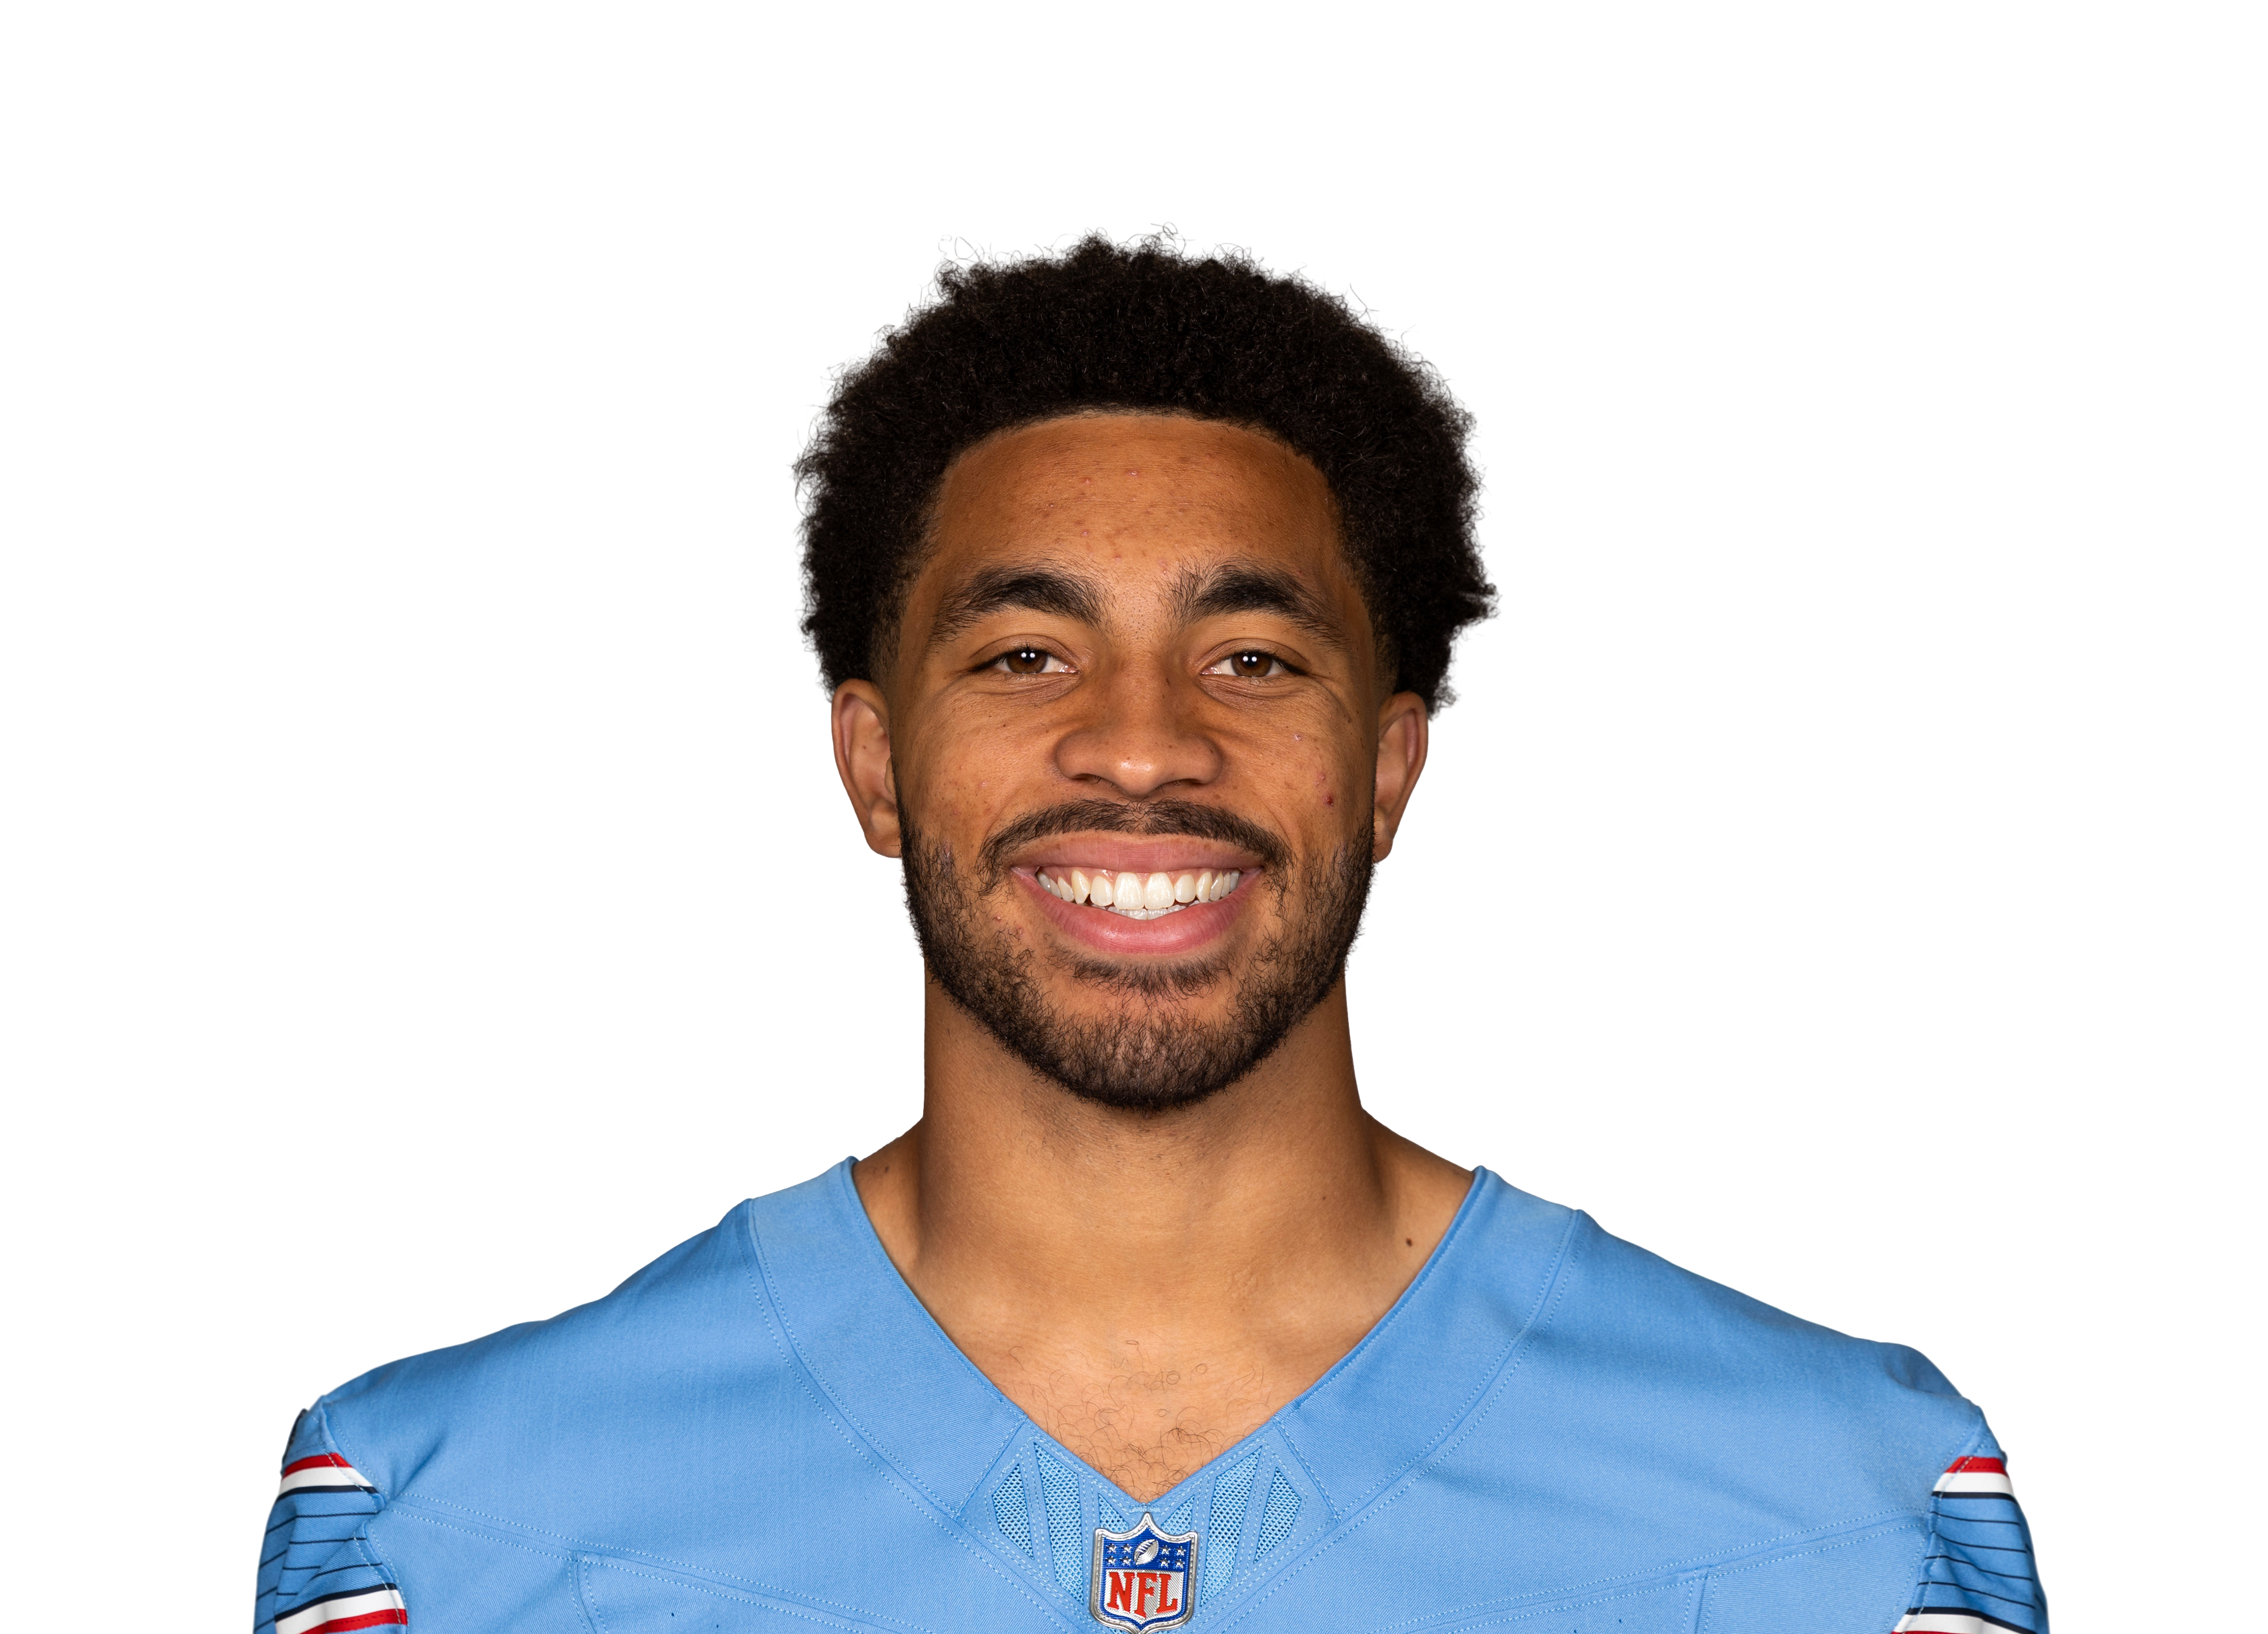 Chimere Dike@ TEN • Wk 1 | 1.7 | 1 | 1 | 7 | 0 | 0 |
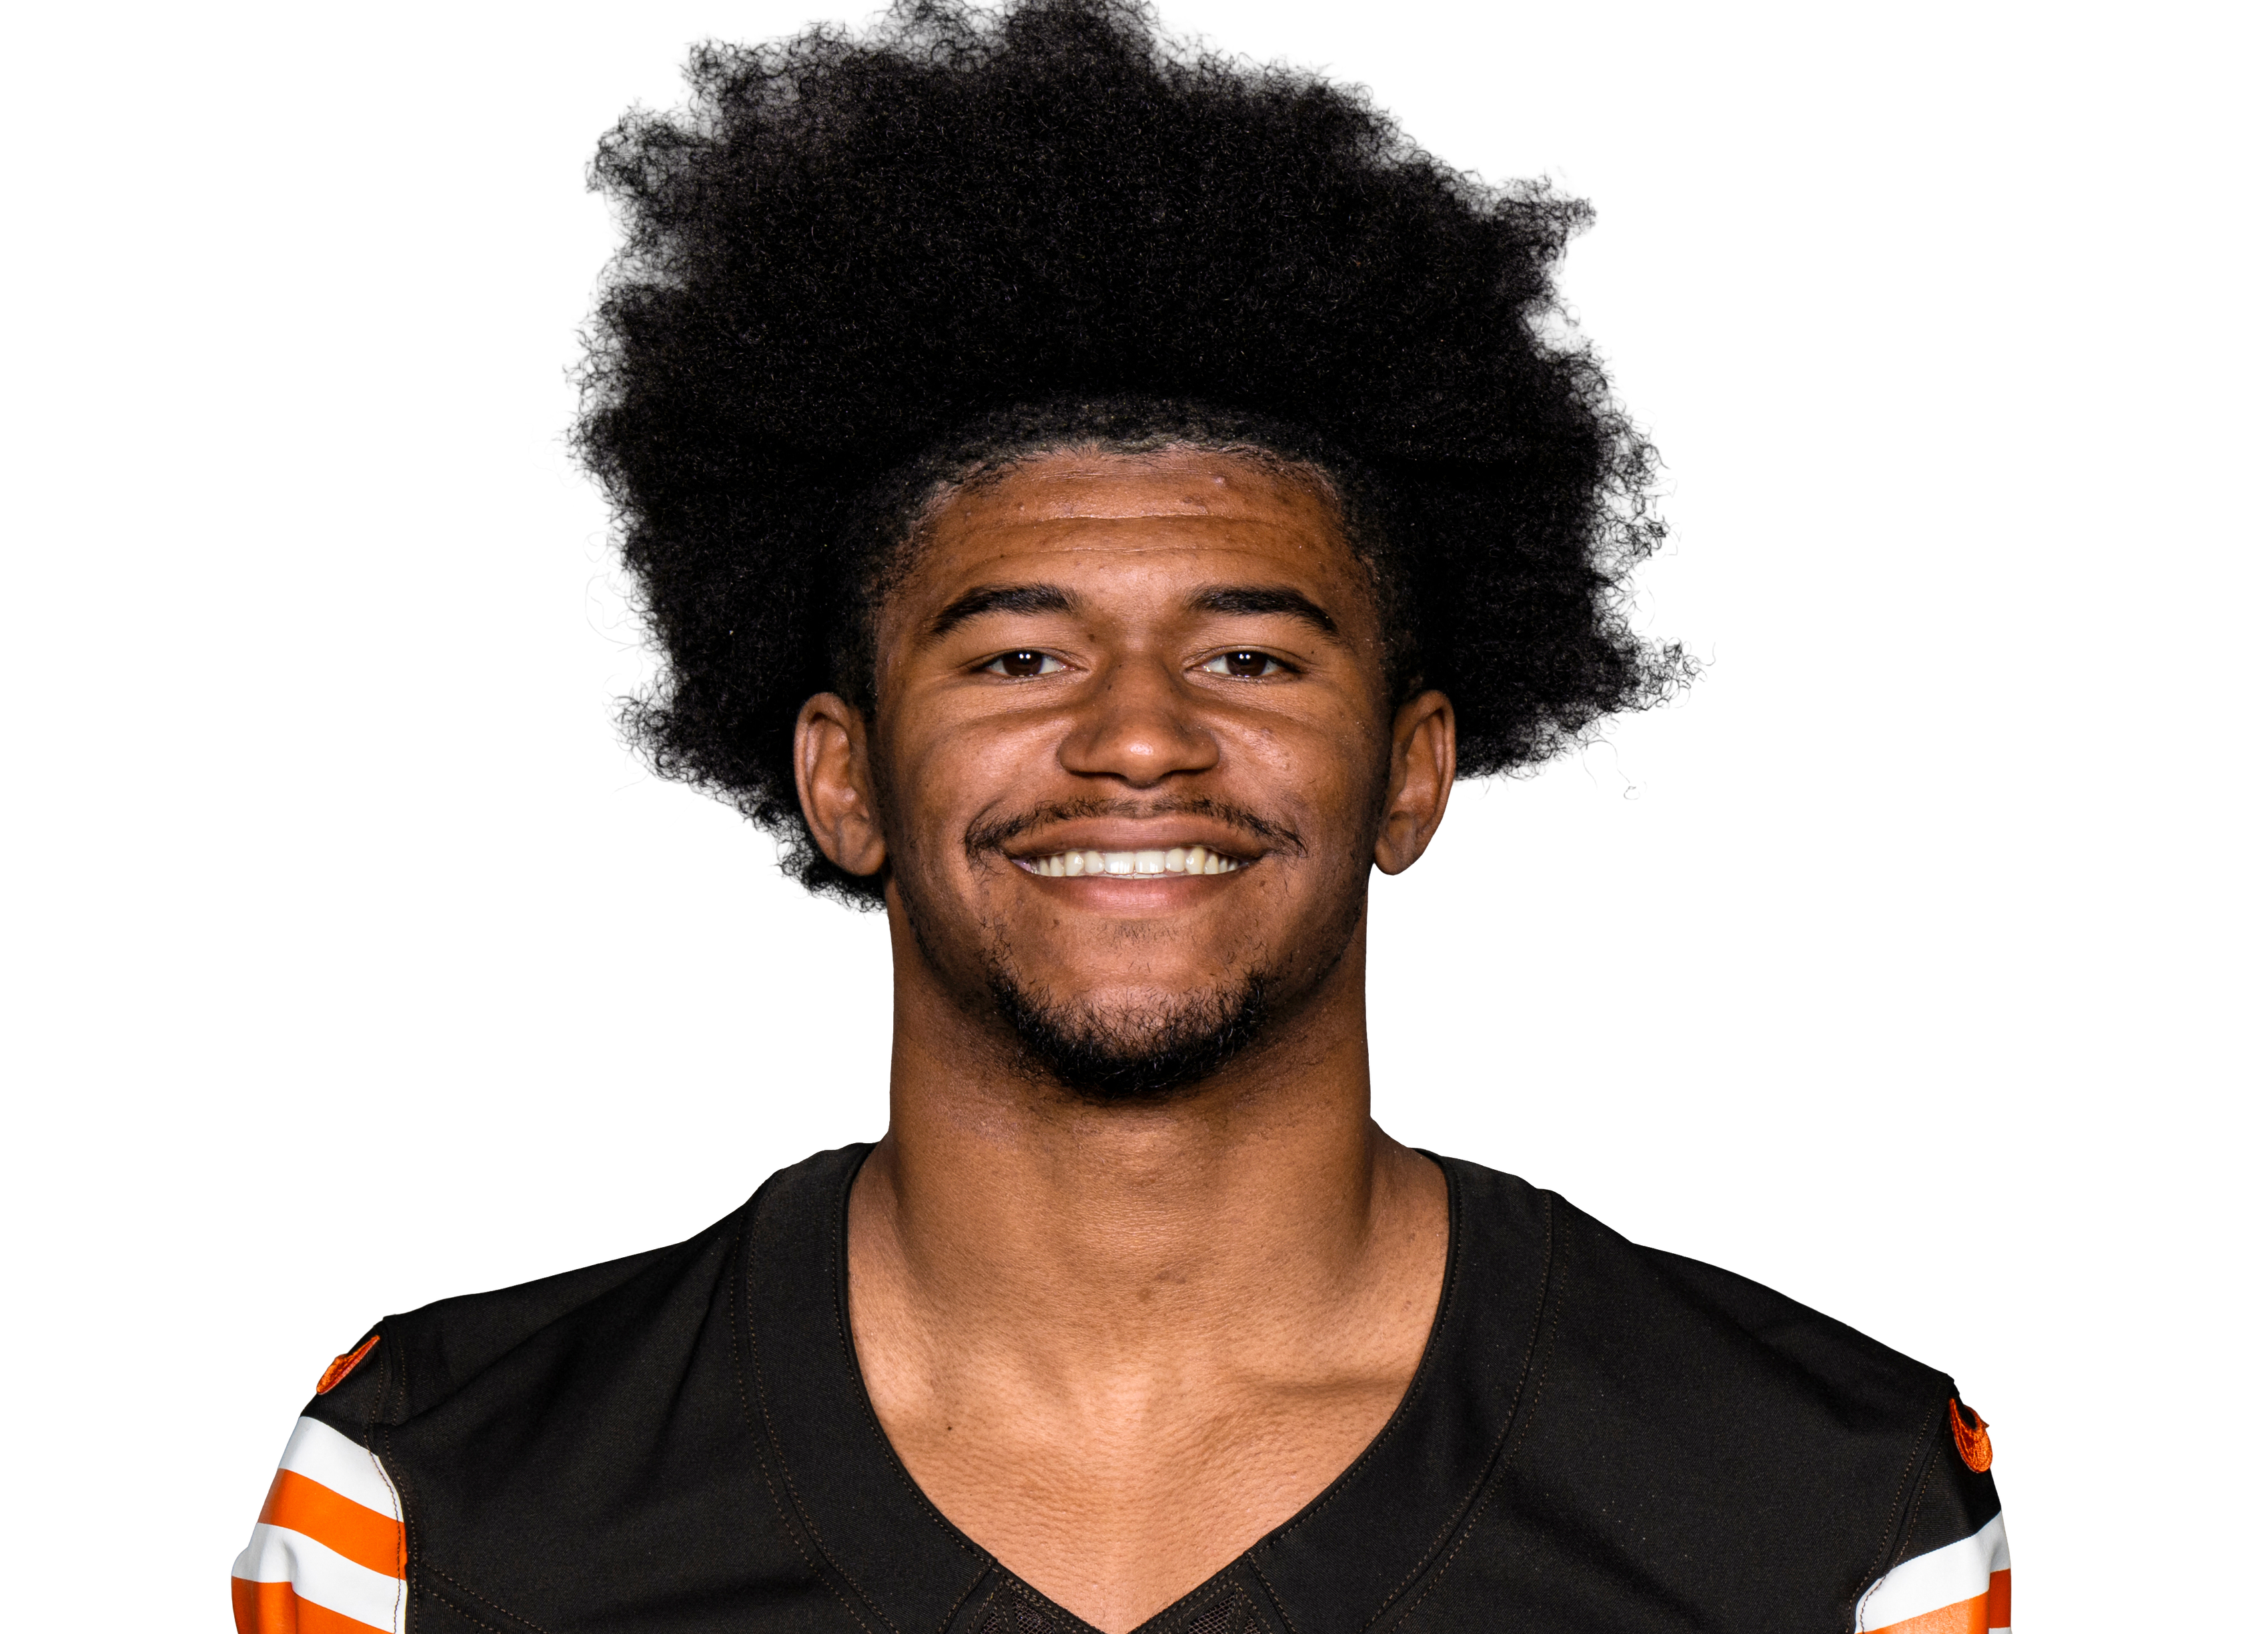 KC Concepcionvs CLE • Wk 5 | 1.5 | 1 | 1 | 5 | 0 | 0 |
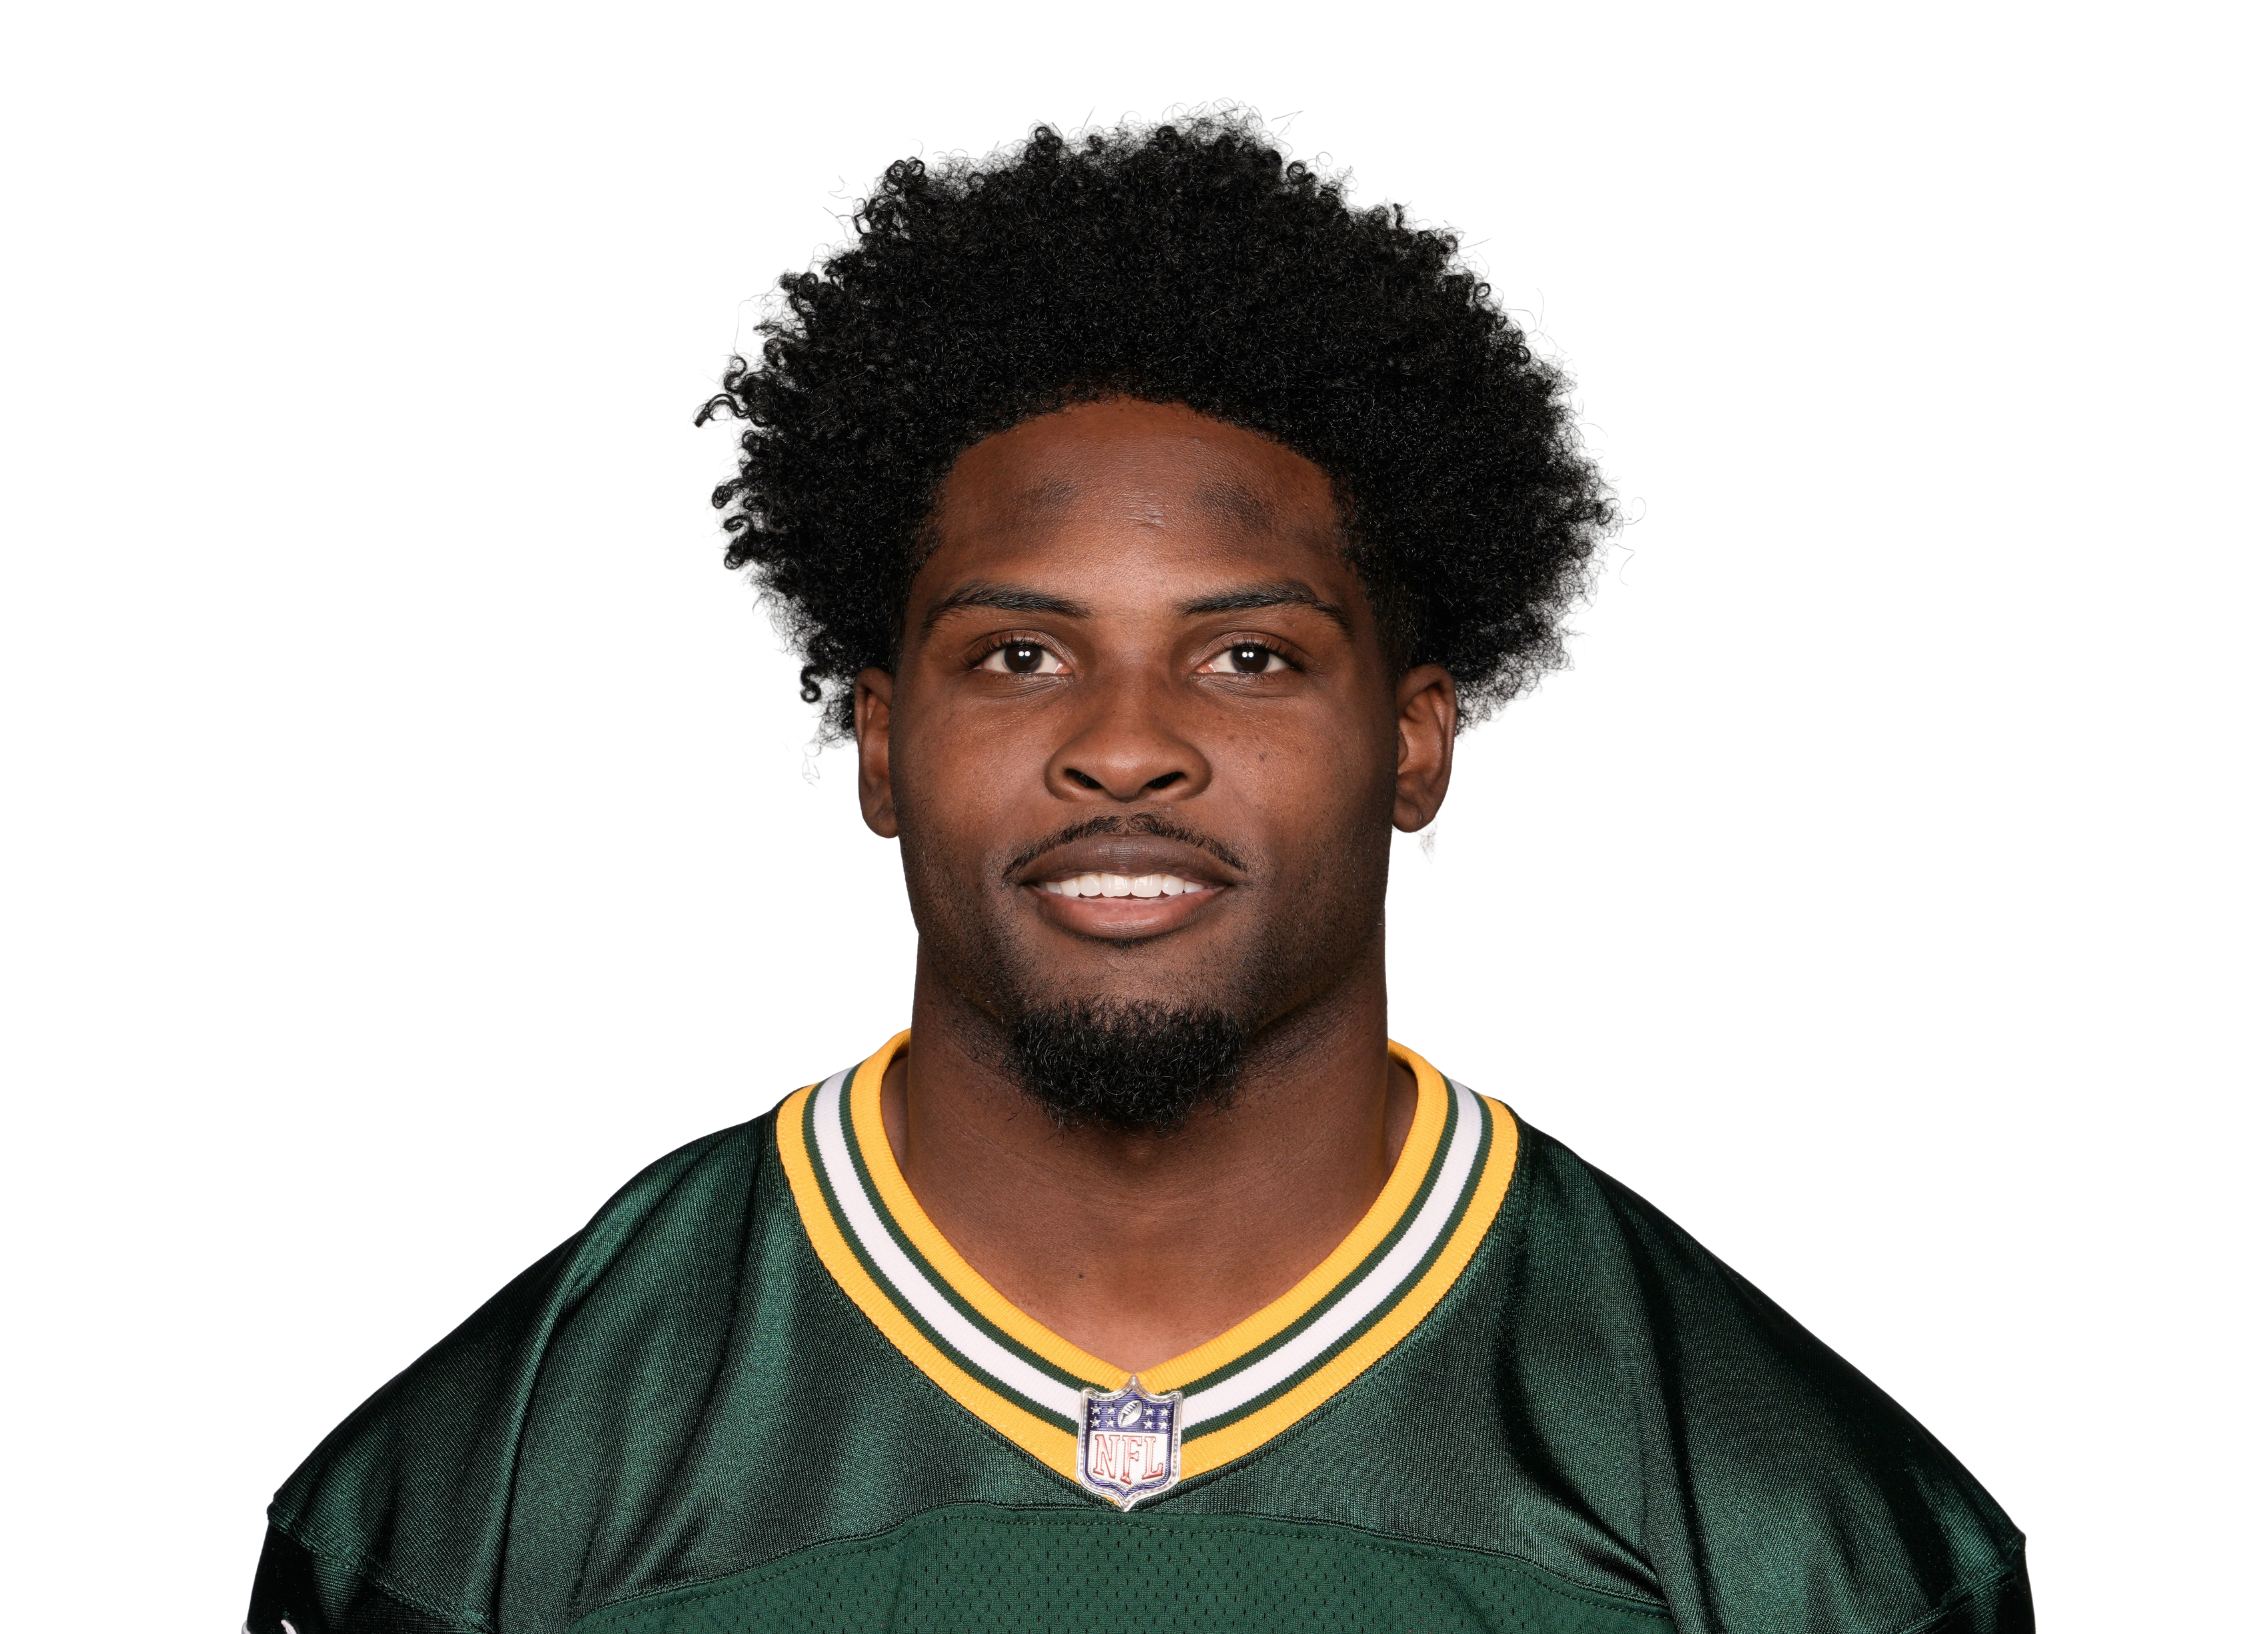 Jayden Reedvs GB • Wk 2 | 1.4 | 1 | 1 | 4 | 0 | 0 |
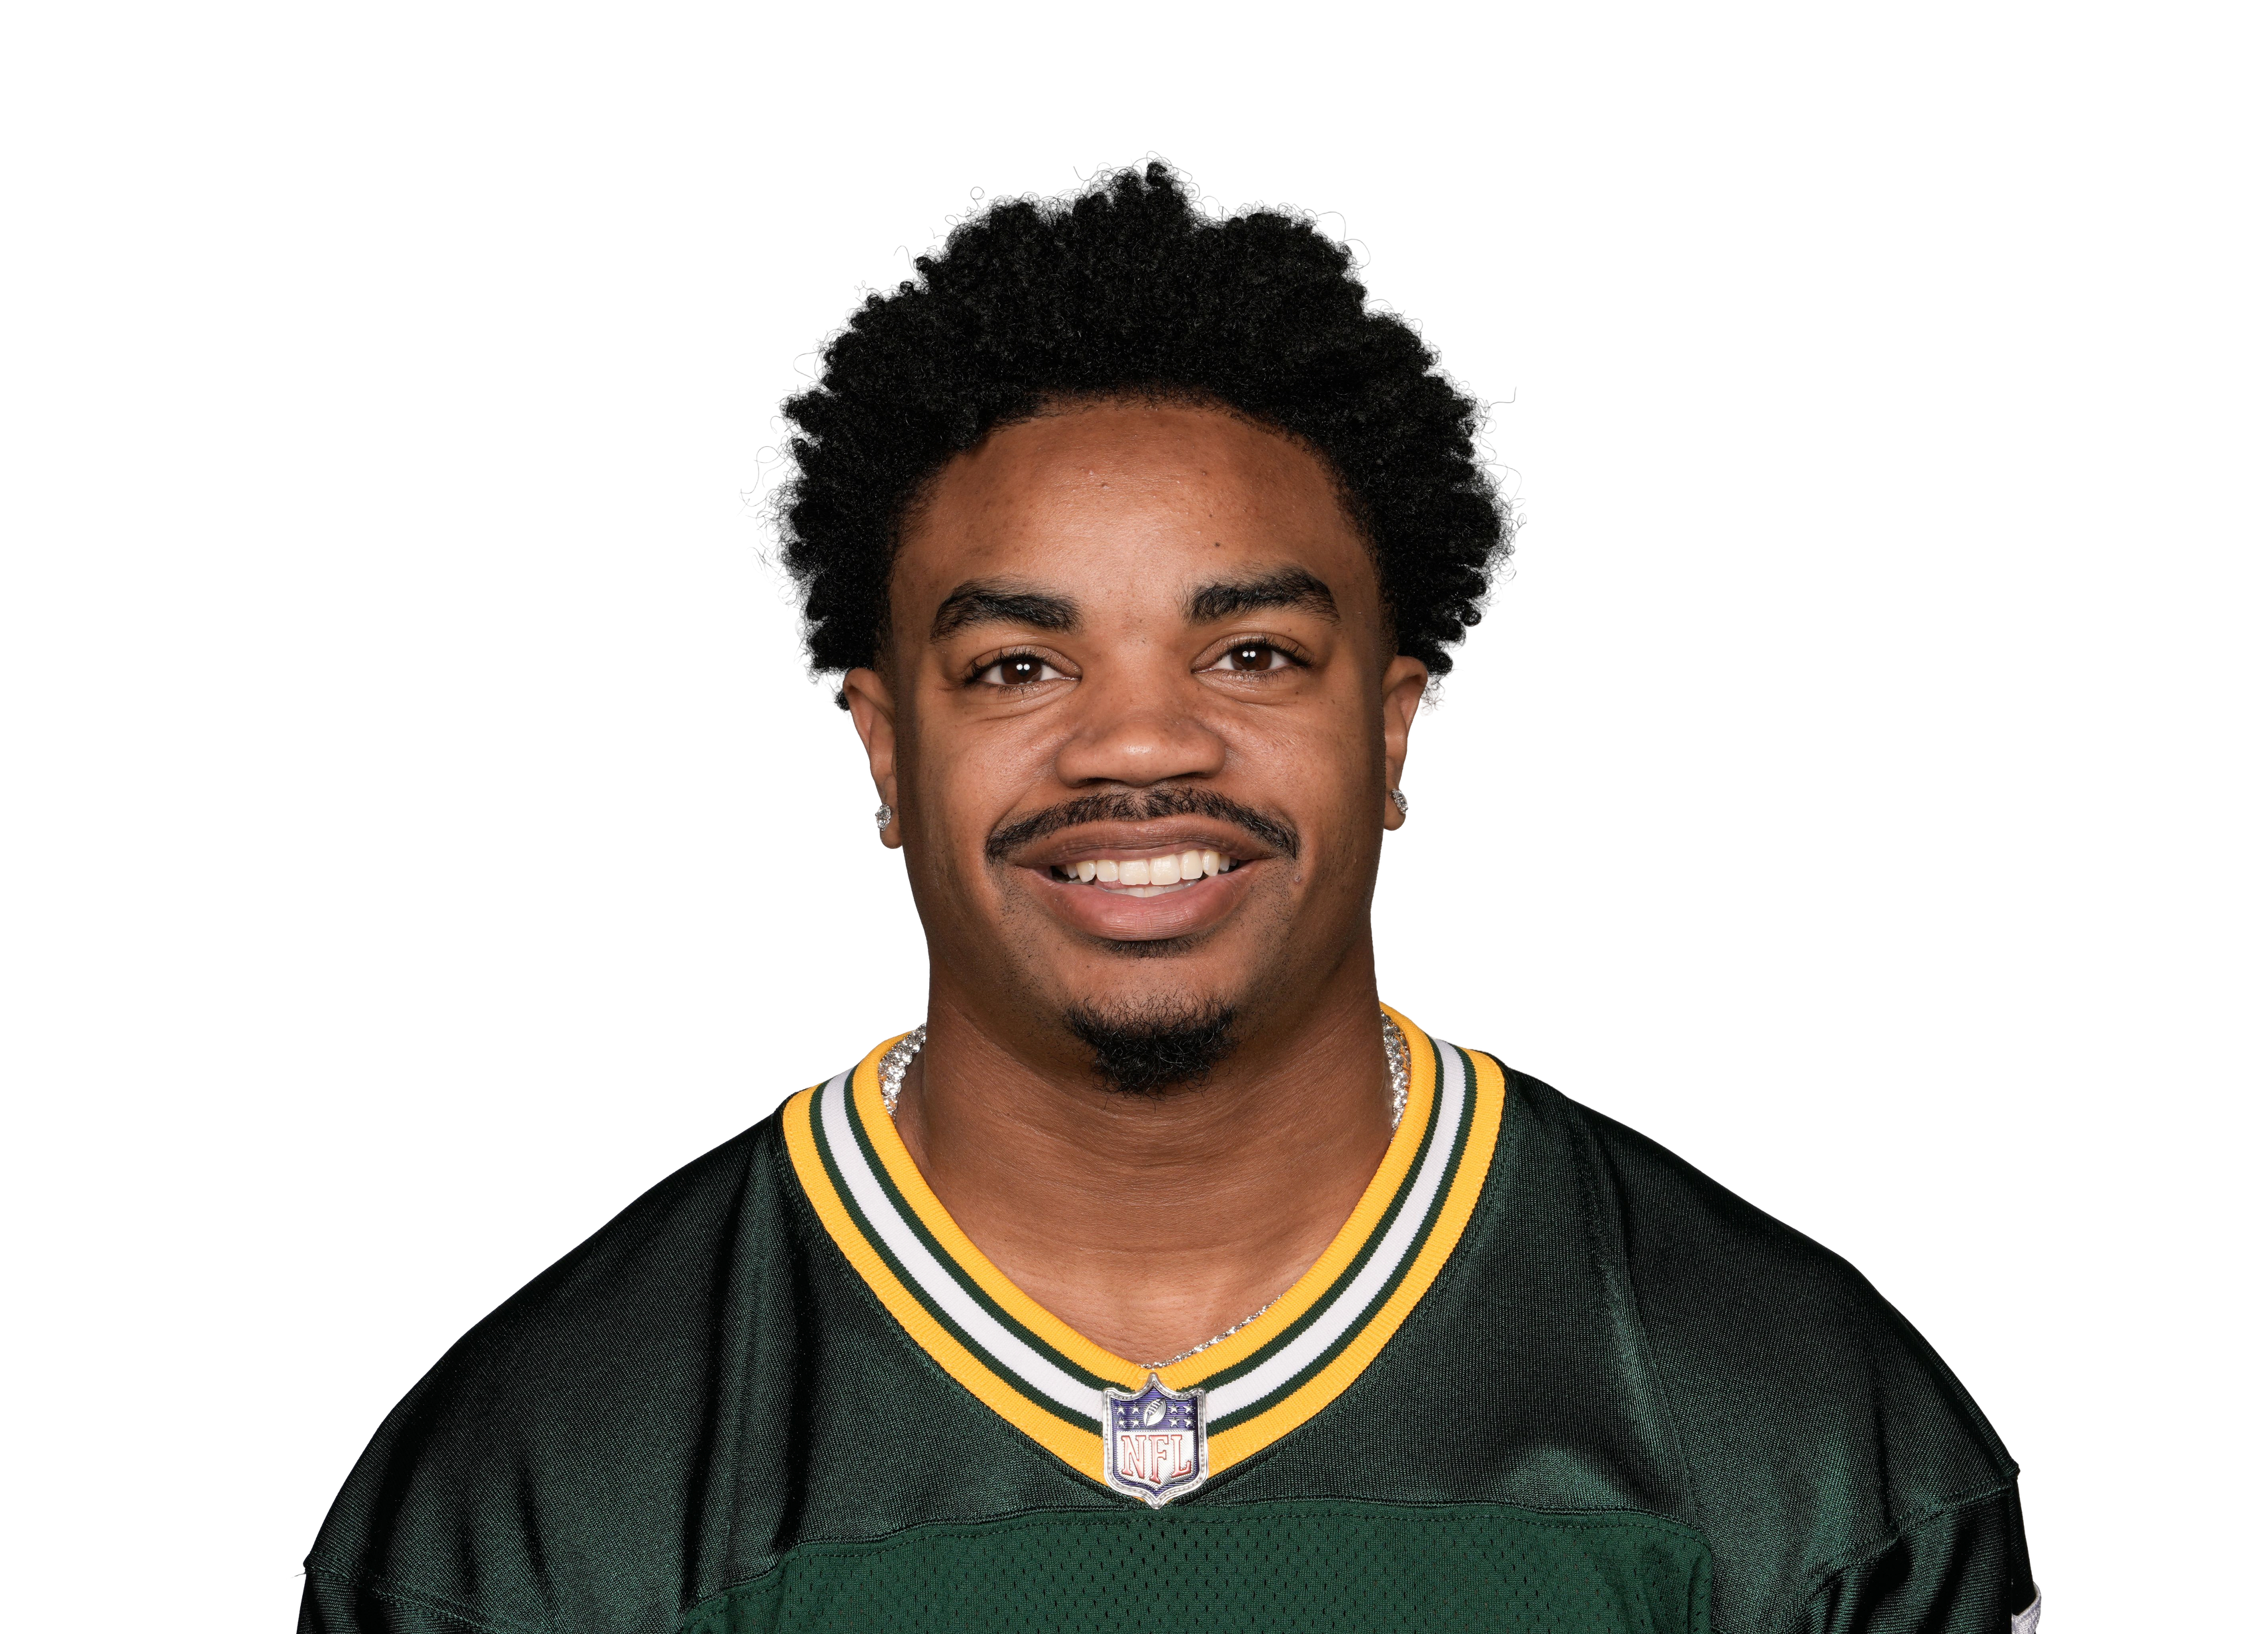 Bo Meltonvs GB • Wk 2 | 0.0 | 1 | 0 | 0 | 0 | 0 |
 Efton Chism III@ NE • Wk 6 | 0.0 | 1 | 0 | 0 | 0 | 0 |
 Kevin Coleman Jr.vs MIA • Wk 7 | 0.0 | 1 | 0 | 0 | 0 | 0 |
 Tre Tuckervs LV • Wk 8 | 0.0 | 1 | 0 | 0 | 0 | 0 |
 Cyrus Allen@ KC • Wk 9 | 0.0 | 1 | 0 | 0 | 0 | 0 |
 Greg Dortchvs BUF • Wk 10 | 0.0 | 1 | 0 | 0 | 0 | 0 |
Fantasy points first, then the stats that matter for his position. Ring around each photo is that player's Mania Rating. Tap a name to open his profile.
Usage
Snaps
54%
Target share
14%
Targets/G
4.8
PPR/G
4.5
By the numbers
PPR / Game
4.5
27th percentileWR avg 8.4
Targets / Game
4.8
57th percentileWR avg 4.9
Receiving Yards / Game
30.4
42nd percentileWR avg 39.4
Receptions / Game
2.2
42nd percentileWR avg 3
Share of Team Targets
14.2%
51st percentileWR avg 15.6%
Share of Team Air Yards
22.6%
55th percentileWR avg 22.2%
Red-Zone Targets / Game
0.7
62nd percentileWR avg 0.7
End-Zone Targets / Game
0.4
56th percentileWR avg 0.4
Snap Share
53.7%
32nd percentileWR avg 63.2%
TDs / Game
0
26th percentileWR avg 0.2
LAC WR room
T. Harris19%
L. McConkey16%
K. Lambert-Smith14%
Q. Johnston13%
B. Thompson12%
Share of targets
LAC WR room, week by week
Targets and receiving yards each week, with his share of the team targets and his snap percentage.
| Player | W1 | W2 | W3 | W4 | W5 | W6 | W8 | W9 | W10 | Per game |
|---|---|---|---|---|---|---|---|---|---|---|
| Ladd McConkey | 782 yds26% targets49% snaps | 335 yds12% targets46% snaps | 566 yds15% targets88% snaps | 20 yds7% targets34% snaps | — | 117 yds3% targets12% snaps | 686 yds20% targets90% snaps | — | — | 4.048 yds a game • 11.9 per target14% targets53% snaps |
| Tre Harris | 620 yds22% targets75% snaps | 353 yds12% targets82% snaps | 776 yds21% targets58% snaps | 560 yds16% targets93% snaps | 416 yds19% targets45% snaps | — | 331 yds10% targets51% snaps | 76 yds23% targets83% snaps | 586 yds31% targets98% snaps | 5.044 yds a game • 8.7 per target19% targets73% snaps |
| Quentin Johnston | 617 yds22% targets78% snaps | 57 yds19% targets81% snaps | 640 yds18% targets87% snaps | 244 yds7% targets75% snaps | — | 357 yds8% targets82% snaps | 437 yds13% targets82% snaps | 458 yds13% targets83% snaps | 16 yds6% targets77% snaps | 3.933 yds a game • 8.6 per target13% targets81% snaps |
| KeAndre Lambert-Smith | — | — | — | — | — | 932 yds25% targets87% snaps | 00 yds0% targets3% snaps | 450 yds13% targets56% snaps | — | 4.327 yds a game • 6.3 per target13% targets49% snaps |
| Brenen Thompson | — | 313 yds12% targets18% snaps | — | — | — | — | — | — | — | 3.013 yds a game • 4.3 per target12% targets18% snaps |
| Theo Wease Jr. | — | — | — | — | 116 yds5% targets64% snaps | 321 yds8% targets47% snaps | — | — | 10 yds6% targets9% snaps | 1.712 yds a game • 7.4 per target6% targets40% snaps |
| Marquez Valdes-Scantling | — | — | 10 yds3% targets4% snaps | 10 yds3% targets37% snaps | 322 yds14% targets75% snaps | — | — | — | — | 1.77 yds a game • 4.4 per target7% targets39% snaps |
| Derius Davis | 10 yds4% targets18% snaps | 10 yds4% targets12% snaps | 00 yds0% targets1% snaps | 16 yds3% targets4% snaps | 00 yds0% targets15% snaps | 00 yds0% targets7% snaps | 00 yds0% targets5% snaps | 215 yds7% targets7% snaps | 00 yds0% targets26% snaps | 0.62 yds a game • 4.2 per target2% targets11% snaps |
Each cell is targets that week, with receiving yards, share of team targets and snap percentage. Click a name to open that player.
Game log
Games3
PPR/G4.5
Game log
Lambert-Smith avg 4.1NFL top 30 WRs avg 16.4
Solid dot is what he scored. Hollow dot is our projection before the game.
| Use | Game | Proj | PPR | Tgt | Rec | Rec Yd | Car | Rush Yd | TD | Snap |
|---|---|---|---|---|---|---|---|---|---|---|
W6 vs KC | 0.9 | 6.2 | 9 | 5 | 32 | 0 | 0 | 0 | 87% | |
W8 vs LA | 6.2 | 0 | 0 | 0 | 0 | 0 | 0 | 0 | 3% | |
W9 vs HOU | 6.4 | 6 | 4 | 1 | 50 | 0 | 0 | 0 | 56% |
Opponent color:Easy defense for WRsAverageTough
Schedule ahead
11 NYJ12 NE13 TB14 LV15 SF16 MIA17 KC18 DEN
Green easier, red tougher
Schedule ahead
Colored by what each defense has given up to WRs so far. Green is an easier matchup, red is a tougher one.
Wk 11 NYJWk 12 NEWk 13 TBWk 14 LVWk 15 SFWk 16 MIAWk 17 KCWk 18 DENSee every team's WR schedule ›
StatPer gameSeasonRank
Overall
Games—36›
PPR points4.512.227›
Receiving
Targets4.81356›
Catches2.2640›
Receiving yards30.48242›
Yards per target6.3—26›
Rushing
Scrimmage yards30.48239›
Usage
Snap %54%—31›
Target share %14.2%—51›
Touch share %8.2%—53›
Air yards share %22.6%14956›
Scoring chances
Red-zone targets0.7262›
End-zone targets0.4155›
Tap any stat to see everyone ranked. Bars: green top 30%, yellow middle, red bottom 40%.
Advanced stats
Not ranked yet. Needs 35 targets and he has 13.
Fumbles lostOne
1 this season
LAC
67.7
Mania Rating
Overall profile · Starter
64.8
Week 11 Rating
Start value vs NYJ
KeAndre Lambert-Smith
#163 OverallWR87#4 WR on LACDepth WR5 ›Age 25
Week 11 projection 6.2 PPR ›WR60 this week
WR60 this week
This weekWR60
Games counted
Untick or tick any game and Mania Rating, matchup and Week 11 Rating all recalculate. Official Mania Rating 67.7.
Teammate injuries shift his Week 11 Rating1 teammate note ▾
Ladd McConkey (WR, Questionable) +4.9 • without him that work was worth 9.8 pts vs 0 with (2 games)
Injury report updated Sat Nov 21, 6:30 AM ET
Week 11 Rating = recent role + opponent + the latest injury report (updated Sat Nov 21, 6:30 AM ET). Check final inactives before you set your lineup.
Week 11 projection
6.2
projected points
Floor 0.6 · Ceiling 13.2
0.0Game script
-0.1Matchup
+0.5Injuries
Week 11 projection
LACVSPPR
NYJTough matchup • NYJ is #26 in points allowed to WRs
6.2
projected pointsReceiving 3.8 targets, 2.3 catches, 30 yds • 0.17 TD
Floor 0.64 of 5 games land hereCeiling 13.2
0.0Game script
-0.1Matchup
+0.5Injuries
How this is built
Recent and last-season usage, the Vegas spread and total, how this defense treats his position, and the injury report (teammates out, QB out). The three boxes show how many points each moved it. When sportsbook player lines are posted (Wednesday to Sunday) they are blended in, leaning on them most for new starters and players with few games. PPR scoring only. Tested on past seasons it is about 5% closer than a plain season average.
LAC WR room
T. Harris19%
L. McConkey16%
K. Lambert-Smith14%
Q. Johnston13%
B. Thompson12%
Share of targets
LAC WR room, week by week
Targets and receiving yards each week, with his share of the team targets and his snap percentage.
| Player | W1 | W2 | W3 | W4 | W5 | W6 | W8 | W9 | W10 | Per game |
|---|---|---|---|---|---|---|---|---|---|---|
| Ladd McConkey | 782 yds26% targets49% snaps | 335 yds12% targets46% snaps | 566 yds15% targets88% snaps | 20 yds7% targets34% snaps | — | 117 yds3% targets12% snaps | 686 yds20% targets90% snaps | — | — | 4.048 yds a game • 11.9 per target14% targets53% snaps |
| Tre Harris | 620 yds22% targets75% snaps | 353 yds12% targets82% snaps | 776 yds21% targets58% snaps | 560 yds16% targets93% snaps | 416 yds19% targets45% snaps | — | 331 yds10% targets51% snaps | 76 yds23% targets83% snaps | 586 yds31% targets98% snaps | 5.044 yds a game • 8.7 per target19% targets73% snaps |
| Quentin Johnston | 617 yds22% targets78% snaps | 57 yds19% targets81% snaps | 640 yds18% targets87% snaps | 244 yds7% targets75% snaps | — | 357 yds8% targets82% snaps | 437 yds13% targets82% snaps | 458 yds13% targets83% snaps | 16 yds6% targets77% snaps | 3.933 yds a game • 8.6 per target13% targets81% snaps |
| KeAndre Lambert-Smith | — | — | — | — | — | 932 yds25% targets87% snaps | 00 yds0% targets3% snaps | 450 yds13% targets56% snaps | — | 4.327 yds a game • 6.3 per target13% targets49% snaps |
| Brenen Thompson | — | 313 yds12% targets18% snaps | — | — | — | — | — | — | — | 3.013 yds a game • 4.3 per target12% targets18% snaps |
| Theo Wease Jr. | — | — | — | — | 116 yds5% targets64% snaps | 321 yds8% targets47% snaps | — | — | 10 yds6% targets9% snaps | 1.712 yds a game • 7.4 per target6% targets40% snaps |
| Marquez Valdes-Scantling | — | — | 10 yds3% targets4% snaps | 10 yds3% targets37% snaps | 322 yds14% targets75% snaps | — | — | — | — | 1.77 yds a game • 4.4 per target7% targets39% snaps |
| Derius Davis | 10 yds4% targets18% snaps | 10 yds4% targets12% snaps | 00 yds0% targets1% snaps | 16 yds3% targets4% snaps | 00 yds0% targets15% snaps | 00 yds0% targets7% snaps | 00 yds0% targets5% snaps | 215 yds7% targets7% snaps | 00 yds0% targets26% snaps | 0.62 yds a game • 4.2 per target2% targets11% snaps |
Each cell is targets that week, with receiving yards, share of team targets and snap percentage. Click a name to open that player.
Game log
Games3
PPR/G4.5
Game log
Lambert-Smith avg 4.1NFL top 30 WRs avg 16.4
Solid dot is what he scored. Hollow dot is our projection before the game.
| Use | Game | Proj | PPR | Tgt | Rec | Rec Yd | Car | Rush Yd | TD | Snap |
|---|---|---|---|---|---|---|---|---|---|---|
| W6vs KC | 0.9 | 6.2 | 9 | 5 | 32 | 0 | 0 | 0 | 87% | |
| W8vs LA | 6.2 | 0 | 0 | 0 | 0 | 0 | 0 | 0 | 3% | |
| W9vs HOU | 6.4 | 6 | 4 | 1 | 50 | 0 | 0 | 0 | 56% |
Opponent color:Easy defense for WRsAverageTough
Schedule ahead
11 NYJ12 NE13 TB14 LV15 SF16 MIA17 KC18 DEN
Green easier, red tougher
Schedule ahead
Colored by what each defense has given up to WRs so far. Green is an easier matchup, red is a tougher one.
Wk 11 NYJWk 12 NEWk 13 TBWk 14 LVWk 15 SFWk 16 MIAWk 17 KCWk 18 DENSee every team's WR schedule ›
StatPer gameSeasonRank
Overall
Games—36›
PPR points4.512.227›
Receiving
Targets4.81356›
Catches2.2640›
Receiving yards30.48242›
Yards per target6.3—26›
Rushing
Scrimmage yards30.48239›
Usage
Snap %54%—31›
Target share %14.2%—51›
Touch share %8.2%—53›
Air yards share %22.6%14956›
Scoring chances
Red-zone targets0.7262›
End-zone targets0.4155›
Tap any stat to see everyone ranked. Bars: green top 30%, yellow middle, red bottom 40%.
Advanced stats
Not ranked yet. Needs 35 targets and he has 13.
Fumbles lostOne
1 this season
Mania breakdown
Fantasy Production29
Target Volume51
Team Target Role49
Red-Zone Threat62
Per-Target Efficiency11
Mania breakdown
Percentile among WRs. 100 is the best, 50 is average.
How many fantasy points and total yards he is actually producing, compared with players at his position. Ranks better than 29% of WRs.
How often he is targeted: targets per game, receptions and his share of the team targets. Ranks better than 51% of WRs.
How big a slice of his team passing game belongs to him: target share, air-yard share and snaps. Ranks better than 49% of WRs.
How often the offense uses him near the goal line: red-zone targets and end-zone targets. Ranks better than 62% of WRs.
What he produces with each chance instead of just rewarding volume: yards per target, catch rate and fantasy points per opportunity. Ranks better than 11% of WRs.
Top 30%MiddleBottom 40%Tap a category to see what it means.
Week 11 matchup
vs NYJ
Good matchup
Adjustment+1.5 pts
Allows to WRs26th most
Week11
Week 11 matchup
vs NYJ
+2.1Rating boost
Good matchup26th easiest of 32 defenses for WRs
ToughEasy
28.3PPR a game NYJ allows to WRs
7.8Similar players, usual PPR a game
11.8Same players against NYJ
Players with a role like his scored 11.8 PPR a game against NYJ, versus 7.8 in their usual games (+51%). That moves his Week 11 Rating by +2.1.
How wide receivers did against NYJ
28.4 PPR points a game allowed to wide receivers, 26th most of 32 defenses.
| Player | PPR | Tgt | Rec | Rec Yd | Rec TD | Rush Yd |
|---|---|---|---|---|---|---|
| Caleb Douglasvs MIA • Wk 7 | 21.0 | 3 | 2 | 70 | 2 | 0 |
| DeMario Douglas@ NE • Wk 6 | 19.6 | 8 | 7 | 86 | 1 | 0 |
| DJ Moorevs BUF • Wk 10 | 19.4 | 6 | 4 | 90 | 1 | 4 |
| Rome Odunze@ CHI • Wk 4 | 15.4 | 7 | 6 | 94 | 0 | 0 |
| Christian Watsonvs GB • Wk 2 | 14.1 | 11 | 4 | 41 | 1 | 0 |
| Jalen Nailorvs LV • Wk 8 | 13.8 | 4 | 4 | 38 | 1 | 0 |
| Denzel Bostonvs CLE • Wk 5 | 13.6 | 7 | 3 | 46 | 1 | 0 |
| Amon-Ra St. Brown@ DET • Wk 3 | 11.9 | 8 | 4 | 19 | 1 | 0 |
| Luther Burden III@ CHI • Wk 4 | 11.4 | 6 | 4 | 63 | 0 | 11 |
| Romeo Doubs@ NE • Wk 6 | 11.2 | 1 | 1 | 42 | 1 | 0 |
| Xavier Worthy@ KC • Wk 9 | 10.8 | 6 | 6 | 48 | 0 | 0 |
| Isaiah Bondvs CLE • Wk 5 | 10.4 | 7 | 3 | 74 | 0 | 0 |
| Rashee Rice@ KC • Wk 9 | 9.9 | 7 | 5 | 49 | 0 | 0 |
| Matthew Goldenvs GB • Wk 2 | 9.8 | 6 | 4 | 58 | 0 | 0 |
| Isaac TeSlaa@ DET • Wk 3 | 9.6 | 3 | 3 | 66 | 0 | 0 |
| Jameson Williams@ DET • Wk 3 | 8.9 | 4 | 4 | 49 | 0 | 0 |
| Wan'Dale Robinson@ TEN • Wk 1 | 8.8 | 6 | 5 | 38 | 0 | 0 |
| Elic Ayomanor@ TEN • Wk 1 | 8.1 | 3 | 1 | 11 | 1 | 0 |
| Carnell Tate@ TEN • Wk 1 | 7.8 | 6 | 4 | 38 | 0 | 0 |
| Khalil Shakirvs BUF • Wk 10 | 7.5 | 3 | 2 | 26 | 0 | 29 |
| Malik Washingtonvs MIA • Wk 7 | 6.5 | 3 | 3 | 27 | 0 | 8 |
| A.J. Brown@ NE • Wk 6 | 5.7 | 10 | 3 | 27 | 0 | 0 |
| Chris Bellvs MIA • Wk 7 | 5.5 | 4 | 3 | 25 | 0 | 0 |
| Jerry Jeudyvs CLE • Wk 5 | 4.9 | 7 | 3 | 19 | 0 | 0 |
| Jalen Royals@ KC • Wk 9 | 3.8 | 2 | 2 | 18 | 0 | 0 |
| Skyy Moorevs GB • Wk 2 | 2.6 | 3 | 2 | 6 | 0 | 0 |
| Kalif Raymond@ CHI • Wk 4 | 2.6 | 2 | 2 | 6 | 0 | 0 |
| Kyle Williams@ NE • Wk 6 | 2.2 | 1 | 1 | 12 | 0 | 0 |
| Keon Colemanvs BUF • Wk 10 | 2.1 | 3 | 1 | 11 | 0 | 0 |
| Chimere Dike@ TEN • Wk 1 | 1.7 | 1 | 1 | 7 | 0 | 0 |
| KC Concepcionvs CLE • Wk 5 | 1.5 | 1 | 1 | 5 | 0 | 0 |
| Jayden Reedvs GB • Wk 2 | 1.4 | 1 | 1 | 4 | 0 | 0 |
| Bo Meltonvs GB • Wk 2 | 0.0 | 1 | 0 | 0 | 0 | 0 |
| Efton Chism III@ NE • Wk 6 | 0.0 | 1 | 0 | 0 | 0 | 0 |
| Kevin Coleman Jr.vs MIA • Wk 7 | 0.0 | 1 | 0 | 0 | 0 | 0 |
| Tre Tuckervs LV • Wk 8 | 0.0 | 1 | 0 | 0 | 0 | 0 |
| Cyrus Allen@ KC • Wk 9 | 0.0 | 1 | 0 | 0 | 0 | 0 |
| Greg Dortchvs BUF • Wk 10 | 0.0 | 1 | 0 | 0 | 0 | 0 |
Fantasy points first, then the stats that matter for his position. Ring around each photo is that player's Mania Rating. Tap a name to open his profile.
Usage
Snaps
54%
Target share
14%
Targets/G
4.8
PPR/G
4.5
By the numbers
PPR / Game
4.5
27th percentileWR avg 8.4
Targets / Game
4.8
57th percentileWR avg 4.9
Receiving Yards / Game
30.4
42nd percentileWR avg 39.4
Receptions / Game
2.2
42nd percentileWR avg 3
Share of Team Targets
14.2%
51st percentileWR avg 15.6%
Share of Team Air Yards
22.6%
55th percentileWR avg 22.2%
Red-Zone Targets / Game
0.7
62nd percentileWR avg 0.7
End-Zone Targets / Game
0.4
56th percentileWR avg 0.4
Snap Share
53.7%
32nd percentileWR avg 63.2%
TDs / Game
0
26th percentileWR avg 0.2