

Myles Price
Pick a teammate with or without. Pick more than one to combine them, like a game without the QB and without the other back.
Teammate injuries shift his Week 11 Rating3 teammate notes ▾
 MIN
 SF
How this is built
33.8 PPR points a game allowed to wide receivers, 11th most of 32 defenses.
| Player | PPR | Tgt | Rec | Rec Yd | Rec TD | Rush Yd |
|---|---|---|---|---|---|---|
 George Pickens@ DAL • Wk 10 | 43.5 | 18 | 11 | 145 | 3 | 0 |
 Michael Wilsonvs ARI • Wk 3 | 25.9 | 17 | 11 | 89 | 1 | 0 |
 Jaxon Smith-Njigba@ SEA • Wk 5 | 22.8 | 8 | 5 | 102 | 1 | 16 |
 CeeDee Lamb@ DAL • Wk 10 | 20.2 | 13 | 7 | 72 | 1 | 0 |
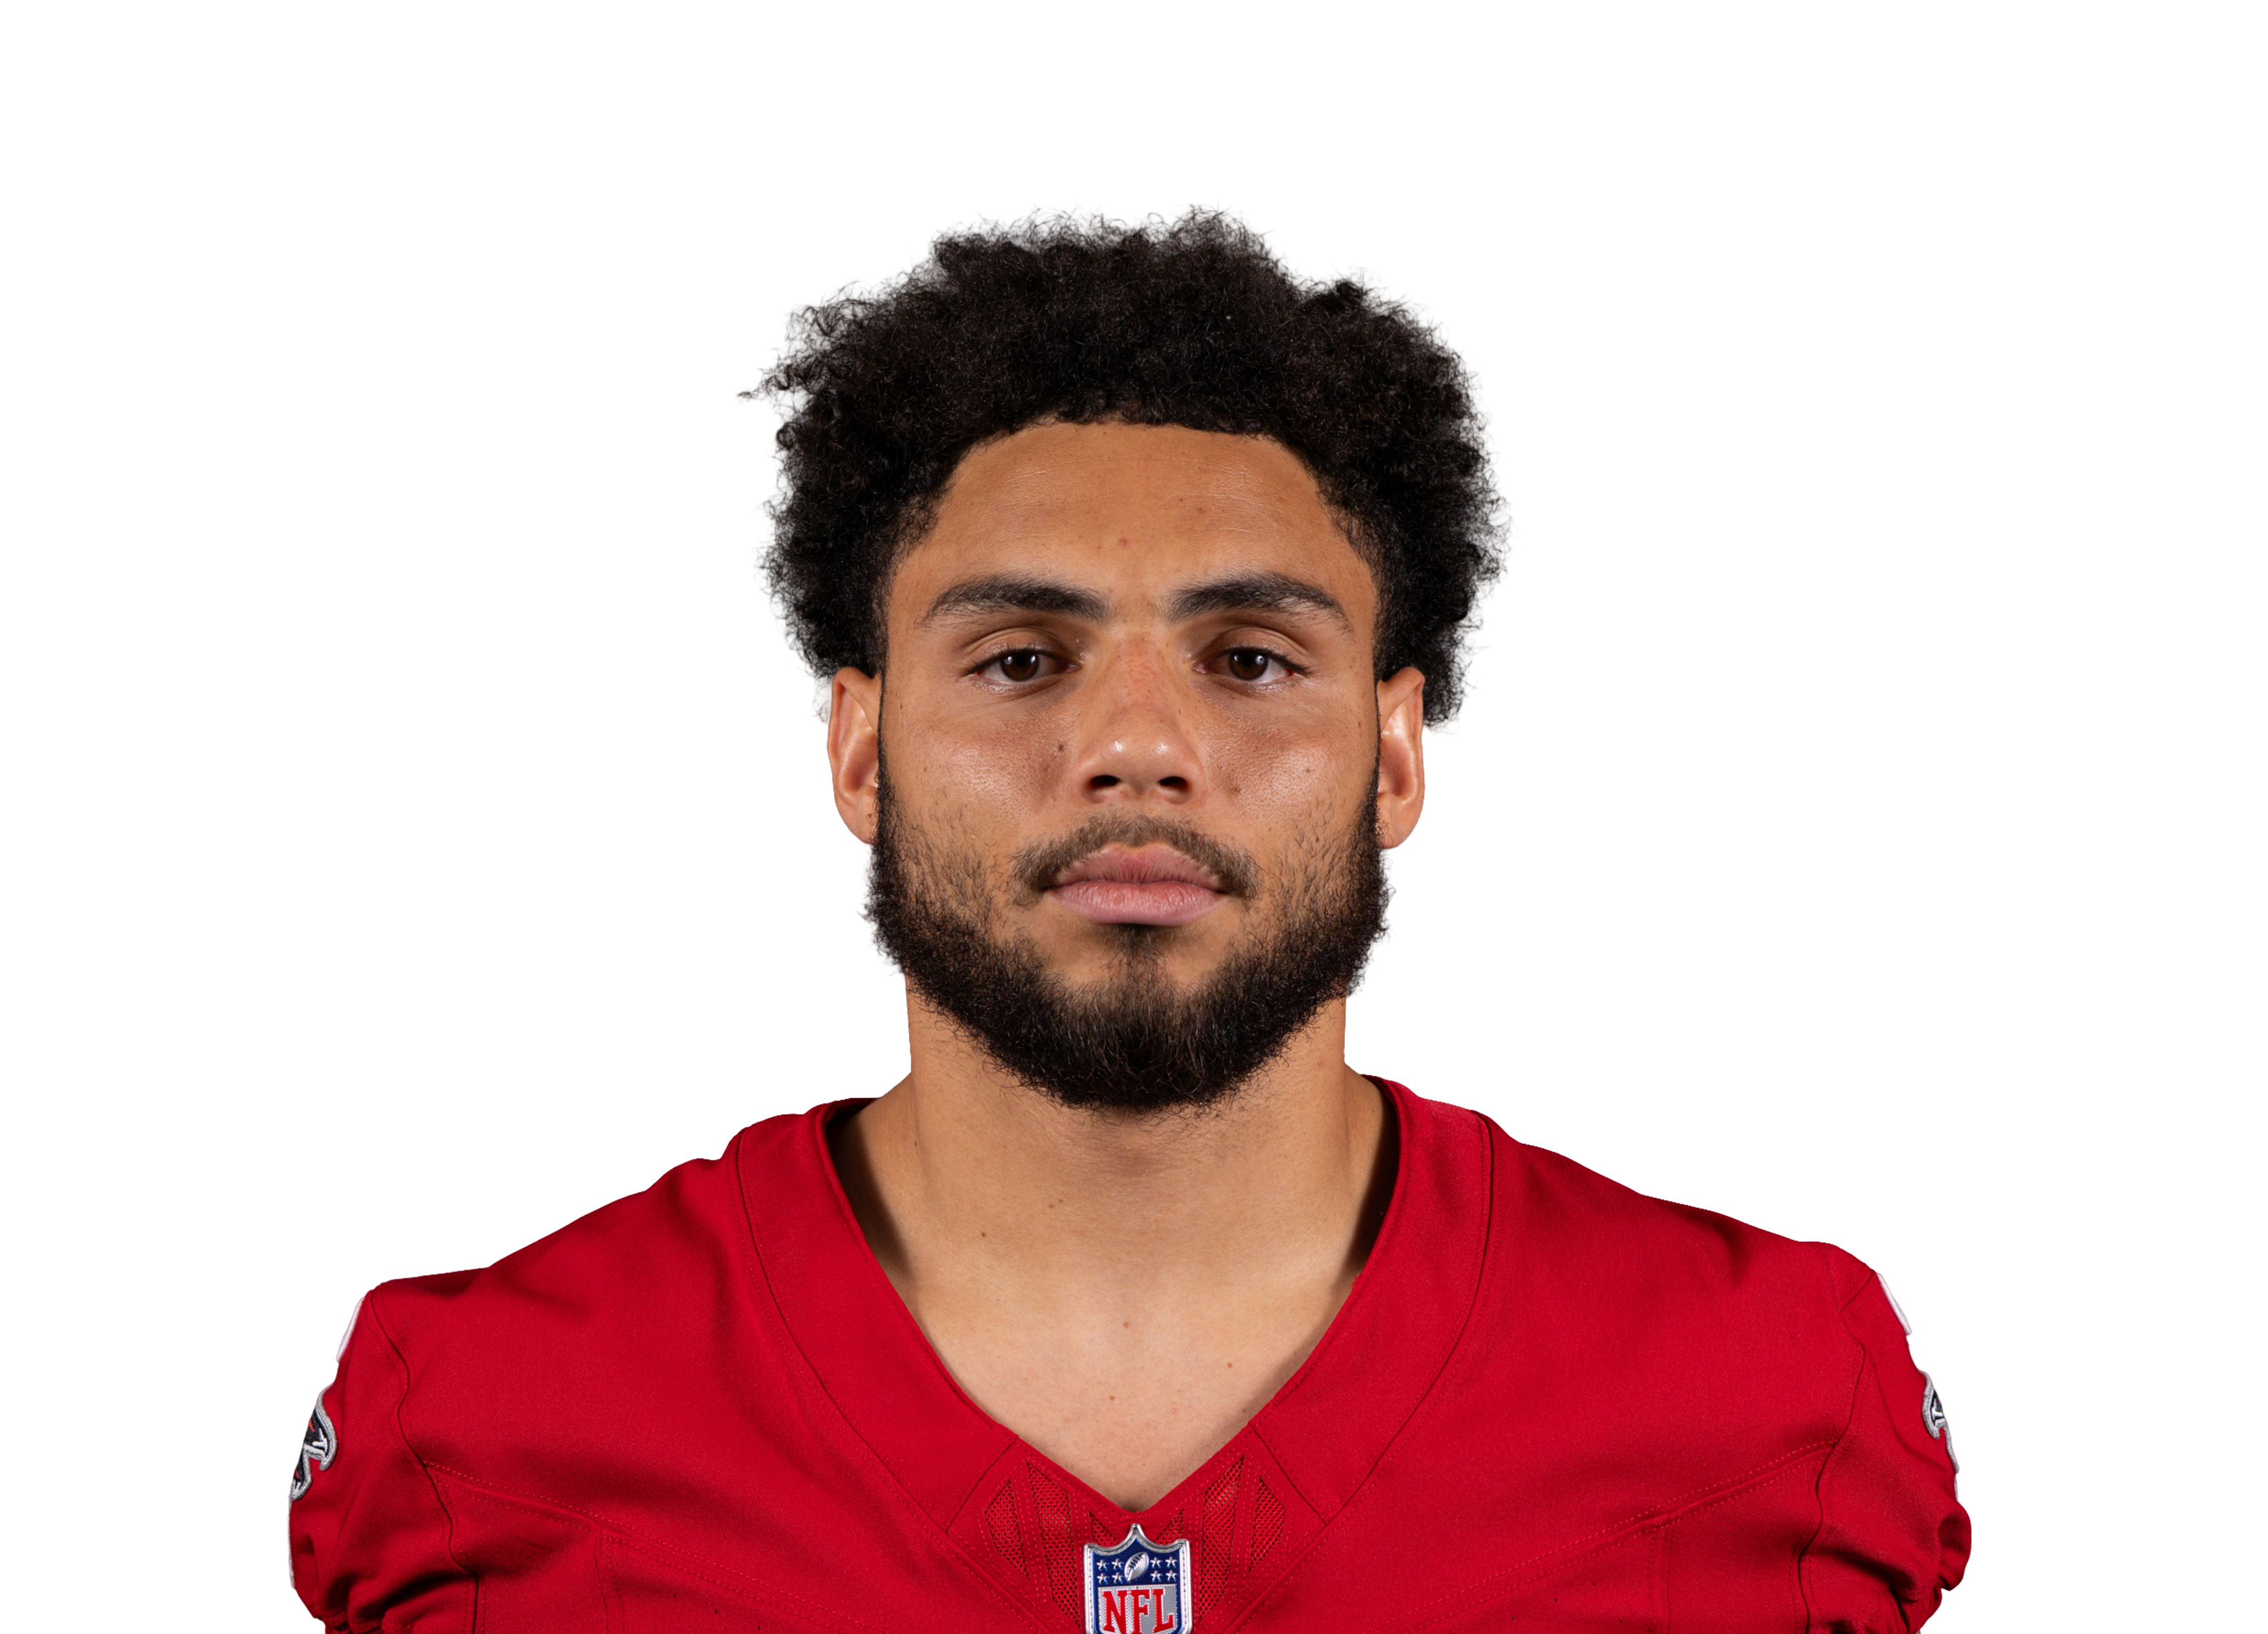 Drake London@ ATL • Wk 7 | 19.6 | 10 | 7 | 66 | 1 | 0 |
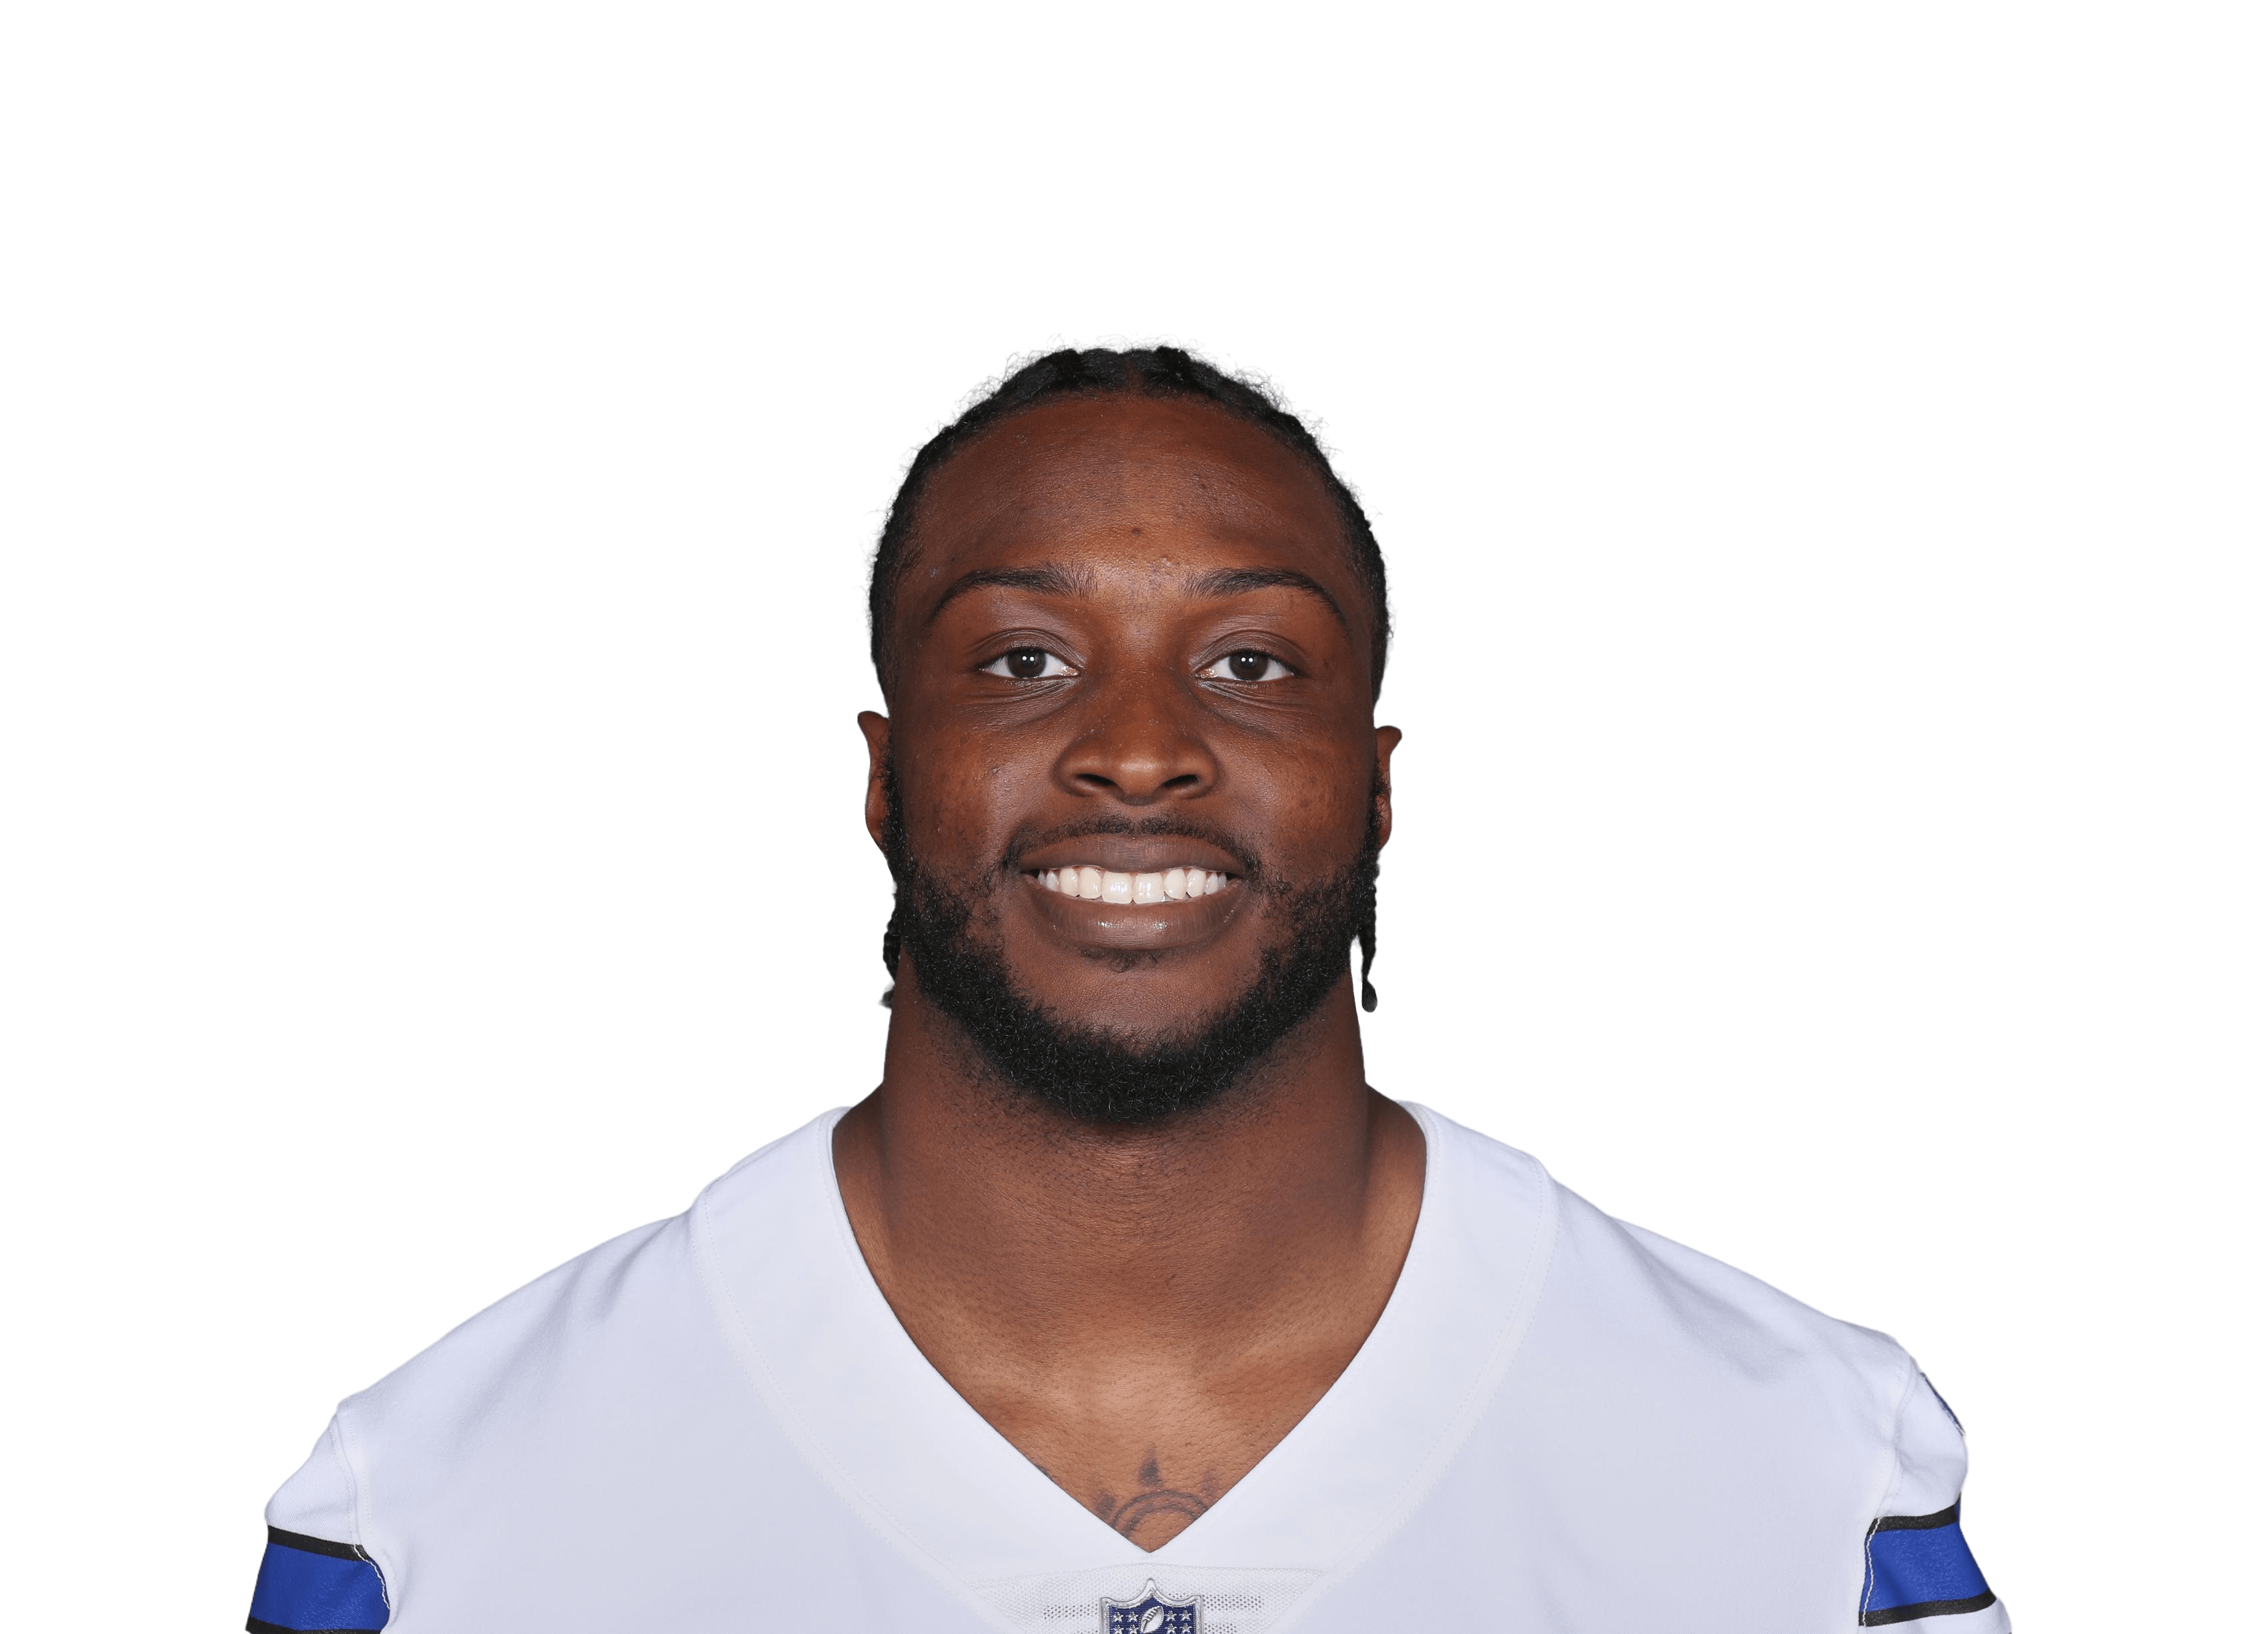 Ryan Flournoy@ DAL • Wk 10 | 19.1 | 7 | 6 | 71 | 1 | 0 |
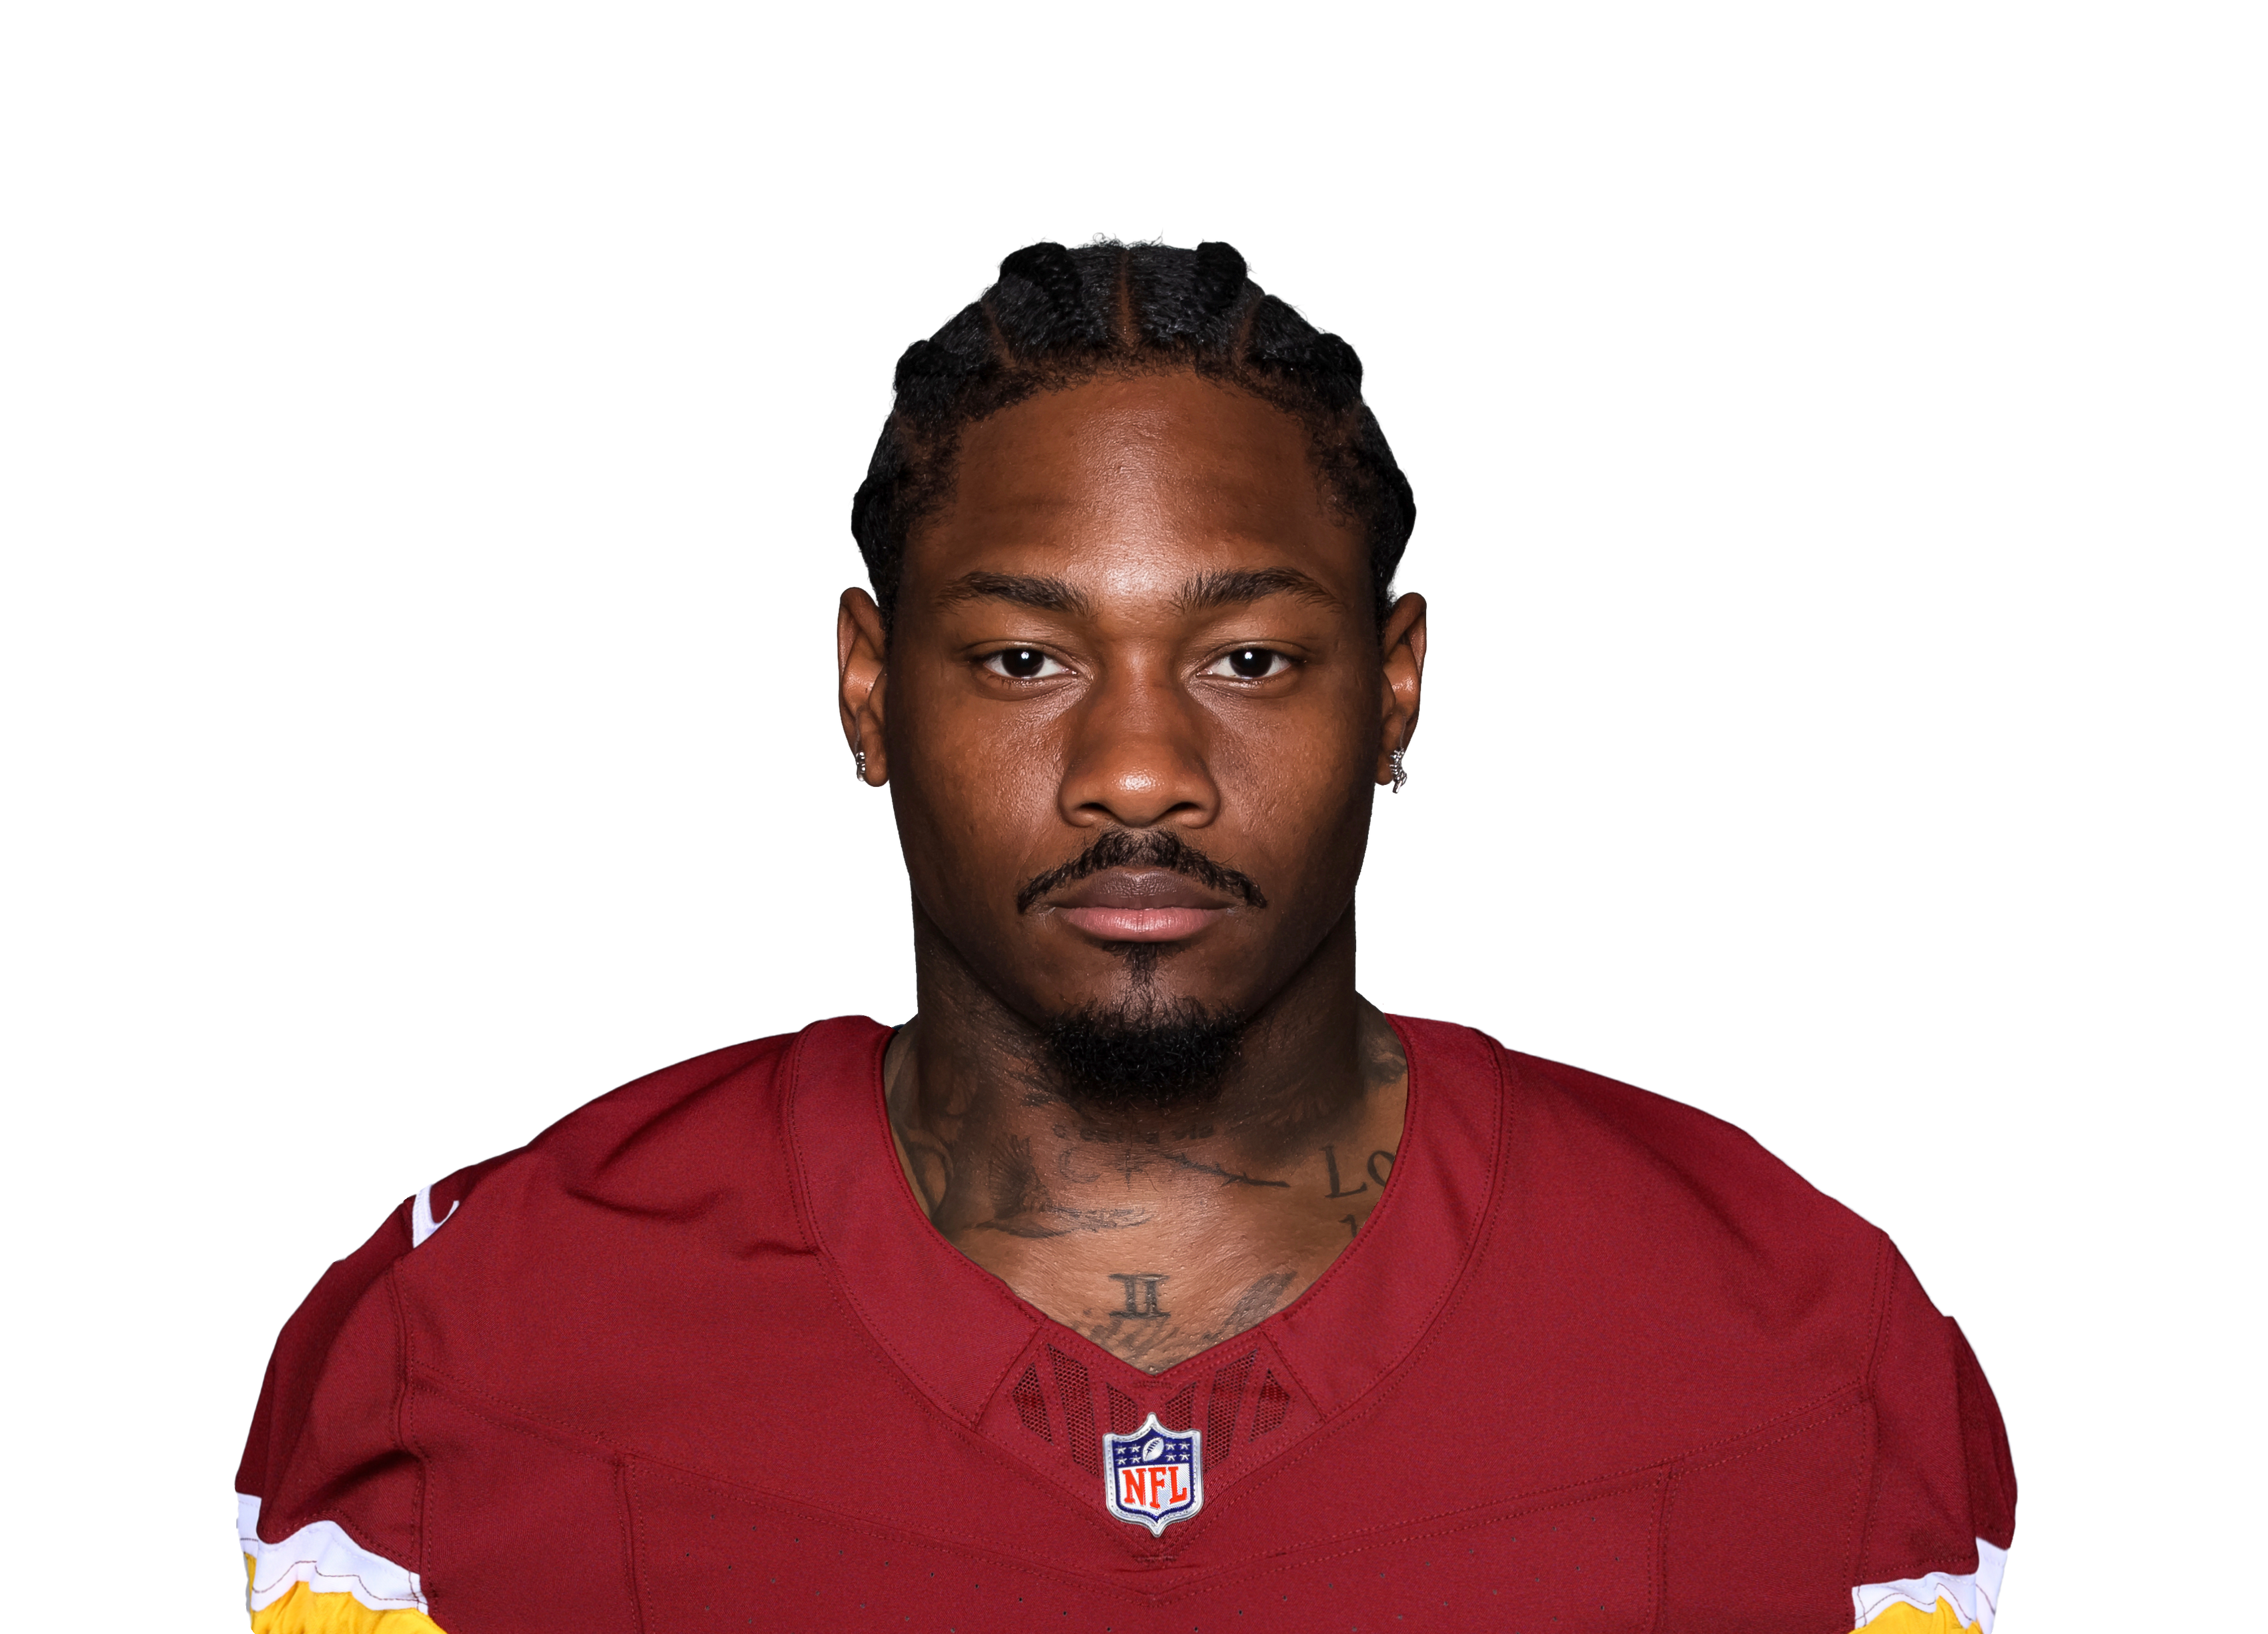 Stefon Diggsvs WAS • Wk 6 | 16.4 | 7 | 6 | 44 | 1 | 0 |
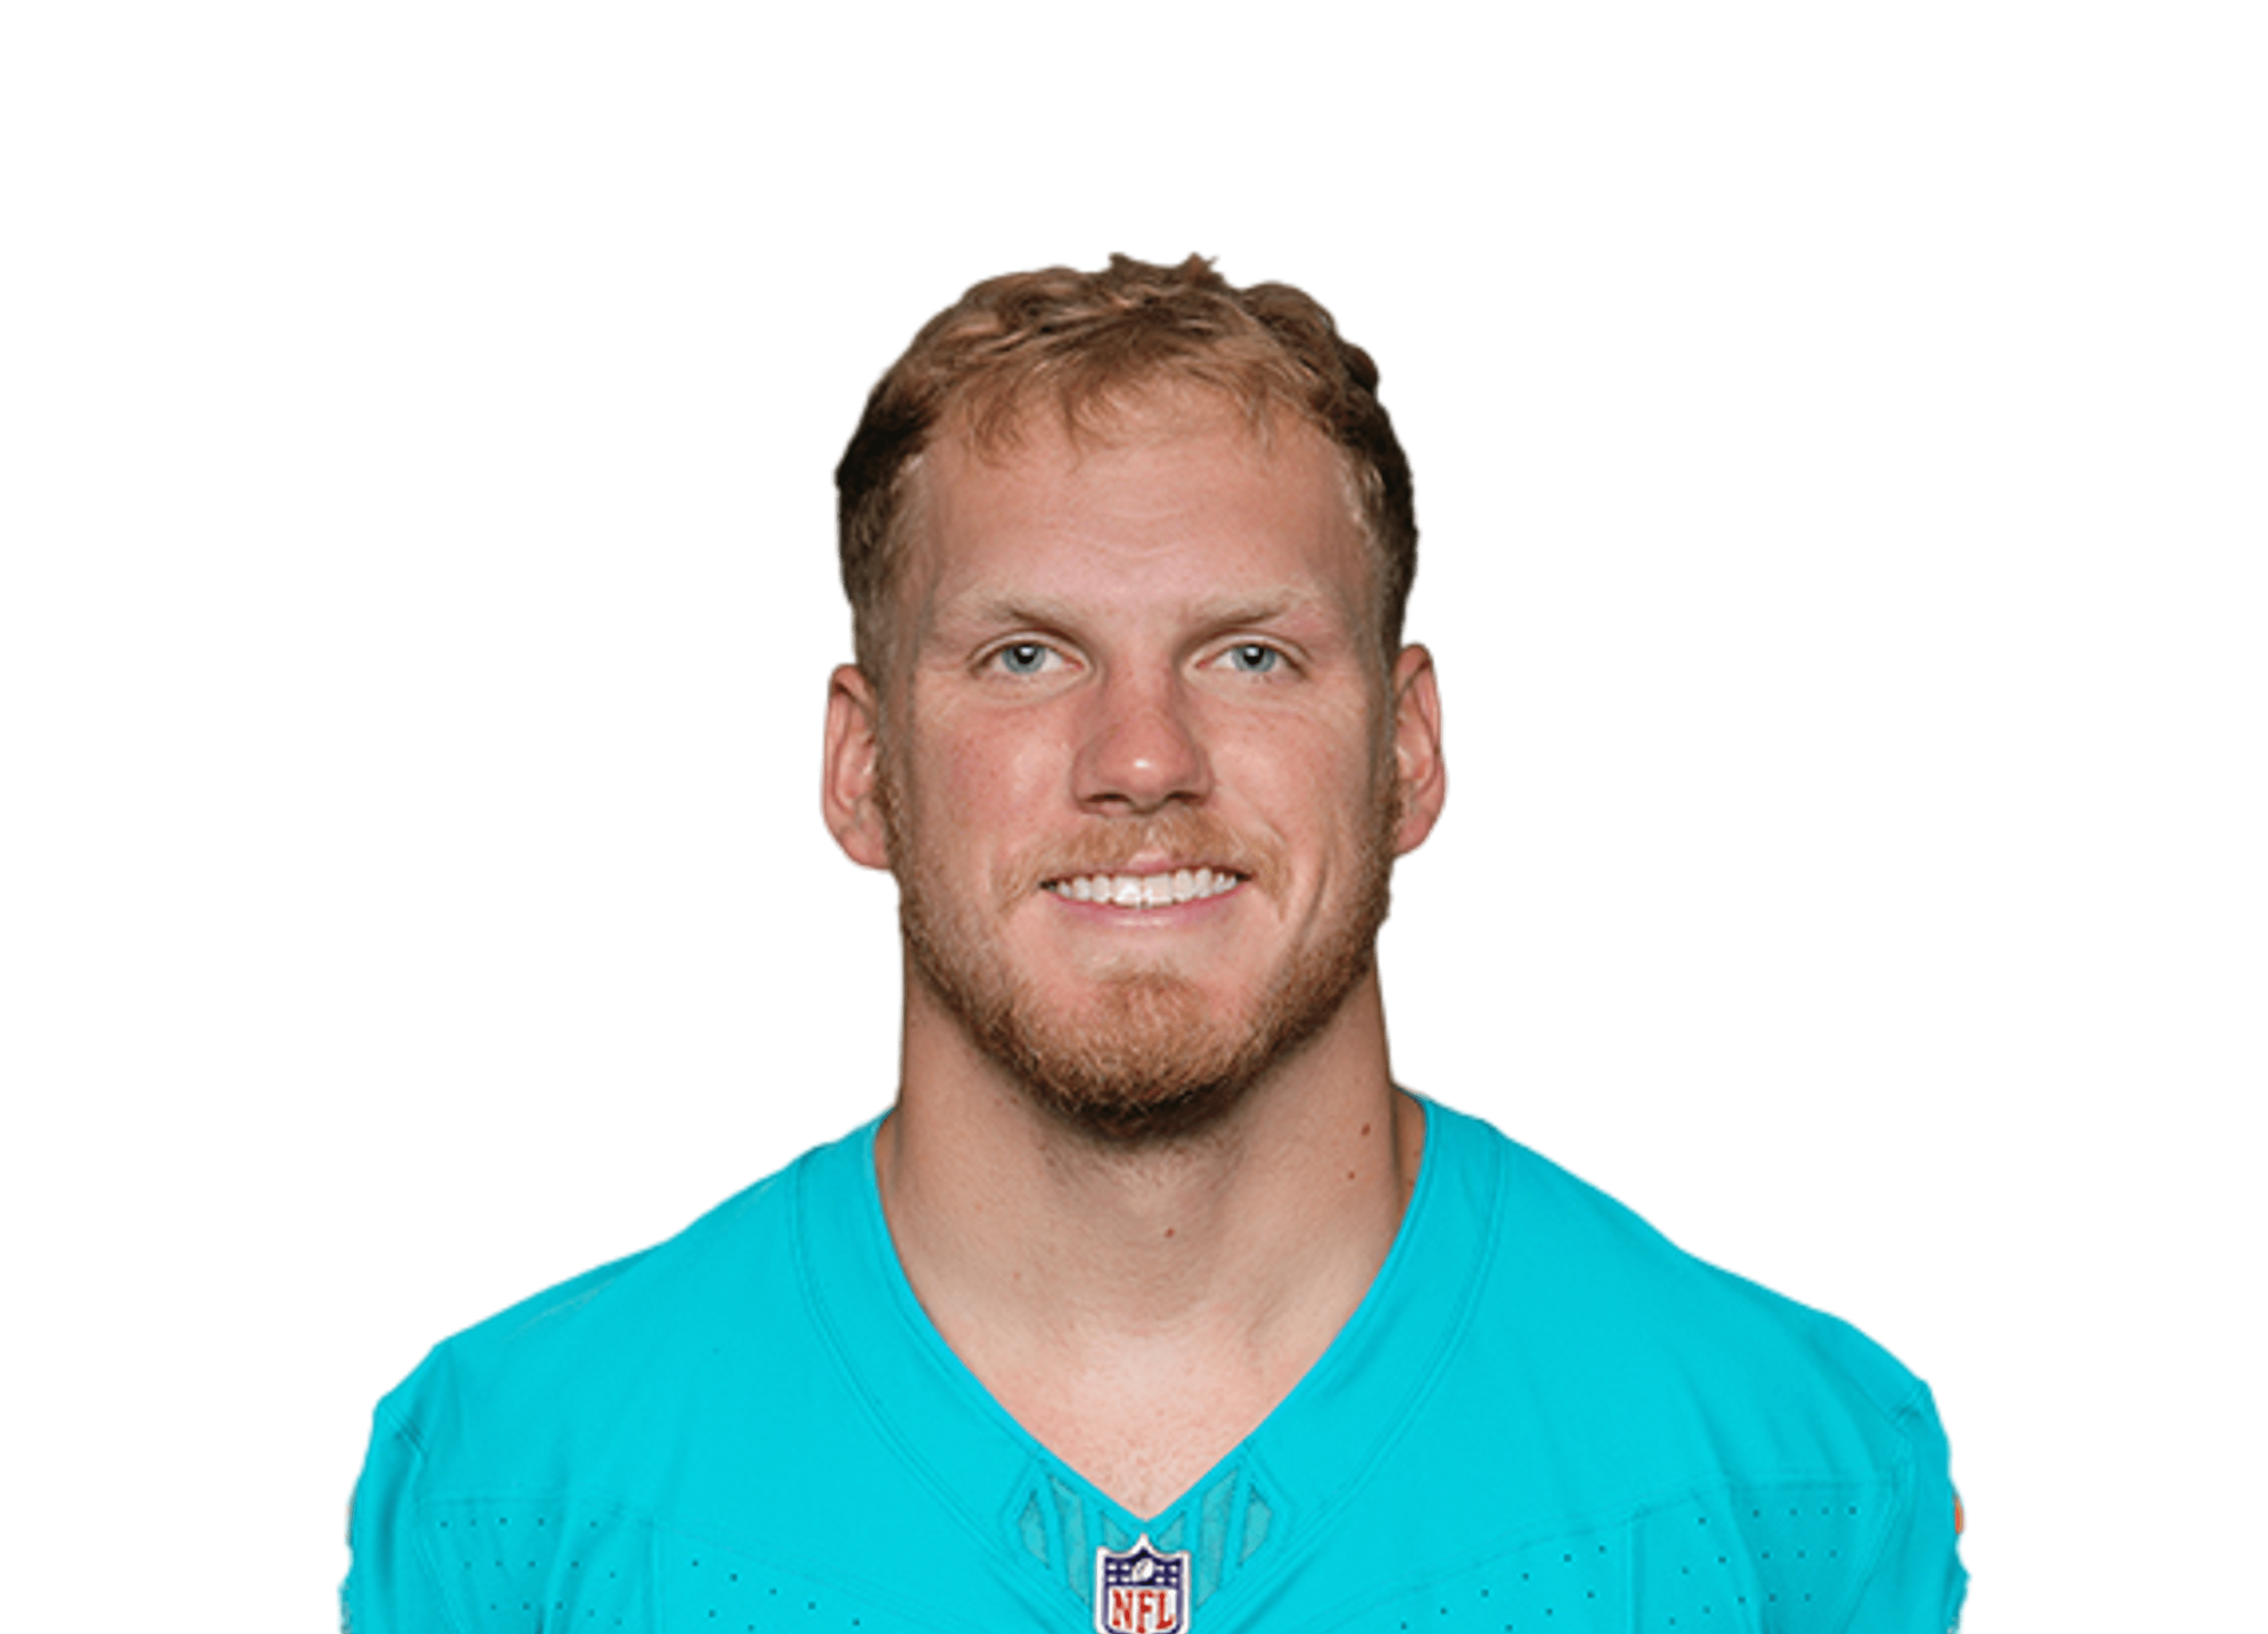 Ryan Millervs MIA • Wk 2 | 14.7 | 1 | 1 | 77 | 1 | 0 |
 Jaylen Waddlevs DEN • Wk 4 | 14.5 | 6 | 5 | 35 | 1 | 0 |
 Puka Nacua@ LA • Wk 1 | 12.4 | 9 | 5 | 74 | 0 | 0 |
 Treylon Burksvs WAS • Wk 6 | 10.6 | 6 | 4 | 66 | 0 | 0 |
 Tre Tuckervs LV • Wk 9 | 9.5 | 8 | 4 | 55 | 0 | 0 |
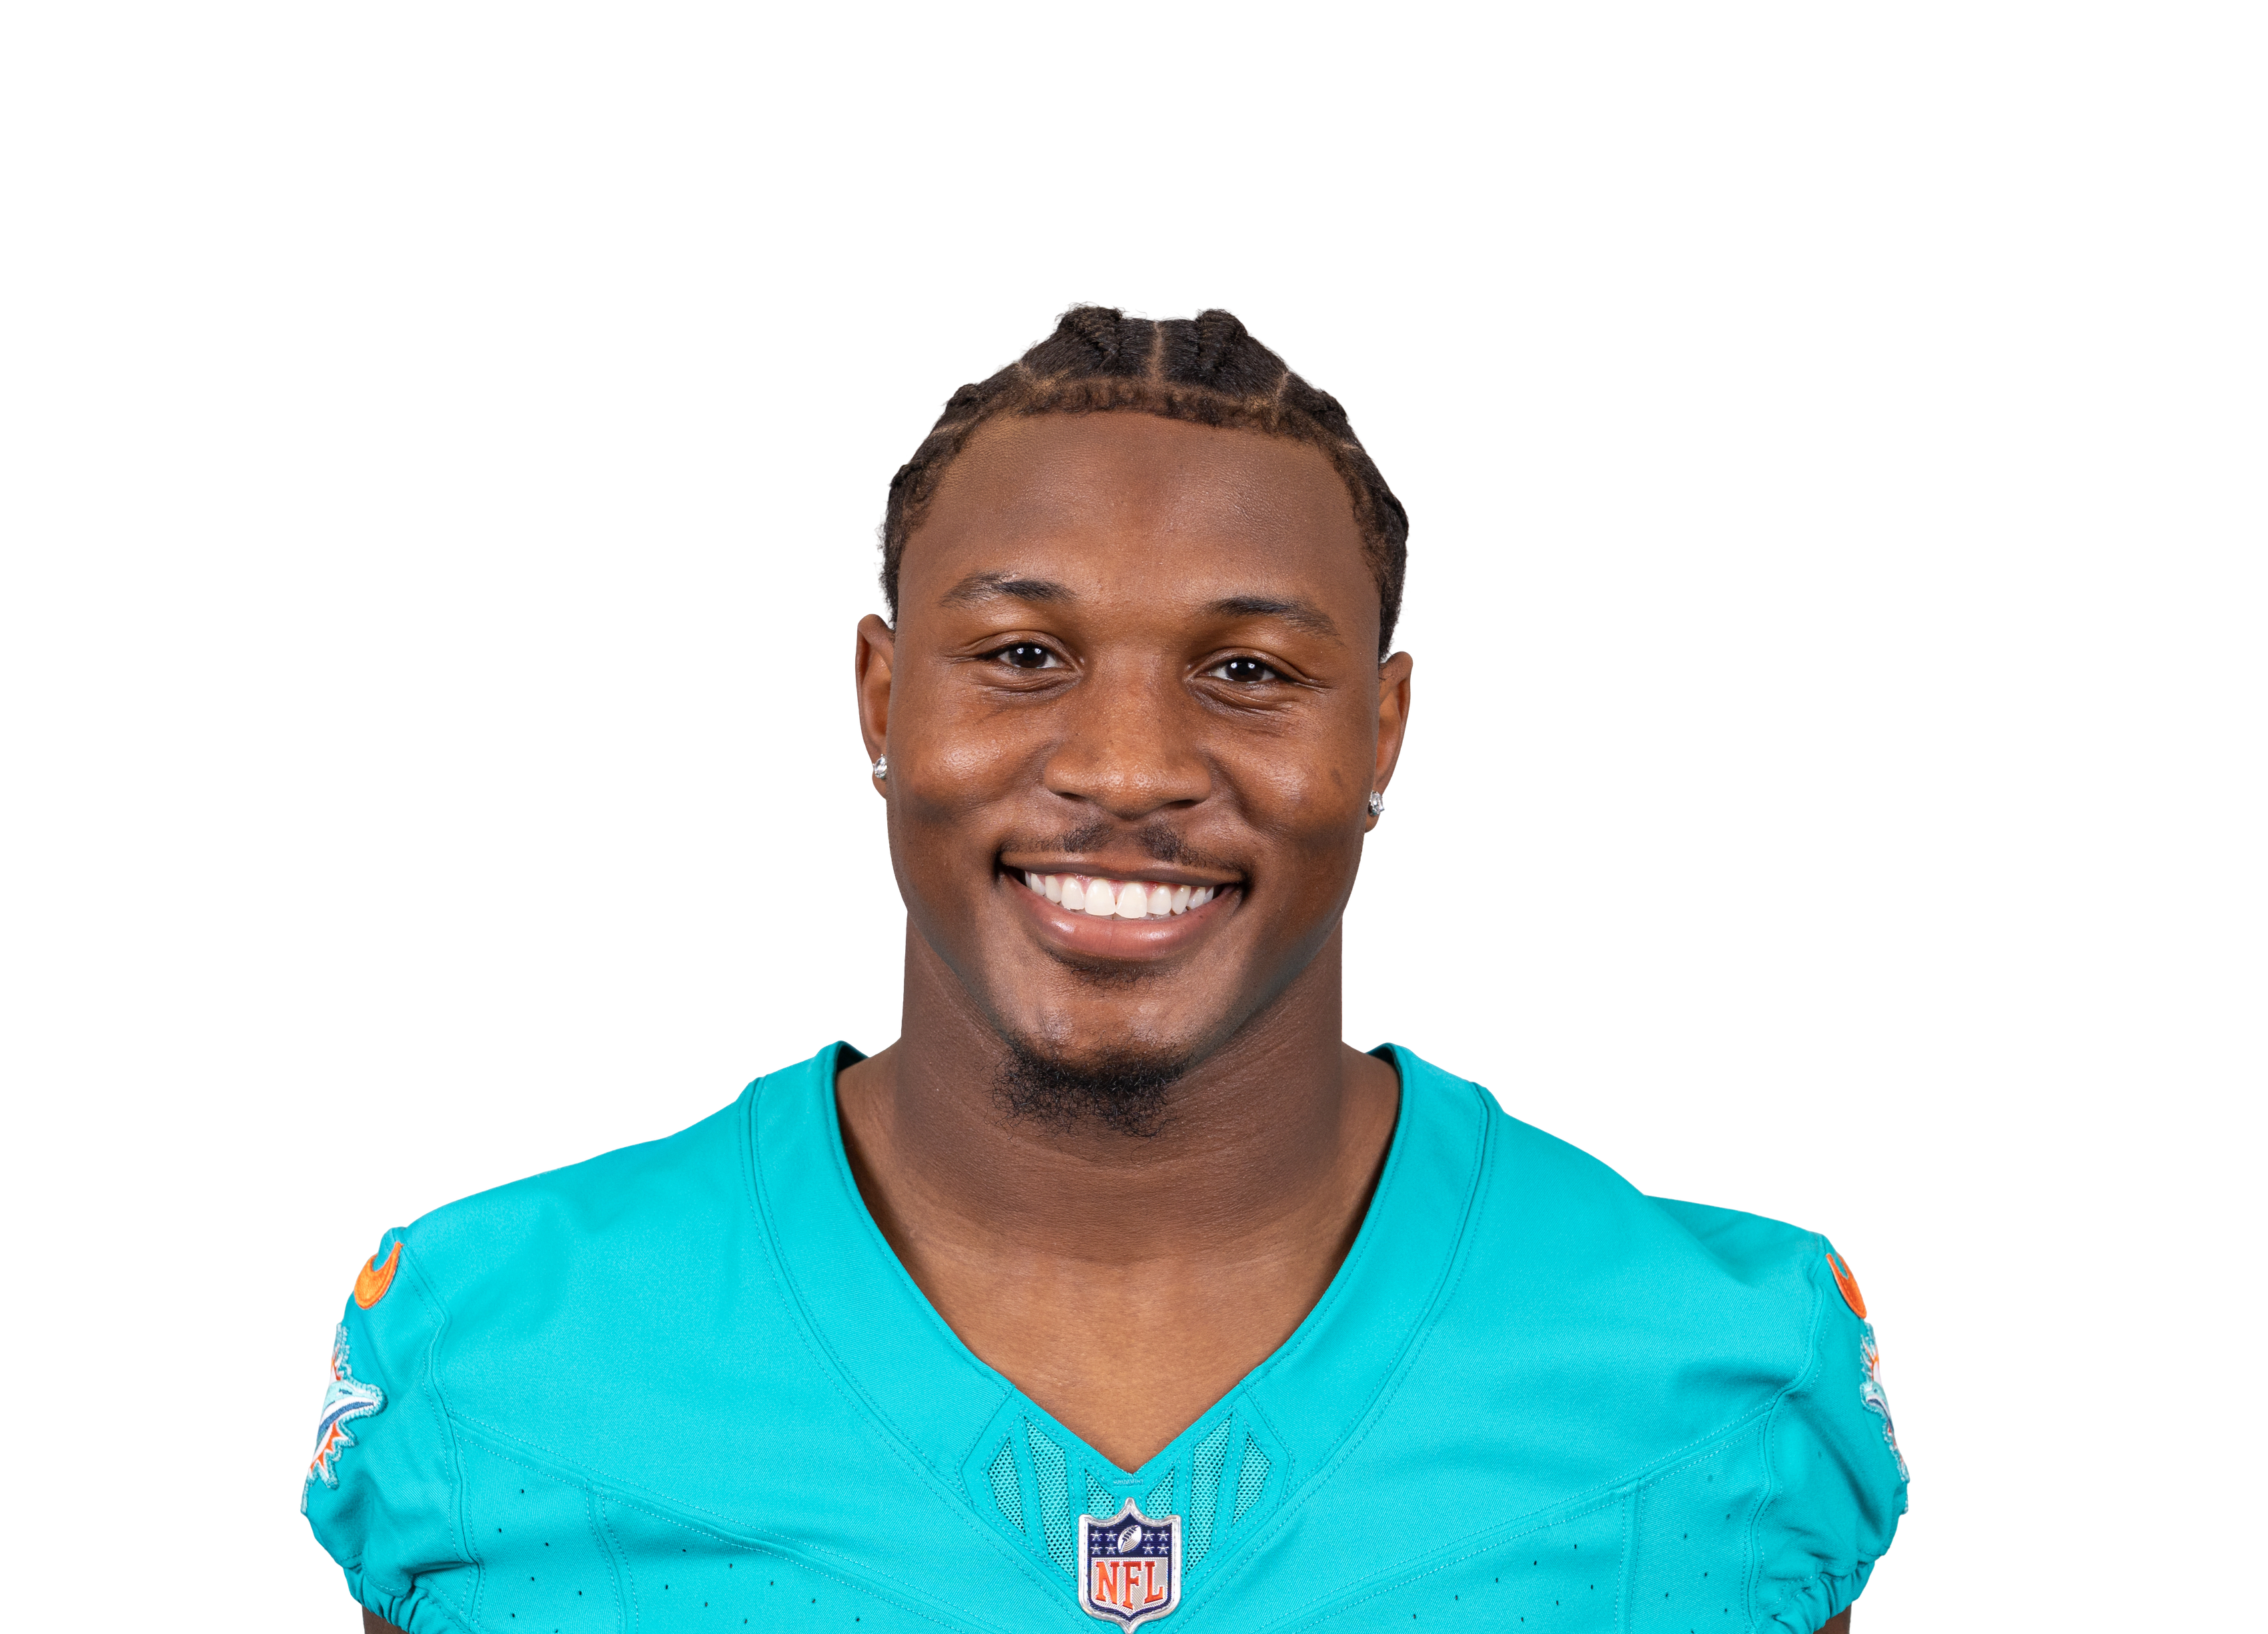 Malik Washingtonvs MIA • Wk 2 | 8.7 | 5 | 4 | 43 | 0 | 4 |
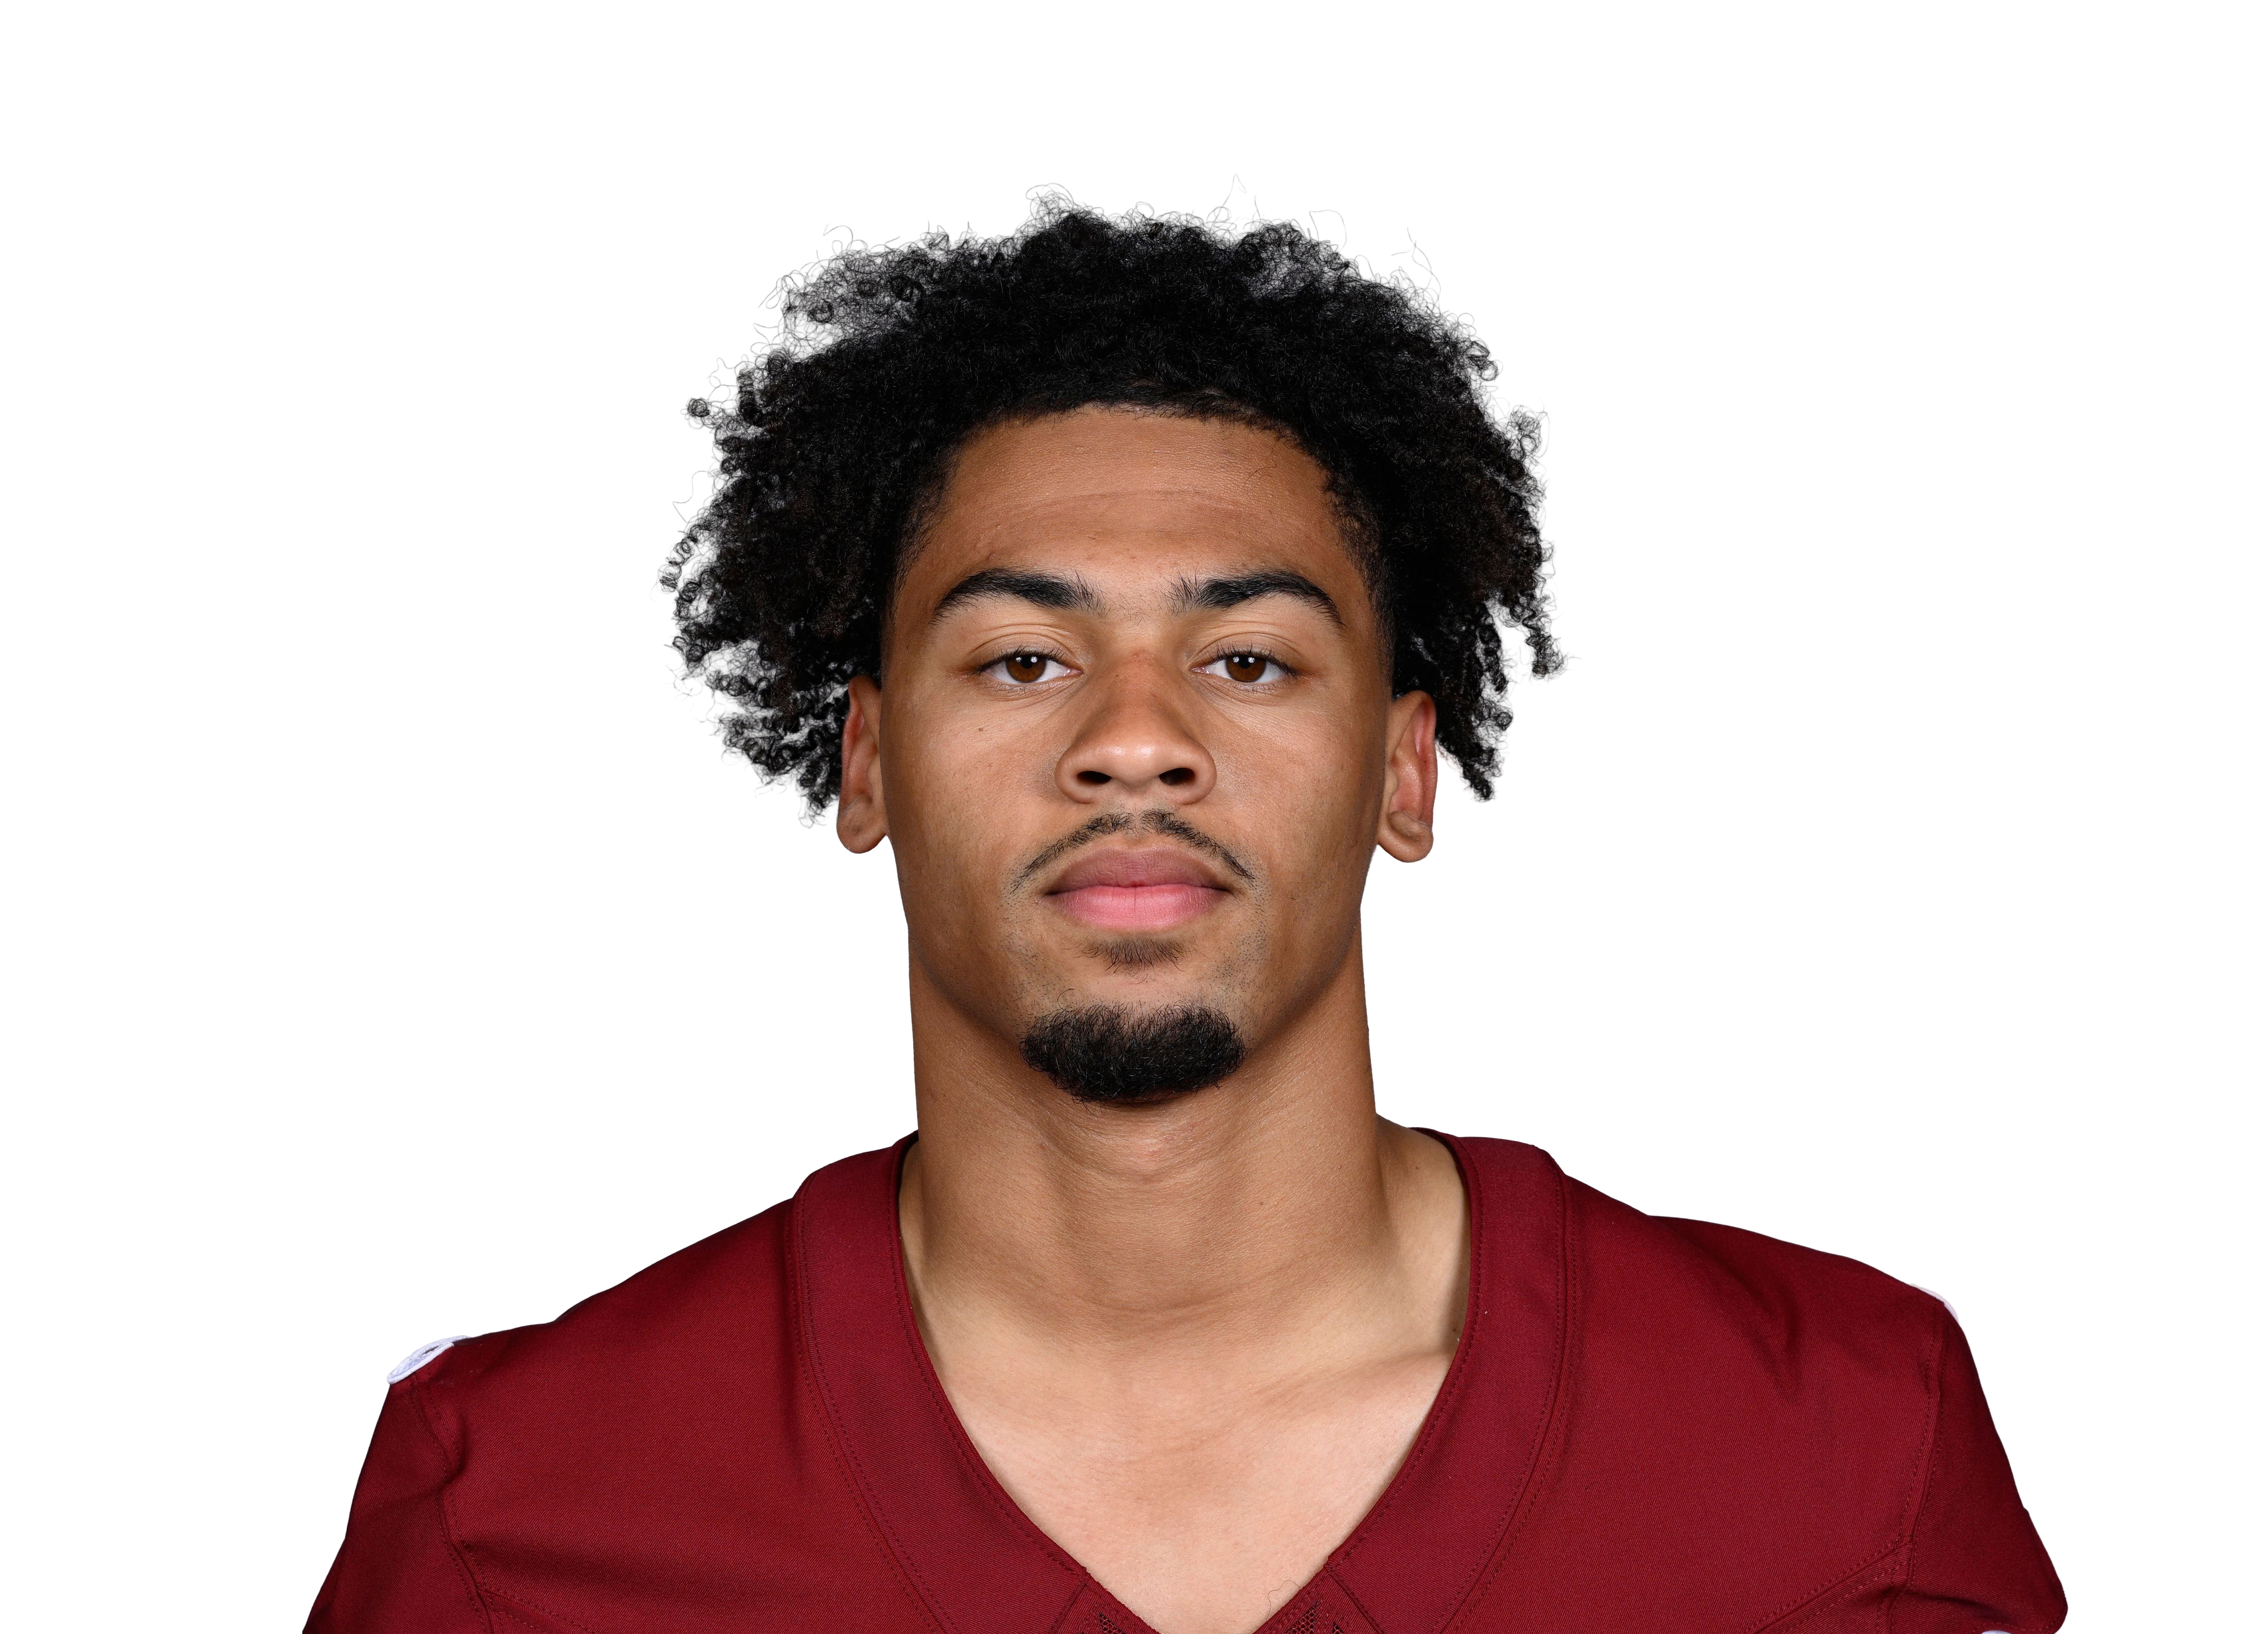 Antonio Williamsvs WAS • Wk 6 | 8.0 | 4 | 3 | 50 | 0 | 0 |
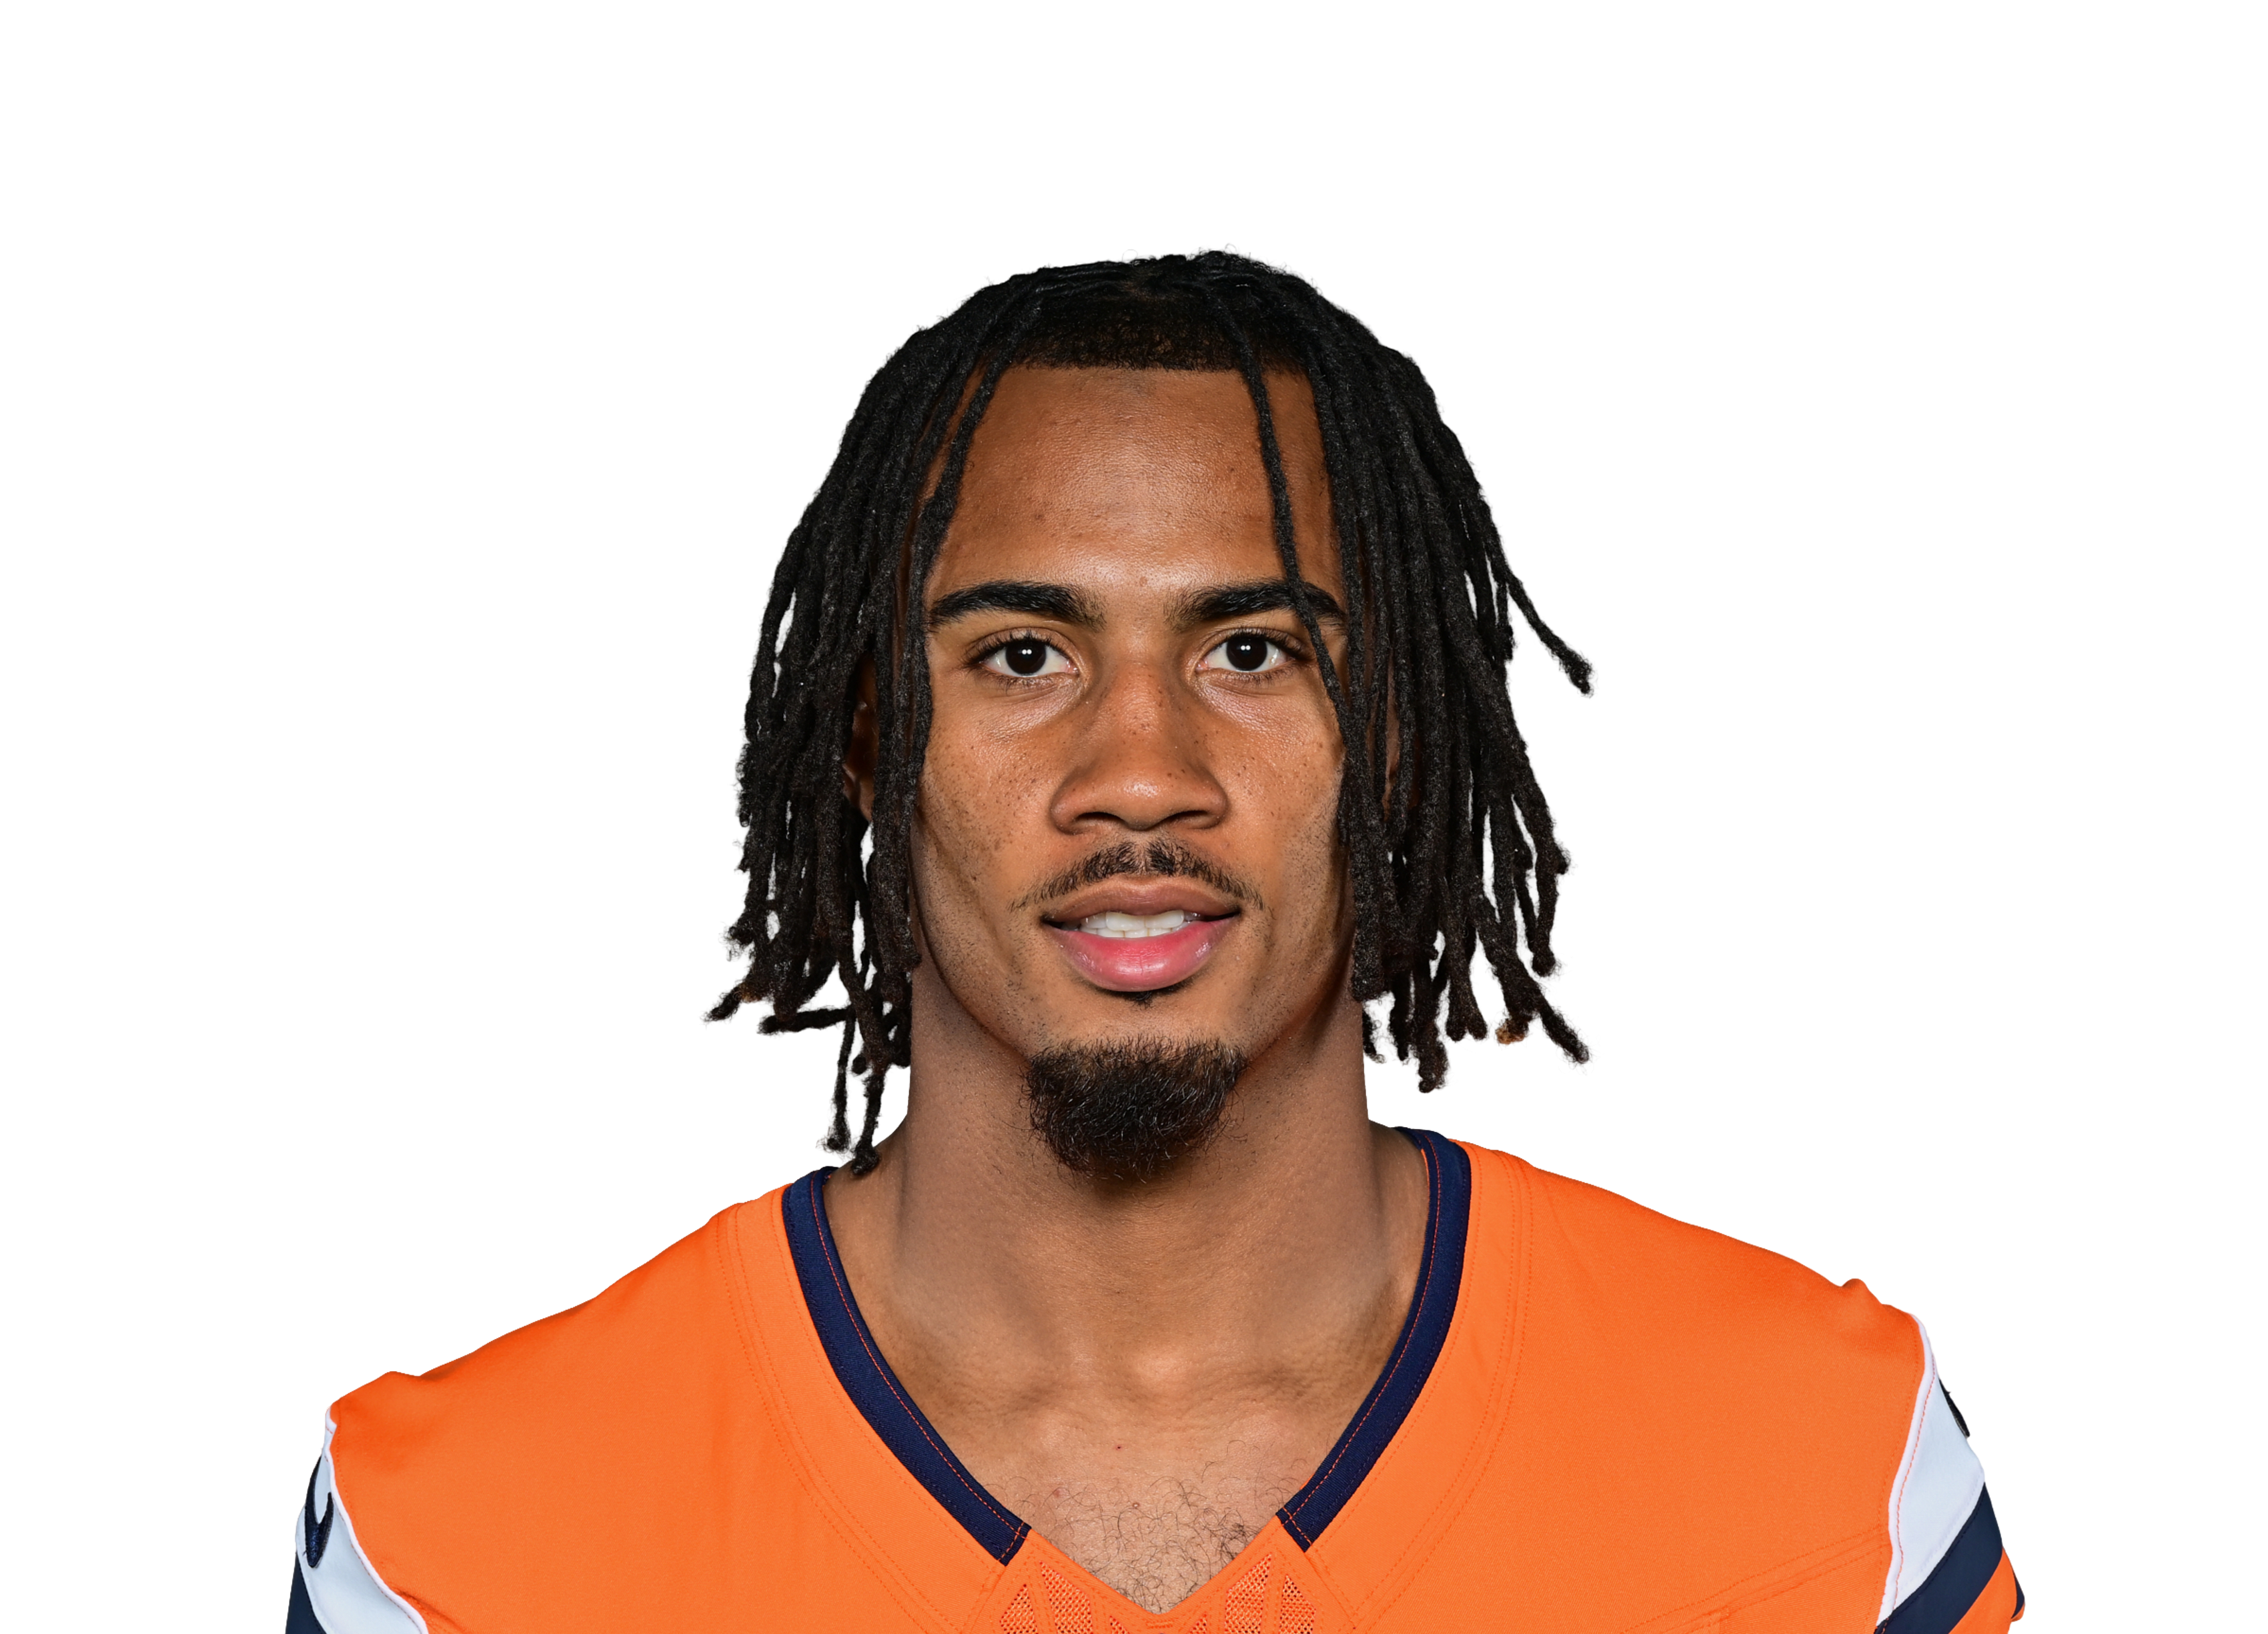 Pat Bryantvs DEN • Wk 4 | 7.7 | 3 | 3 | 47 | 0 | 0 |
 Marvin Harrison Jr.vs ARI • Wk 3 | 7.0 | 5 | 3 | 40 | 0 | 0 |
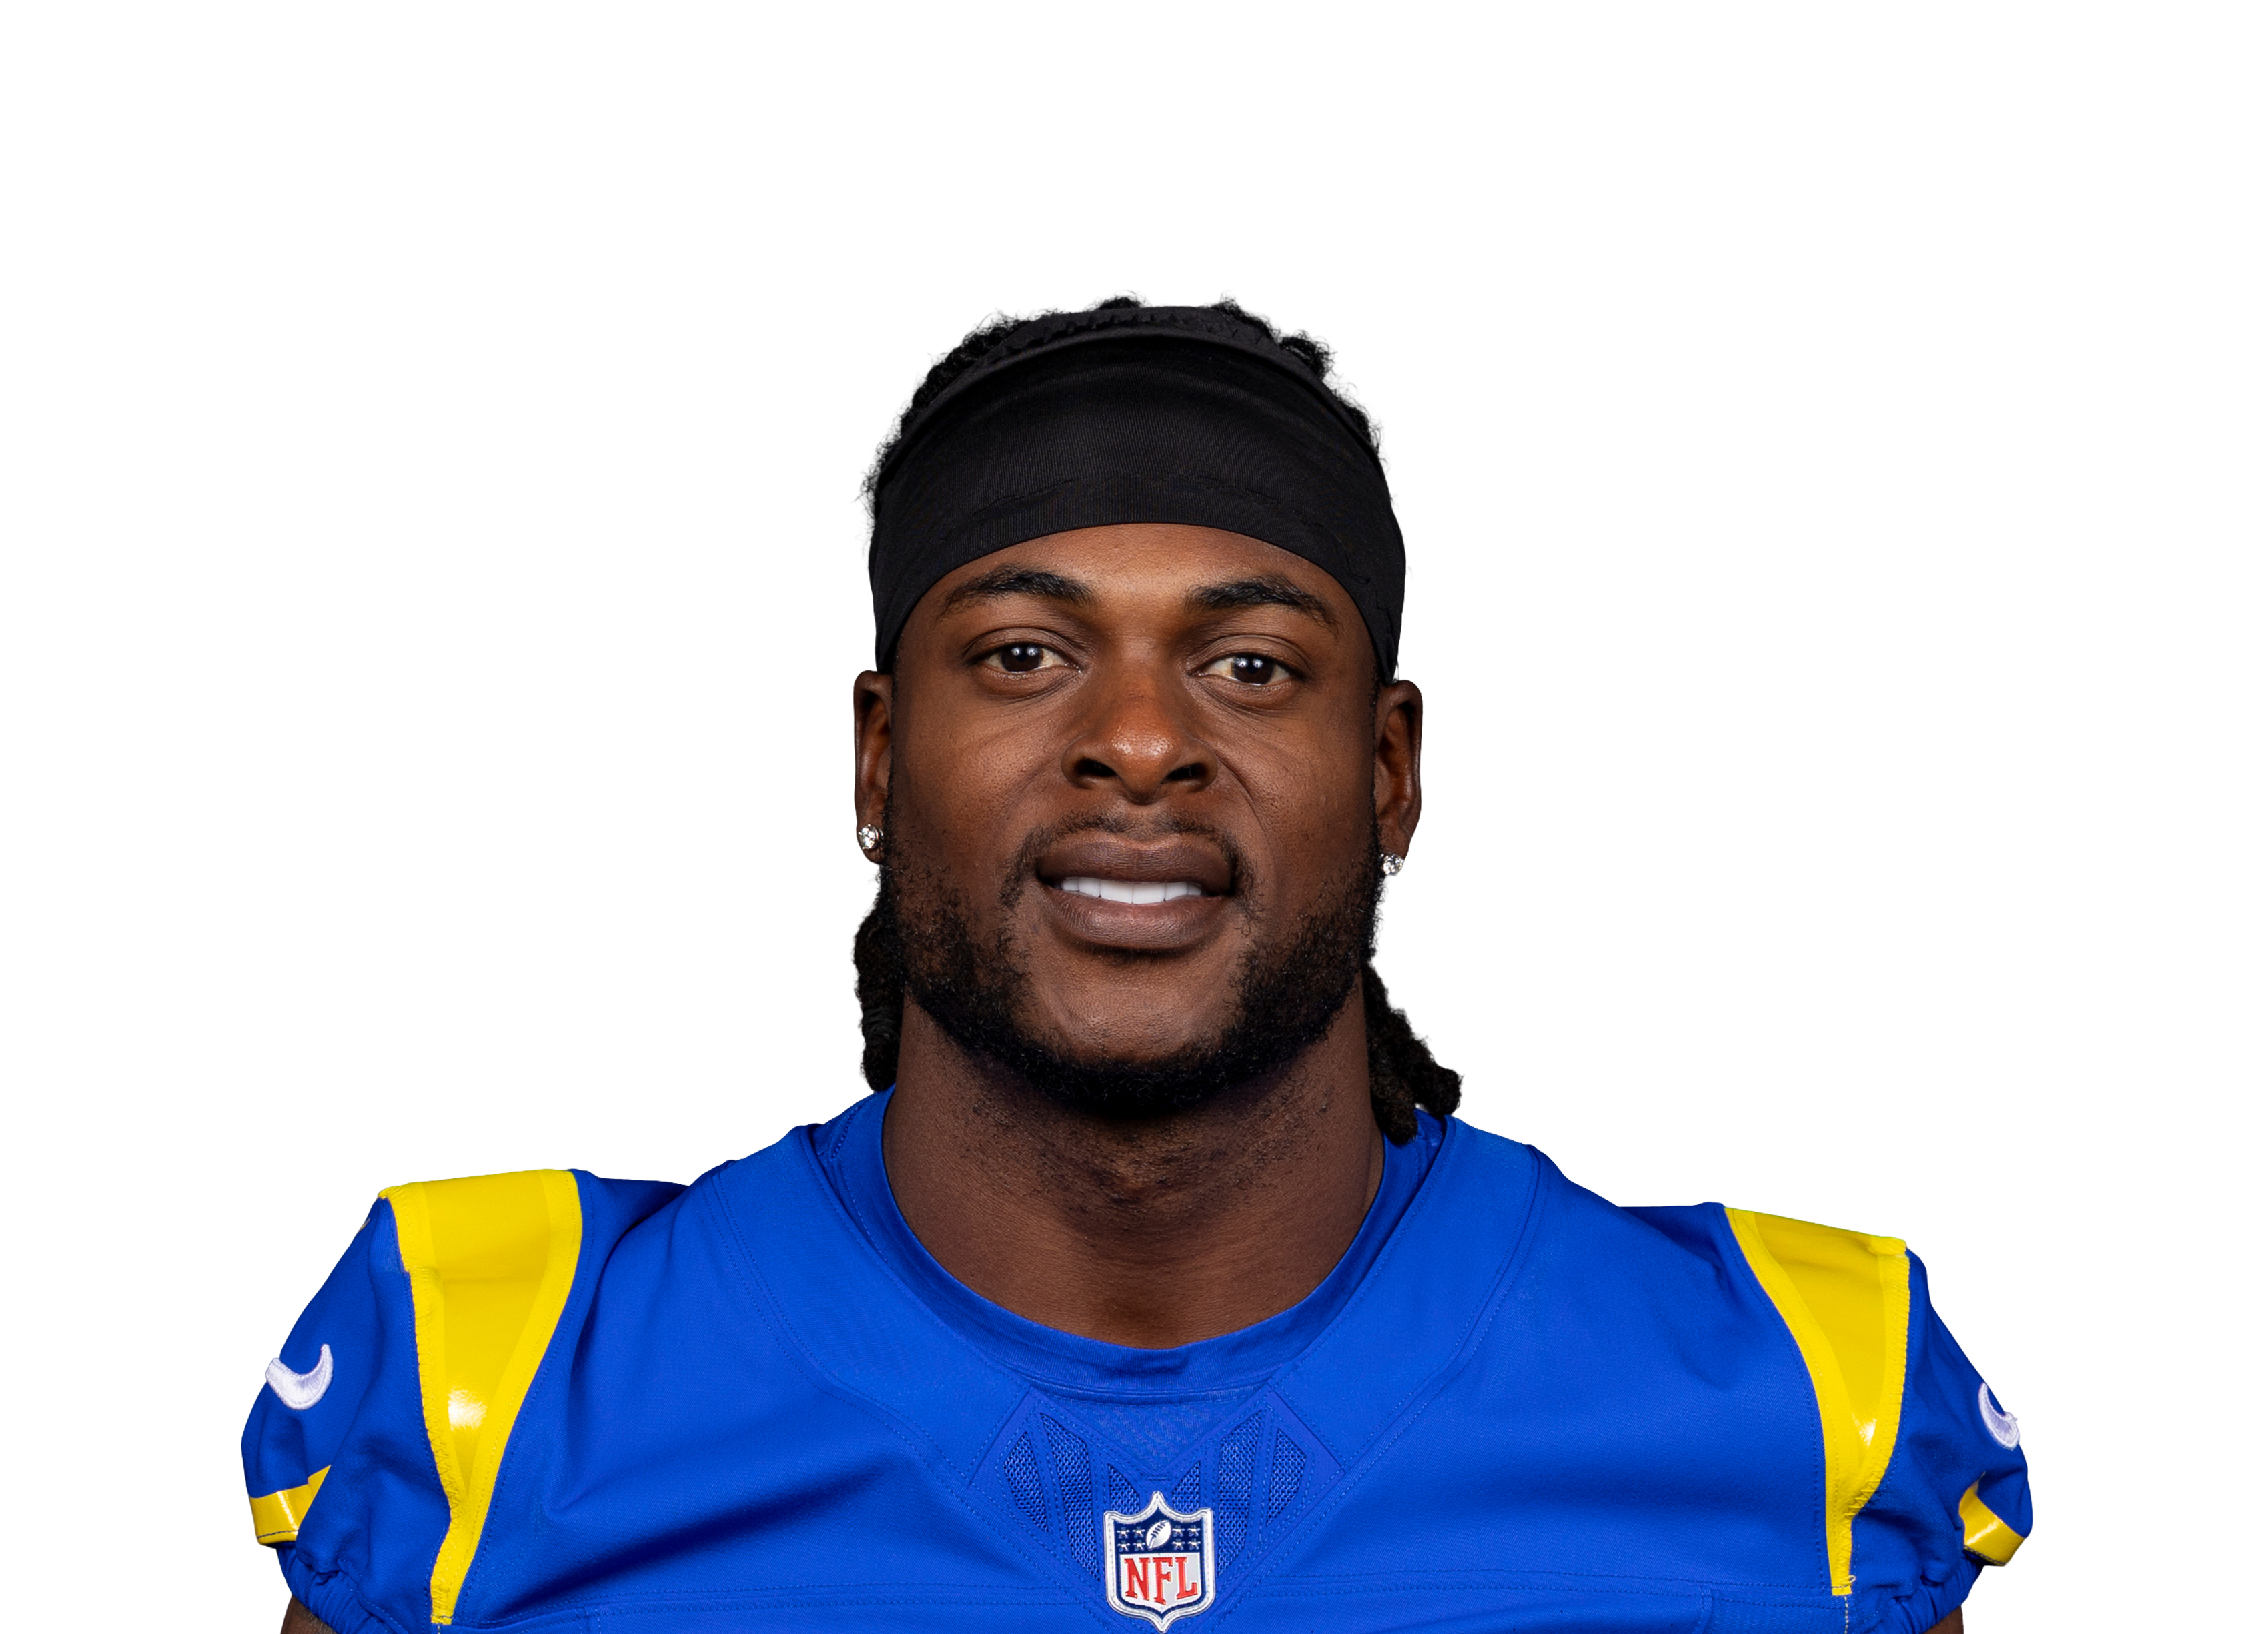 Davante Adams@ LA • Wk 1 | 5.6 | 6 | 3 | 26 | 0 | 0 |
 Rashid Shaheed@ SEA • Wk 5 | 4.3 | 4 | 2 | 23 | 0 | 0 |
 Kendrick Bournevs ARI • Wk 3 | 4.2 | 3 | 2 | 22 | 0 | 0 |
 Caleb Douglasvs MIA • Wk 2 | 3.9 | 3 | 2 | 19 | 0 | 0 |
 Terry McLaurinvs WAS • Wk 6 | 3.7 | 1 | 1 | 27 | 0 | 0 |
 Cooper Kupp@ SEA • Wk 5 | 3.5 | 3 | 2 | 15 | 0 | 0 |
 Jalen Nailorvs LV • Wk 9 | 2.9 | 4 | 2 | 9 | 0 | 0 |
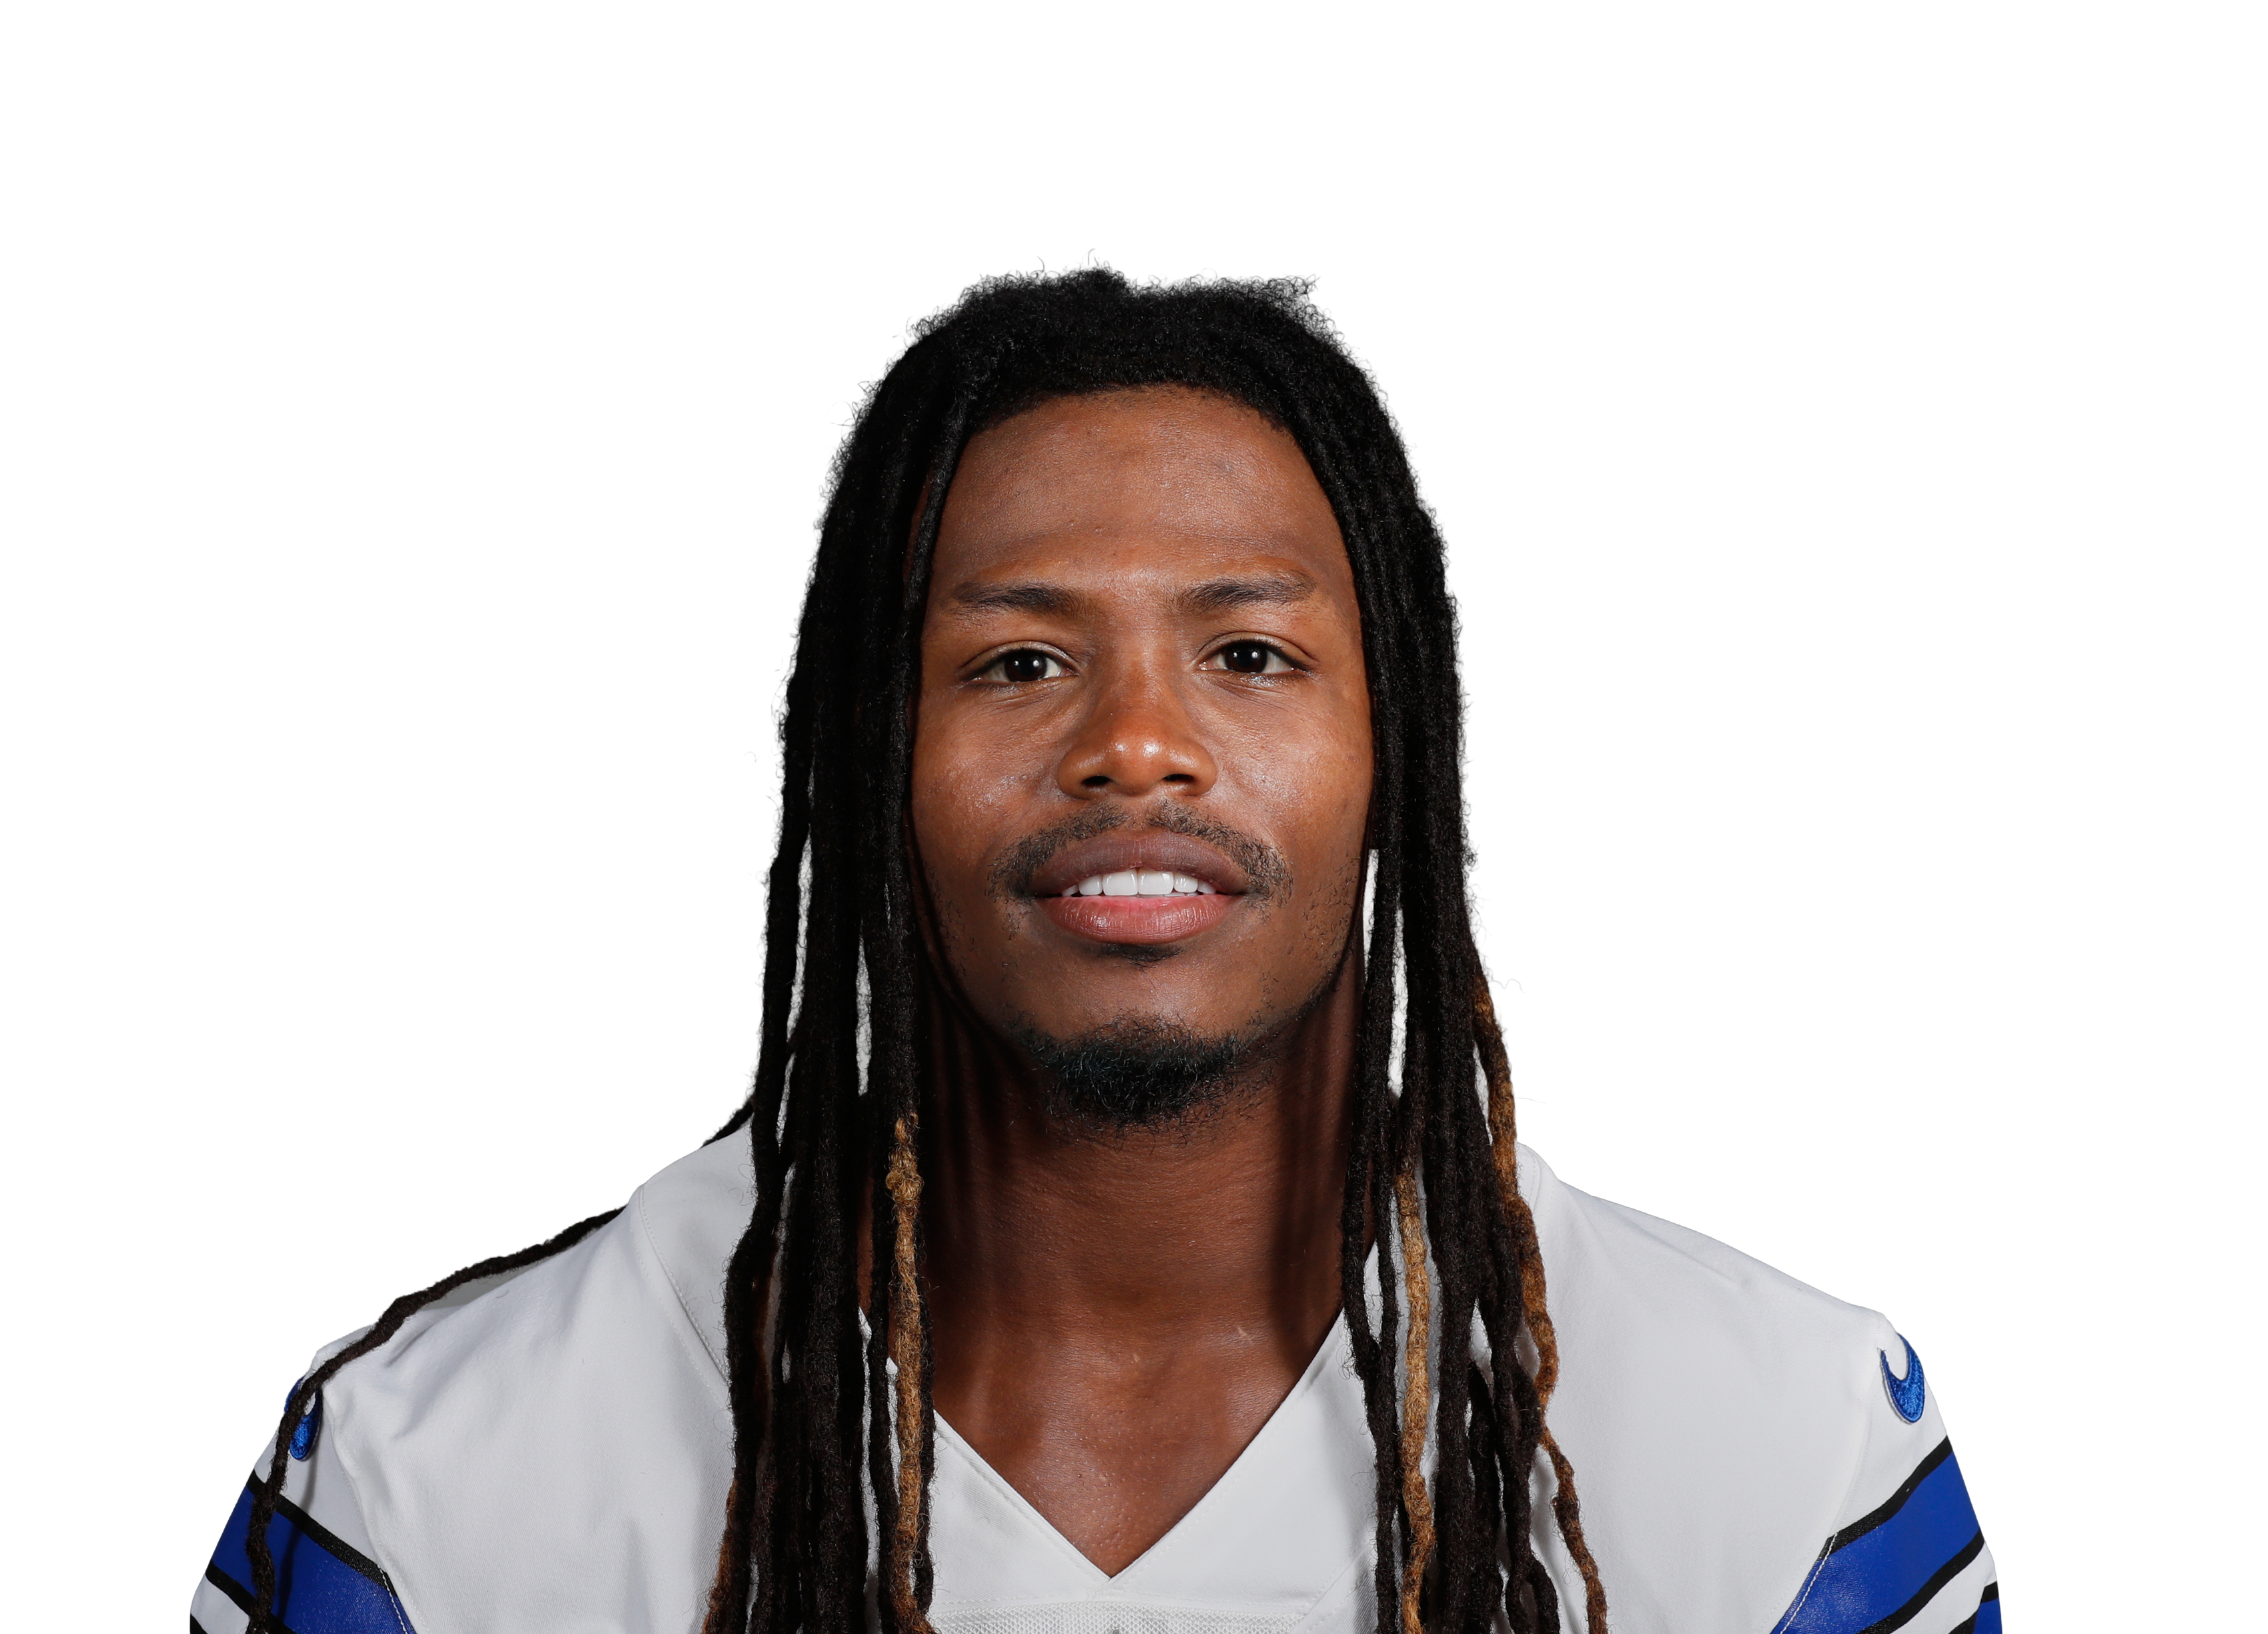 KaVontae Turpin@ DAL • Wk 10 | 2.9 | 3 | 1 | 10 | 0 | 9 |
 Zachariah Branch@ ATL • Wk 7 | 2.7 | 2 | 1 | 9 | 0 | 8 |
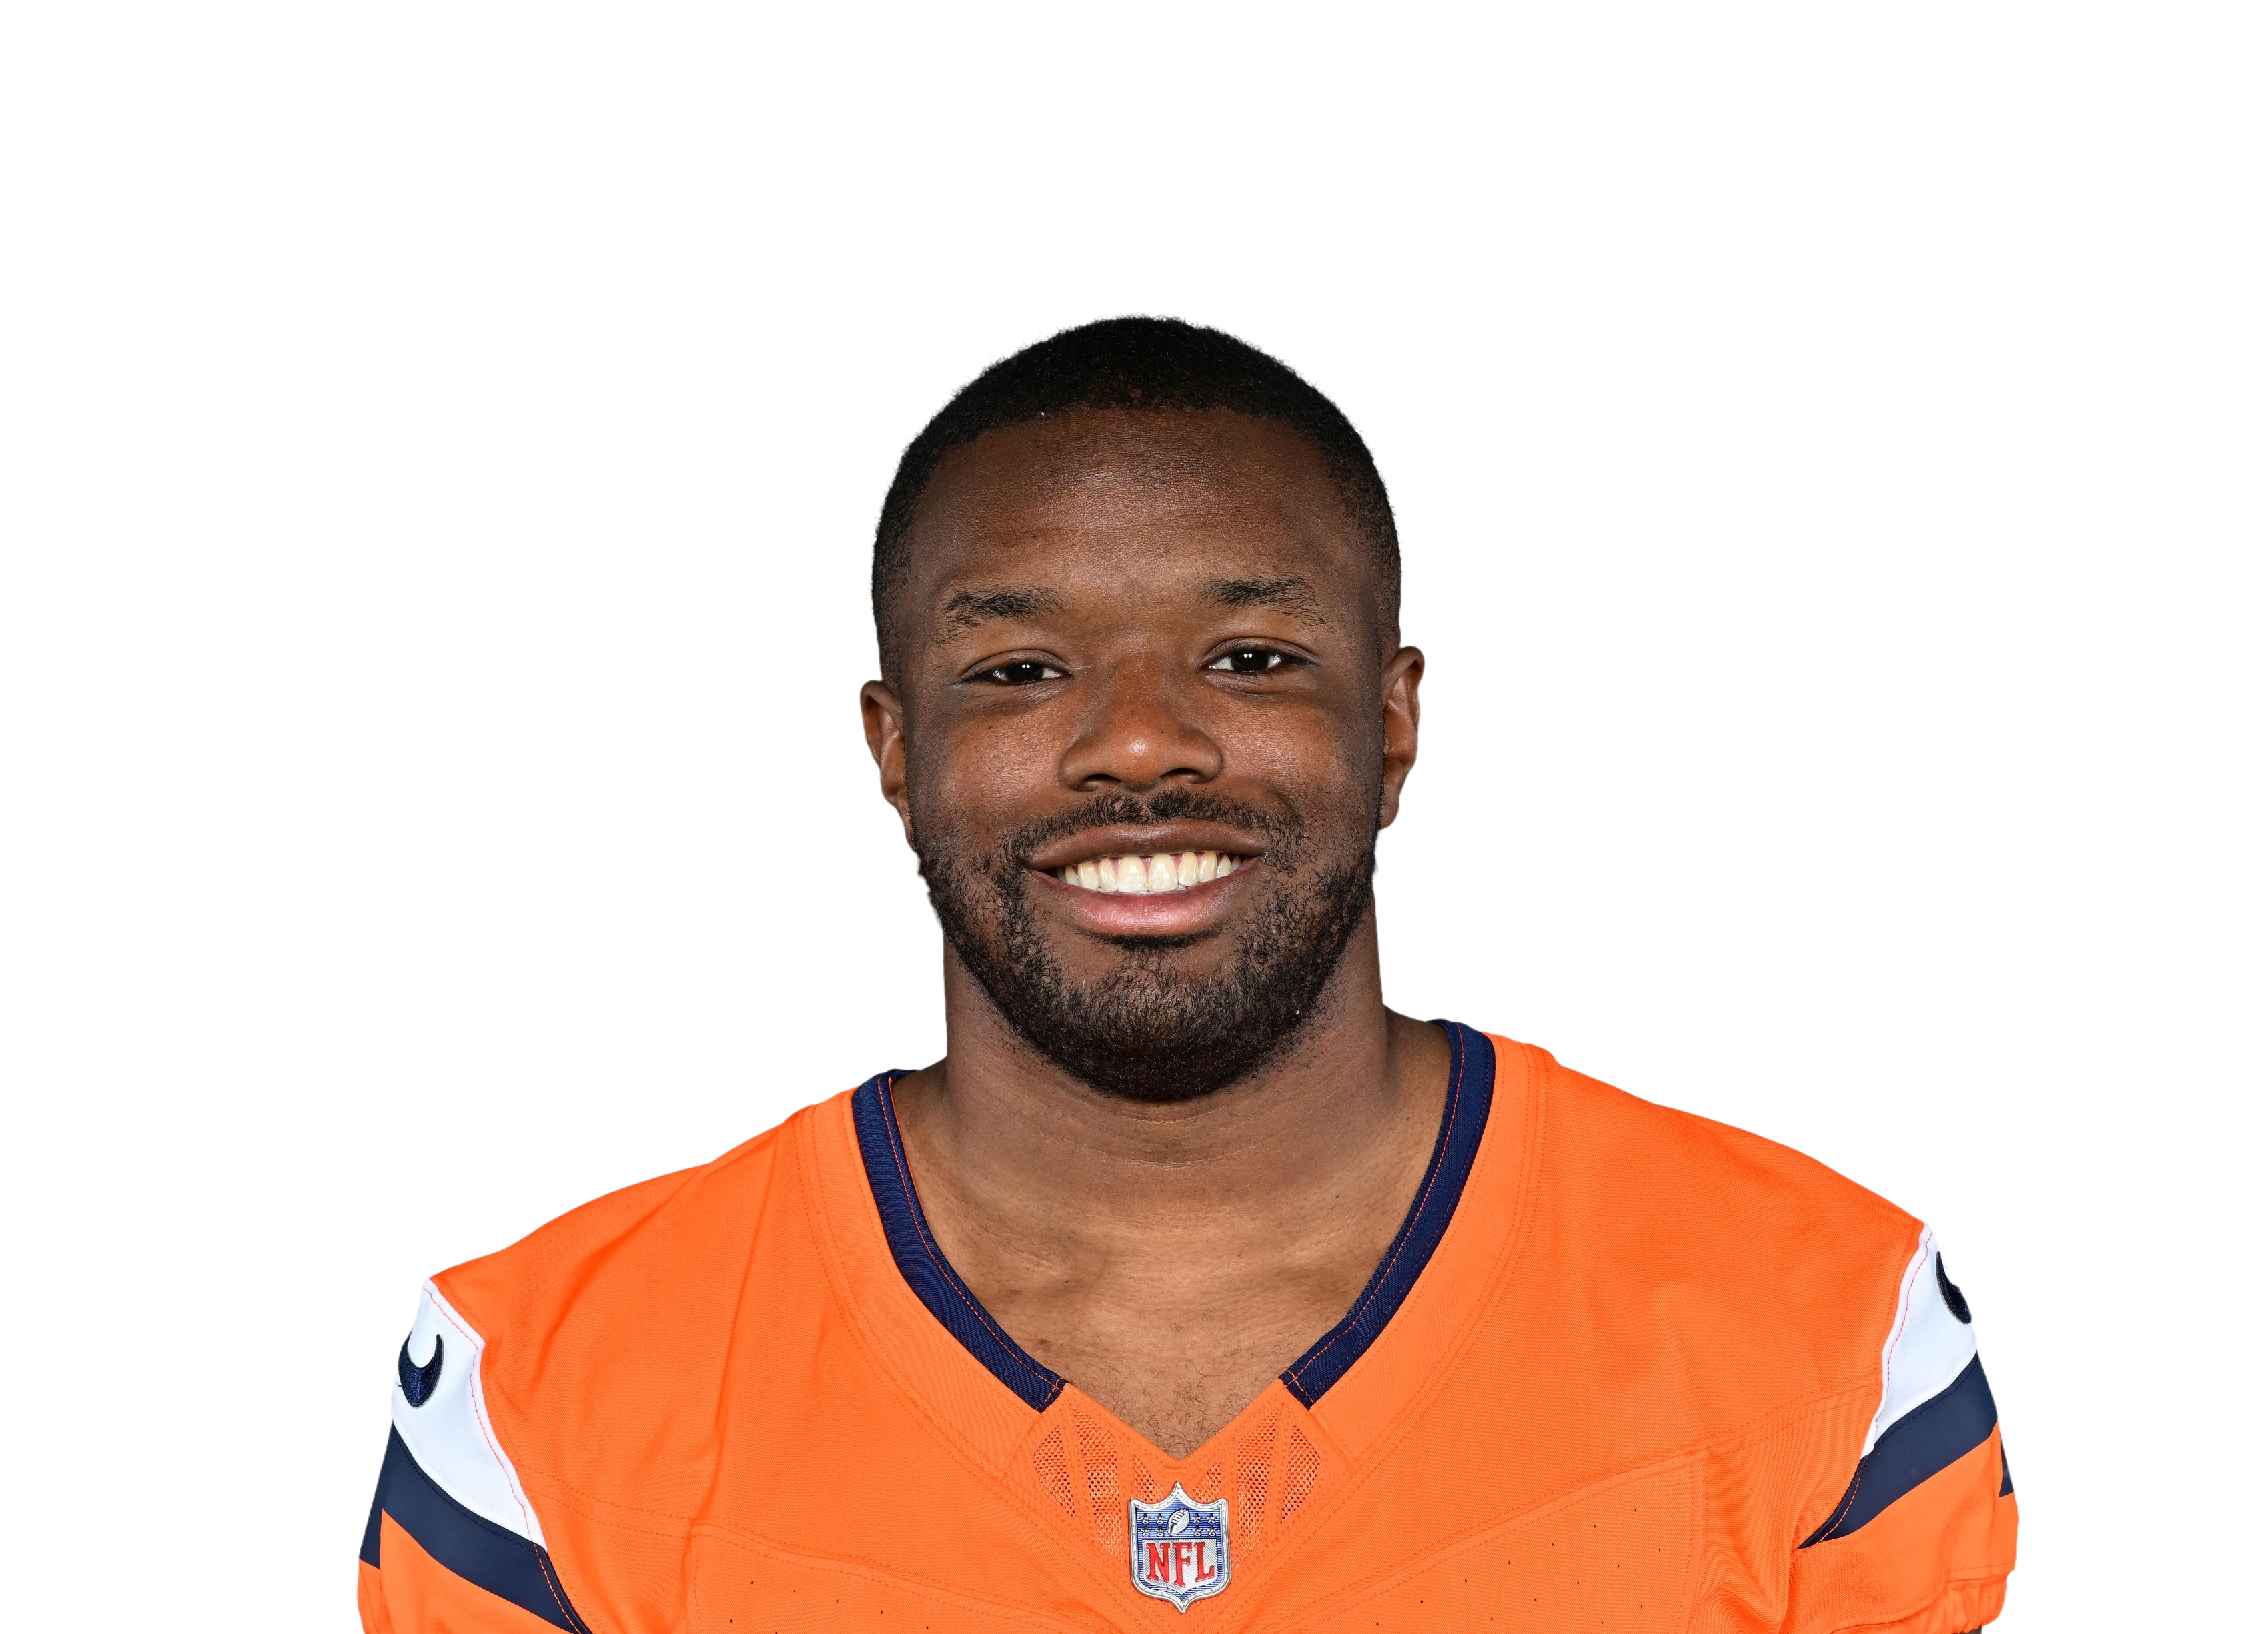 Marvin Mims Jr.vs DEN • Wk 4 | 2.0 | 3 | 1 | 10 | 0 | 0 |
 Jack Bechvs LV • Wk 9 | 1.9 | 2 | 1 | 9 | 0 | 0 |
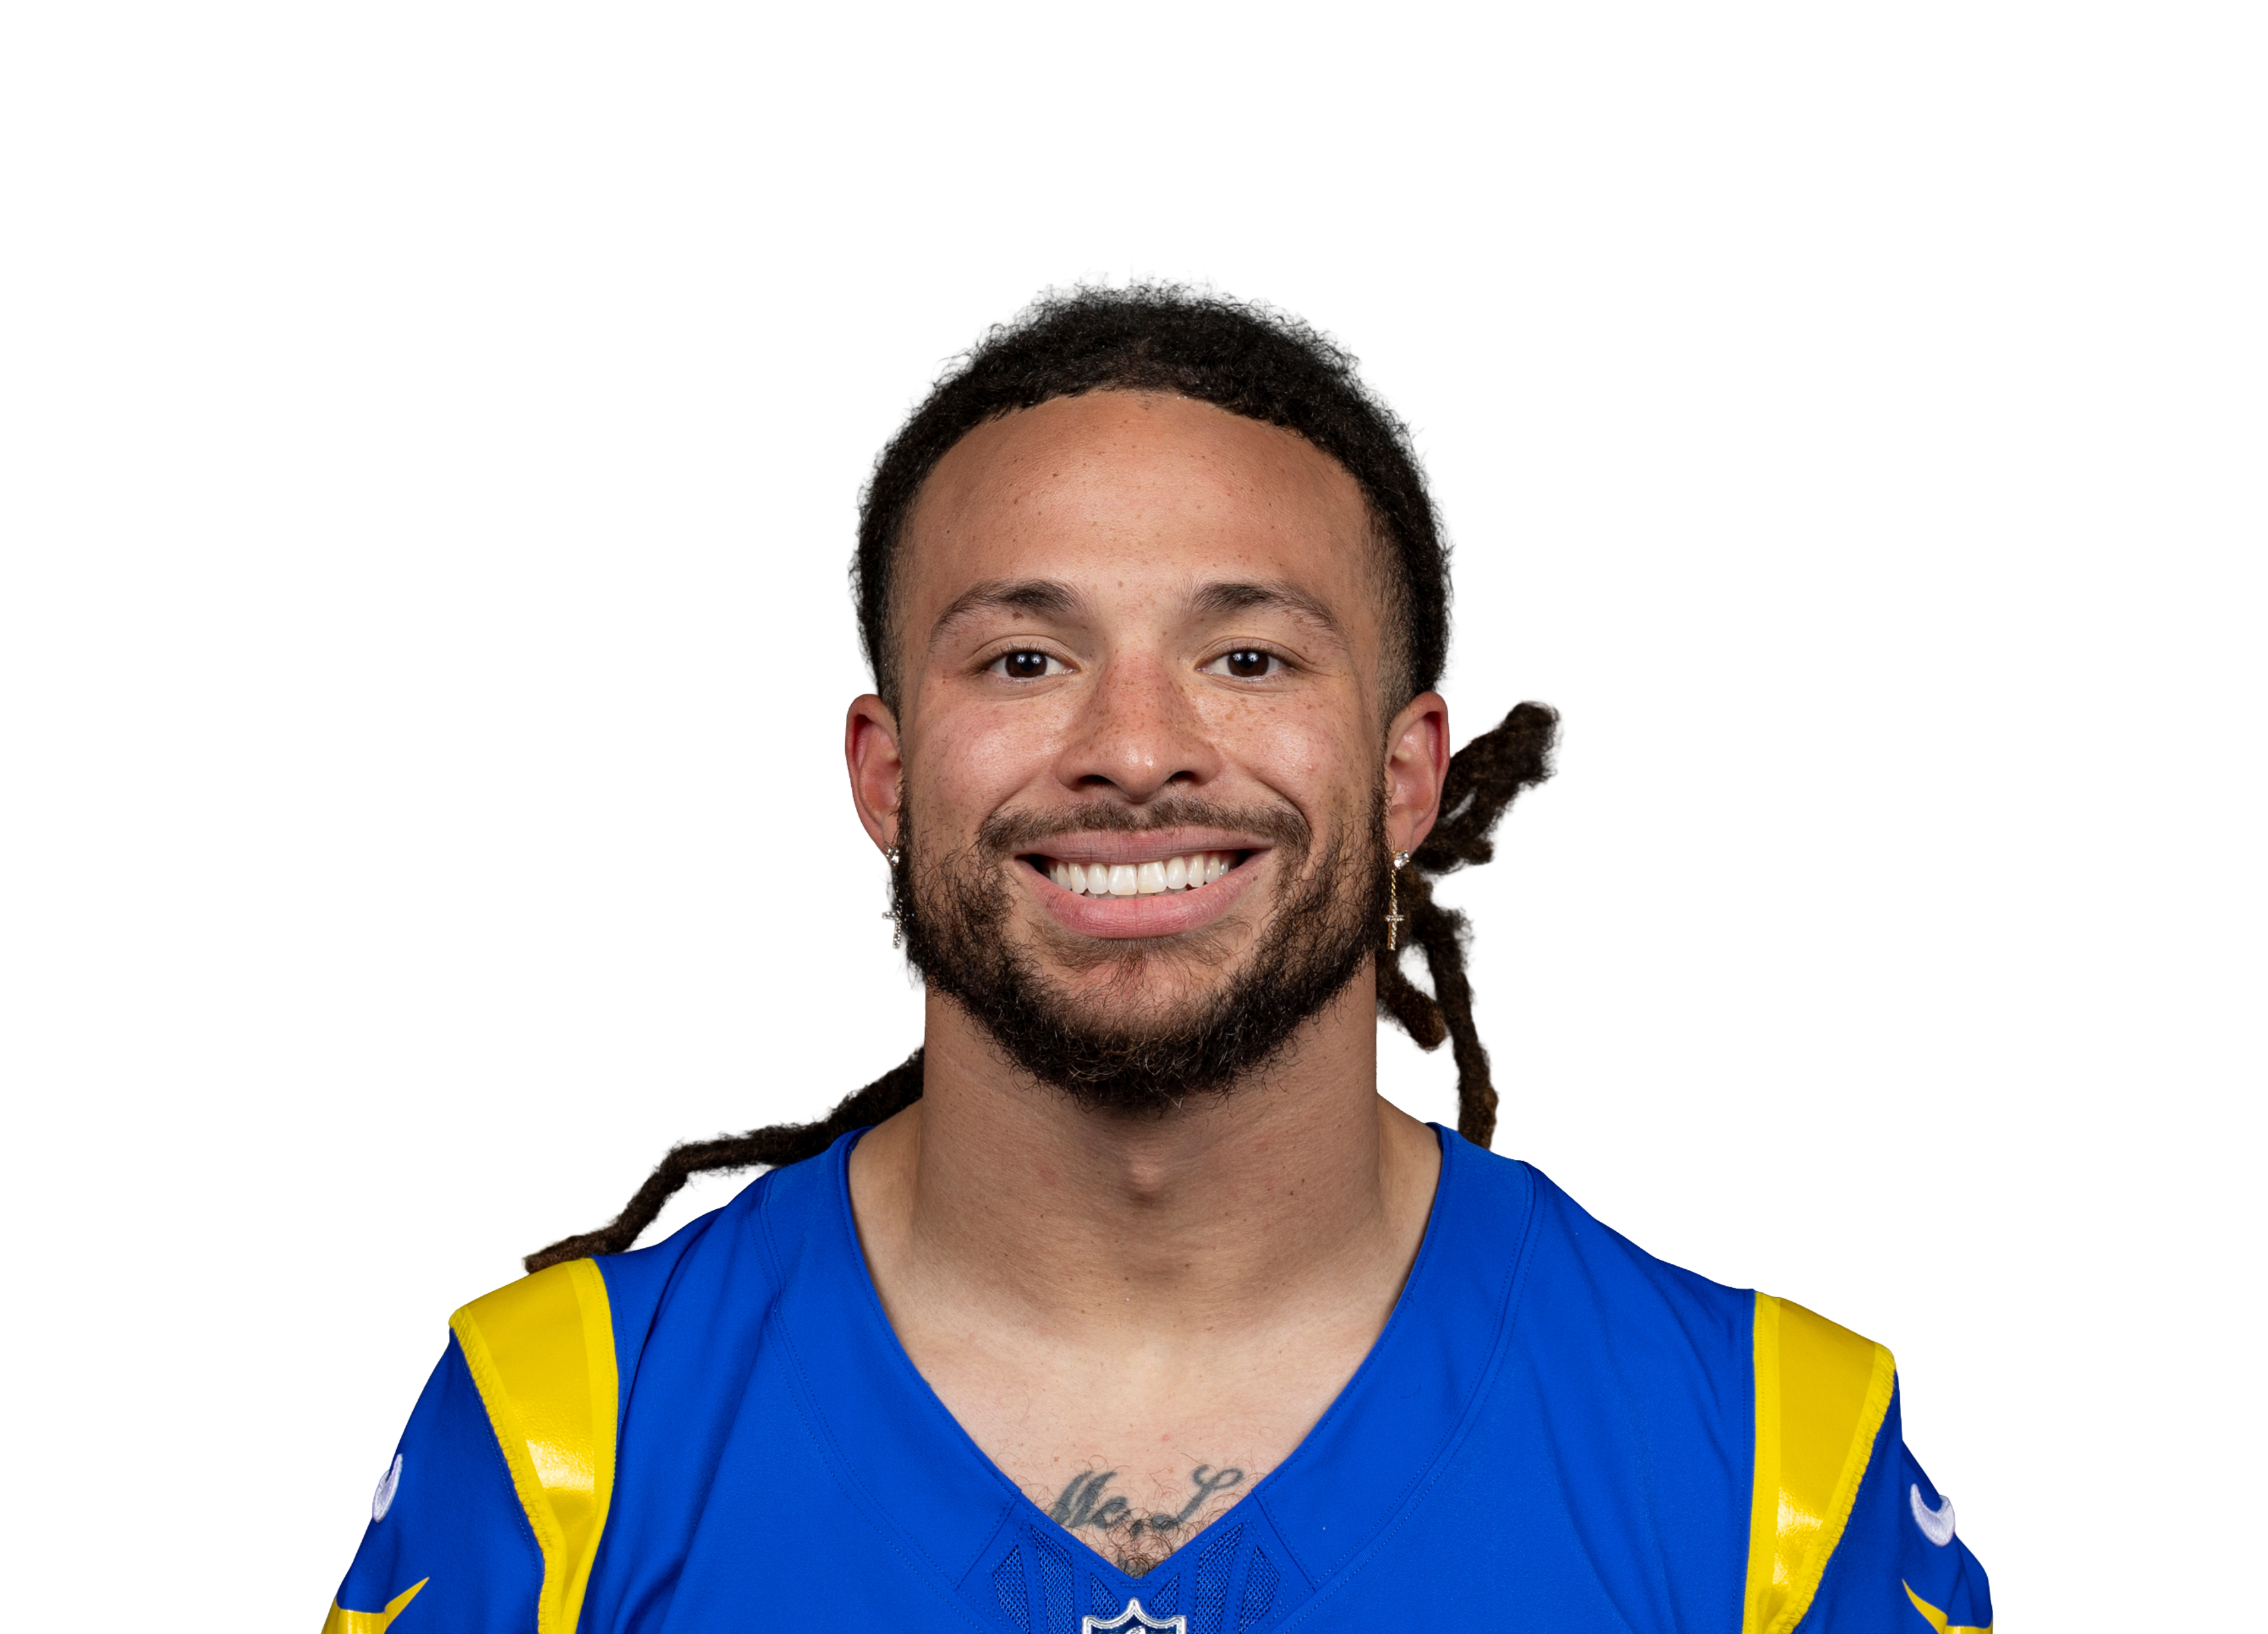 Jordan Whittington@ LA • Wk 1 | 1.8 | 1 | 1 | 8 | 0 | 0 |
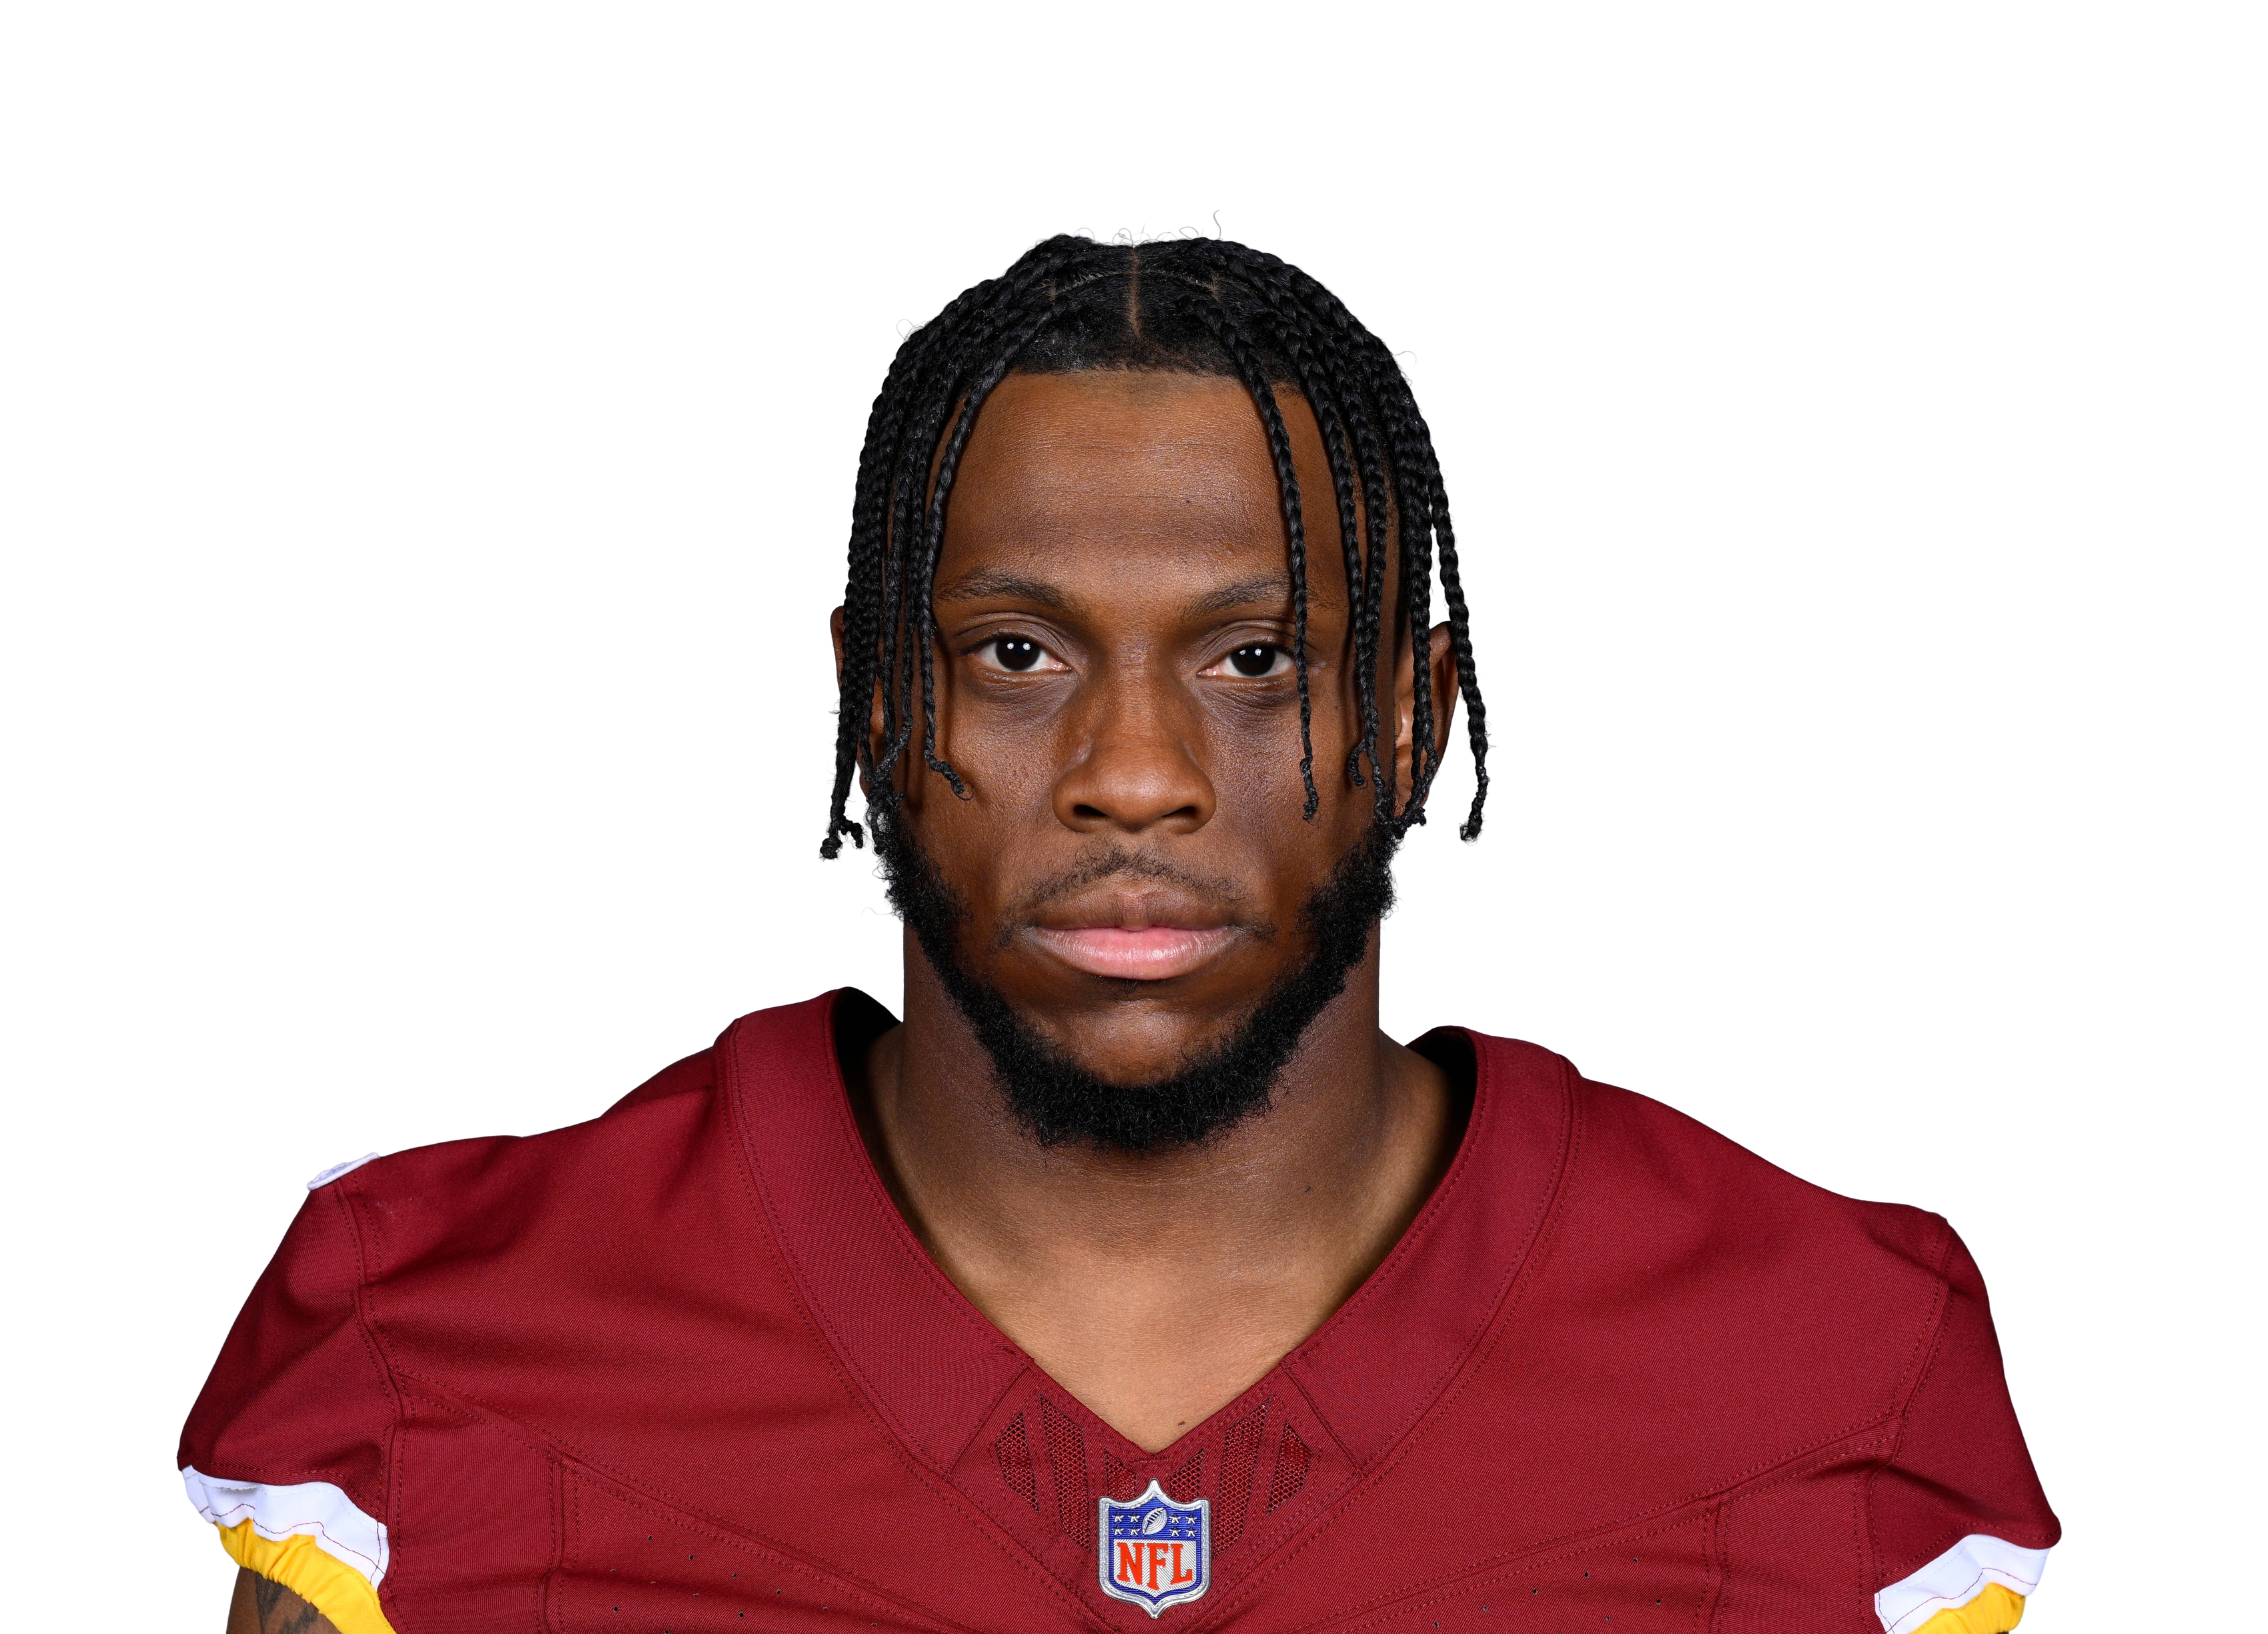 Dyami Brownvs WAS • Wk 6 | 1.6 | 1 | 1 | 6 | 0 | 0 |
 Jahan Dotson@ ATL • Wk 7 | 1.6 | 3 | 1 | 6 | 0 | 0 |
 Courtland Suttonvs DEN • Wk 4 | 1.4 | 6 | 1 | 4 | 0 | 0 |
 Konata Mumpfield@ LA • Wk 1 | 0.0 | 1 | 0 | 0 | 0 | 0 |
 Chris Bellvs MIA • Wk 2 | 0.0 | 1 | 0 | 0 | 0 | 0 |
 Jalen Brooksvs ARI • Wk 3 | 0.0 | 1 | 0 | 0 | 0 | 0 |
 Luke McCaffreyvs WAS • Wk 6 | 0.0 | 1 | 0 | 0 | 0 | 0 |
 Chris Blair@ ATL • Wk 7 | 0.0 | 1 | 0 | 0 | 0 | 0 |
Fantasy points first, then the stats that matter for his position. Ring around each photo is that player's Mania Rating. Tap a name to open his profile.
| Player | W1 | W2 | W3 | W4 | W5 | W7 | W8 | W9 | W10 | Per game |
|---|---|---|---|---|---|---|---|---|---|---|
| Justin Jefferson | 992 yds39% targets92% snaps | 655 yds32% targets100% snaps | 232 yds8% targets12% snaps | — | 779 yds24% targets89% snaps | 744 yds29% targets93% snaps | 933 yds32% targets96% snaps | 1158 yds37% targets98% snaps | 1374 yds43% targets91% snaps | 8.058 yds a game • 7.3 per target31% targets84% snaps |
| Jordan Addison | 20 yds9% targets83% snaps | 521 yds26% targets88% snaps | 990 yds36% targets98% snaps | 652 yds18% targets96% snaps | — | 320 yds13% targets83% snaps | 866 yds29% targets98% snaps | 328 yds10% targets96% snaps | — | 5.140 yds a game • 7.7 per target20% targets92% snaps |
| Tai Felton | — | — | 20 yds8% targets54% snaps | 114 yds3% targets59% snaps | 327 yds10% targets66% snaps | 10 yds4% targets7% snaps | — | — | 533 yds17% targets86% snaps | 2.415 yds a game • 6.2 per target8% targets54% snaps |
| Myles Price | 00 yds0% targets5% snaps | 10 yds5% targets50% snaps | 00 yds0% targets7% snaps | 26 yds6% targets13% snaps | 420 yds14% targets20% snaps | 00 yds0% targets3% snaps | 00 yds0% targets4% snaps | 46 yds13% targets60% snaps | 449 yds13% targets48% snaps | 1.79 yds a game • 5.4 per target6% targets23% snaps |
| Jauan Jennings | 10 yds4% targets48% snaps | — | 21 yds8% targets80% snaps | 18 yds3% targets95% snaps | 10 yds3% targets69% snaps | 334 yds13% targets56% snaps | 211 yds7% targets55% snaps | — | — | 1.79 yds a game • 5.4 per target6% targets67% snaps |
| Jeshaun Jones | — | — | — | 00 yds0% targets4% snaps | 132 yds3% targets8% snaps | — | — | — | 00 yds0% targets9% snaps | 0.311 yds a game • 32.0 per target1% targets7% snaps |
| Use | Game | Proj | PPR | Tgt | Rec | Rec Yd | Car | Rush Yd | TD | Snap |
|---|---|---|---|---|---|---|---|---|---|---|
W1 vs GB | 0.3 | 0 | 0 | 0 | 0 | 0 | 0 | 0 | 5% | |
W2 vs CHI | 0.4 | 0 | 1 | 0 | 0 | 0 | 0 | 0 | 50% | |
W3 vs TB | 0.9 | 6 | 0 | 0 | 0 | 0 | 0 | 0 | 7% | |
W4 vs MIA | 3.0 | 2.8 | 2 | 2 | 6 | 1 | 2 | 0 | 13% | |
W5 vs NO | 2.2 | 3 | 4 | 3 | 20 | 0 | 0 | 0 | 20% | |
W7 vs IND HURT, LEFT OUT | 1.8 | 0 | 0 | 0 | 0 | 0 | 0 | 0 | 3% | |
W8 vs DET | 1.7 | 0 | 0 | 0 | 0 | 0 | 0 | 0 | 4% | |
W9 vs BUF | 1.4 | 1.6 | 4 | 1 | 6 | 0 | 0 | 0 | 60% | |
| W10vs GB | 4.1 | 16.1 | 4 | 4 | 49 | 1 | 12 | 1 | 48% |
Not ranked yet. Needs 35 targets and he has 15.
Myles Price
MIN • WR • 9 gamesPick a teammate with or without. Pick more than one to combine them, like a game without the QB and without the other back.
Teammate injuries shift his Week 11 Rating3 teammate notes ▾
MINSFHow this is built
| Player | W1 | W2 | W3 | W4 | W5 | W7 | W8 | W9 | W10 | Per game |
|---|---|---|---|---|---|---|---|---|---|---|
| Justin Jefferson | 992 yds39% targets92% snaps | 655 yds32% targets100% snaps | 232 yds8% targets12% snaps | — | 779 yds24% targets89% snaps | 744 yds29% targets93% snaps | 933 yds32% targets96% snaps | 1158 yds37% targets98% snaps | 1374 yds43% targets91% snaps | 8.058 yds a game • 7.3 per target31% targets84% snaps |
| Jordan Addison | 20 yds9% targets83% snaps | 521 yds26% targets88% snaps | 990 yds36% targets98% snaps | 652 yds18% targets96% snaps | — | 320 yds13% targets83% snaps | 866 yds29% targets98% snaps | 328 yds10% targets96% snaps | — | 5.140 yds a game • 7.7 per target20% targets92% snaps |
| Tai Felton | — | — | 20 yds8% targets54% snaps | 114 yds3% targets59% snaps | 327 yds10% targets66% snaps | 10 yds4% targets7% snaps | — | — | 533 yds17% targets86% snaps | 2.415 yds a game • 6.2 per target8% targets54% snaps |
| Myles Price | 00 yds0% targets5% snaps | 10 yds5% targets50% snaps | 00 yds0% targets7% snaps | 26 yds6% targets13% snaps | 420 yds14% targets20% snaps | 00 yds0% targets3% snaps | 00 yds0% targets4% snaps | 46 yds13% targets60% snaps | 449 yds13% targets48% snaps | 1.79 yds a game • 5.4 per target6% targets23% snaps |
| Jauan Jennings | 10 yds4% targets48% snaps | — | 21 yds8% targets80% snaps | 18 yds3% targets95% snaps | 10 yds3% targets69% snaps | 334 yds13% targets56% snaps | 211 yds7% targets55% snaps | — | — | 1.79 yds a game • 5.4 per target6% targets67% snaps |
| Jeshaun Jones | — | — | — | 00 yds0% targets4% snaps | 132 yds3% targets8% snaps | — | — | — | 00 yds0% targets9% snaps | 0.311 yds a game • 32.0 per target1% targets7% snaps |
| Use | Game | Proj | PPR | Tgt | Rec | Rec Yd | Car | Rush Yd | TD | Snap |
|---|---|---|---|---|---|---|---|---|---|---|
| W1vs GB | 0.3 | 0 | 0 | 0 | 0 | 0 | 0 | 0 | 5% | |
| W2vs CHI | 0.4 | 0 | 1 | 0 | 0 | 0 | 0 | 0 | 50% | |
| W3vs TB | 0.9 | 6 | 0 | 0 | 0 | 0 | 0 | 0 | 7% | |
| W4vs MIA | 3.0 | 2.8 | 2 | 2 | 6 | 1 | 2 | 0 | 13% | |
| W5vs NO | 2.2 | 3 | 4 | 3 | 20 | 0 | 0 | 0 | 20% | |
| W7vs IND HURT, LEFT OUT | 1.8 | 0 | 0 | 0 | 0 | 0 | 0 | 0 | 3% | |
| W8vs DET | 1.7 | 0 | 0 | 0 | 0 | 0 | 0 | 0 | 4% | |
| W9vs BUF | 1.4 | 1.6 | 4 | 1 | 6 | 0 | 0 | 0 | 60% | |
| W10vs GB | 4.1 | 16.1 | 4 | 4 | 49 | 1 | 12 | 1 | 48% |
Not ranked yet. Needs 35 targets and he has 15.
33.8 PPR points a game allowed to wide receivers, 11th most of 32 defenses.
| Player | PPR | Tgt | Rec | Rec Yd | Rec TD | Rush Yd |
|---|---|---|---|---|---|---|
| George Pickens@ DAL • Wk 10 | 43.5 | 18 | 11 | 145 | 3 | 0 |
| Michael Wilsonvs ARI • Wk 3 | 25.9 | 17 | 11 | 89 | 1 | 0 |
| Jaxon Smith-Njigba@ SEA • Wk 5 | 22.8 | 8 | 5 | 102 | 1 | 16 |
| CeeDee Lamb@ DAL • Wk 10 | 20.2 | 13 | 7 | 72 | 1 | 0 |
| Drake London@ ATL • Wk 7 | 19.6 | 10 | 7 | 66 | 1 | 0 |
| Ryan Flournoy@ DAL • Wk 10 | 19.1 | 7 | 6 | 71 | 1 | 0 |
| Stefon Diggsvs WAS • Wk 6 | 16.4 | 7 | 6 | 44 | 1 | 0 |
| Ryan Millervs MIA • Wk 2 | 14.7 | 1 | 1 | 77 | 1 | 0 |
| Jaylen Waddlevs DEN • Wk 4 | 14.5 | 6 | 5 | 35 | 1 | 0 |
| Puka Nacua@ LA • Wk 1 | 12.4 | 9 | 5 | 74 | 0 | 0 |
| Treylon Burksvs WAS • Wk 6 | 10.6 | 6 | 4 | 66 | 0 | 0 |
| Tre Tuckervs LV • Wk 9 | 9.5 | 8 | 4 | 55 | 0 | 0 |
| Malik Washingtonvs MIA • Wk 2 | 8.7 | 5 | 4 | 43 | 0 | 4 |
| Antonio Williamsvs WAS • Wk 6 | 8.0 | 4 | 3 | 50 | 0 | 0 |
| Pat Bryantvs DEN • Wk 4 | 7.7 | 3 | 3 | 47 | 0 | 0 |
| Marvin Harrison Jr.vs ARI • Wk 3 | 7.0 | 5 | 3 | 40 | 0 | 0 |
| Davante Adams@ LA • Wk 1 | 5.6 | 6 | 3 | 26 | 0 | 0 |
| Rashid Shaheed@ SEA • Wk 5 | 4.3 | 4 | 2 | 23 | 0 | 0 |
| Kendrick Bournevs ARI • Wk 3 | 4.2 | 3 | 2 | 22 | 0 | 0 |
| Caleb Douglasvs MIA • Wk 2 | 3.9 | 3 | 2 | 19 | 0 | 0 |
| Terry McLaurinvs WAS • Wk 6 | 3.7 | 1 | 1 | 27 | 0 | 0 |
| Cooper Kupp@ SEA • Wk 5 | 3.5 | 3 | 2 | 15 | 0 | 0 |
| Jalen Nailorvs LV • Wk 9 | 2.9 | 4 | 2 | 9 | 0 | 0 |
| KaVontae Turpin@ DAL • Wk 10 | 2.9 | 3 | 1 | 10 | 0 | 9 |
| Zachariah Branch@ ATL • Wk 7 | 2.7 | 2 | 1 | 9 | 0 | 8 |
| Marvin Mims Jr.vs DEN • Wk 4 | 2.0 | 3 | 1 | 10 | 0 | 0 |
| Jack Bechvs LV • Wk 9 | 1.9 | 2 | 1 | 9 | 0 | 0 |
| Jordan Whittington@ LA • Wk 1 | 1.8 | 1 | 1 | 8 | 0 | 0 |
| Dyami Brownvs WAS • Wk 6 | 1.6 | 1 | 1 | 6 | 0 | 0 |
| Jahan Dotson@ ATL • Wk 7 | 1.6 | 3 | 1 | 6 | 0 | 0 |
| Courtland Suttonvs DEN • Wk 4 | 1.4 | 6 | 1 | 4 | 0 | 0 |
| Konata Mumpfield@ LA • Wk 1 | 0.0 | 1 | 0 | 0 | 0 | 0 |
| Chris Bellvs MIA • Wk 2 | 0.0 | 1 | 0 | 0 | 0 | 0 |
| Jalen Brooksvs ARI • Wk 3 | 0.0 | 1 | 0 | 0 | 0 | 0 |
| Luke McCaffreyvs WAS • Wk 6 | 0.0 | 1 | 0 | 0 | 0 | 0 |
| Chris Blair@ ATL • Wk 7 | 0.0 | 1 | 0 | 0 | 0 | 0 |
Fantasy points first, then the stats that matter for his position. Ring around each photo is that player's Mania Rating. Tap a name to open his profile.