
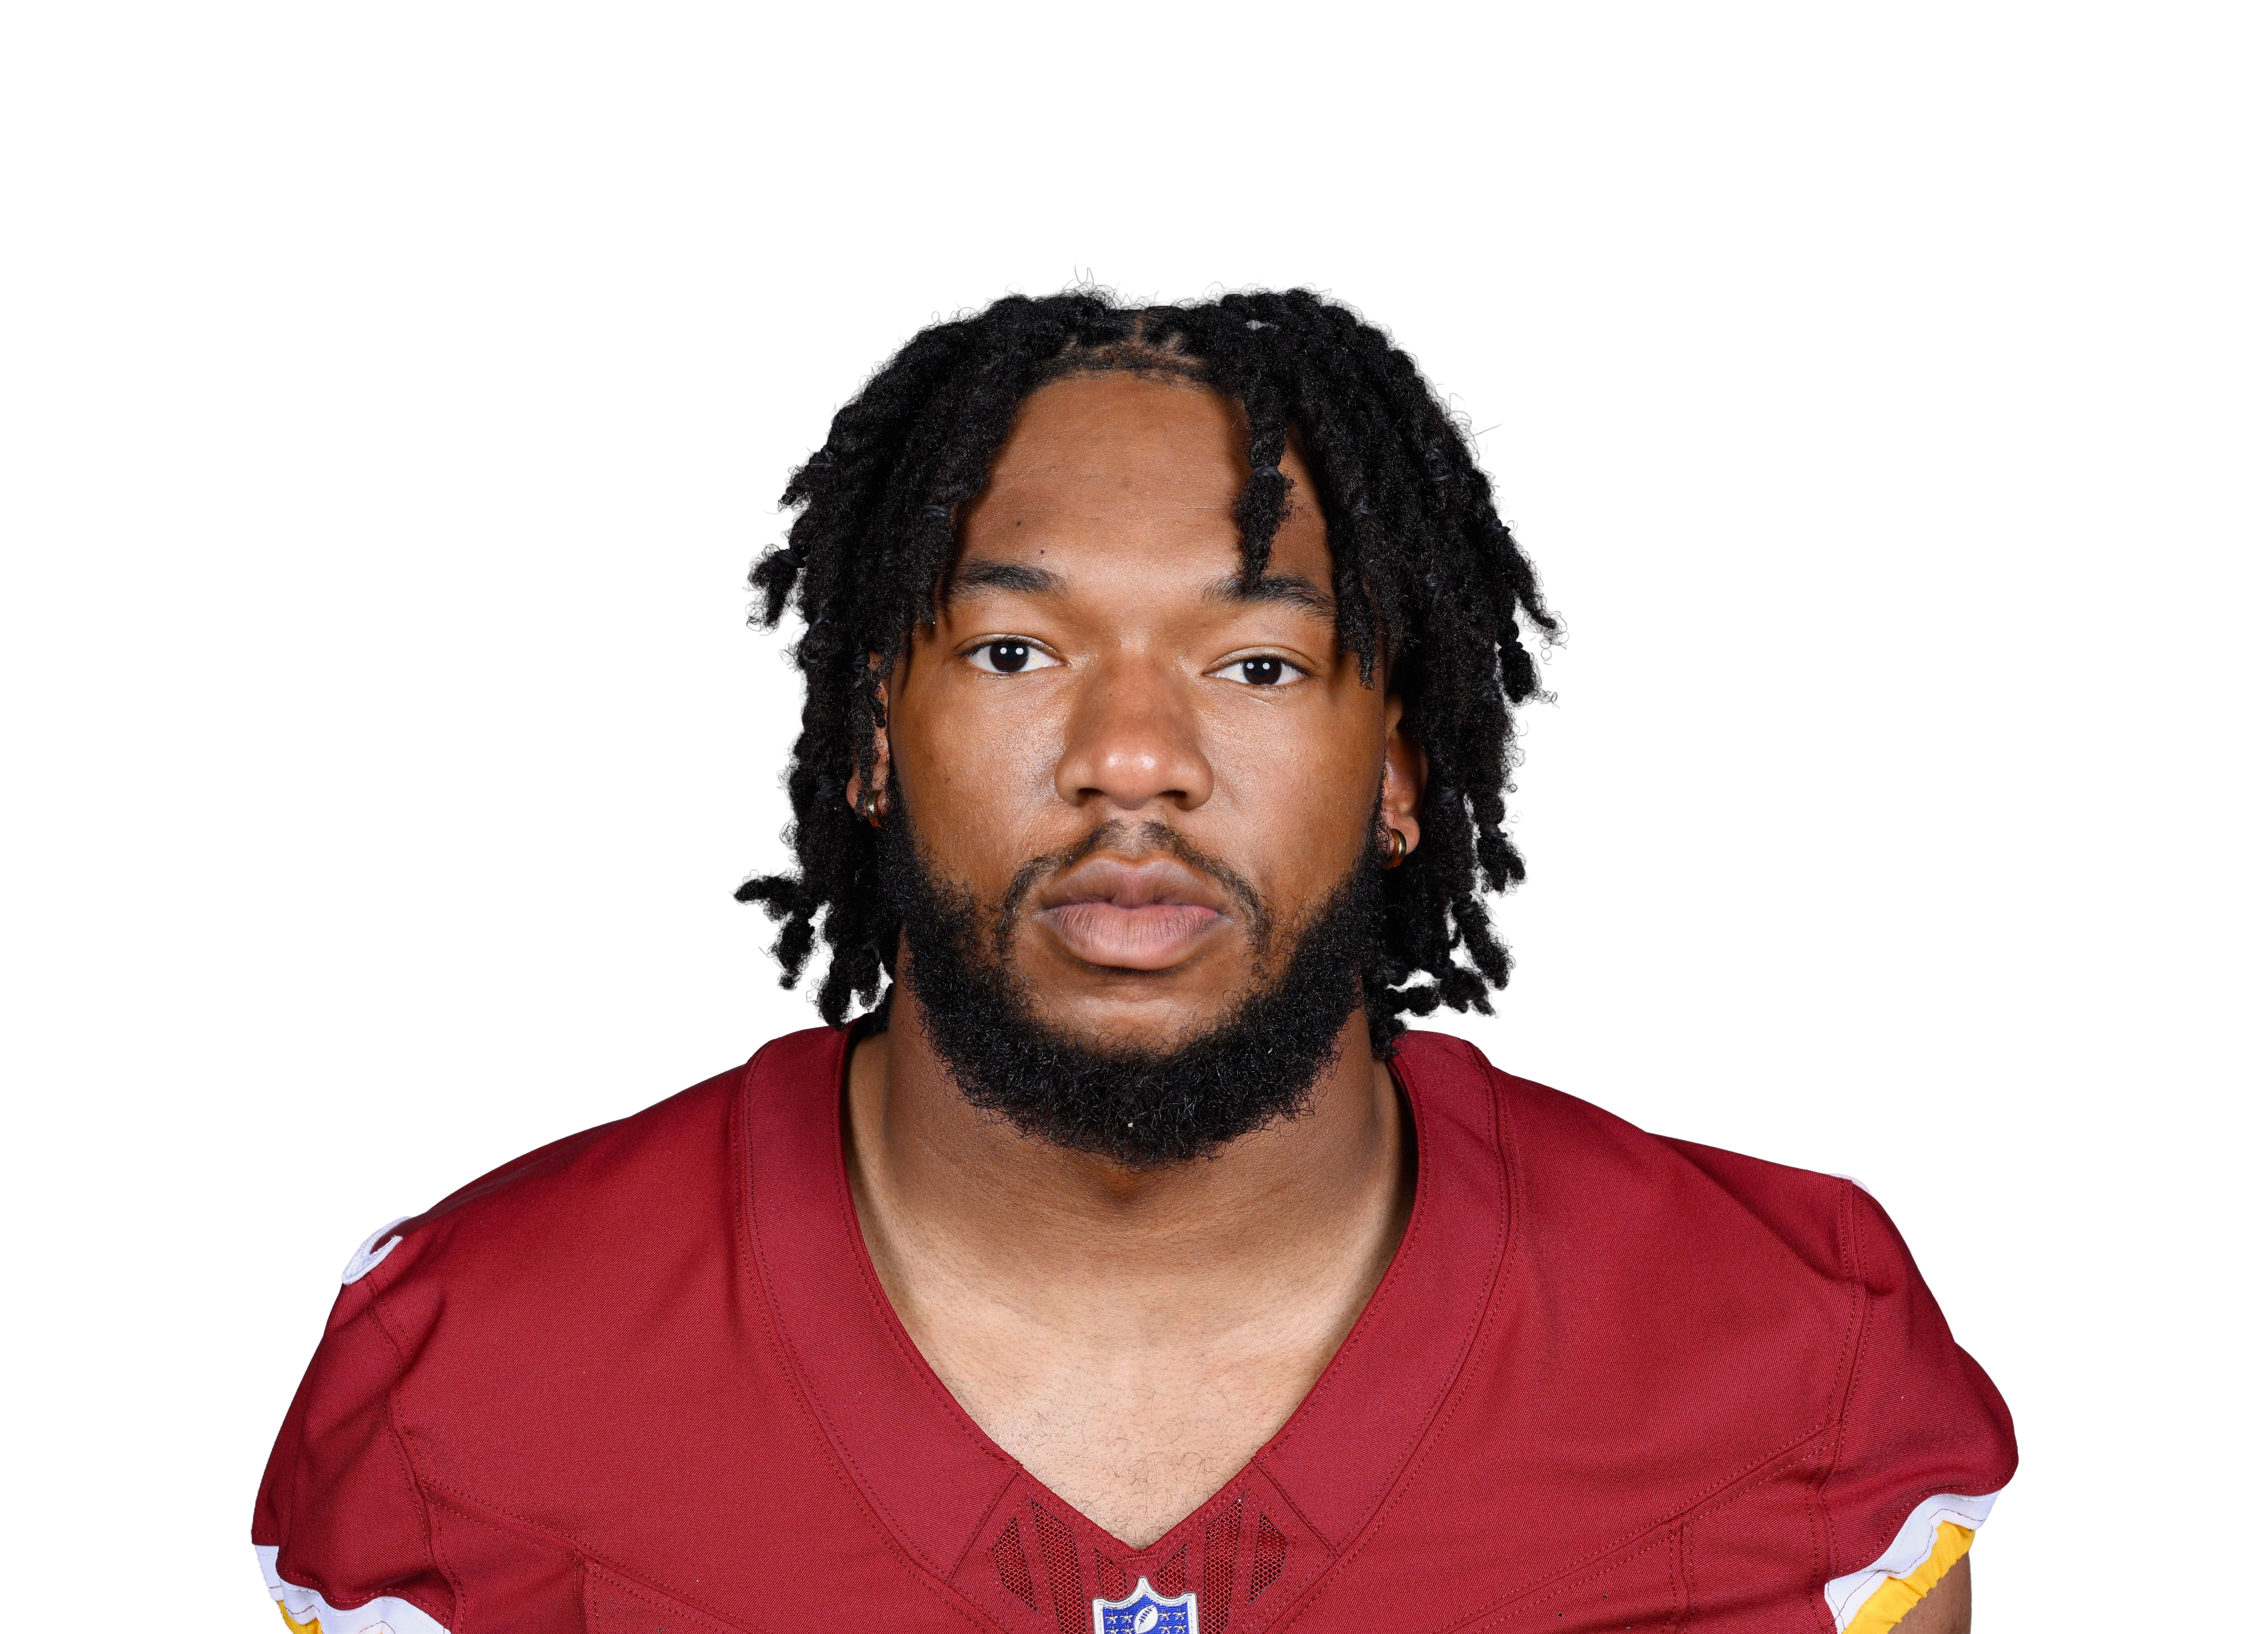
52.0MANIA OVERALL
MANIA RATING • DEPTH
Jaylin Lane
 WAS • WR • 4 games
#326 OverallWR168#8 WR on WASAge 24Out
OUTWEEK 11 RATINGStart value vs CIN
—WEEK 11 PROJECTIONPPR
2%TARGET SHARE1st percentile
12.5%SNAP SHARE1st percentile
Games counted
Untick or tick any game and Mania Rating, matchup and Week 11 Rating all recalculate. Official Mania Rating 52.
Injured reserve • no Week 11 Rating
Week 11 Rating = recent role + opponent + the latest injury report (updated Sat Nov 21, 6:30 AM ET). Check final inactives before you set your lineup.
Mania breakdown
Fantasy Production1
Target Volume1
Team Target Role0
Red-Zone Threat0
Per-Target Efficiency96
Mania breakdown
Percentile among WRs. 100 is the best, 50 is average.
How many fantasy points and total yards he is actually producing, compared with players at his position. Ranks better than 1% of WRs.
How often he is targeted: targets per game, receptions and his share of the team targets. Ranks better than 1% of WRs.
How big a slice of his team passing game belongs to him: target share, air-yard share and snaps. Ranks better than 0% of WRs.
How often the offense uses him near the goal line: red-zone targets and end-zone targets. Ranks better than 0% of WRs.
What he produces with each chance instead of just rewarding volume: yards per target, catch rate and fantasy points per opportunity. Ranks better than 96% of WRs.
Top 30%MiddleBottom 40%Tap a category to see what it means.
Week 11 matchup
vs CIN
Good matchup
Adjustment+6.0 pts
Allows to WRs24th most
Week11

Week 11 matchup
vs CIN
+6Rating boost
Good matchup24th easiest of 32 defenses for WRs
ToughEasy
29.1PPR a game CIN allows to WRs
3.5Similar players, usual PPR a game
3.4Same players against CIN
Players with a role like his scored 3.4 PPR a game against CIN, versus 3.5 in their usual games (-4%). That moves his Week 11 Rating by +6.
How wide receivers did against CIN
29.7 PPR points a game allowed to wide receivers, 24th most of 32 defenses.
| Player | PPR | Tgt | Rec | Rec Yd | Rec TD | Rush Yd |
|---|---|---|---|---|---|---|
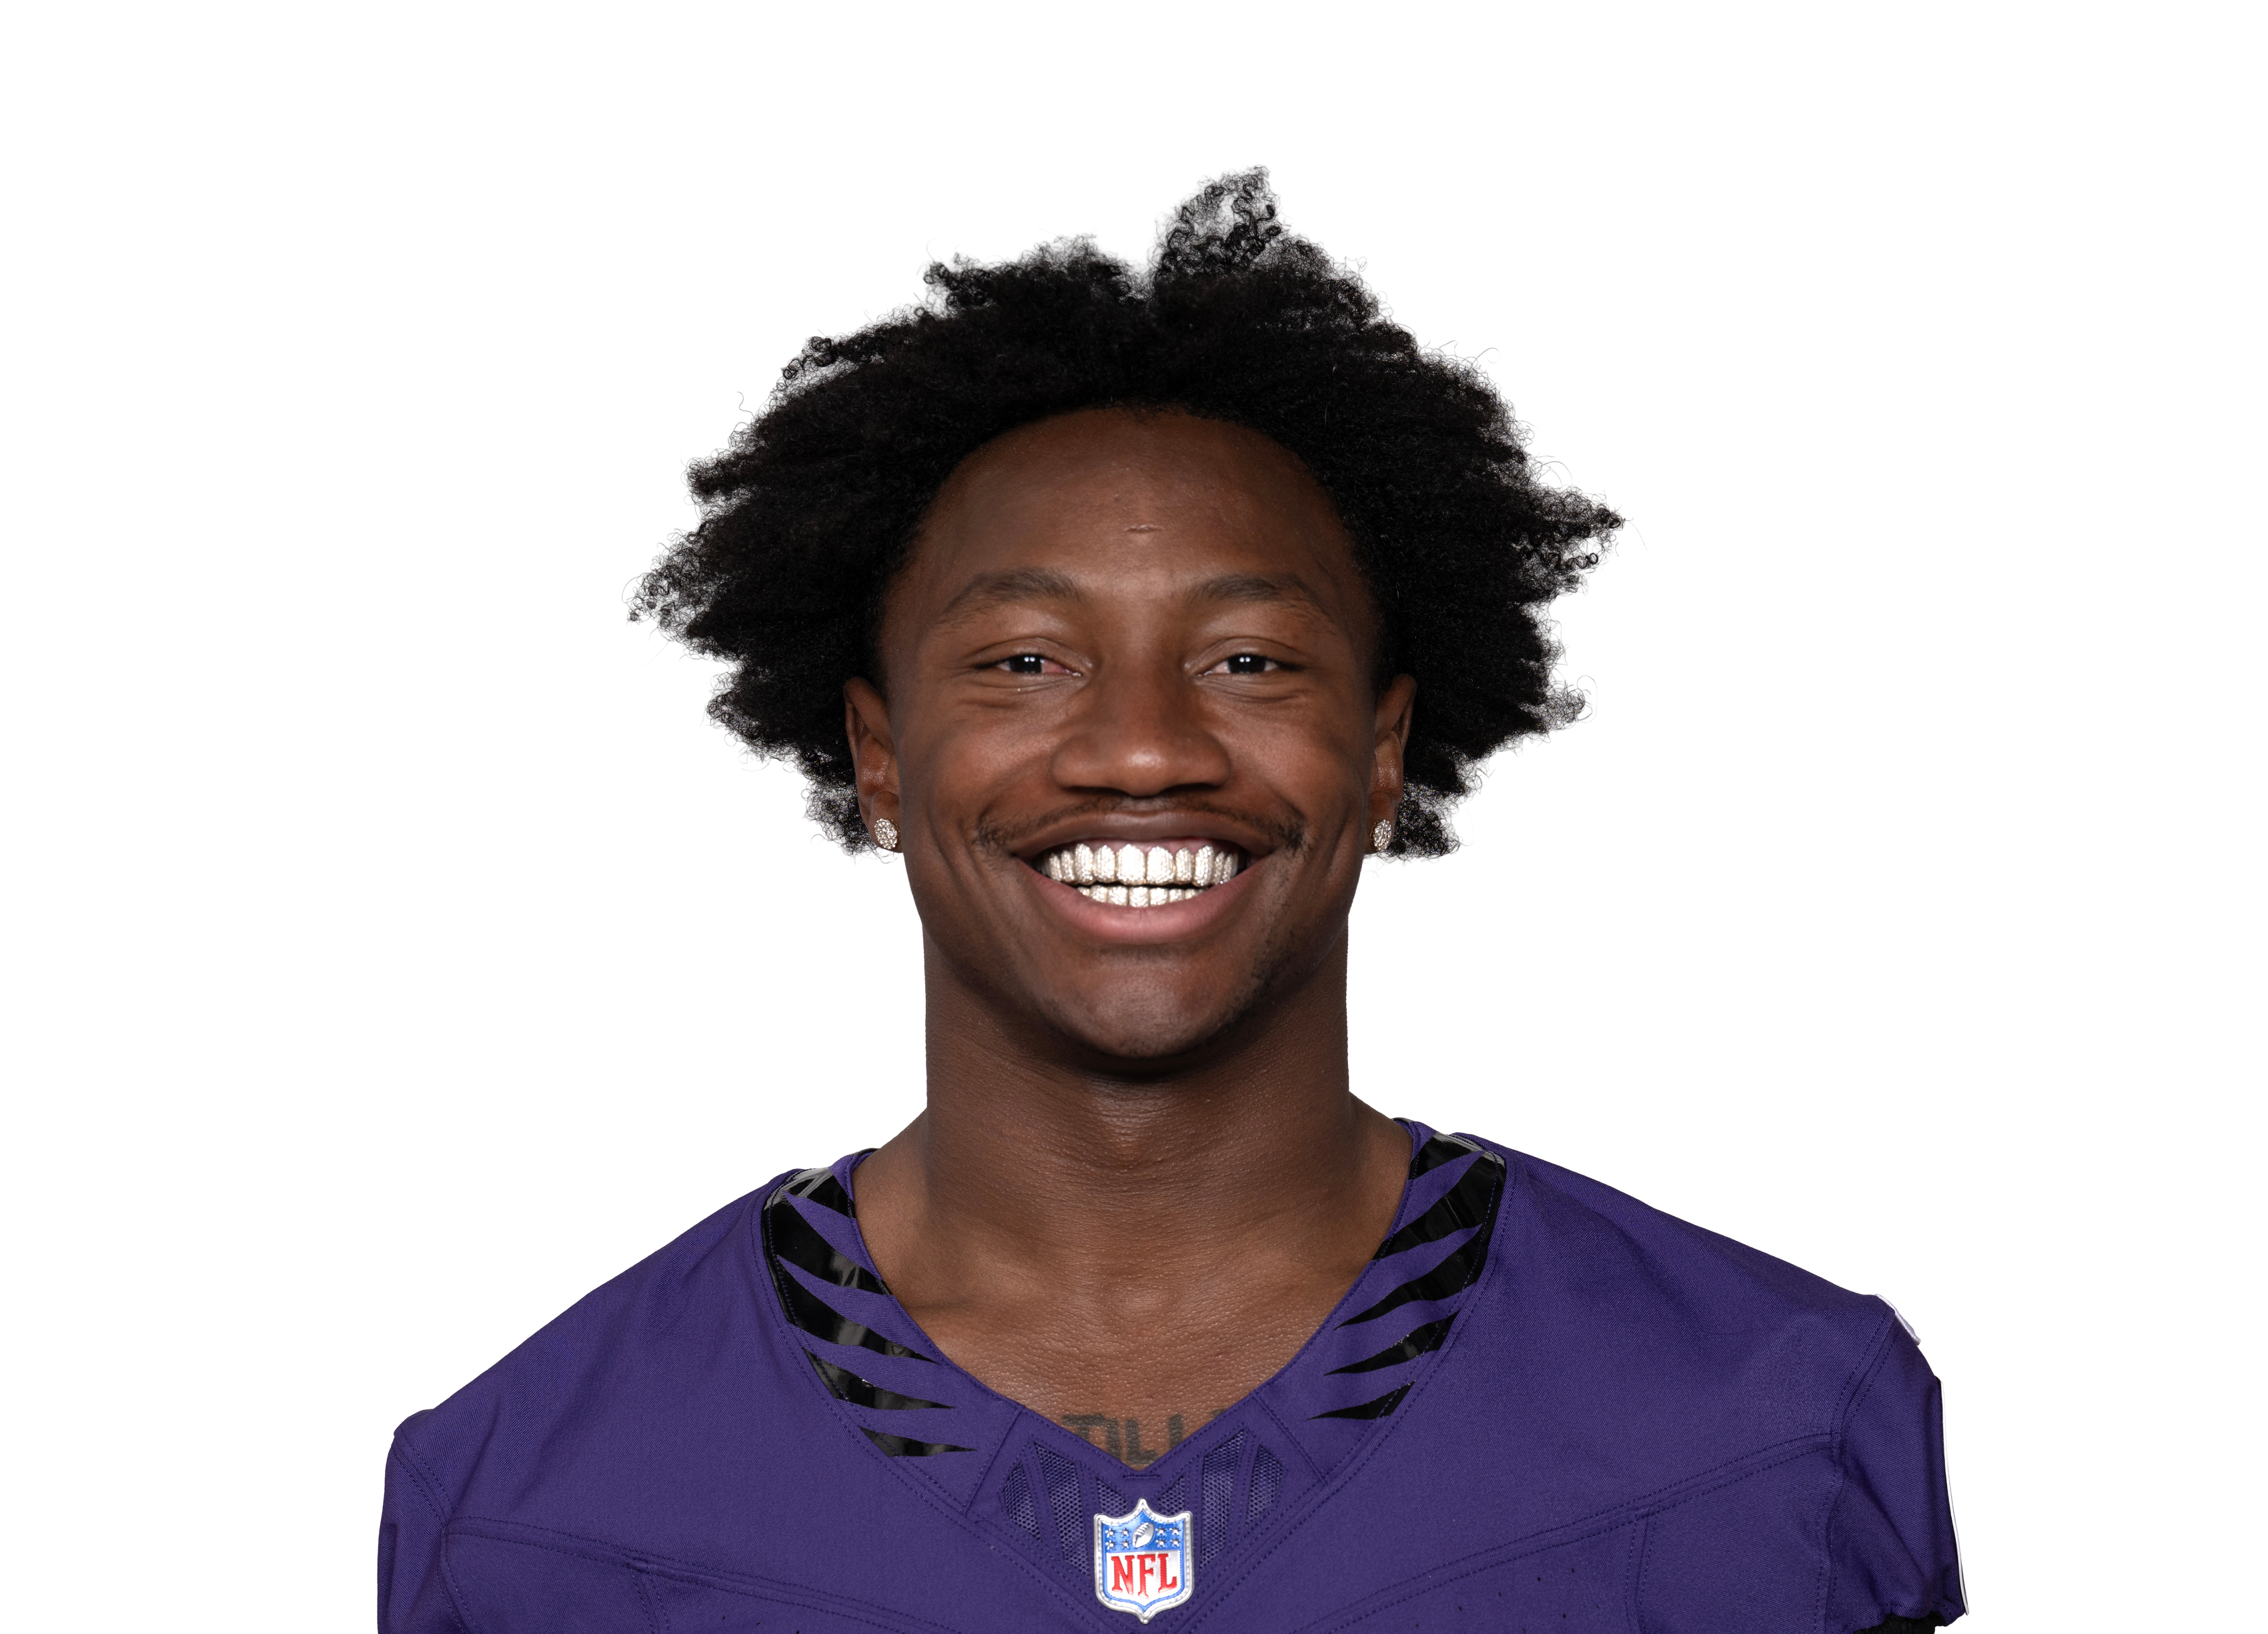 Zay Flowers@ BAL • Wk 7 | 27.7 | 11 | 8 | 137 | 1 | 0 |
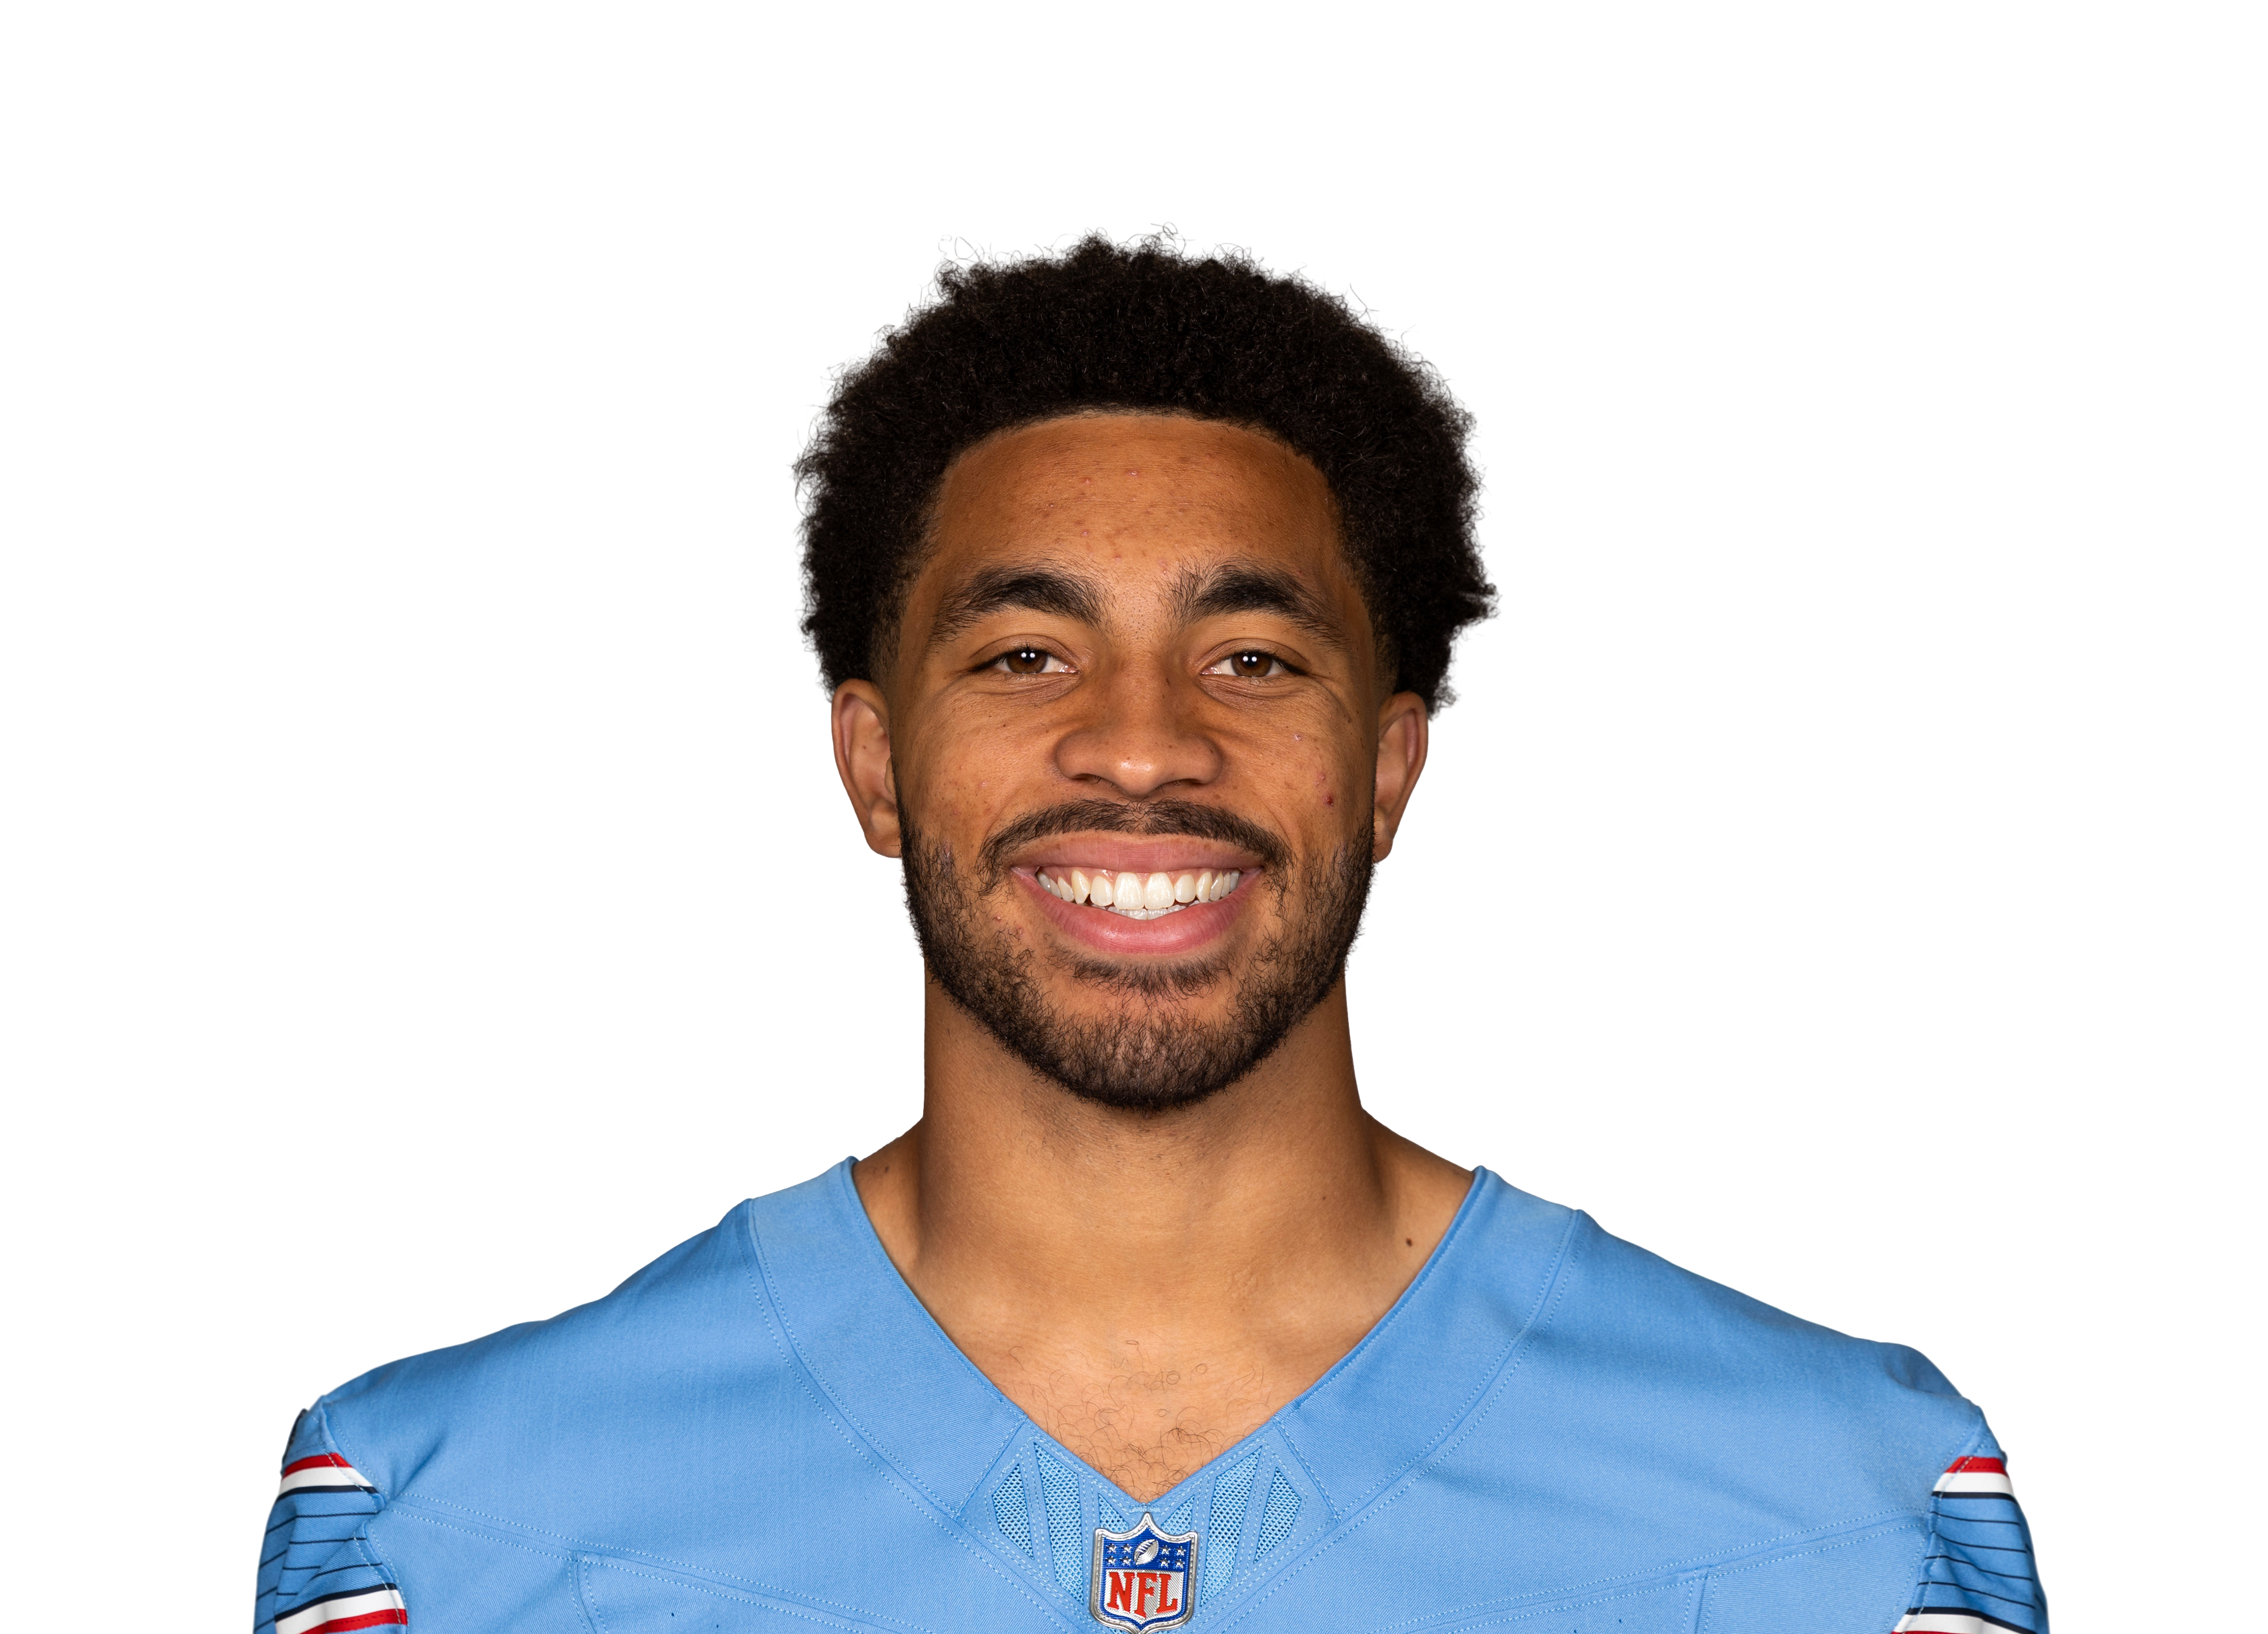 Chimere Dikevs TEN • Wk 8 | 18.1 | 6 | 5 | 71 | 1 | 0 |
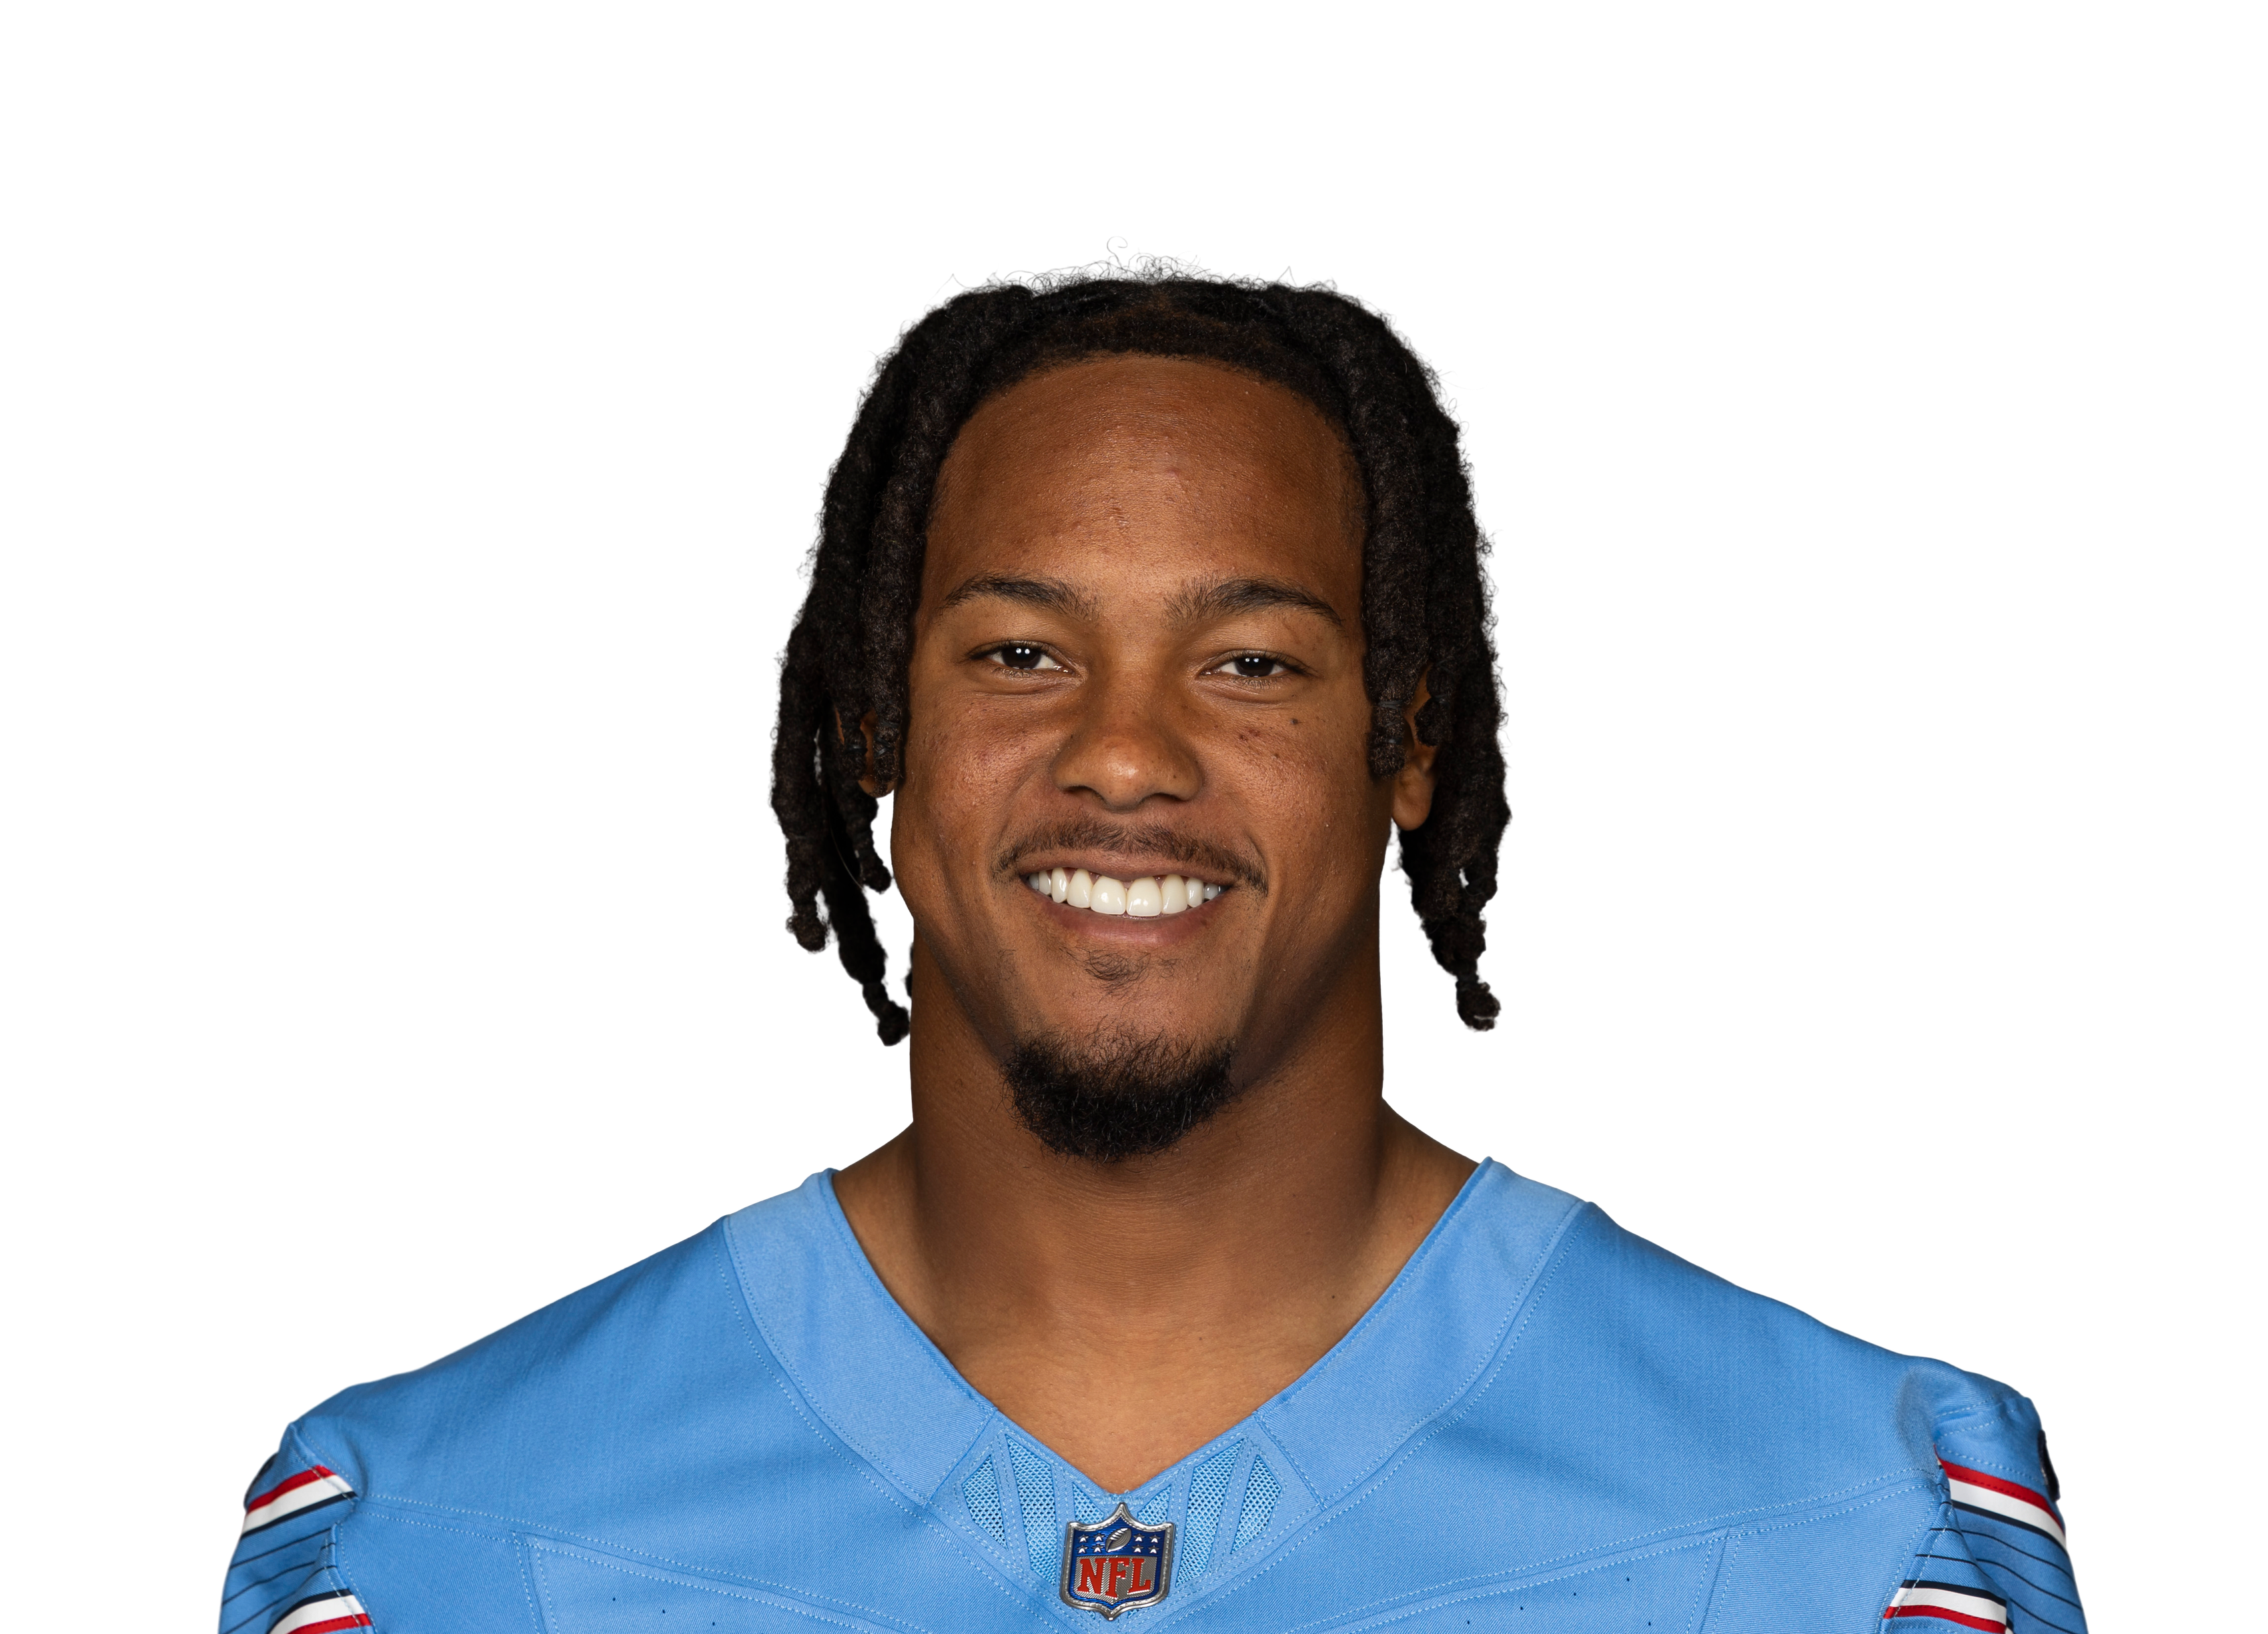 Wan'Dale Robinsonvs TEN • Wk 8 | 15.7 | 7 | 6 | 57 | 1 | 0 |
 DK Metcalfvs PIT • Wk 10 | 15.4 | 6 | 2 | 54 | 1 | 0 |
 Roman Wilson@ PIT • Wk 3 | 15.0 | 6 | 3 | 60 | 1 | 0 |
| DK Metcalf@ PIT • Wk 3 | 12.1 | 5 | 3 | 31 | 1 | 0 |
 Malik Washington@ MIA • Wk 5 | 12.1 | 8 | 6 | 43 | 0 | 18 |
 Kevin Coleman Jr.@ MIA • Wk 5 | 12.0 | 7 | 3 | 30 | 1 | 0 |
 Drake London@ ATL • Wk 9 | 11.8 | 5 | 5 | 68 | 0 | 0 |
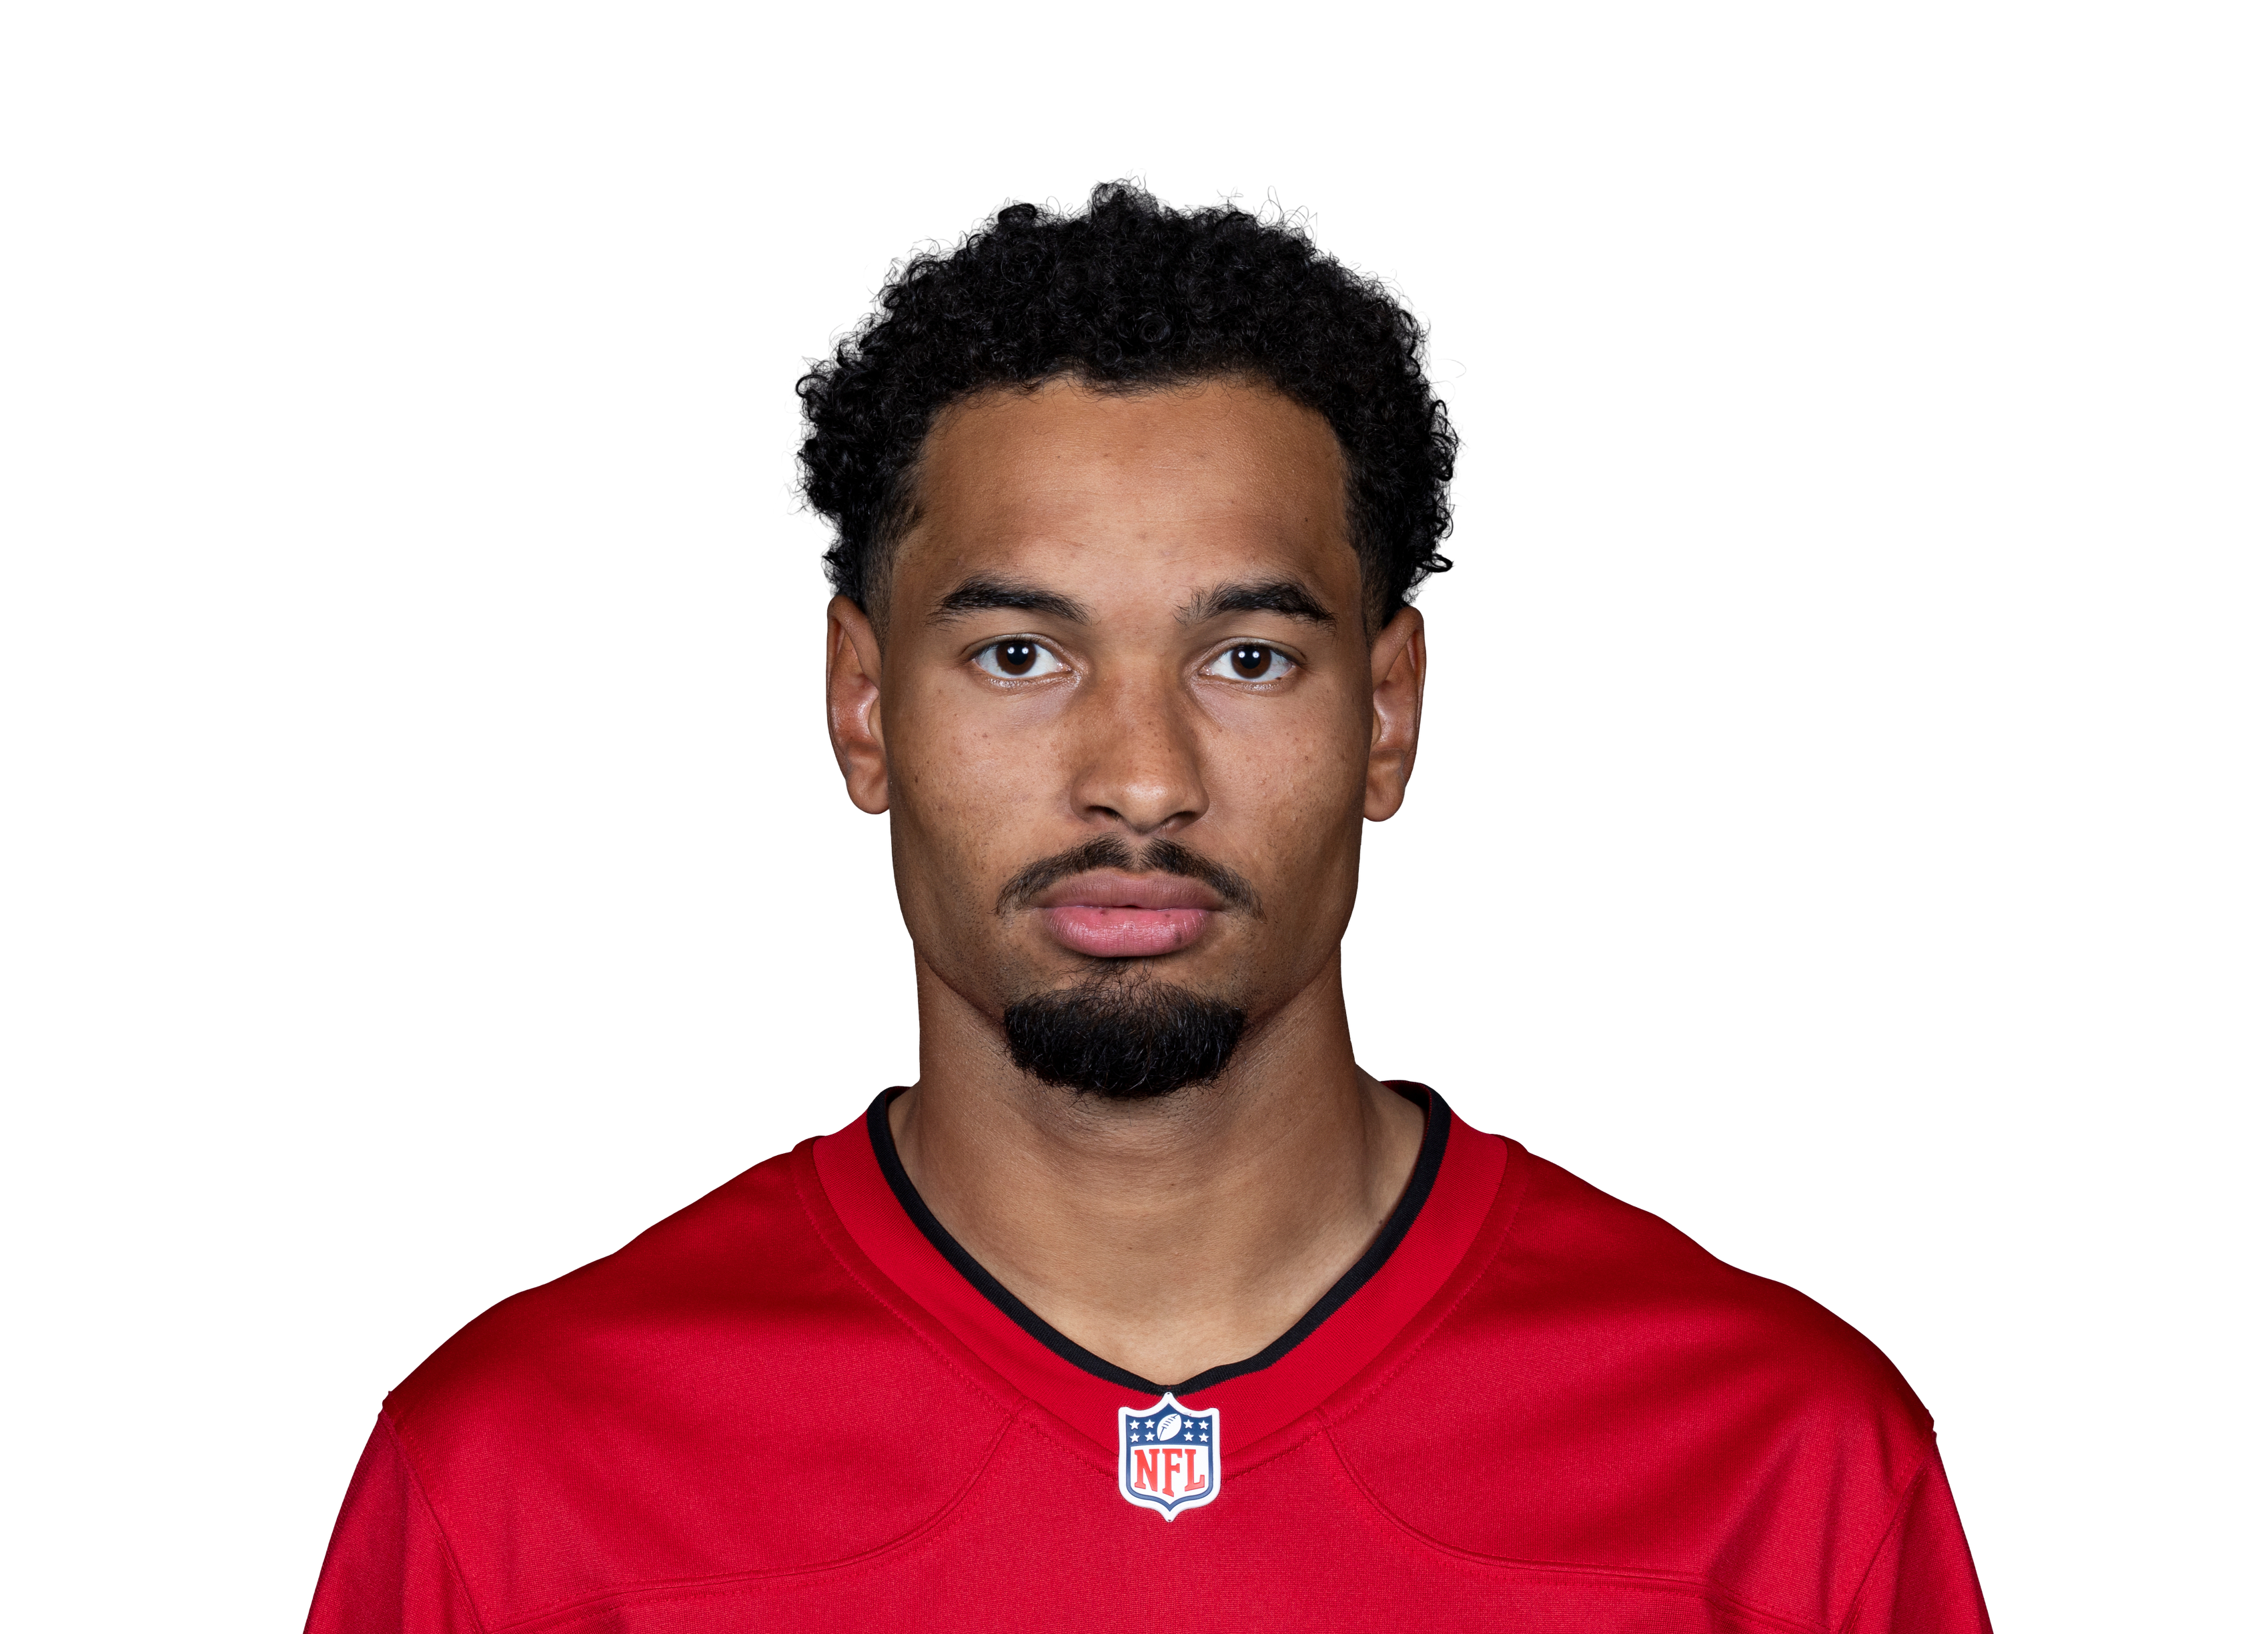 Emeka Egbukavs TB • Wk 1 | 11.3 | 6 | 5 | 63 | 0 | 0 |
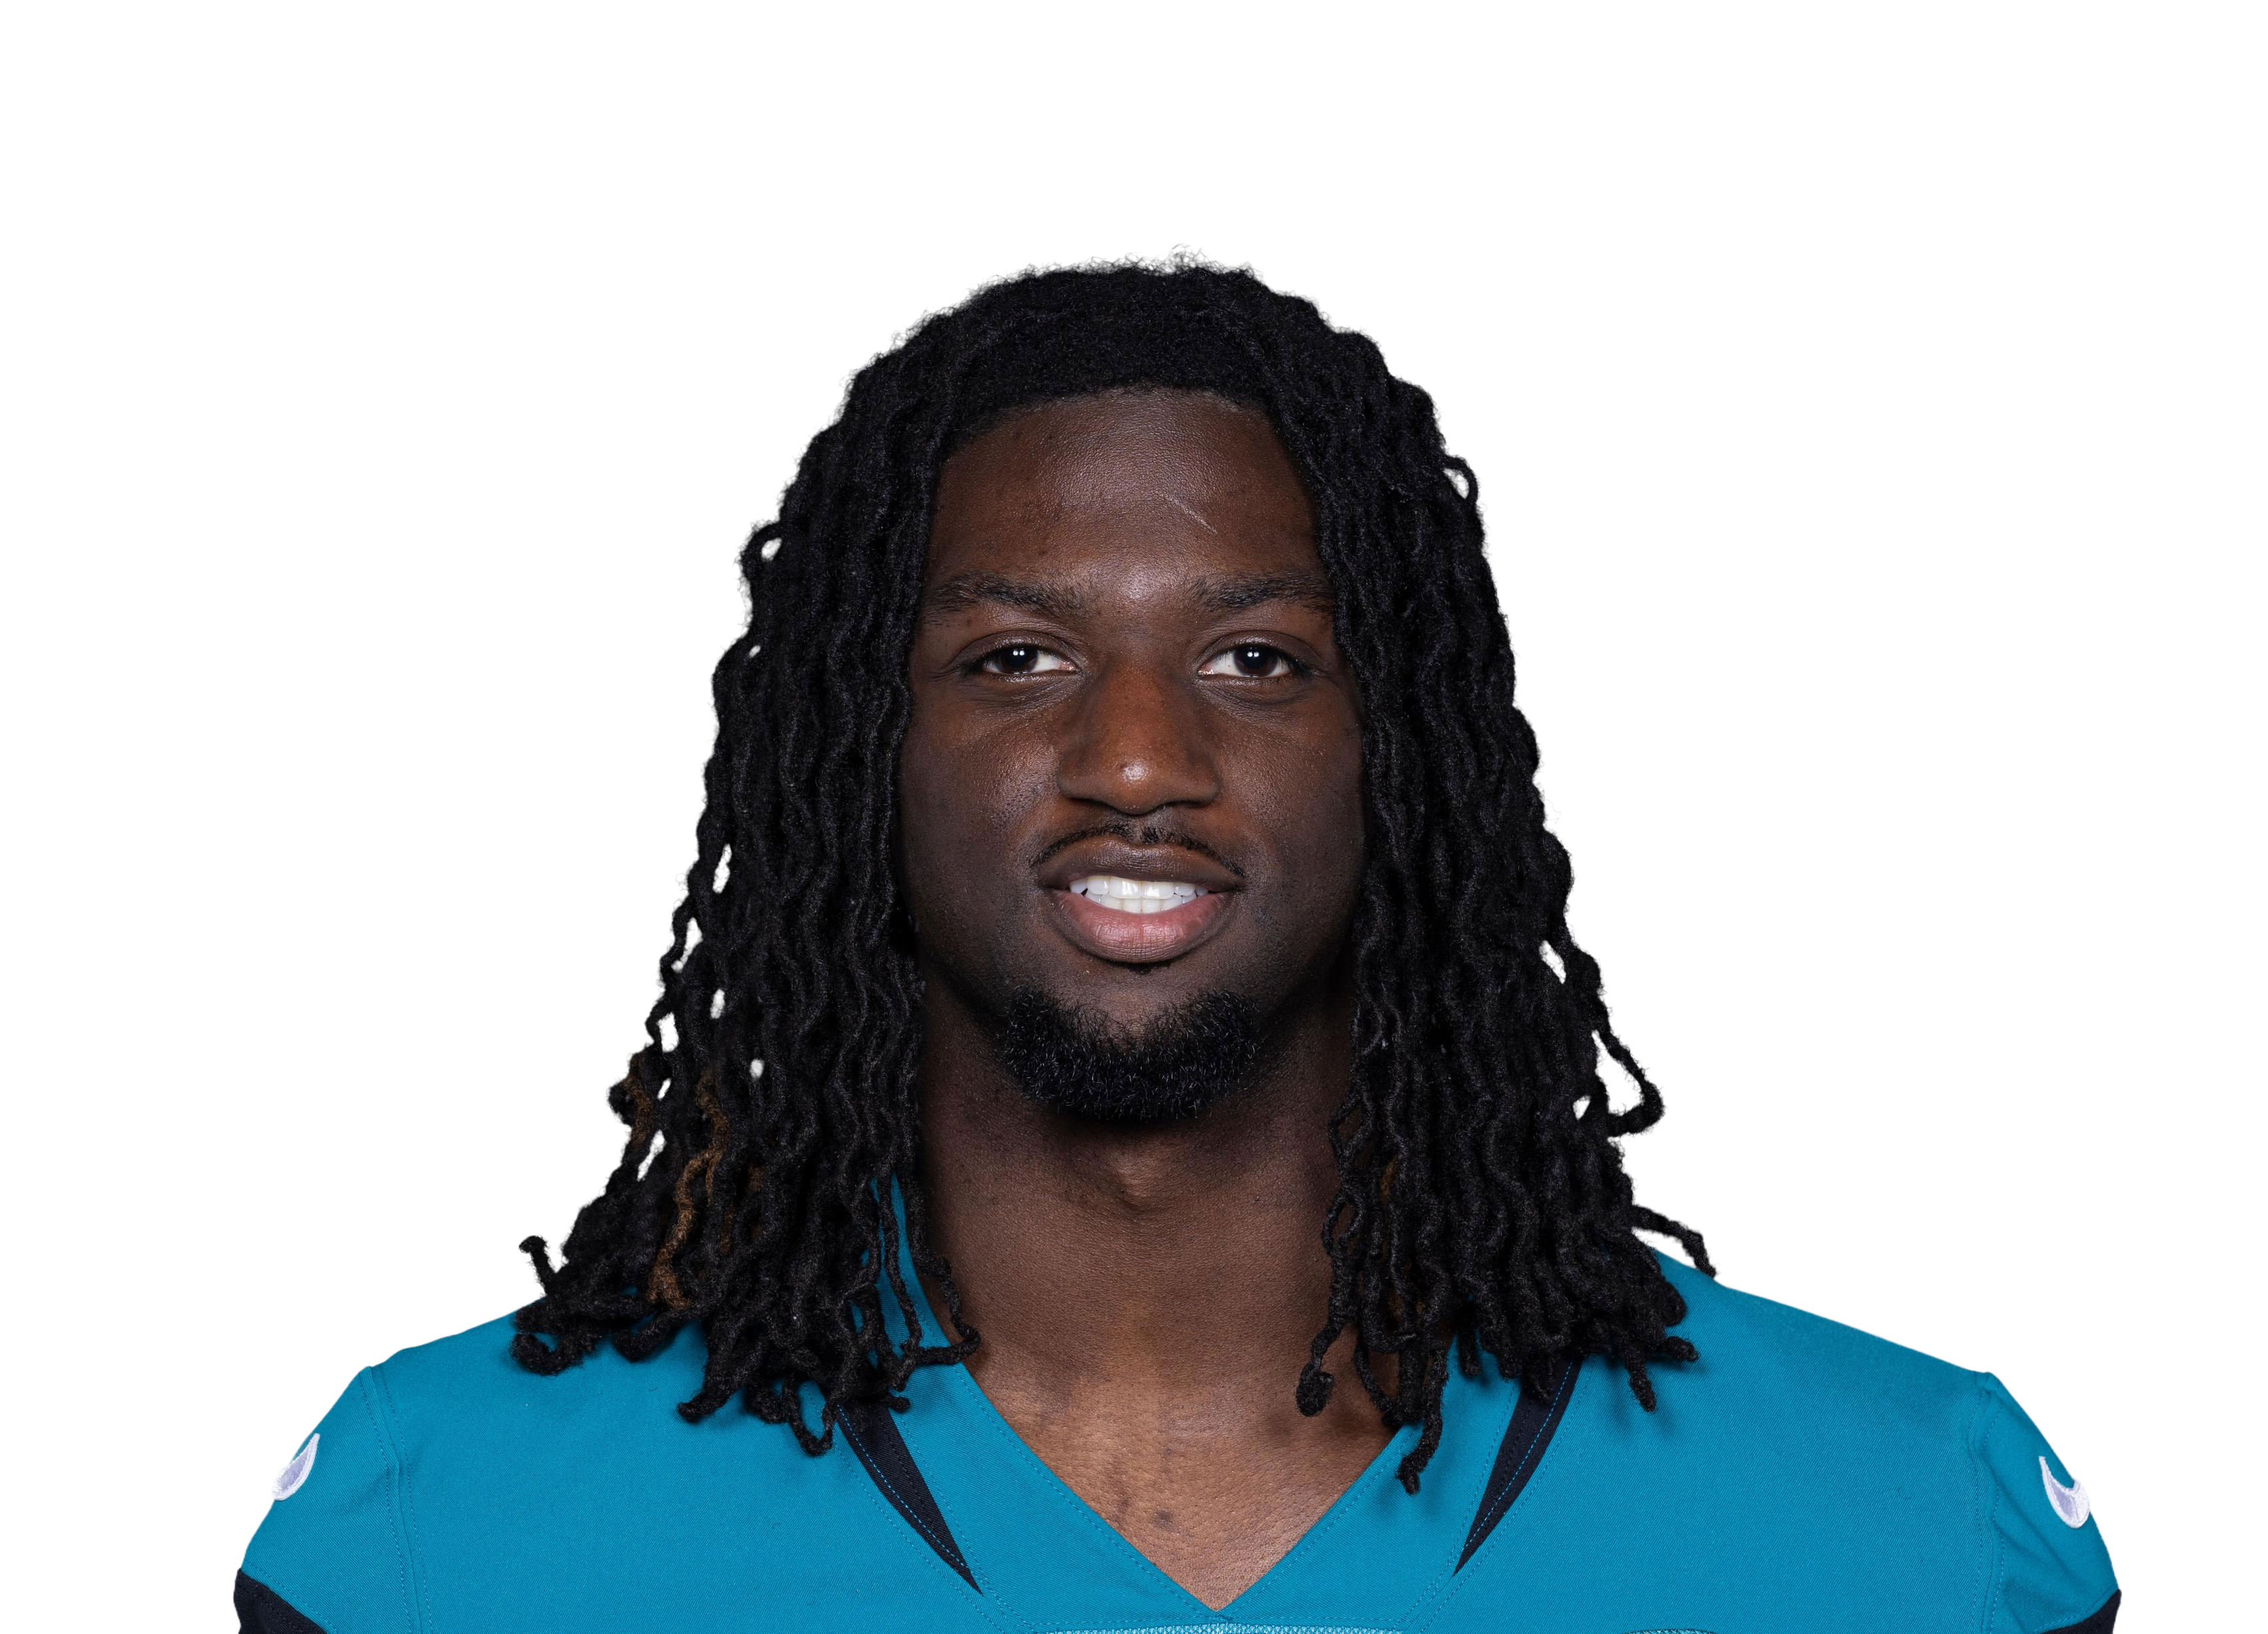 Brian Thomas Jr.vs JAX • Wk 4 | 9.7 | 2 | 2 | 17 | 1 | 0 |
 Ben Skowronek@ PIT • Wk 3 | 9.3 | 1 | 1 | 23 | 1 | 0 |
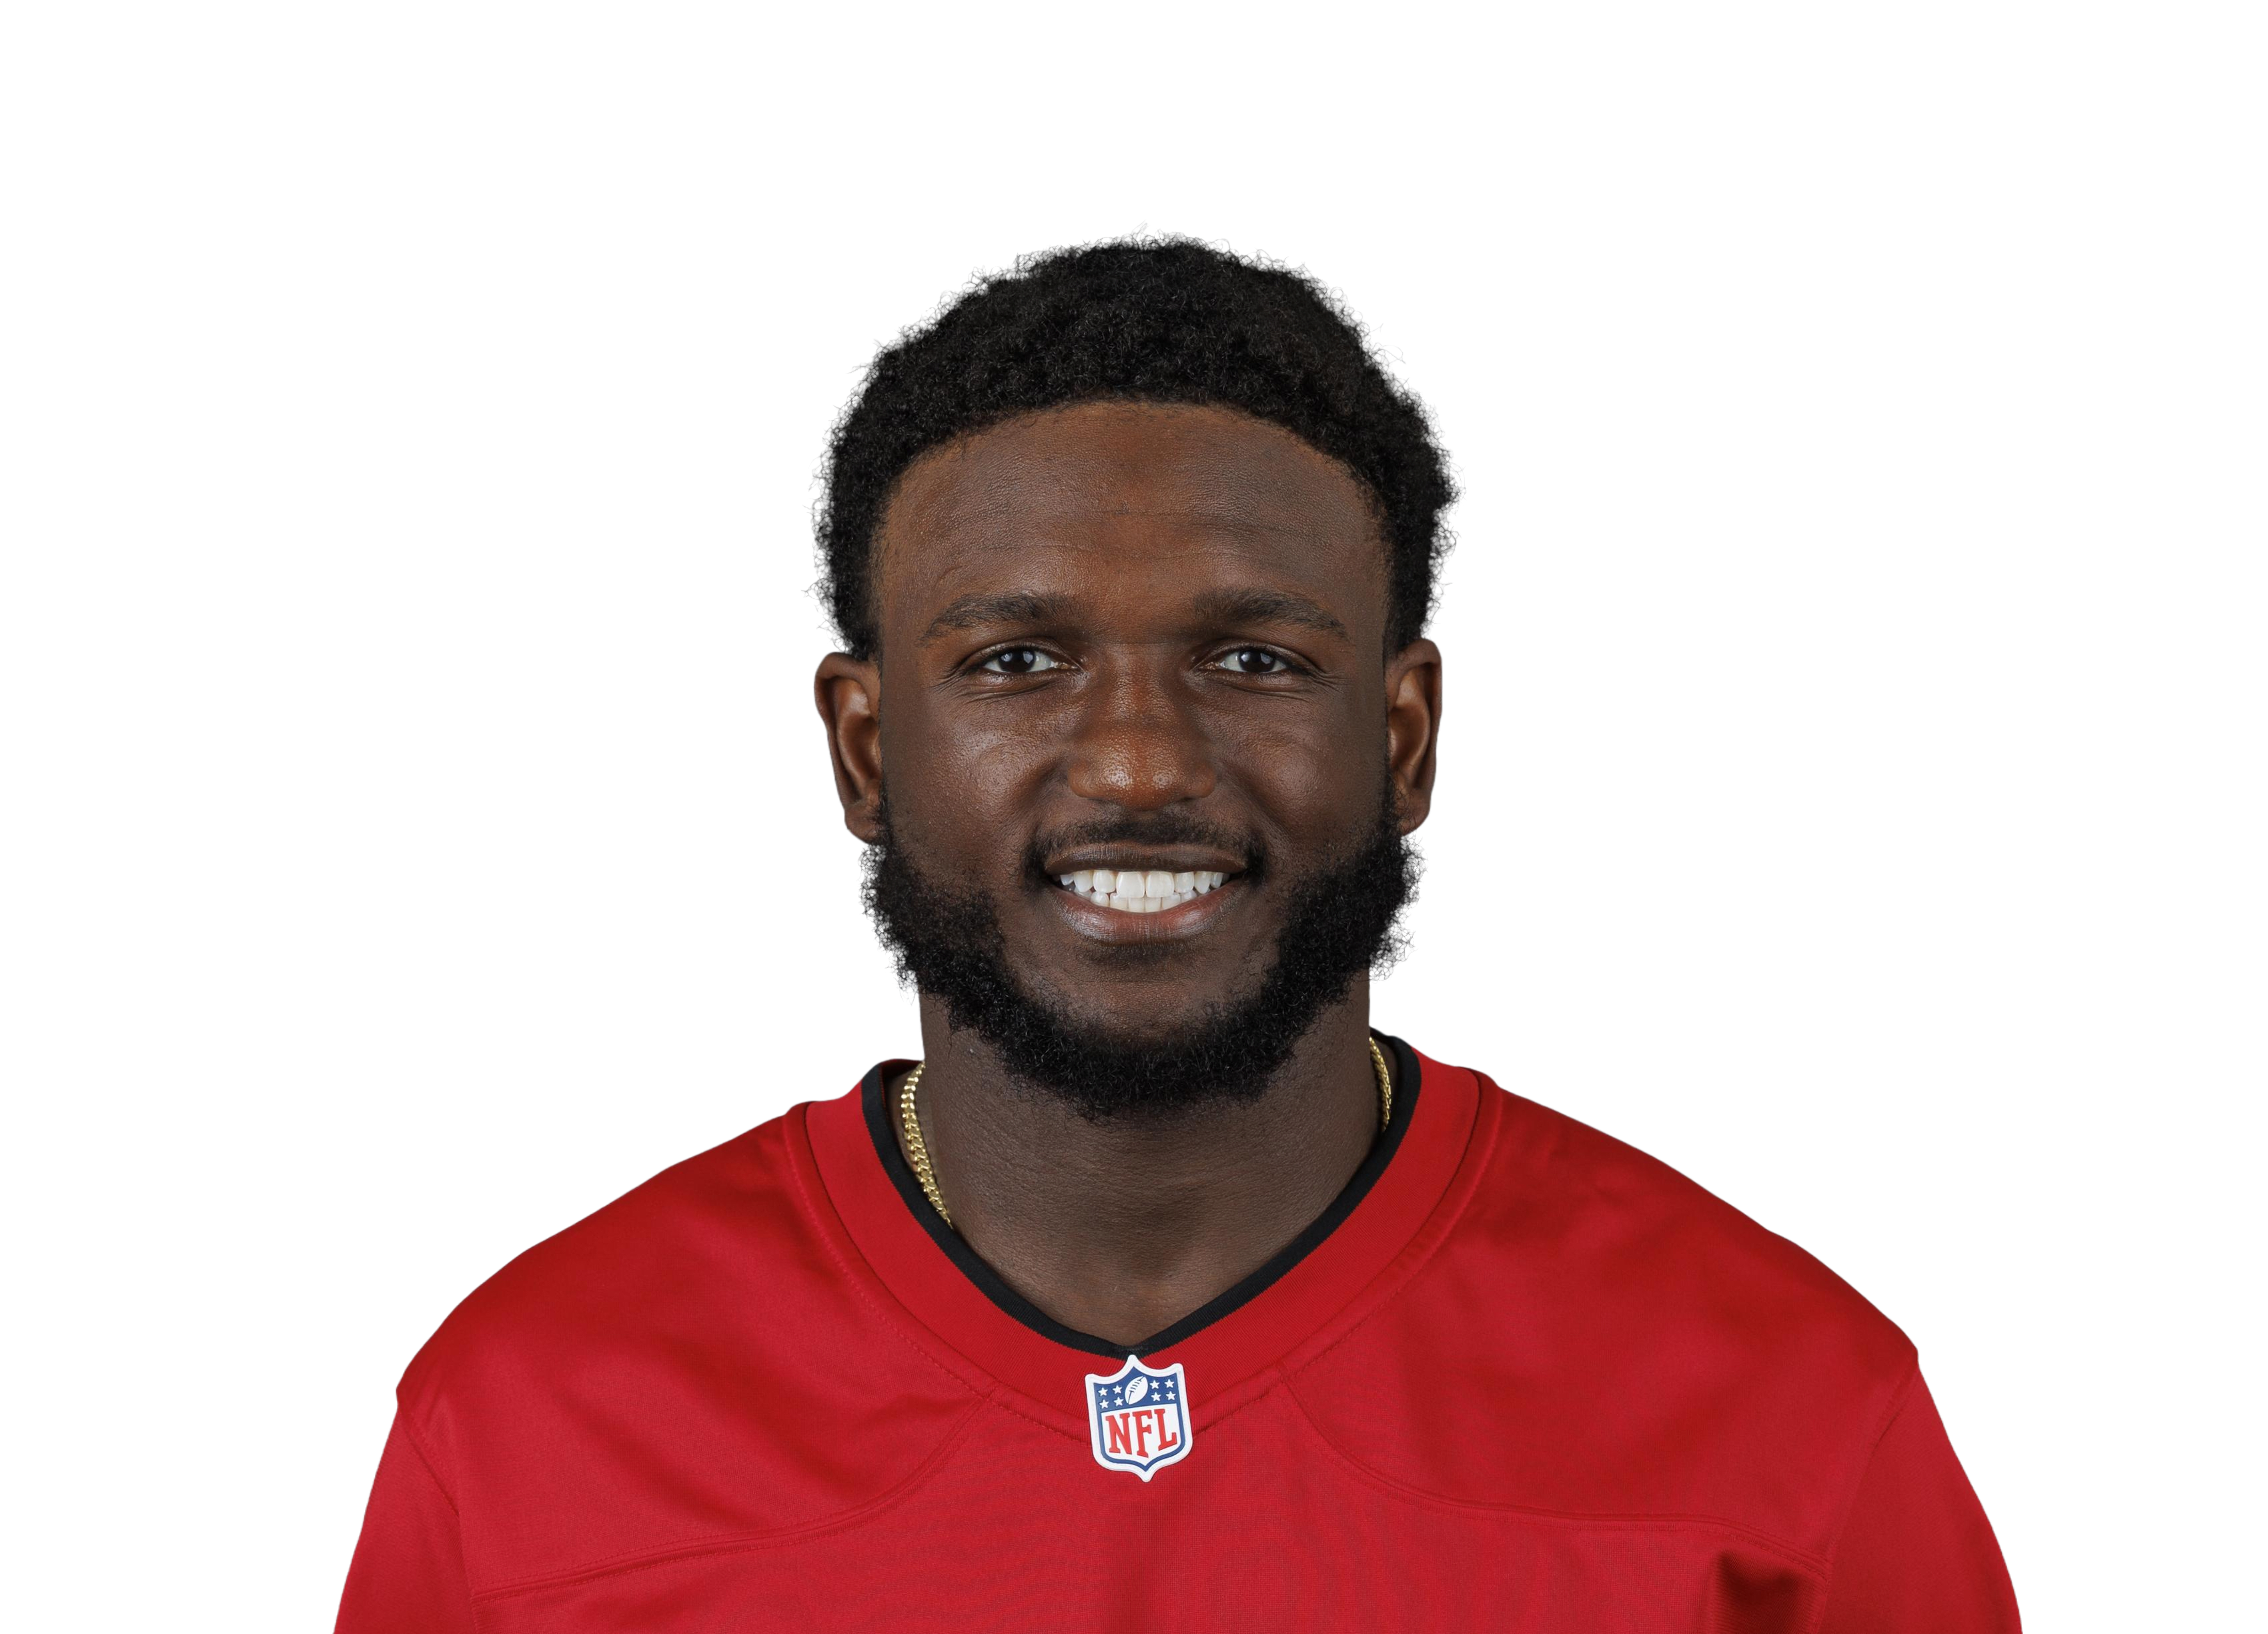 Chris Godwin Jr.vs TB • Wk 1 | 8.3 | 4 | 4 | 40 | 0 | 3 |
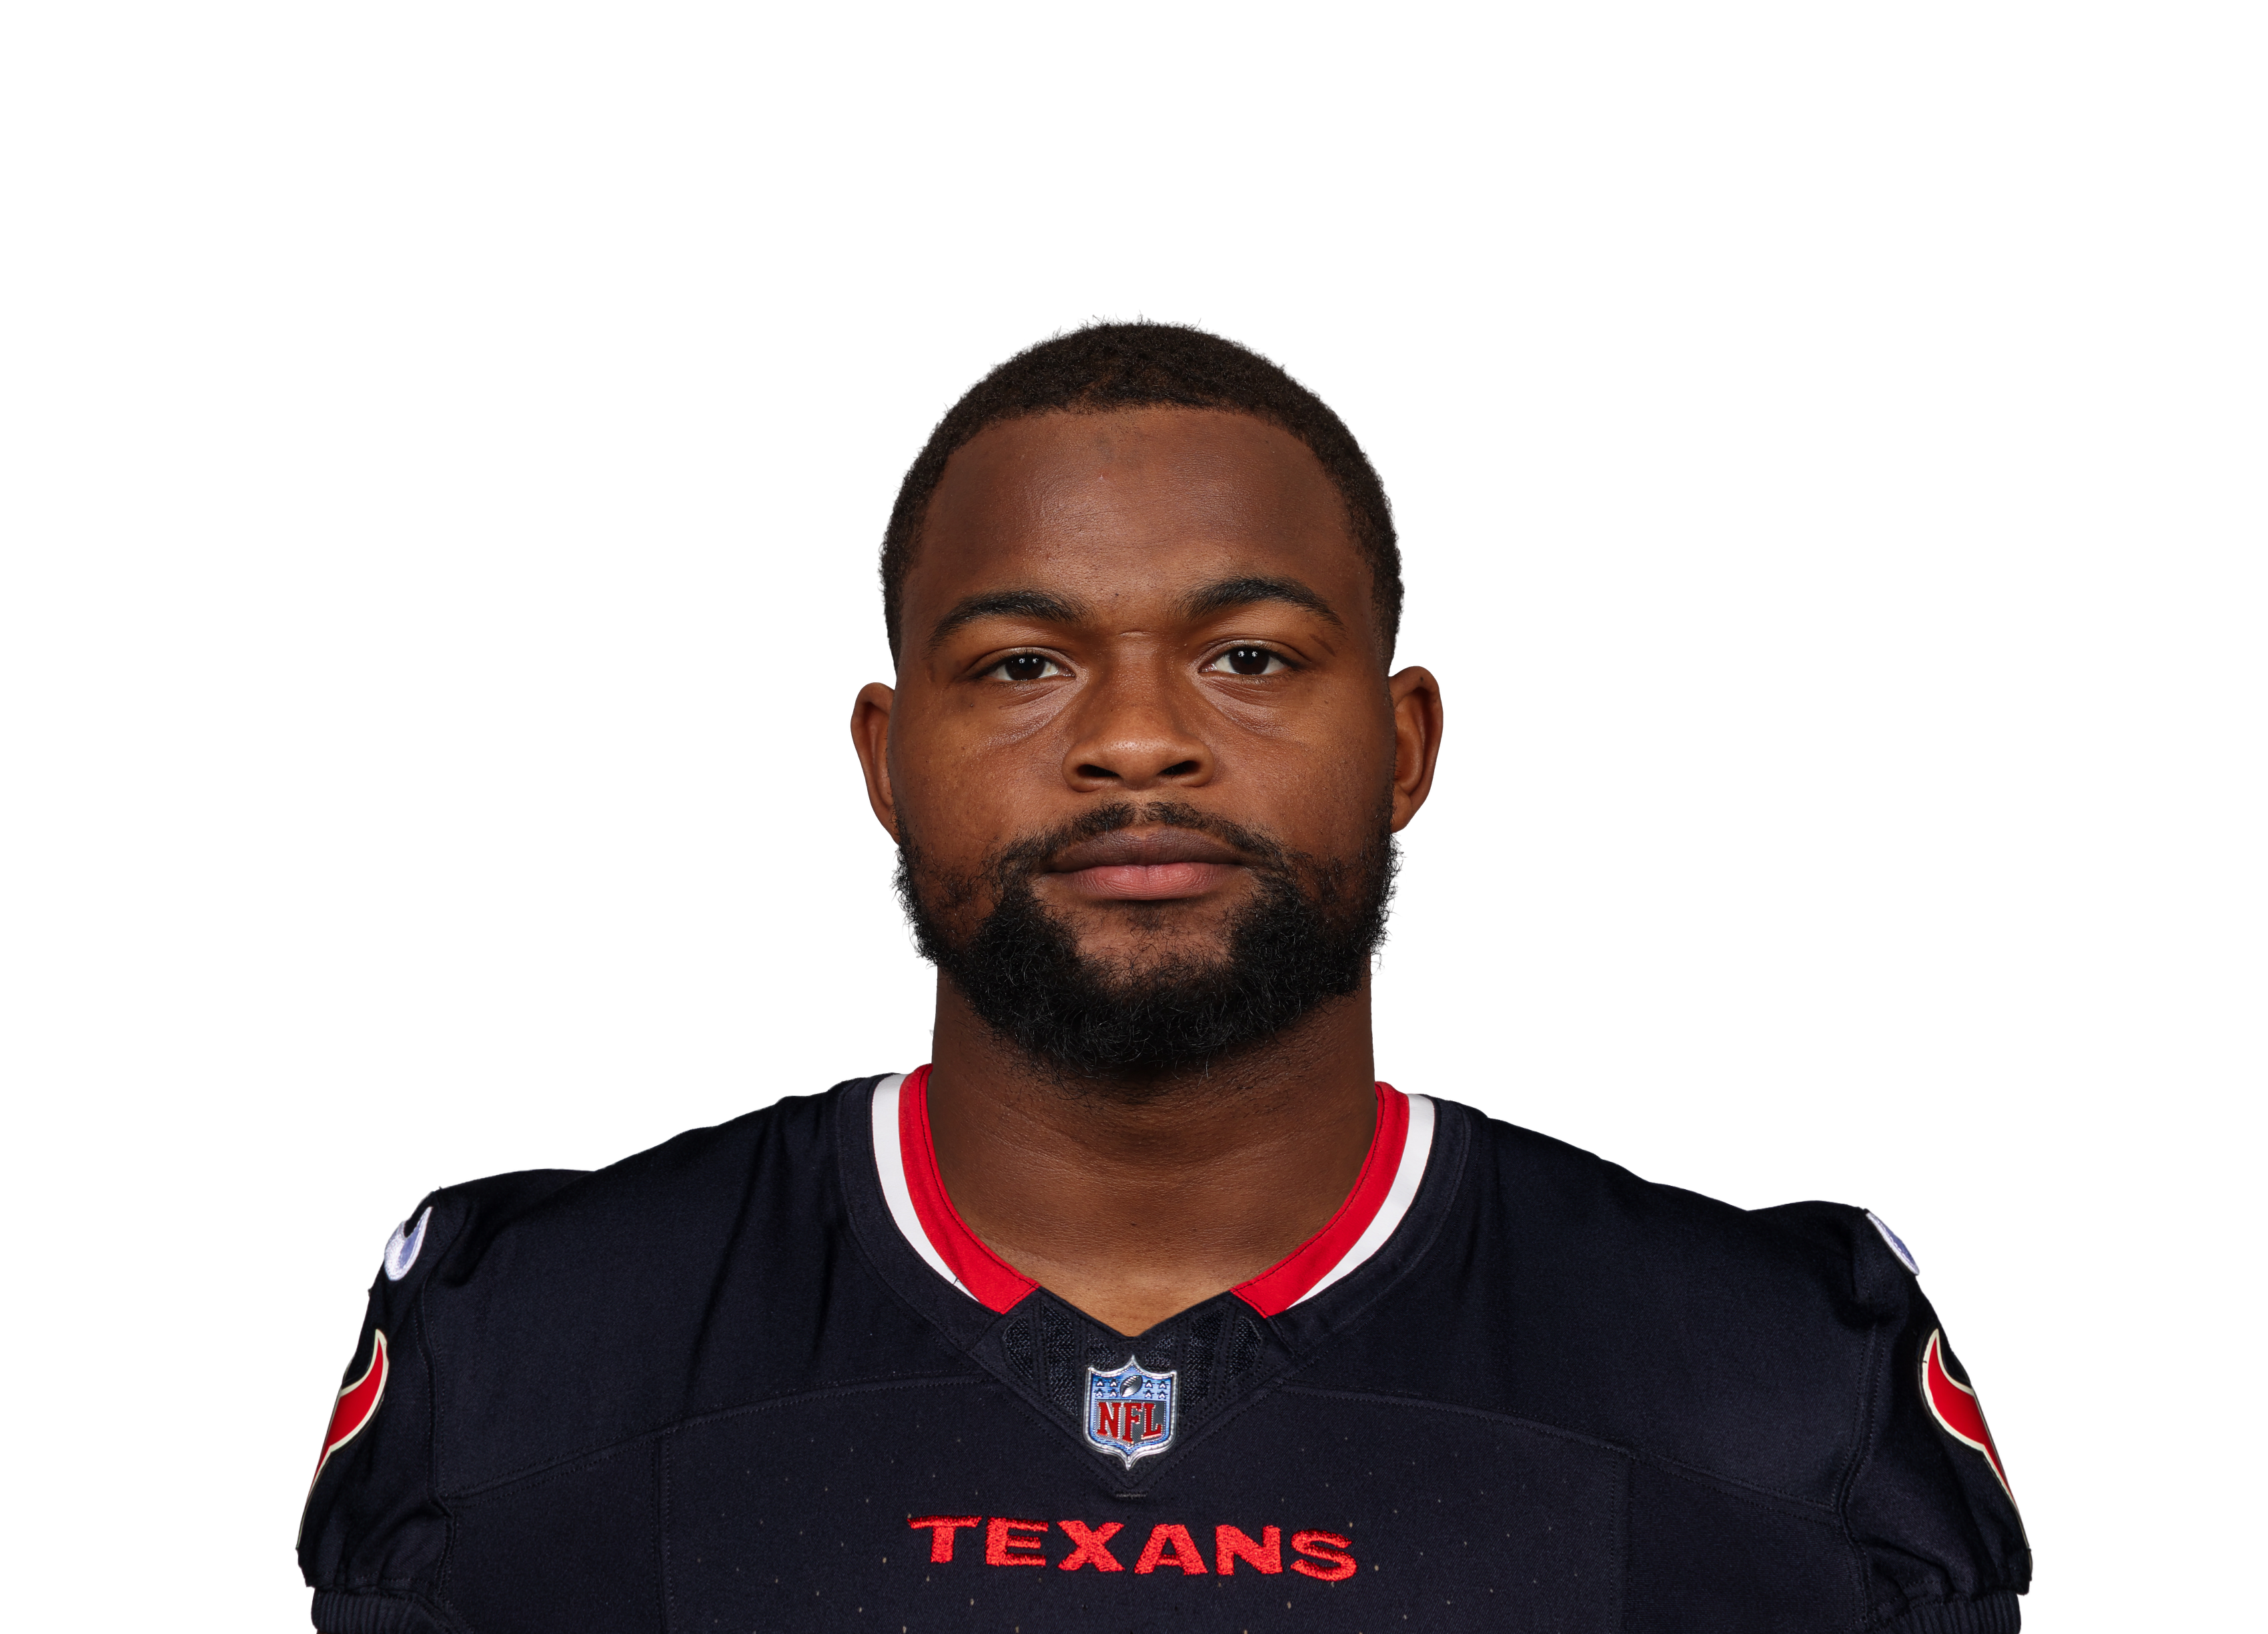 Kayshon Boutte@ HOU • Wk 2 | 6.7 | 5 | 3 | 37 | 0 | 0 |
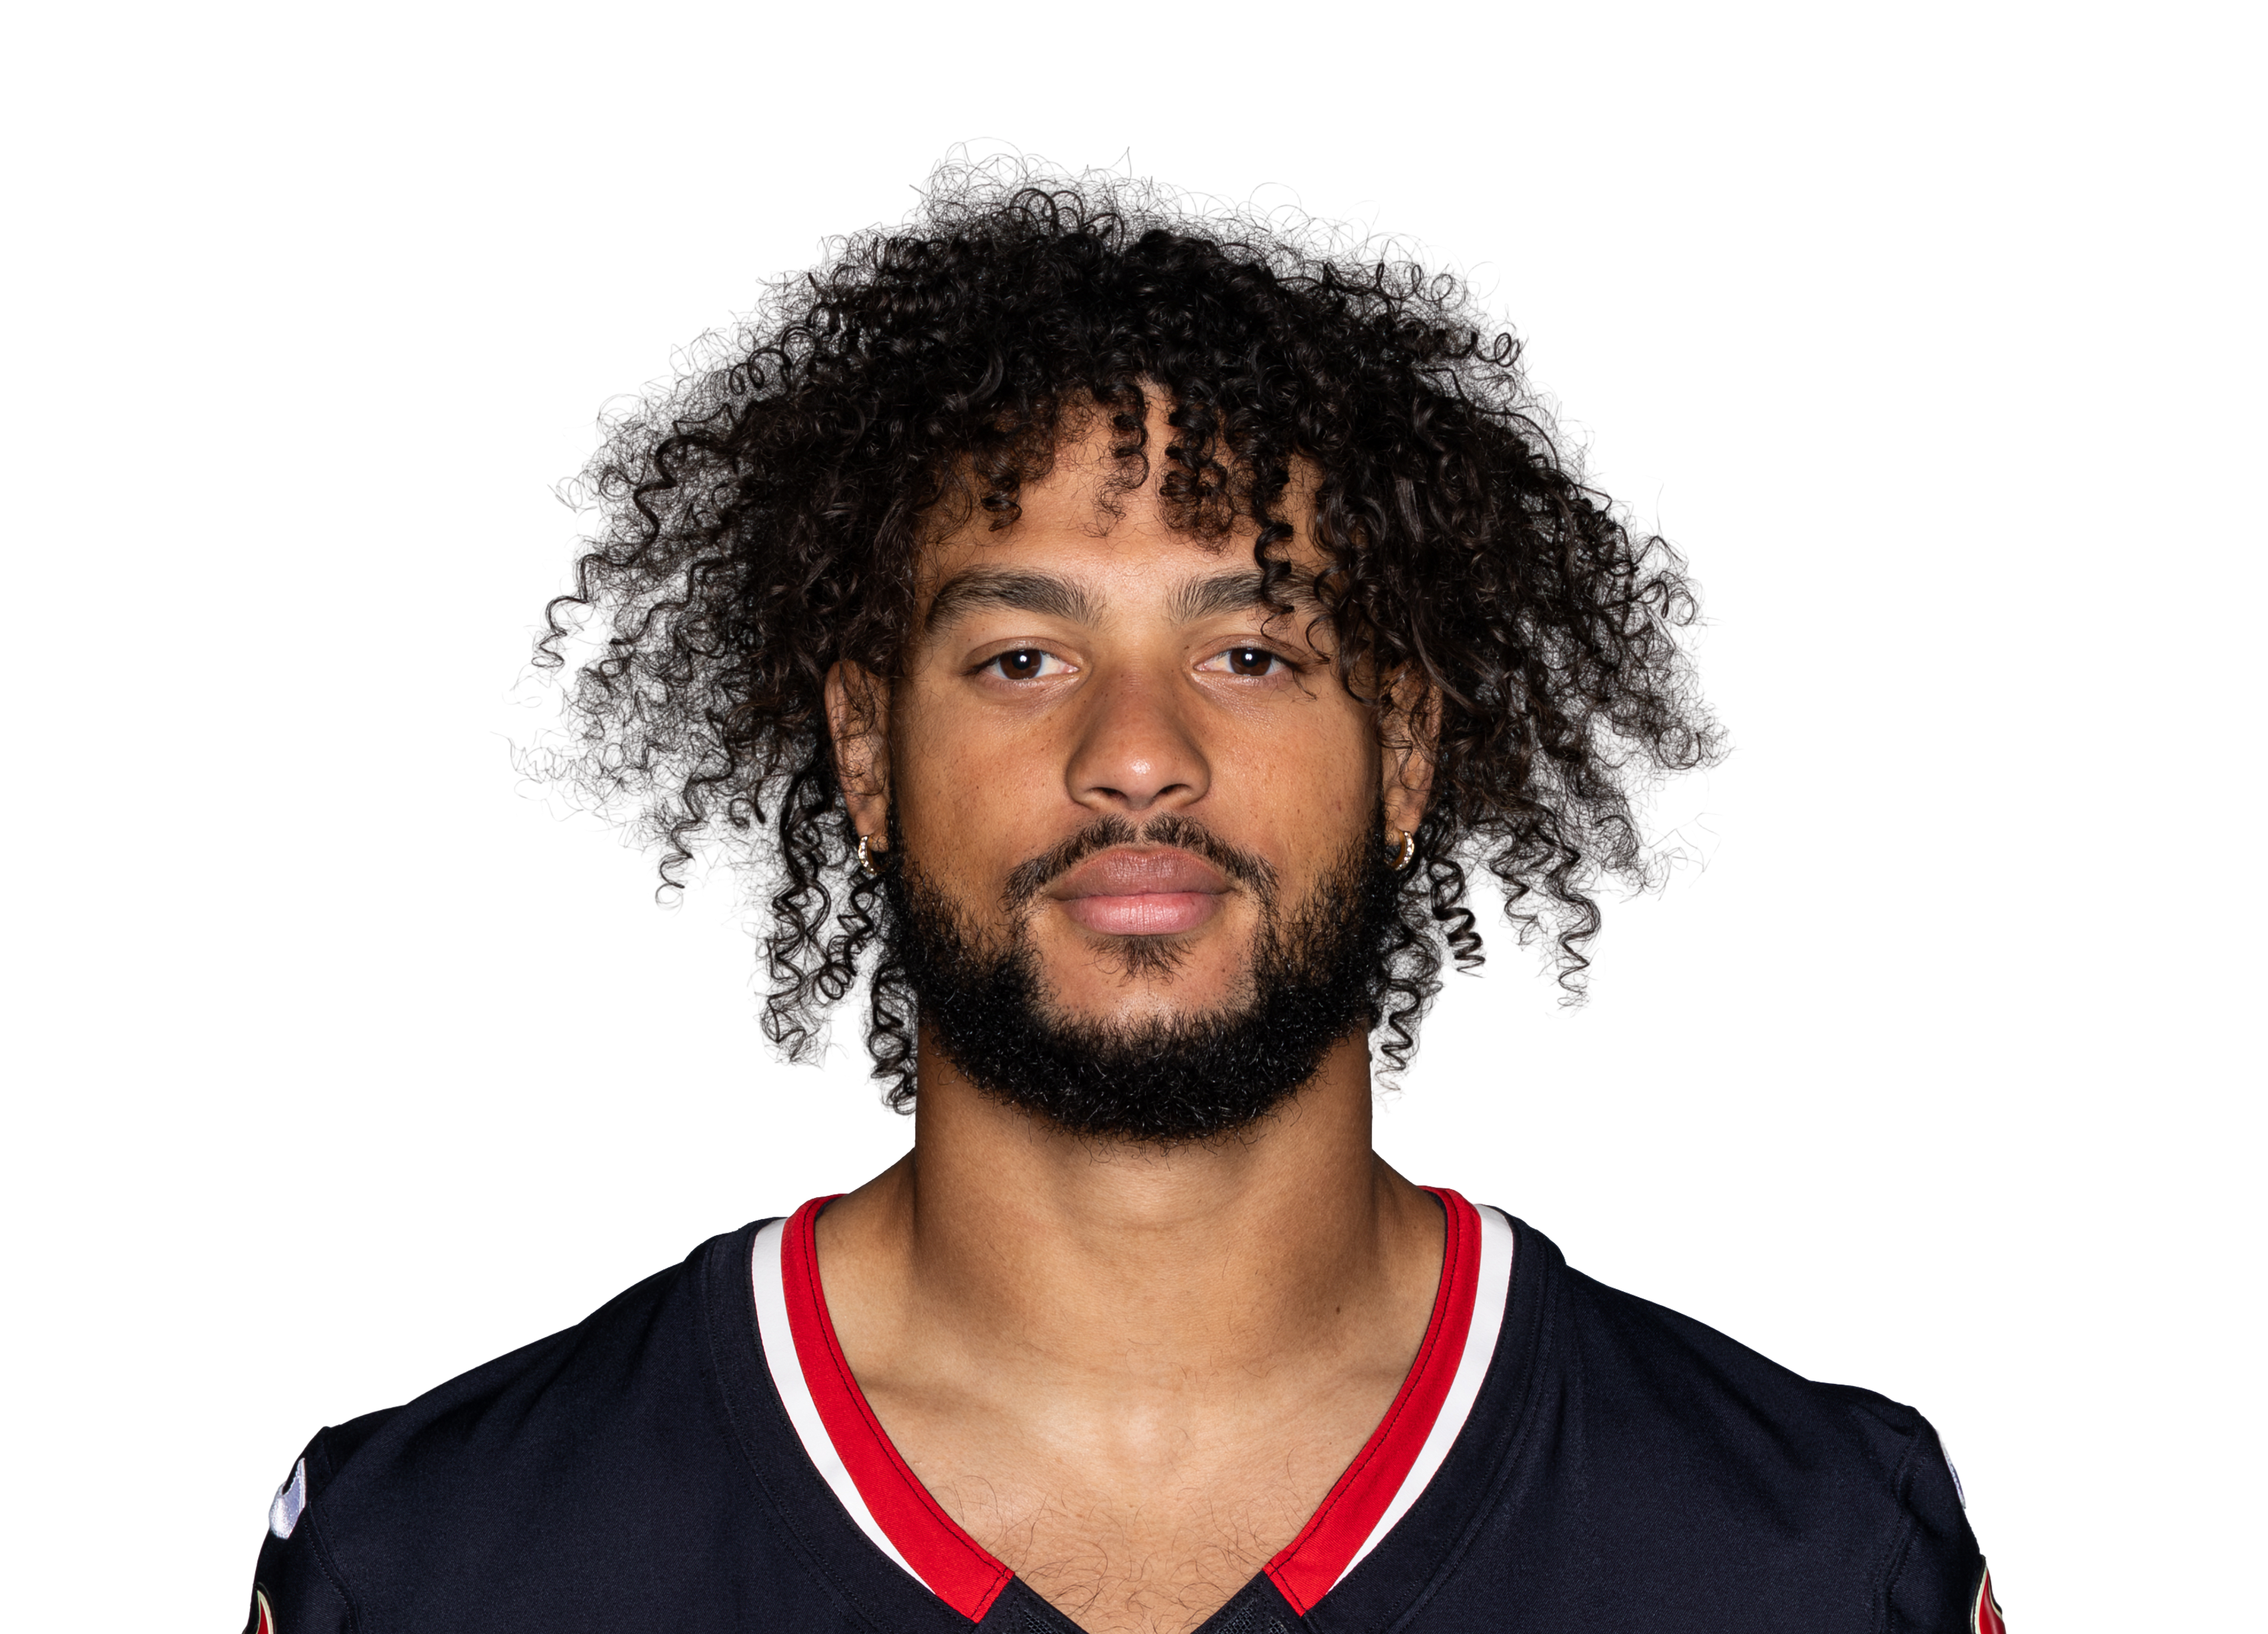 Xavier Hutchinson@ HOU • Wk 2 | 6.7 | 9 | 3 | 37 | 0 | 0 |
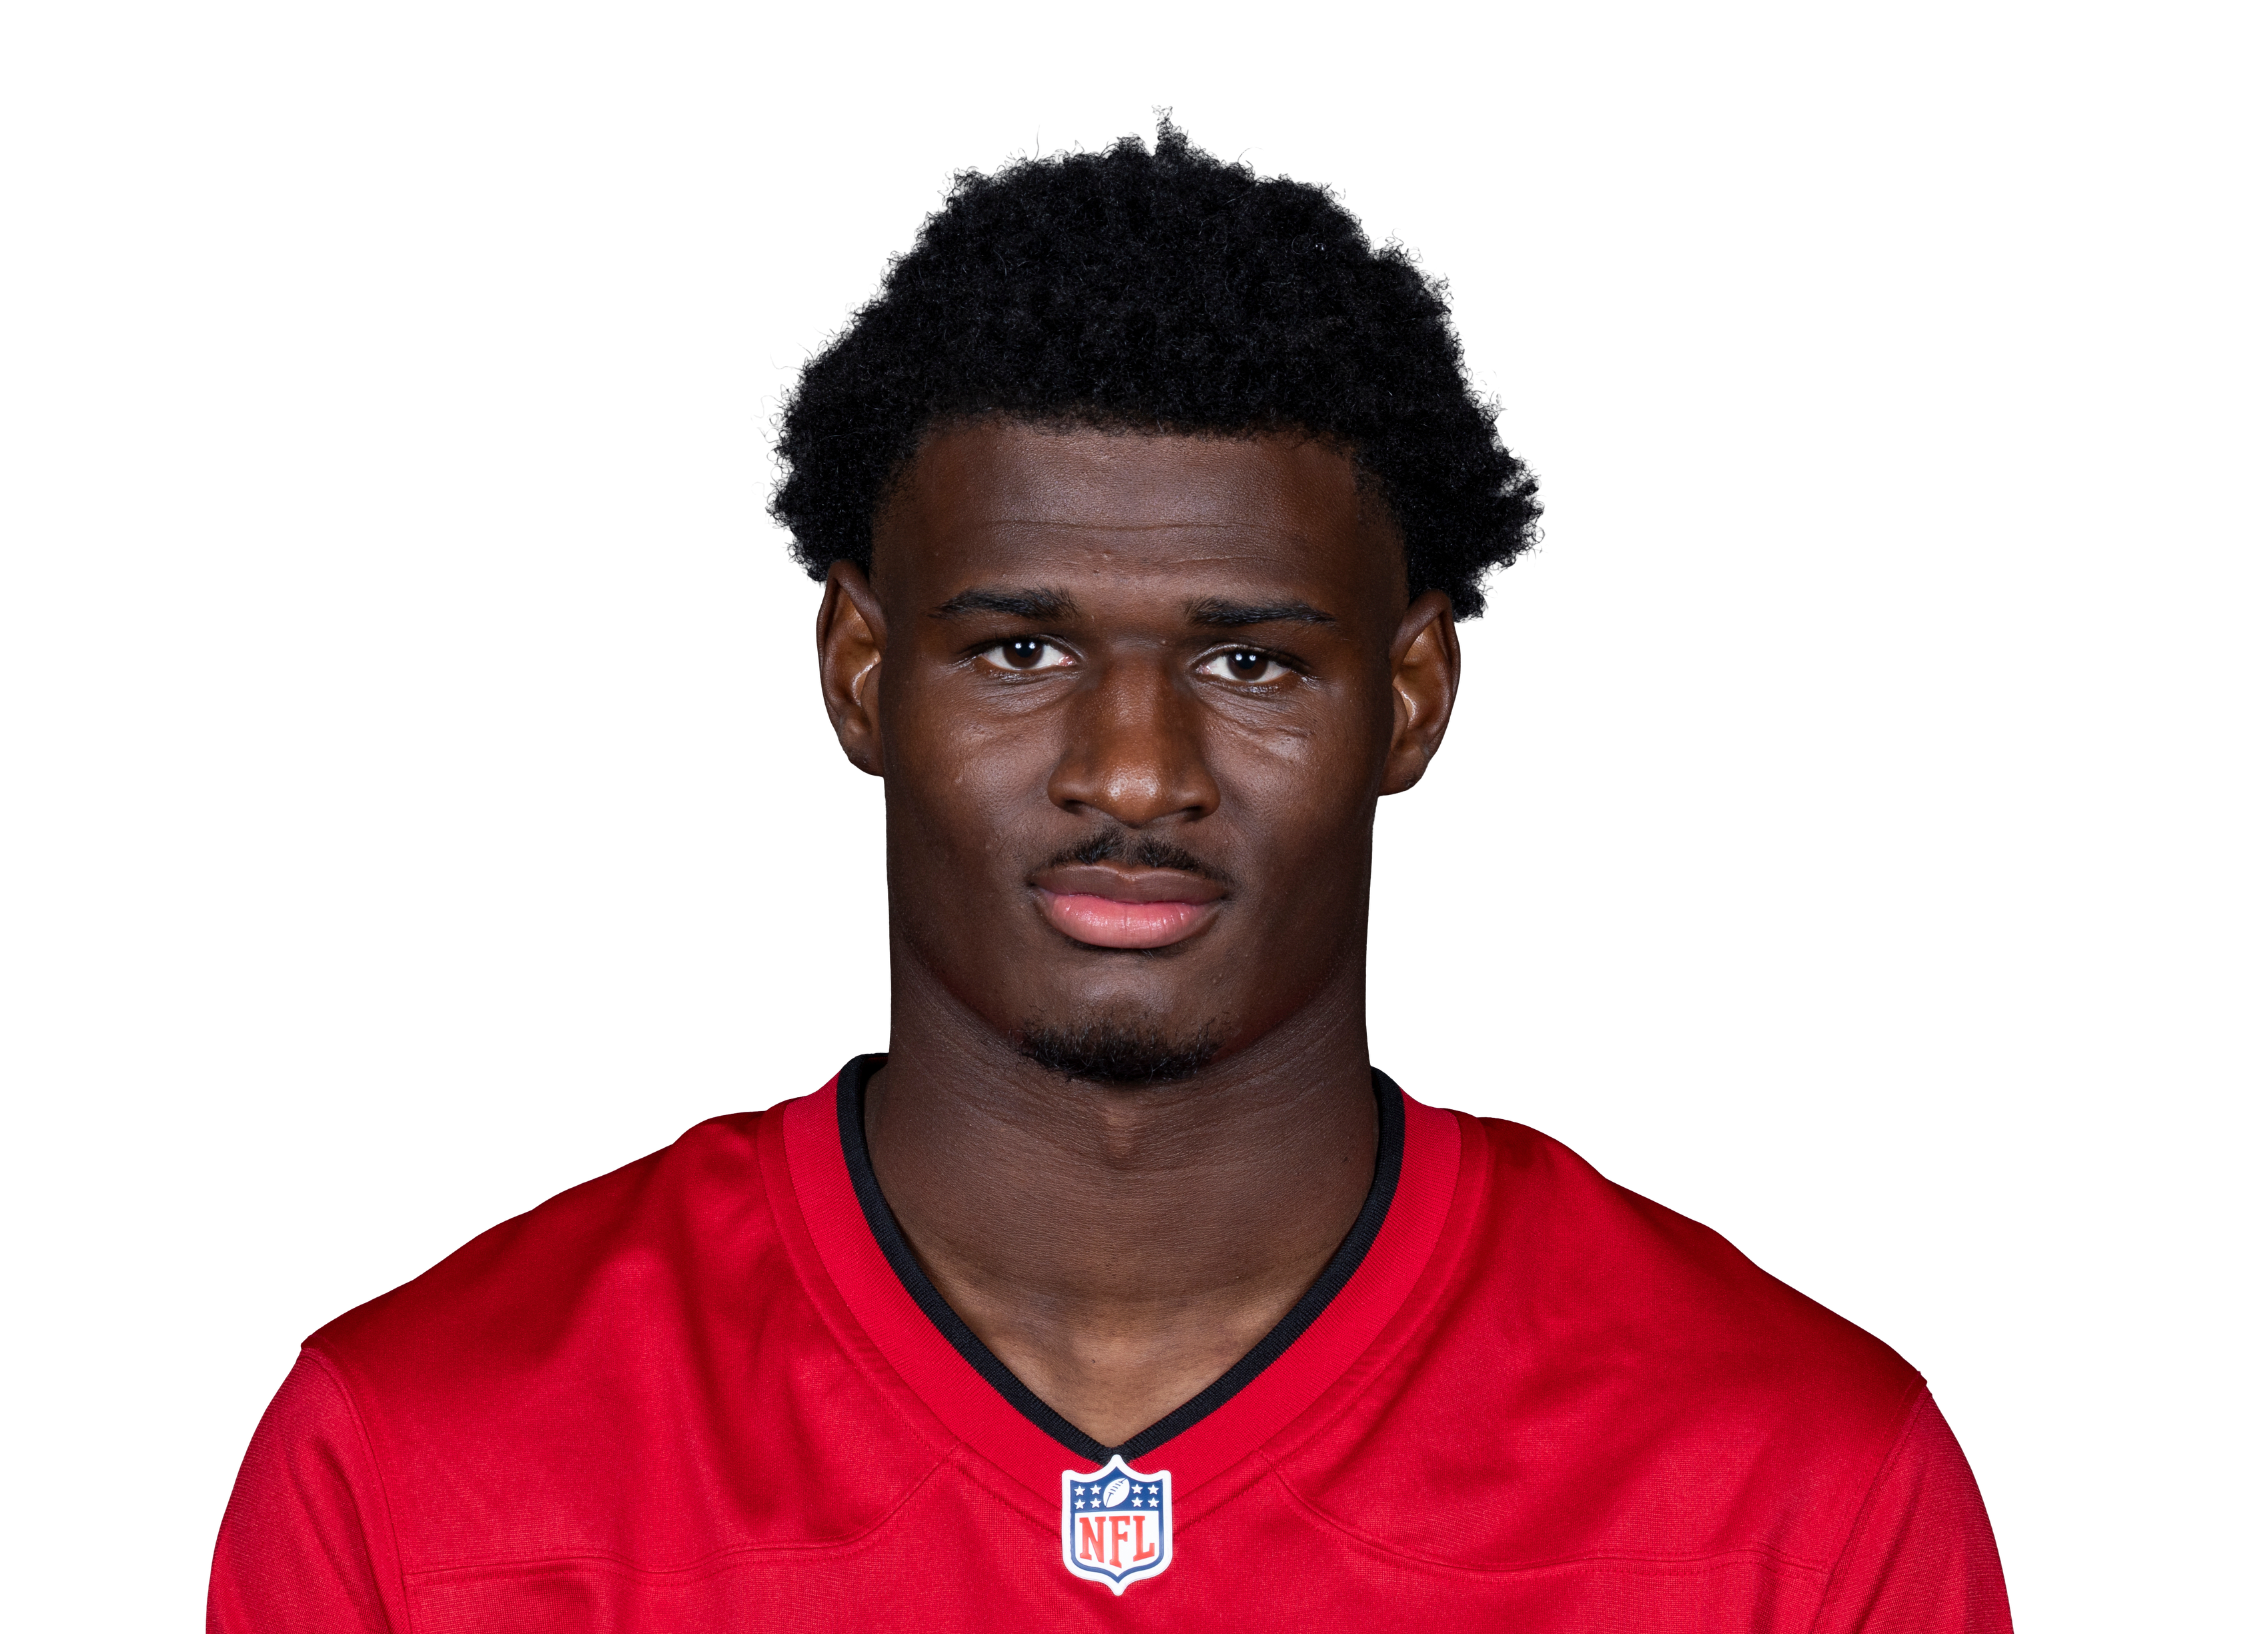 Ted Hurst IIIvs TB • Wk 1 | 6.6 | 3 | 3 | 36 | 0 | 0 |
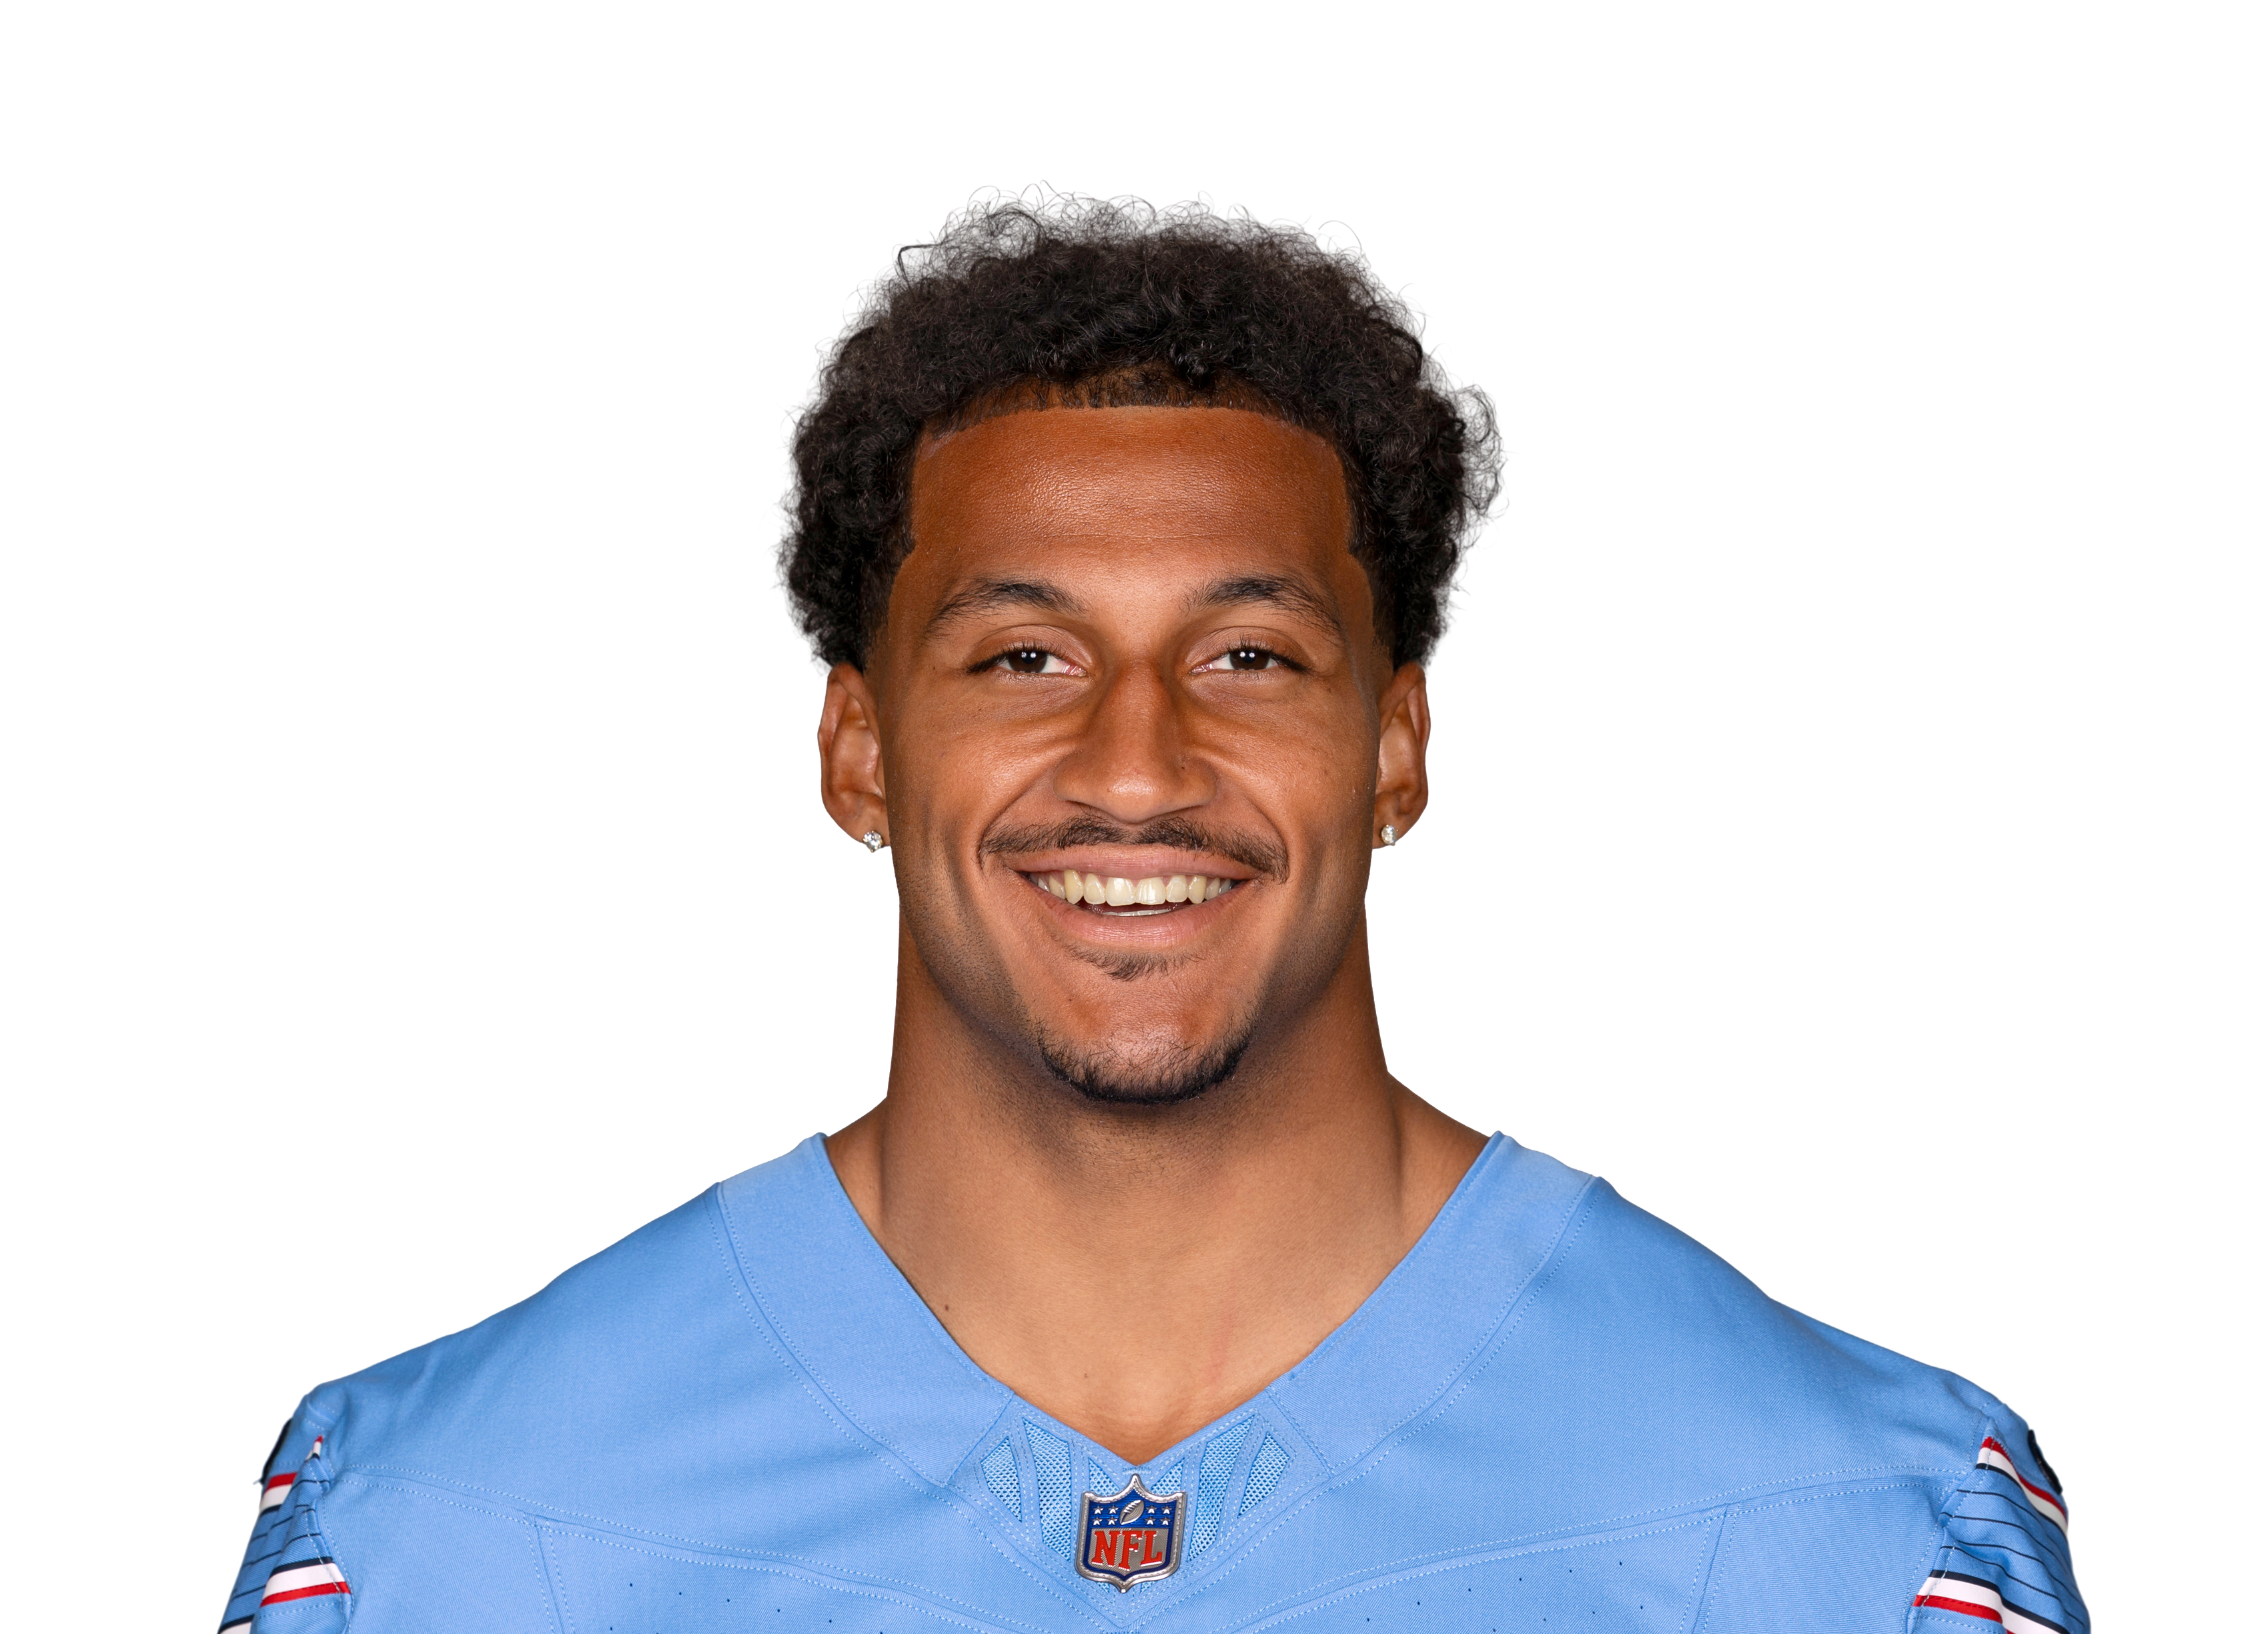 Elic Ayomanorvs TEN • Wk 8 | 6.4 | 5 | 3 | 34 | 0 | 0 |
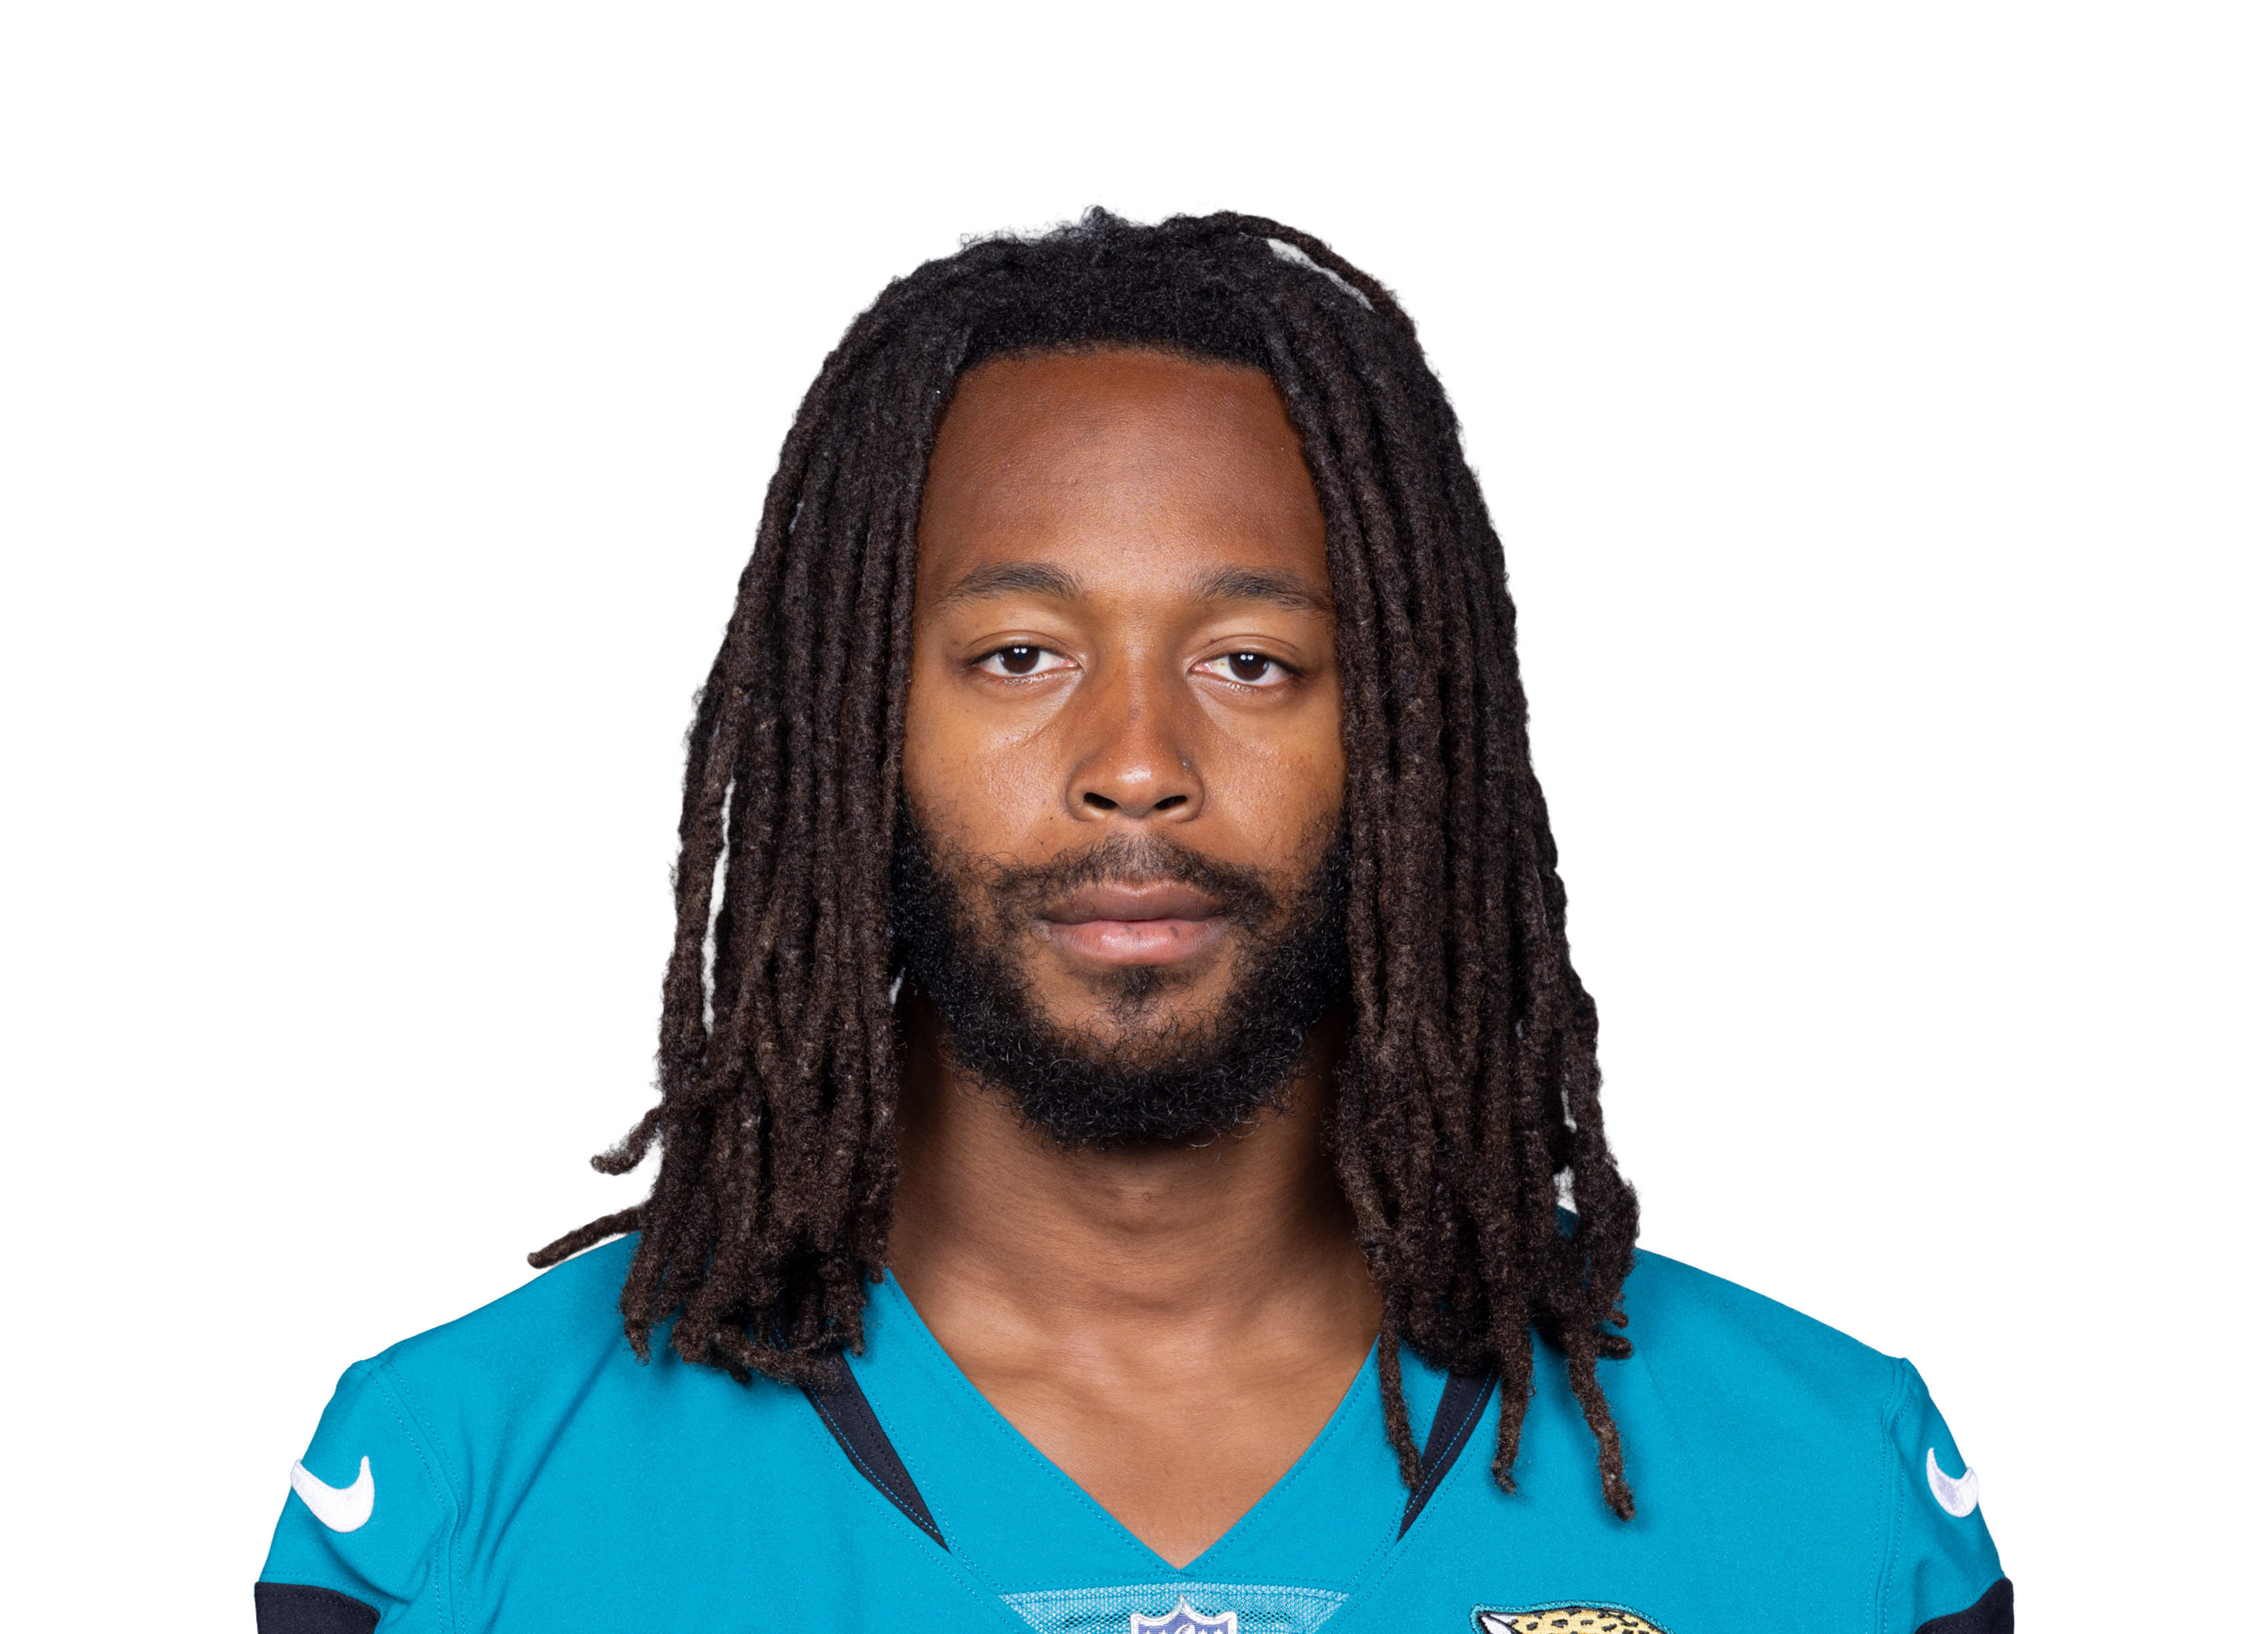 Jakobi Meyersvs JAX • Wk 4 | 6.3 | 4 | 3 | 33 | 0 | 0 |
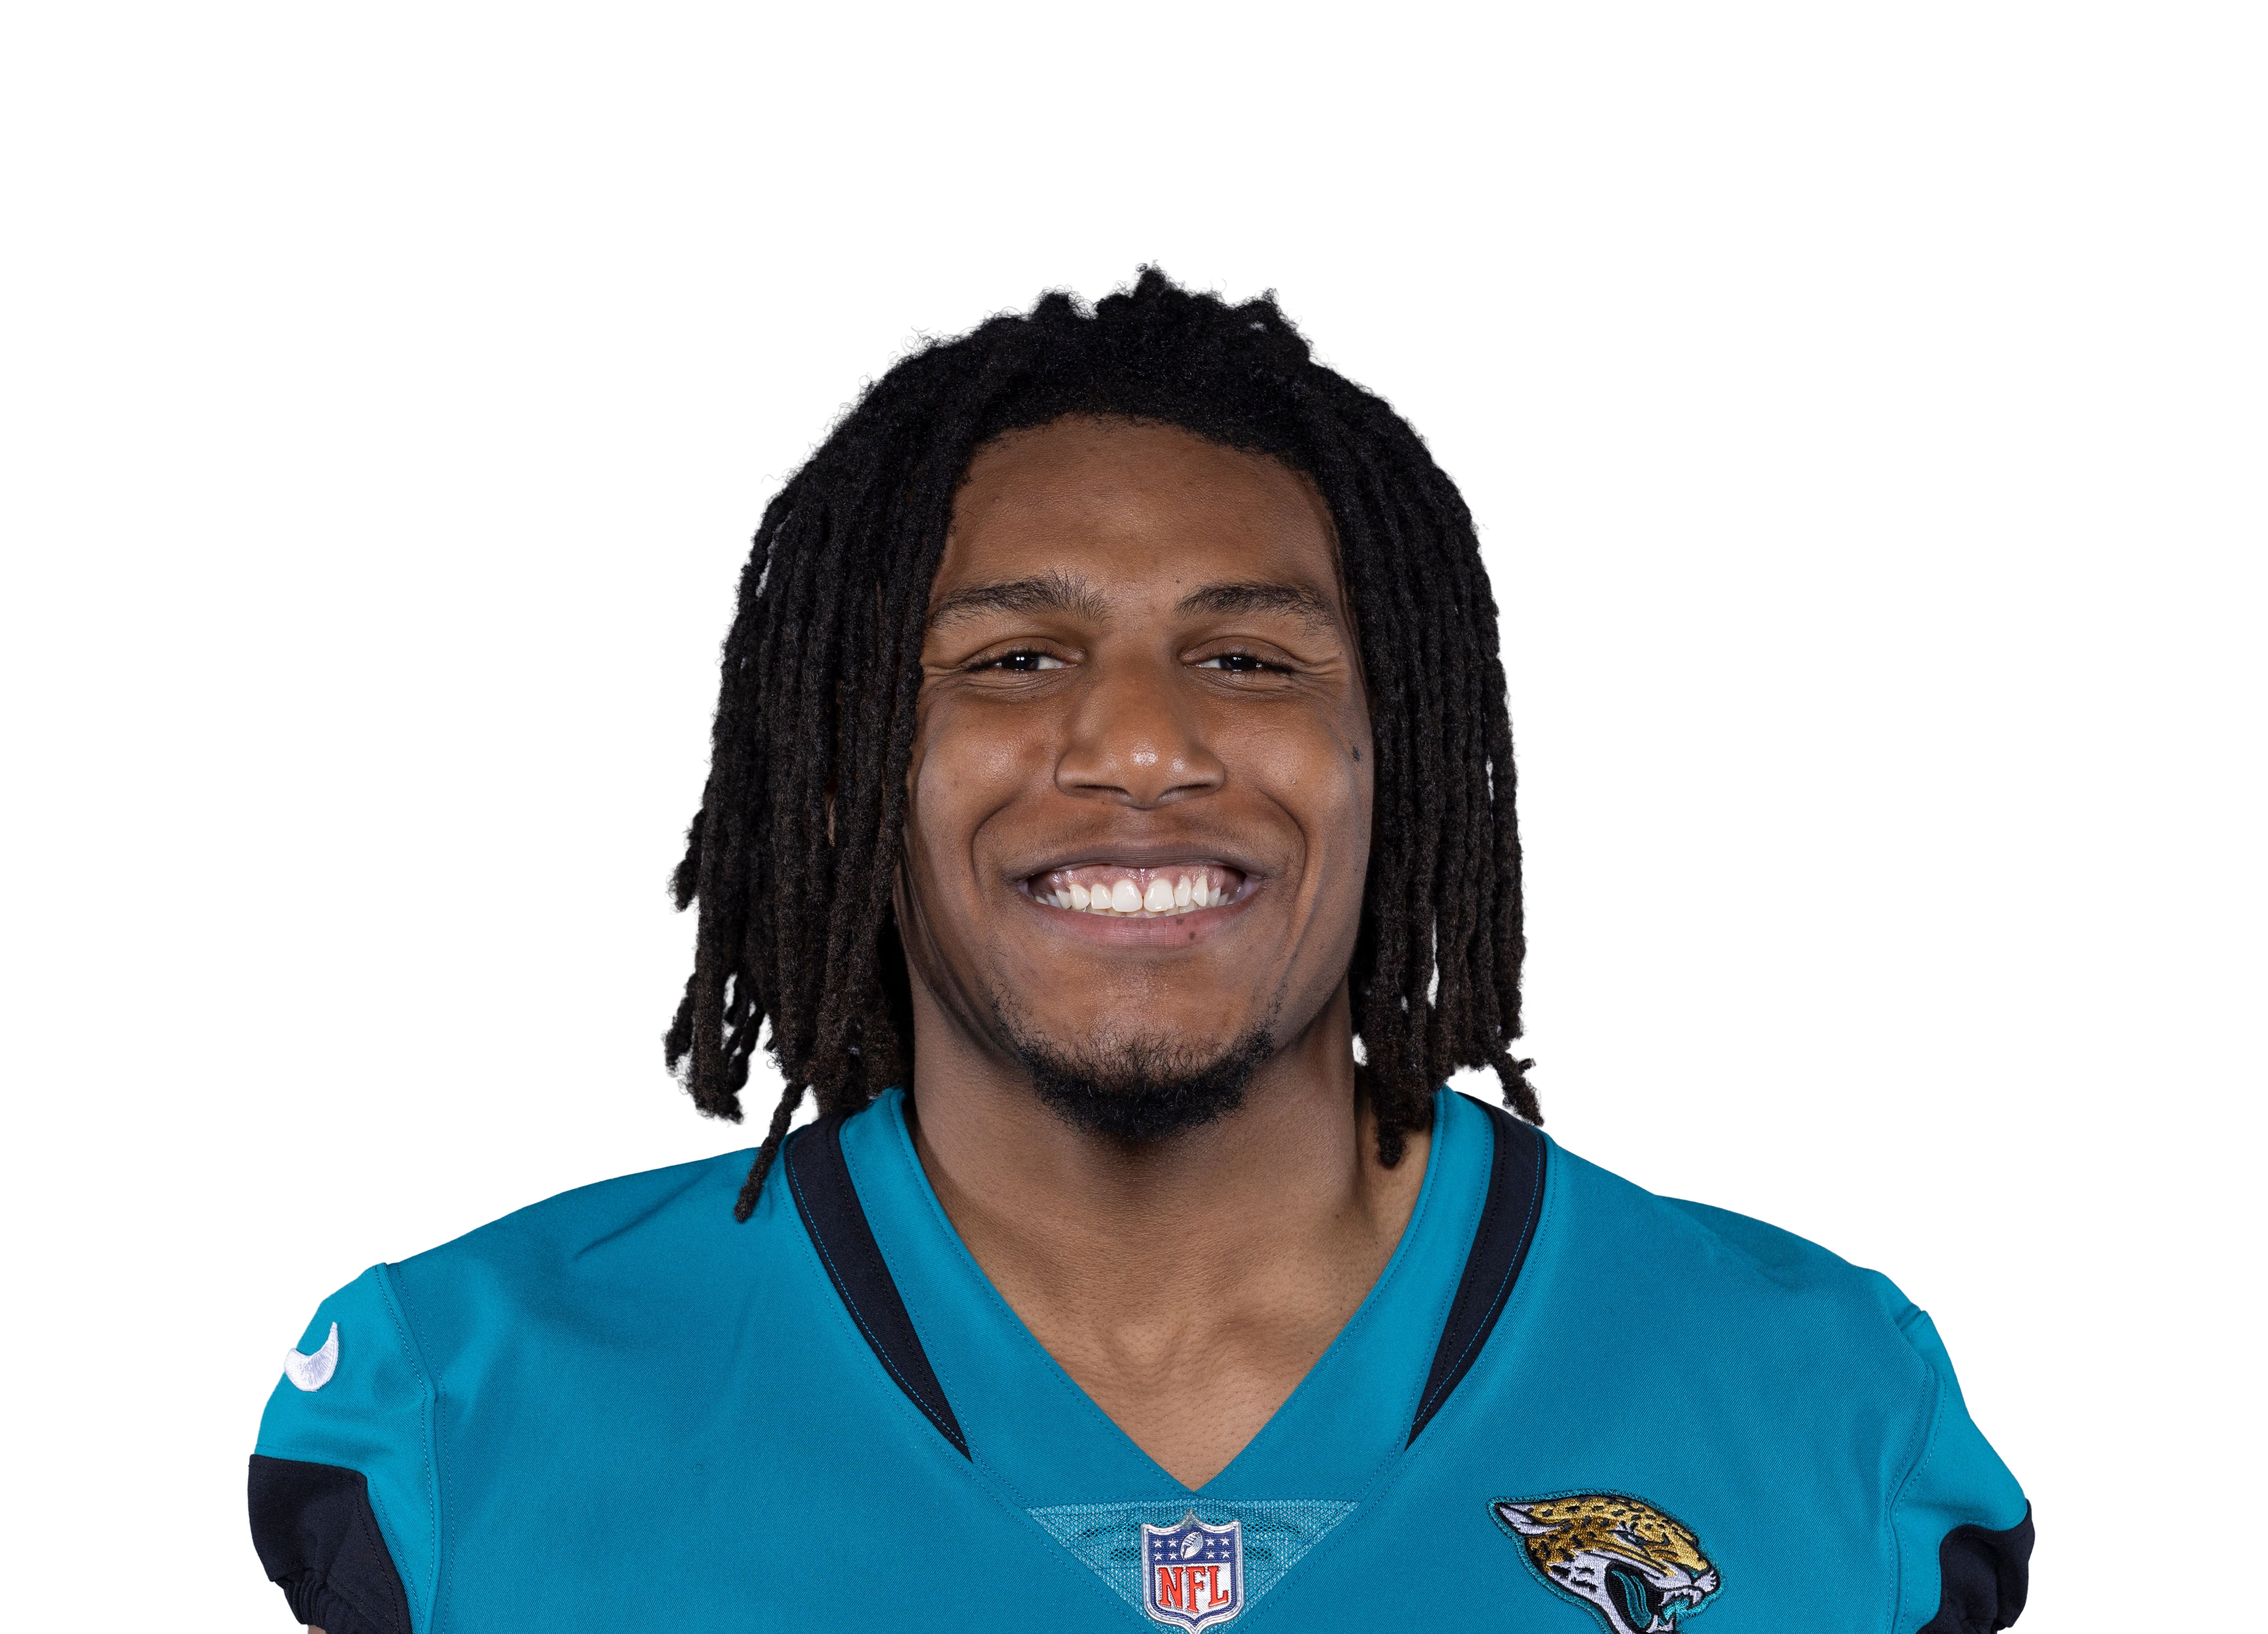 Josh Cameronvs JAX • Wk 4 | 6.2 | 2 | 2 | 42 | 0 | 0 |
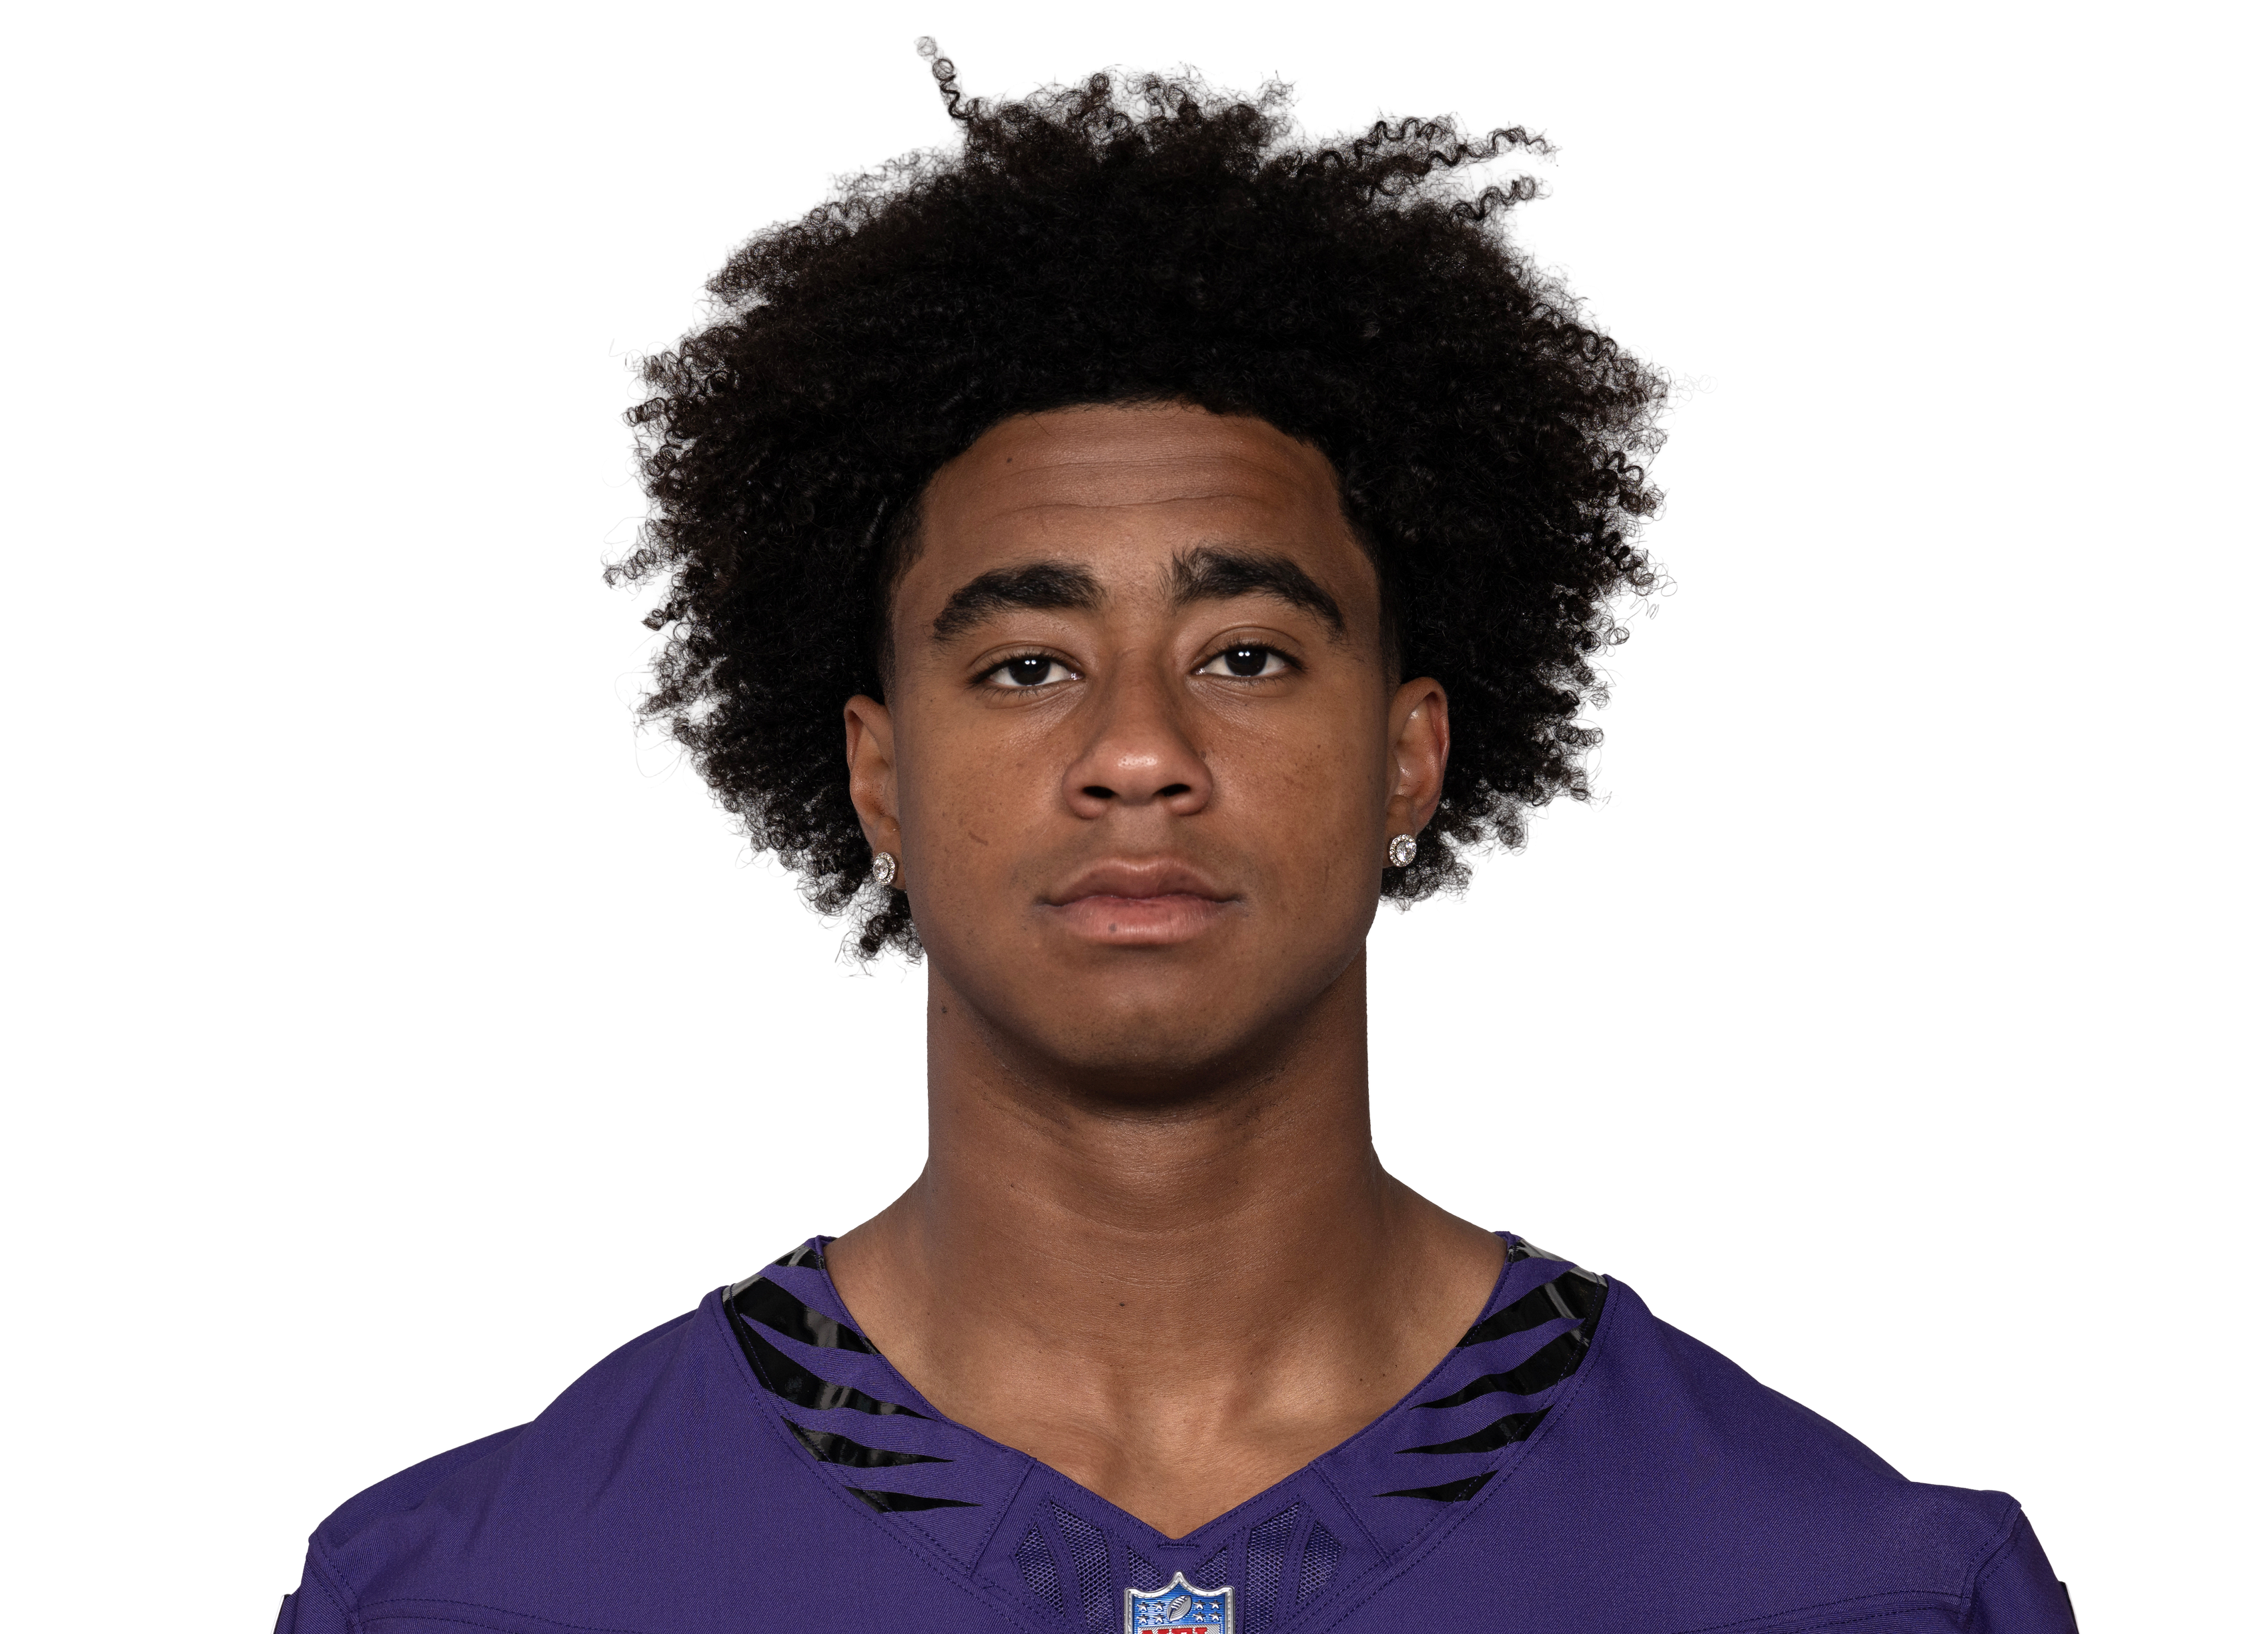 Ja'Kobi Lane@ BAL • Wk 7 | 5.5 | 5 | 3 | 25 | 0 | 0 |
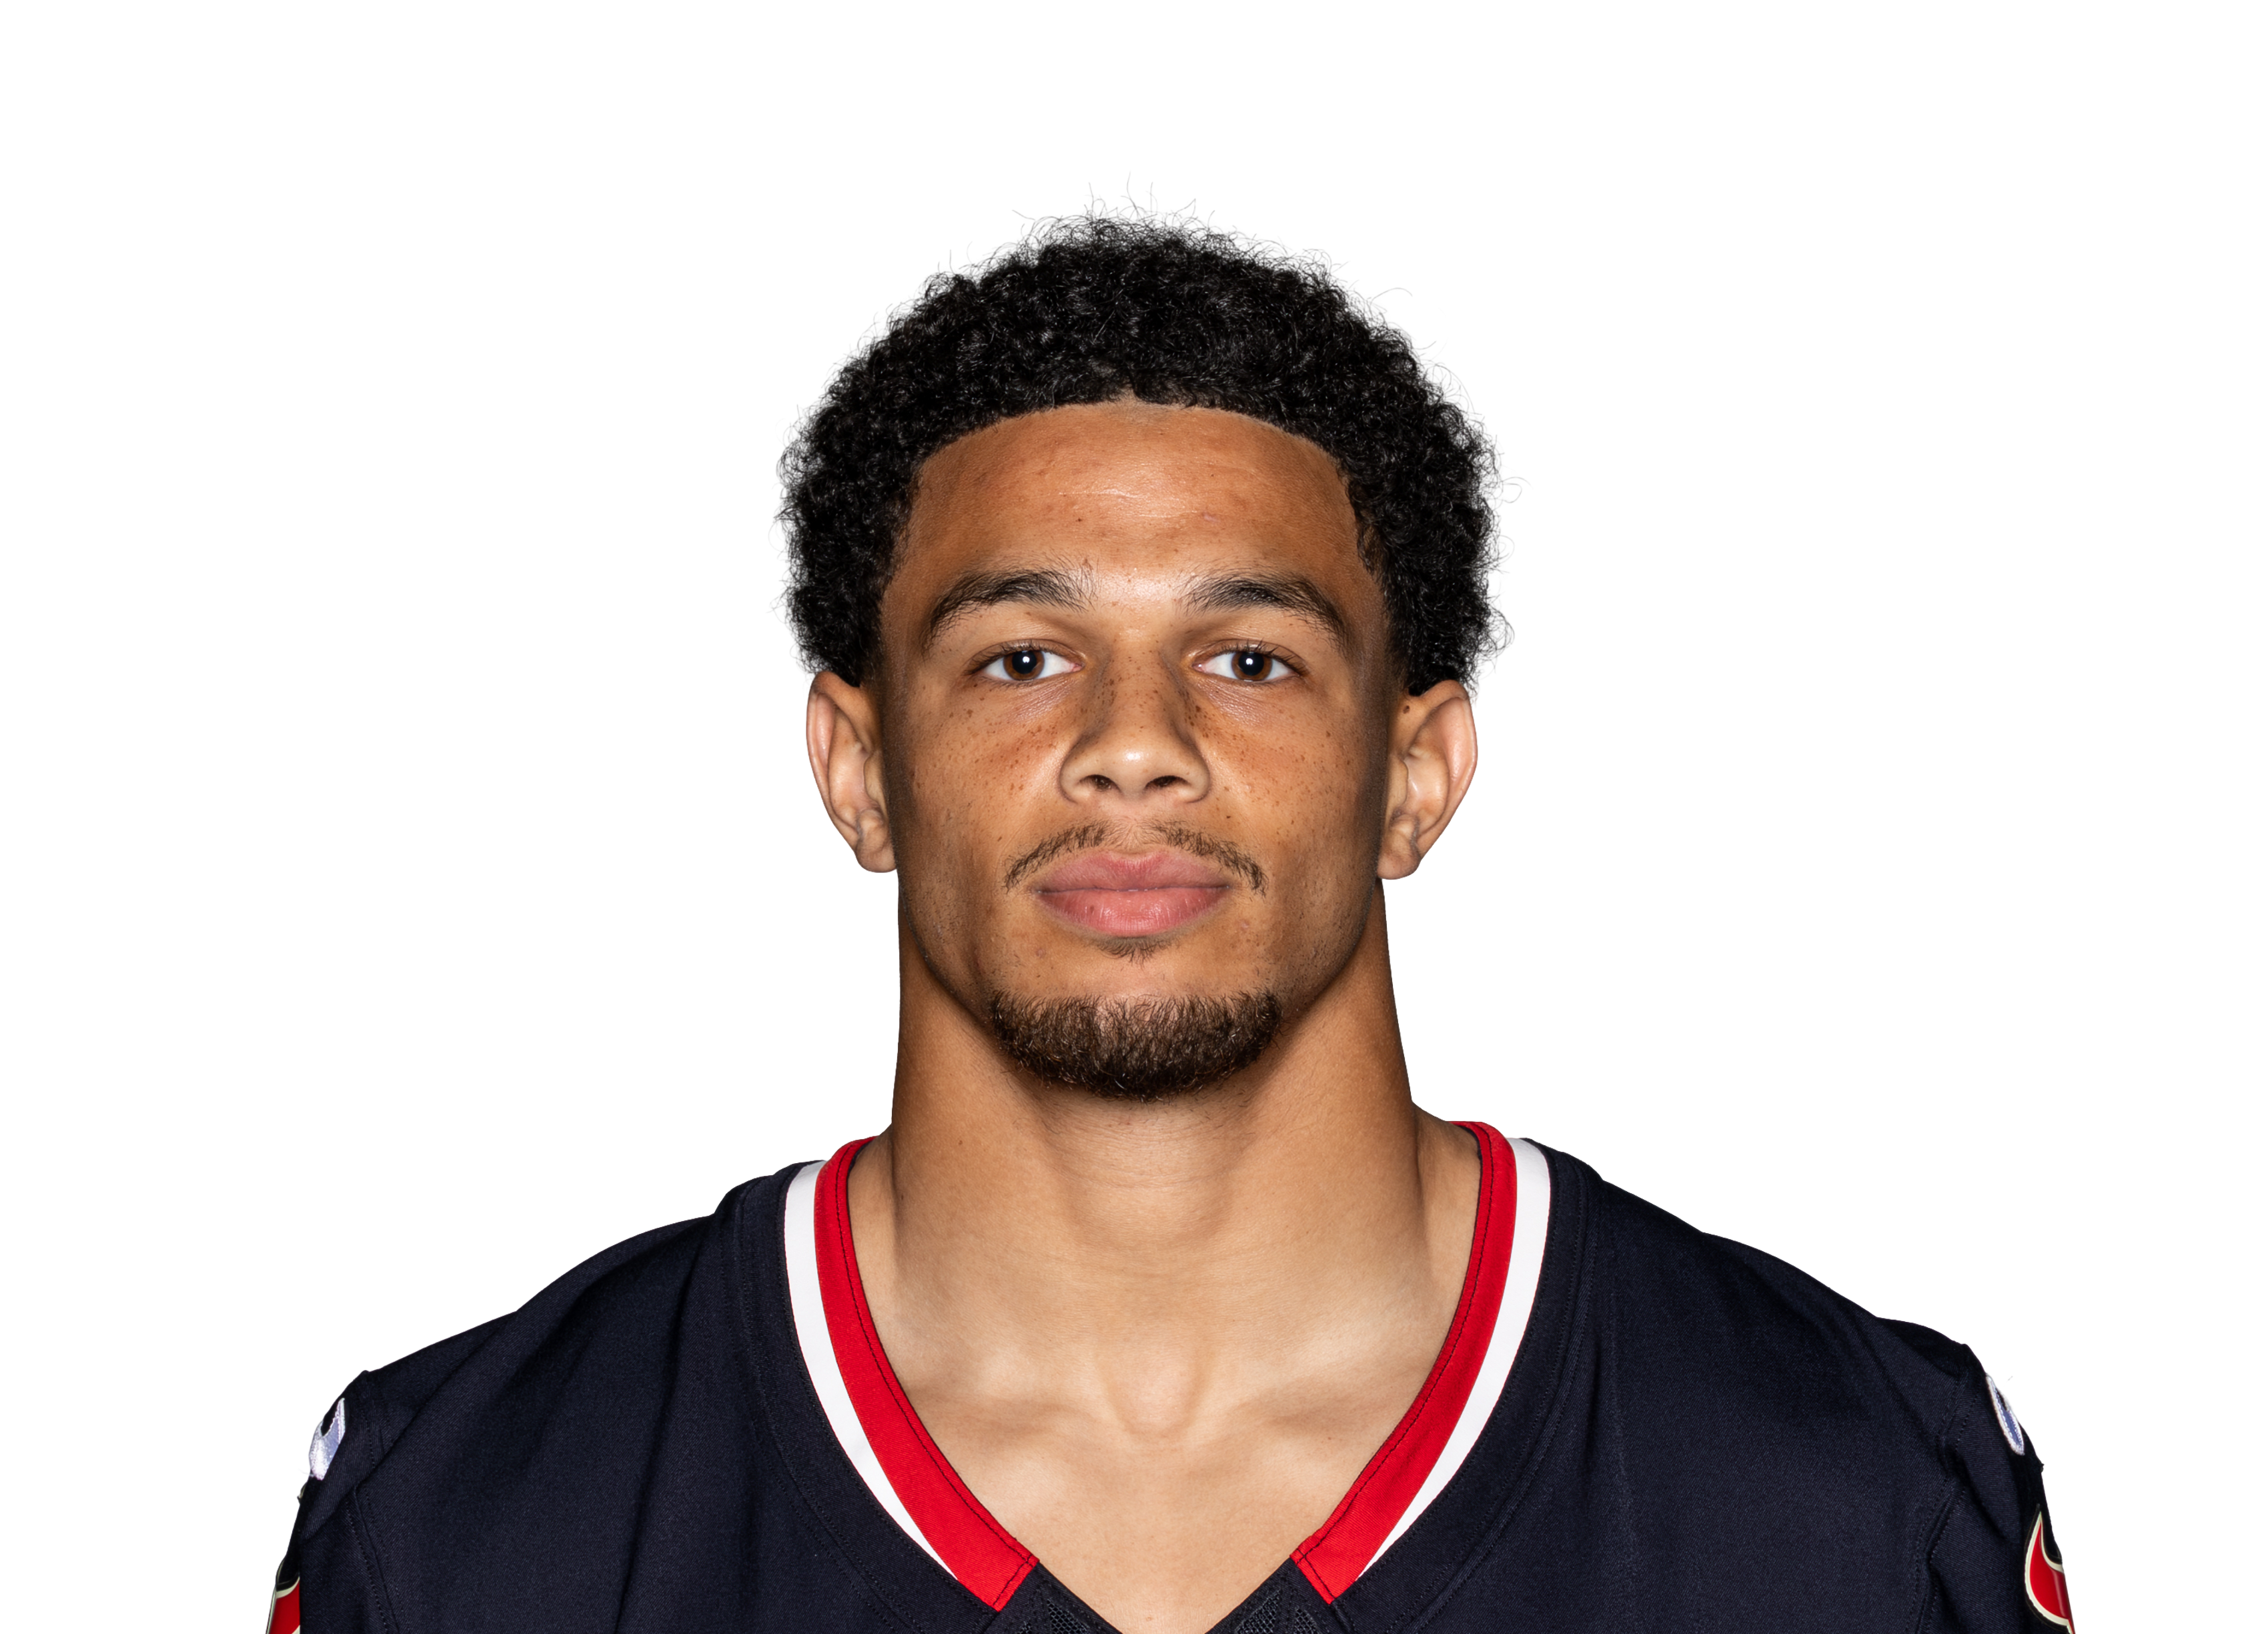 Jaylin Noel@ HOU • Wk 2 | 5.4 | 5 | 1 | 31 | 0 | 13 |
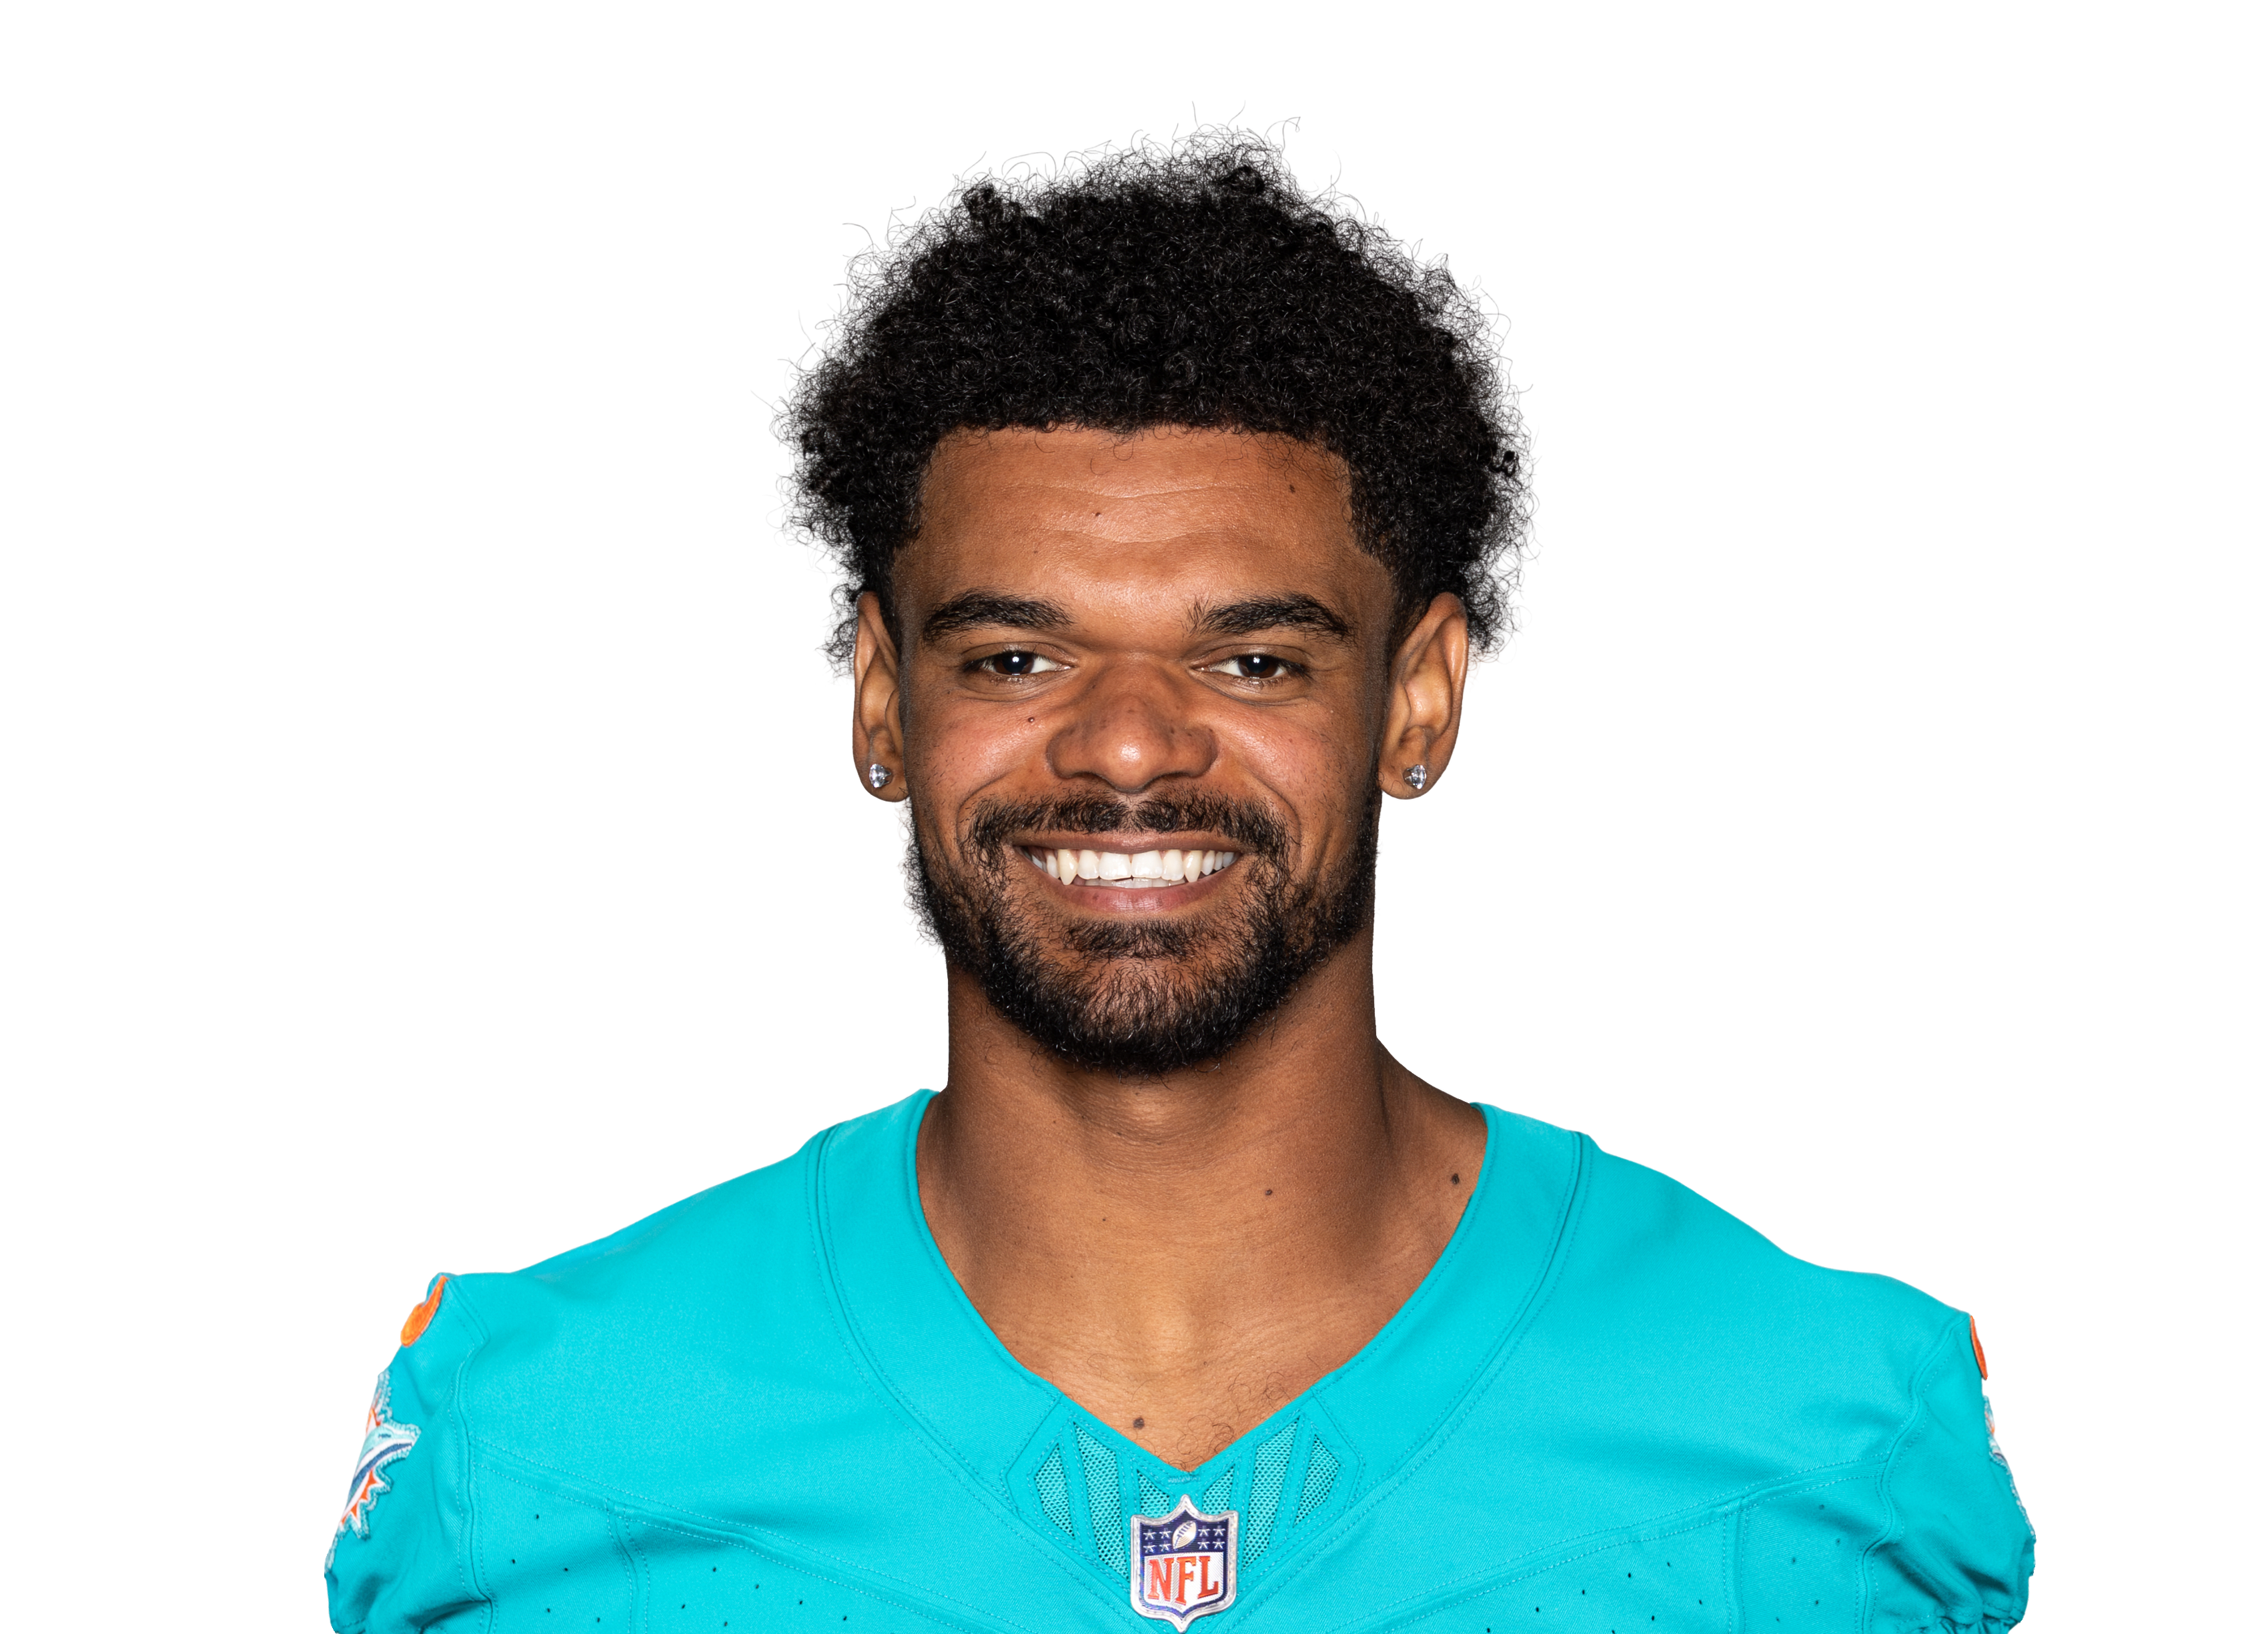 Jared Wayne@ HOU • Wk 2 | 5.3 | 7 | 2 | 33 | 0 | 0 |
 Rashod Bateman@ BAL • Wk 7 | 5.3 | 4 | 2 | 33 | 0 | 0 |
 Michael Pittman@ PIT • Wk 3 | 3.6 | 5 | 2 | 16 | 0 | 0 |
 Jahan Dotson@ ATL • Wk 9 | 3.6 | 2 | 2 | 16 | 0 | 0 |
 Brandon Smithvs PIT • Wk 10 | 3.5 | 3 | 2 | 15 | 0 | 0 |
 Jalen Tolbert@ MIA • Wk 5 | 3.2 | 2 | 1 | 22 | 0 | 0 |
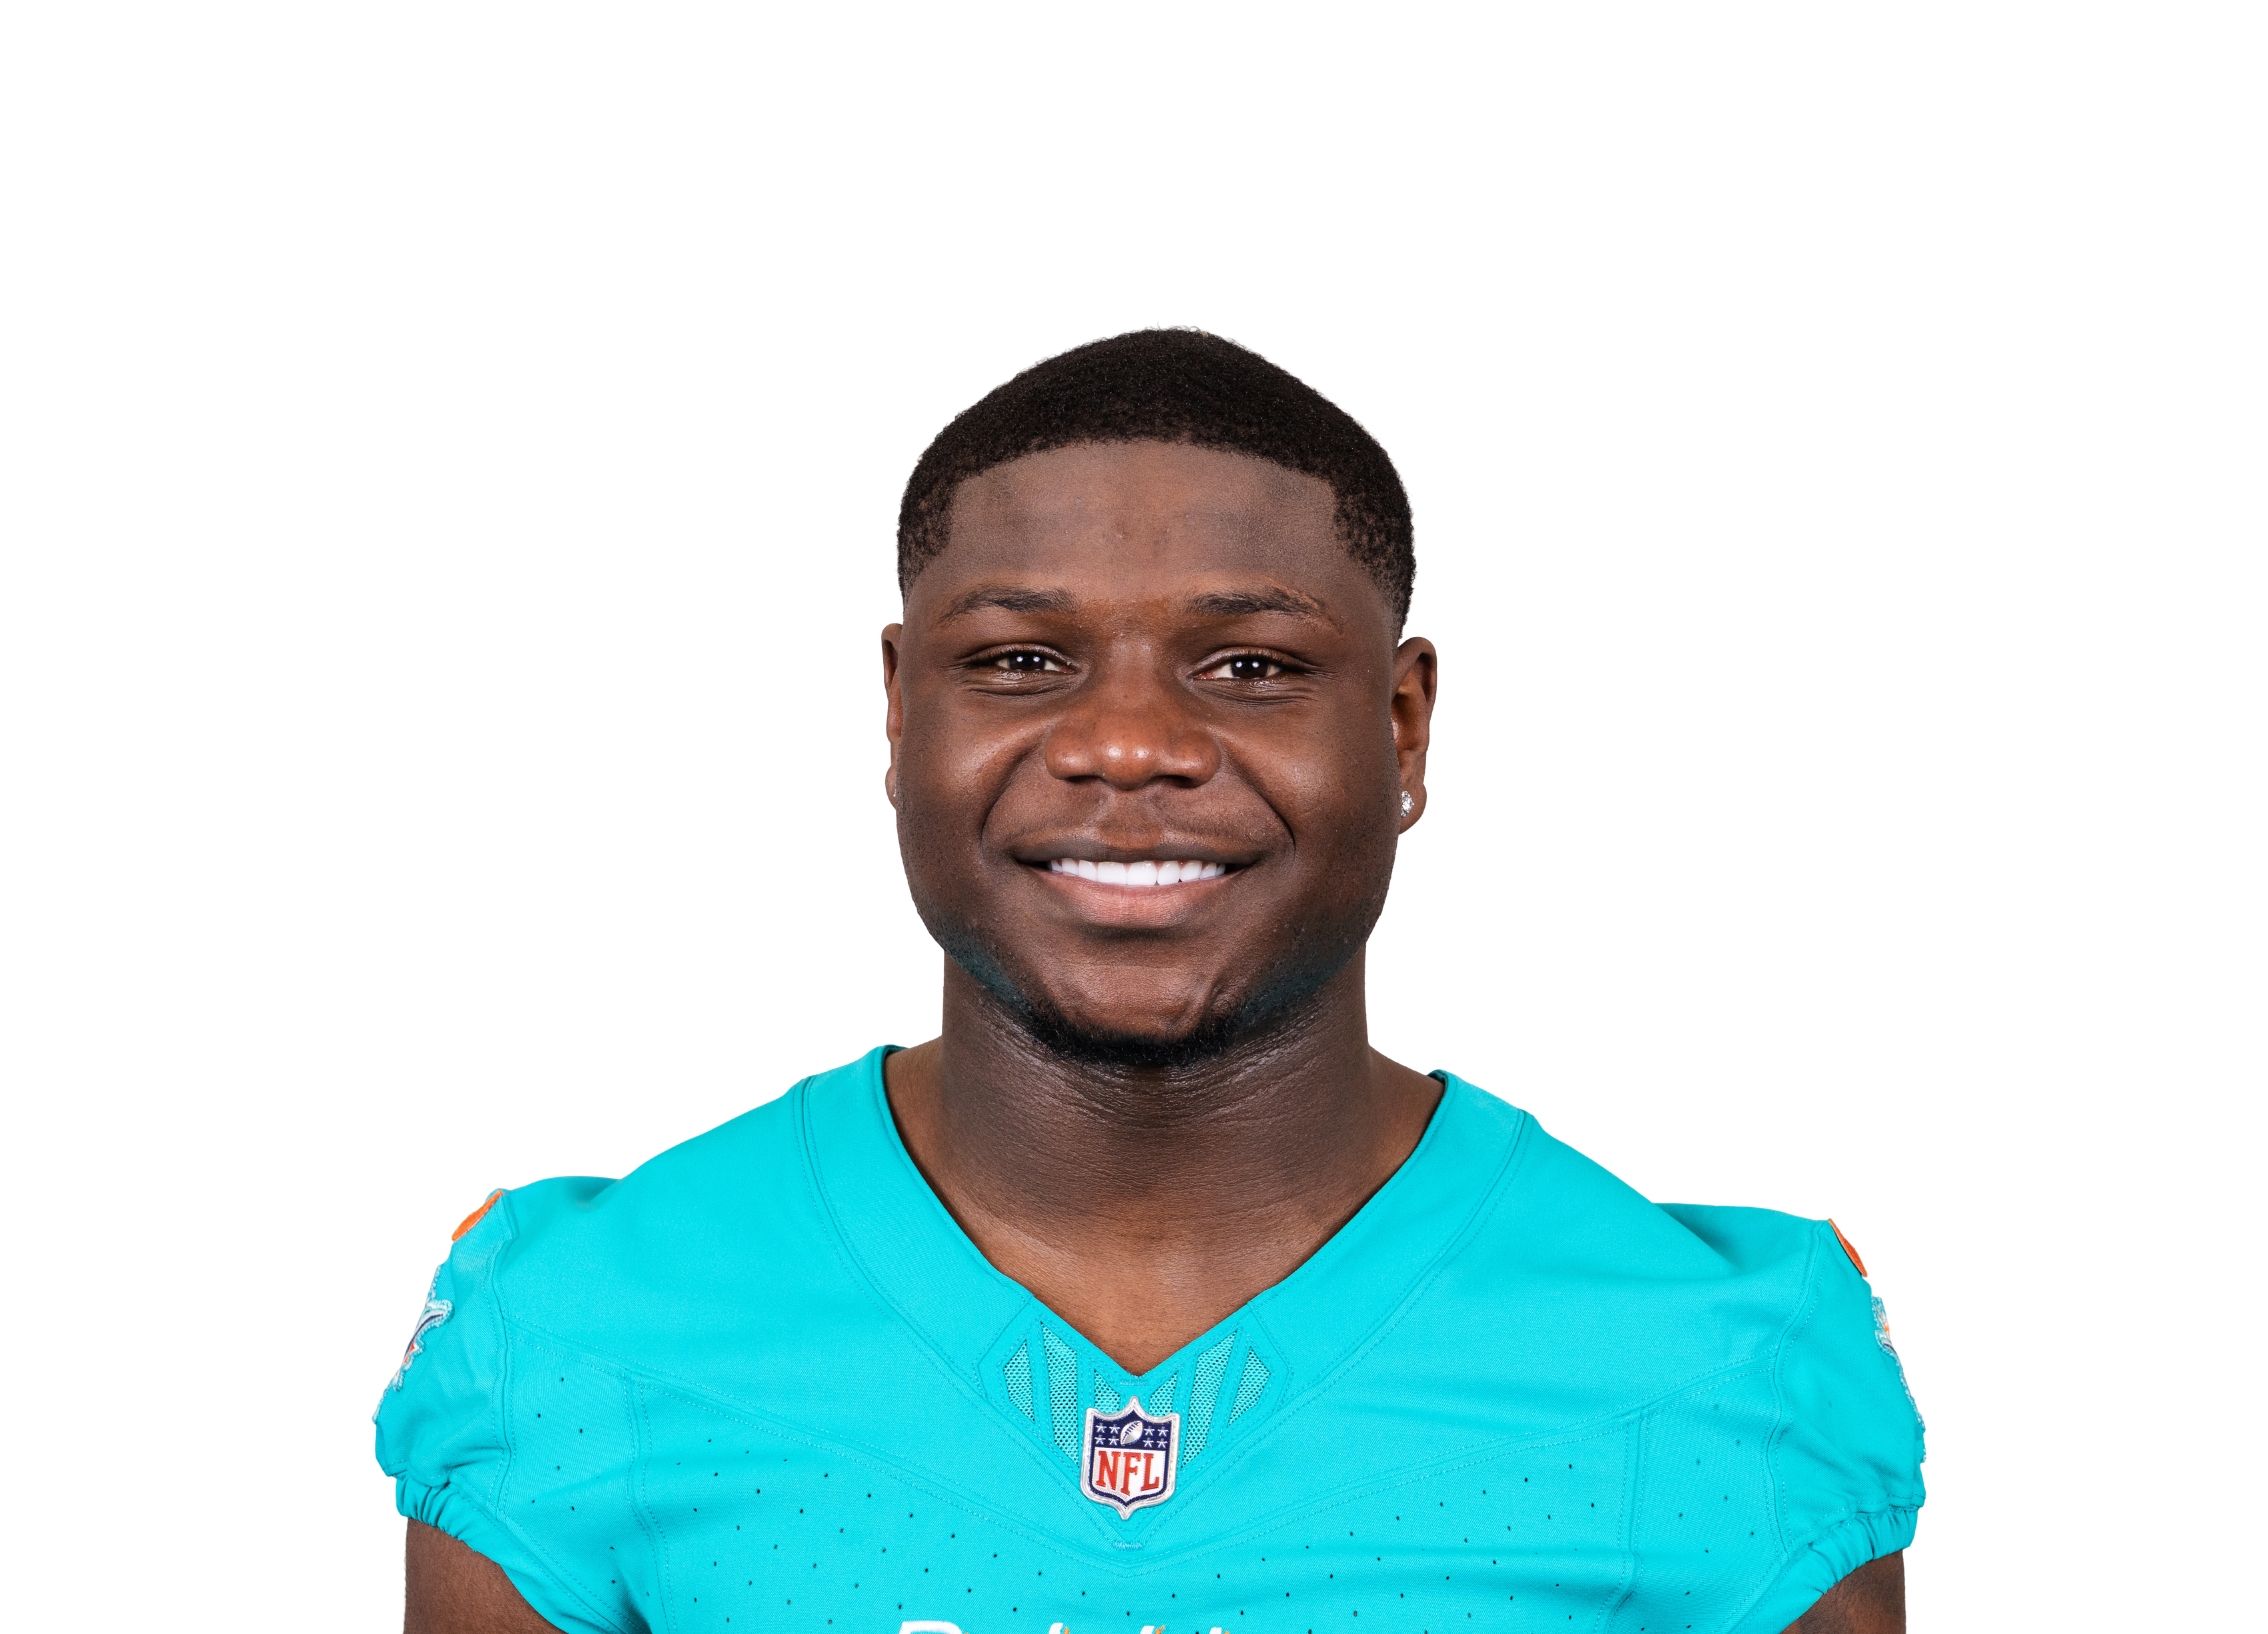 Chris Bell@ MIA • Wk 5 | 2.6 | 2 | 0 | 0 | 0 | 26 |
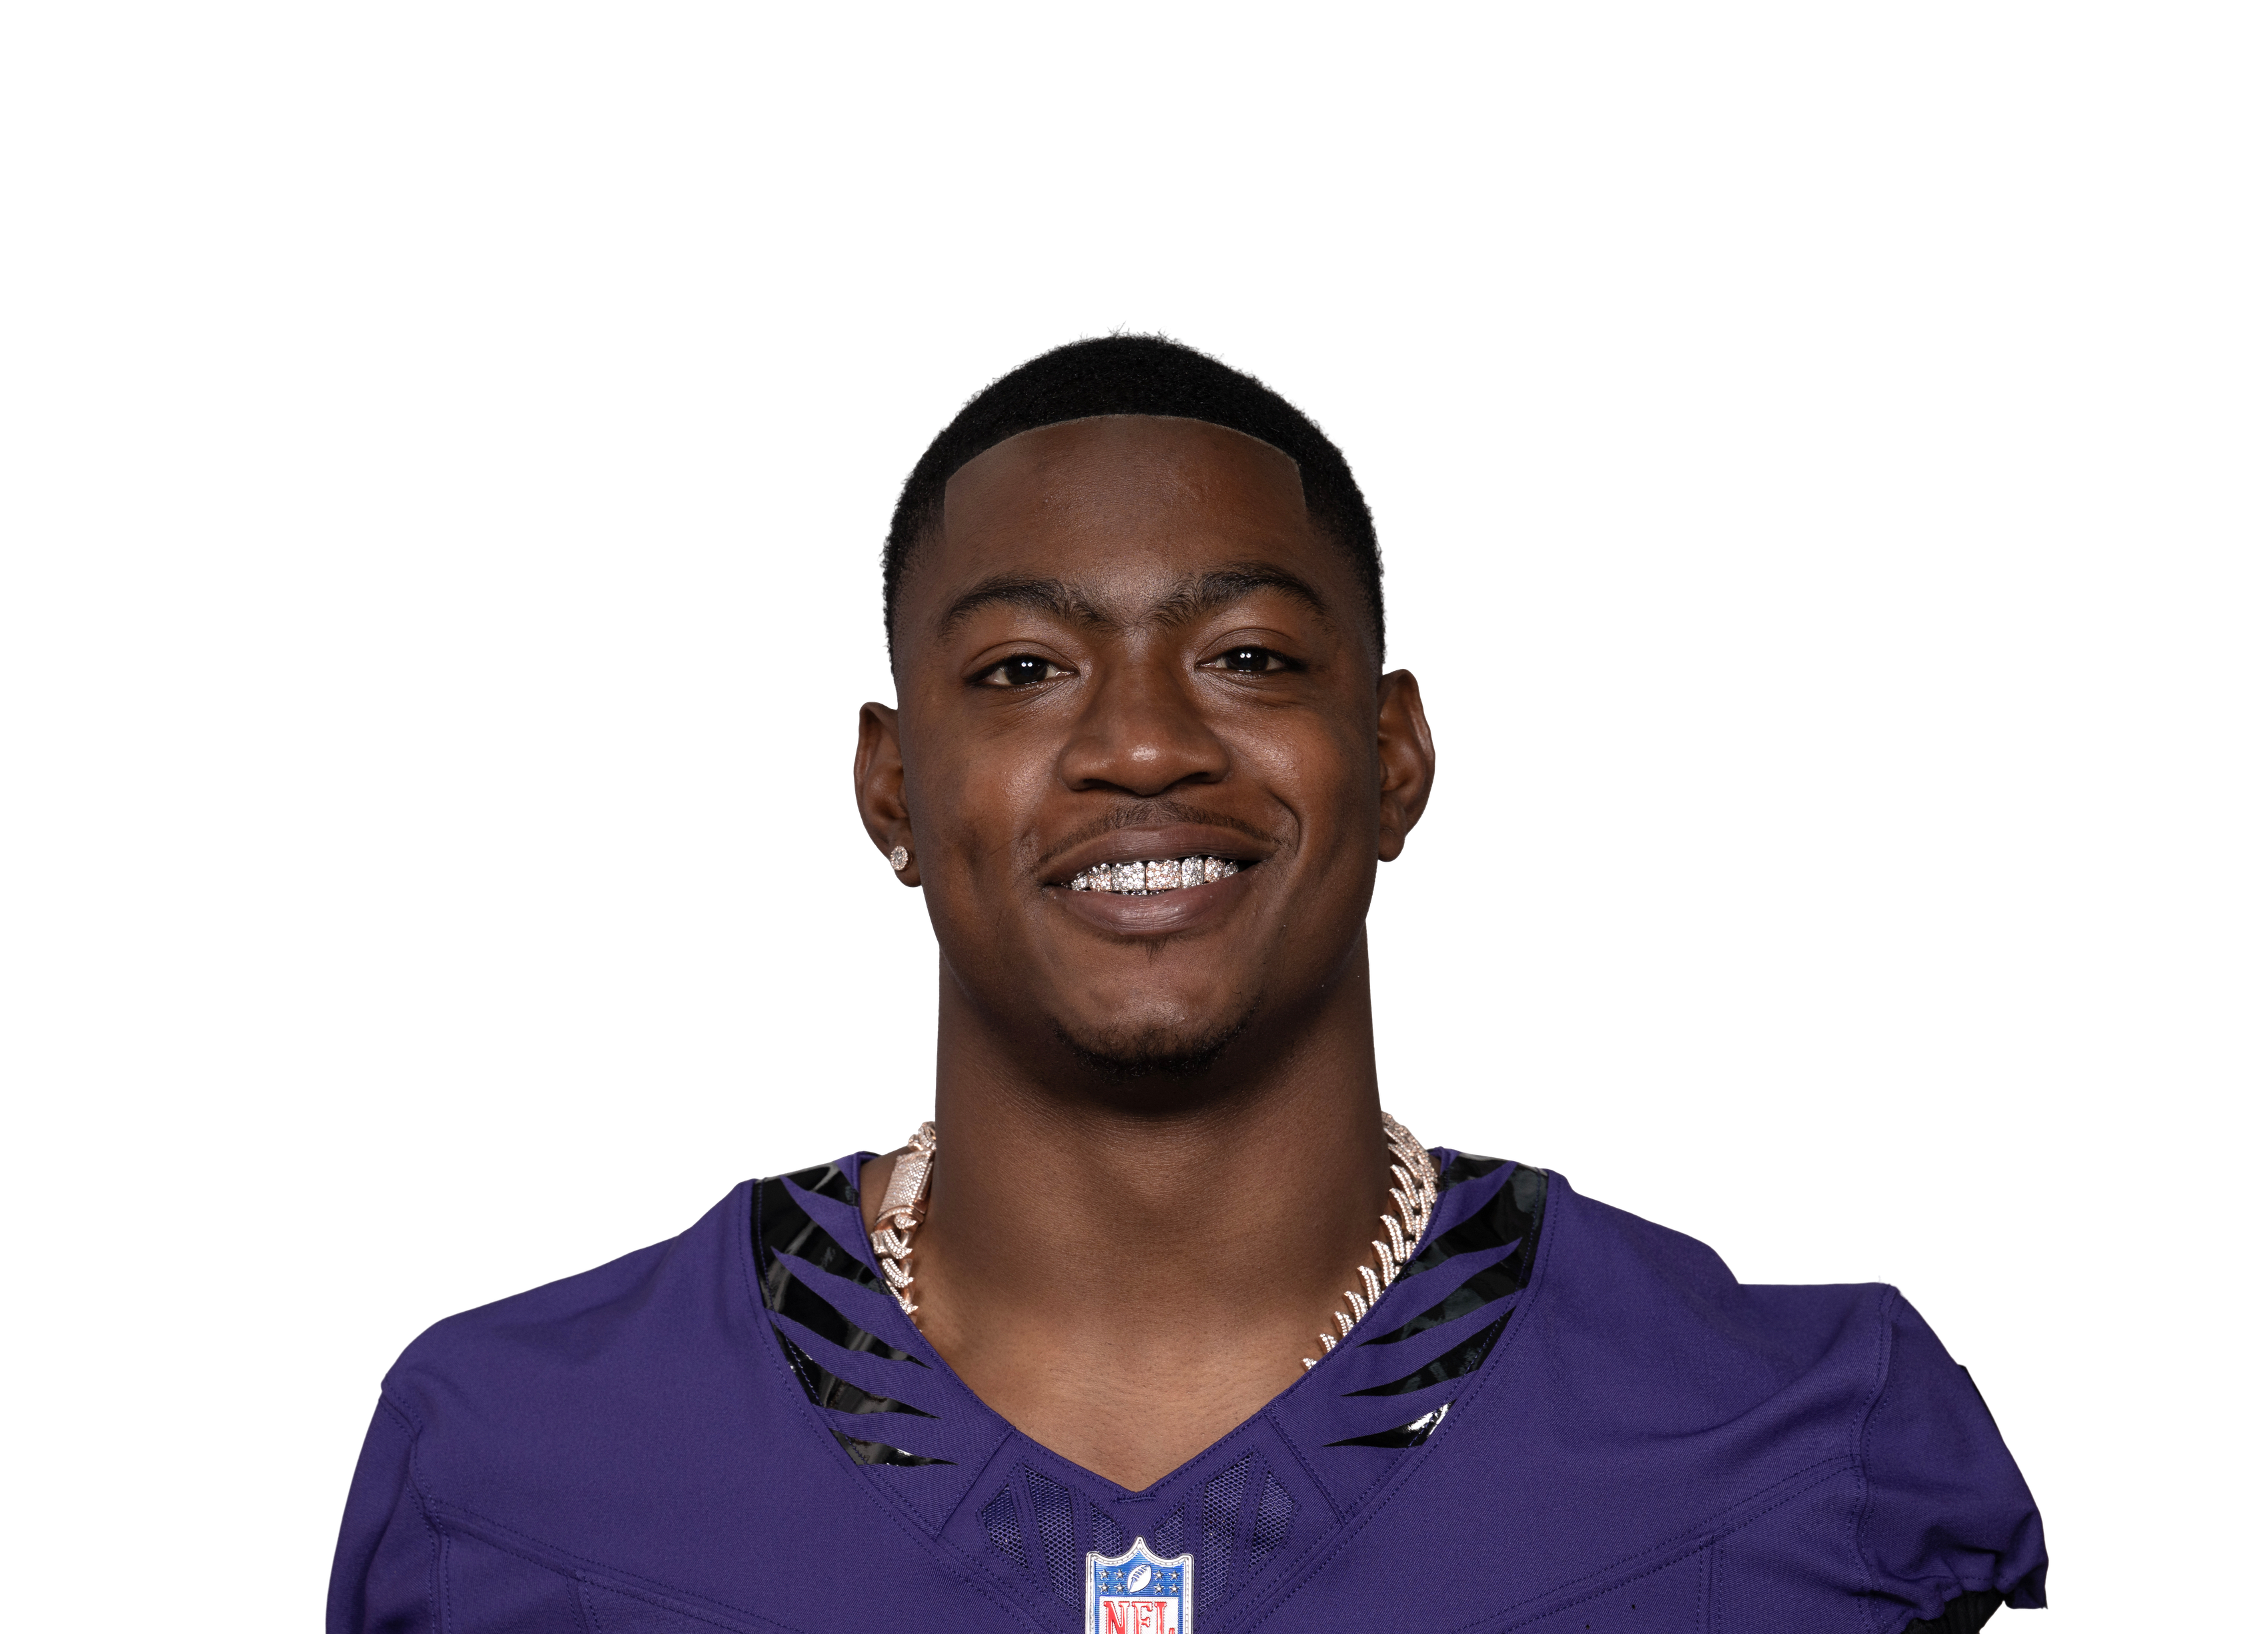 LaJohntay Wester@ BAL • Wk 7 | 2.5 | 1 | 1 | 15 | 0 | 0 |
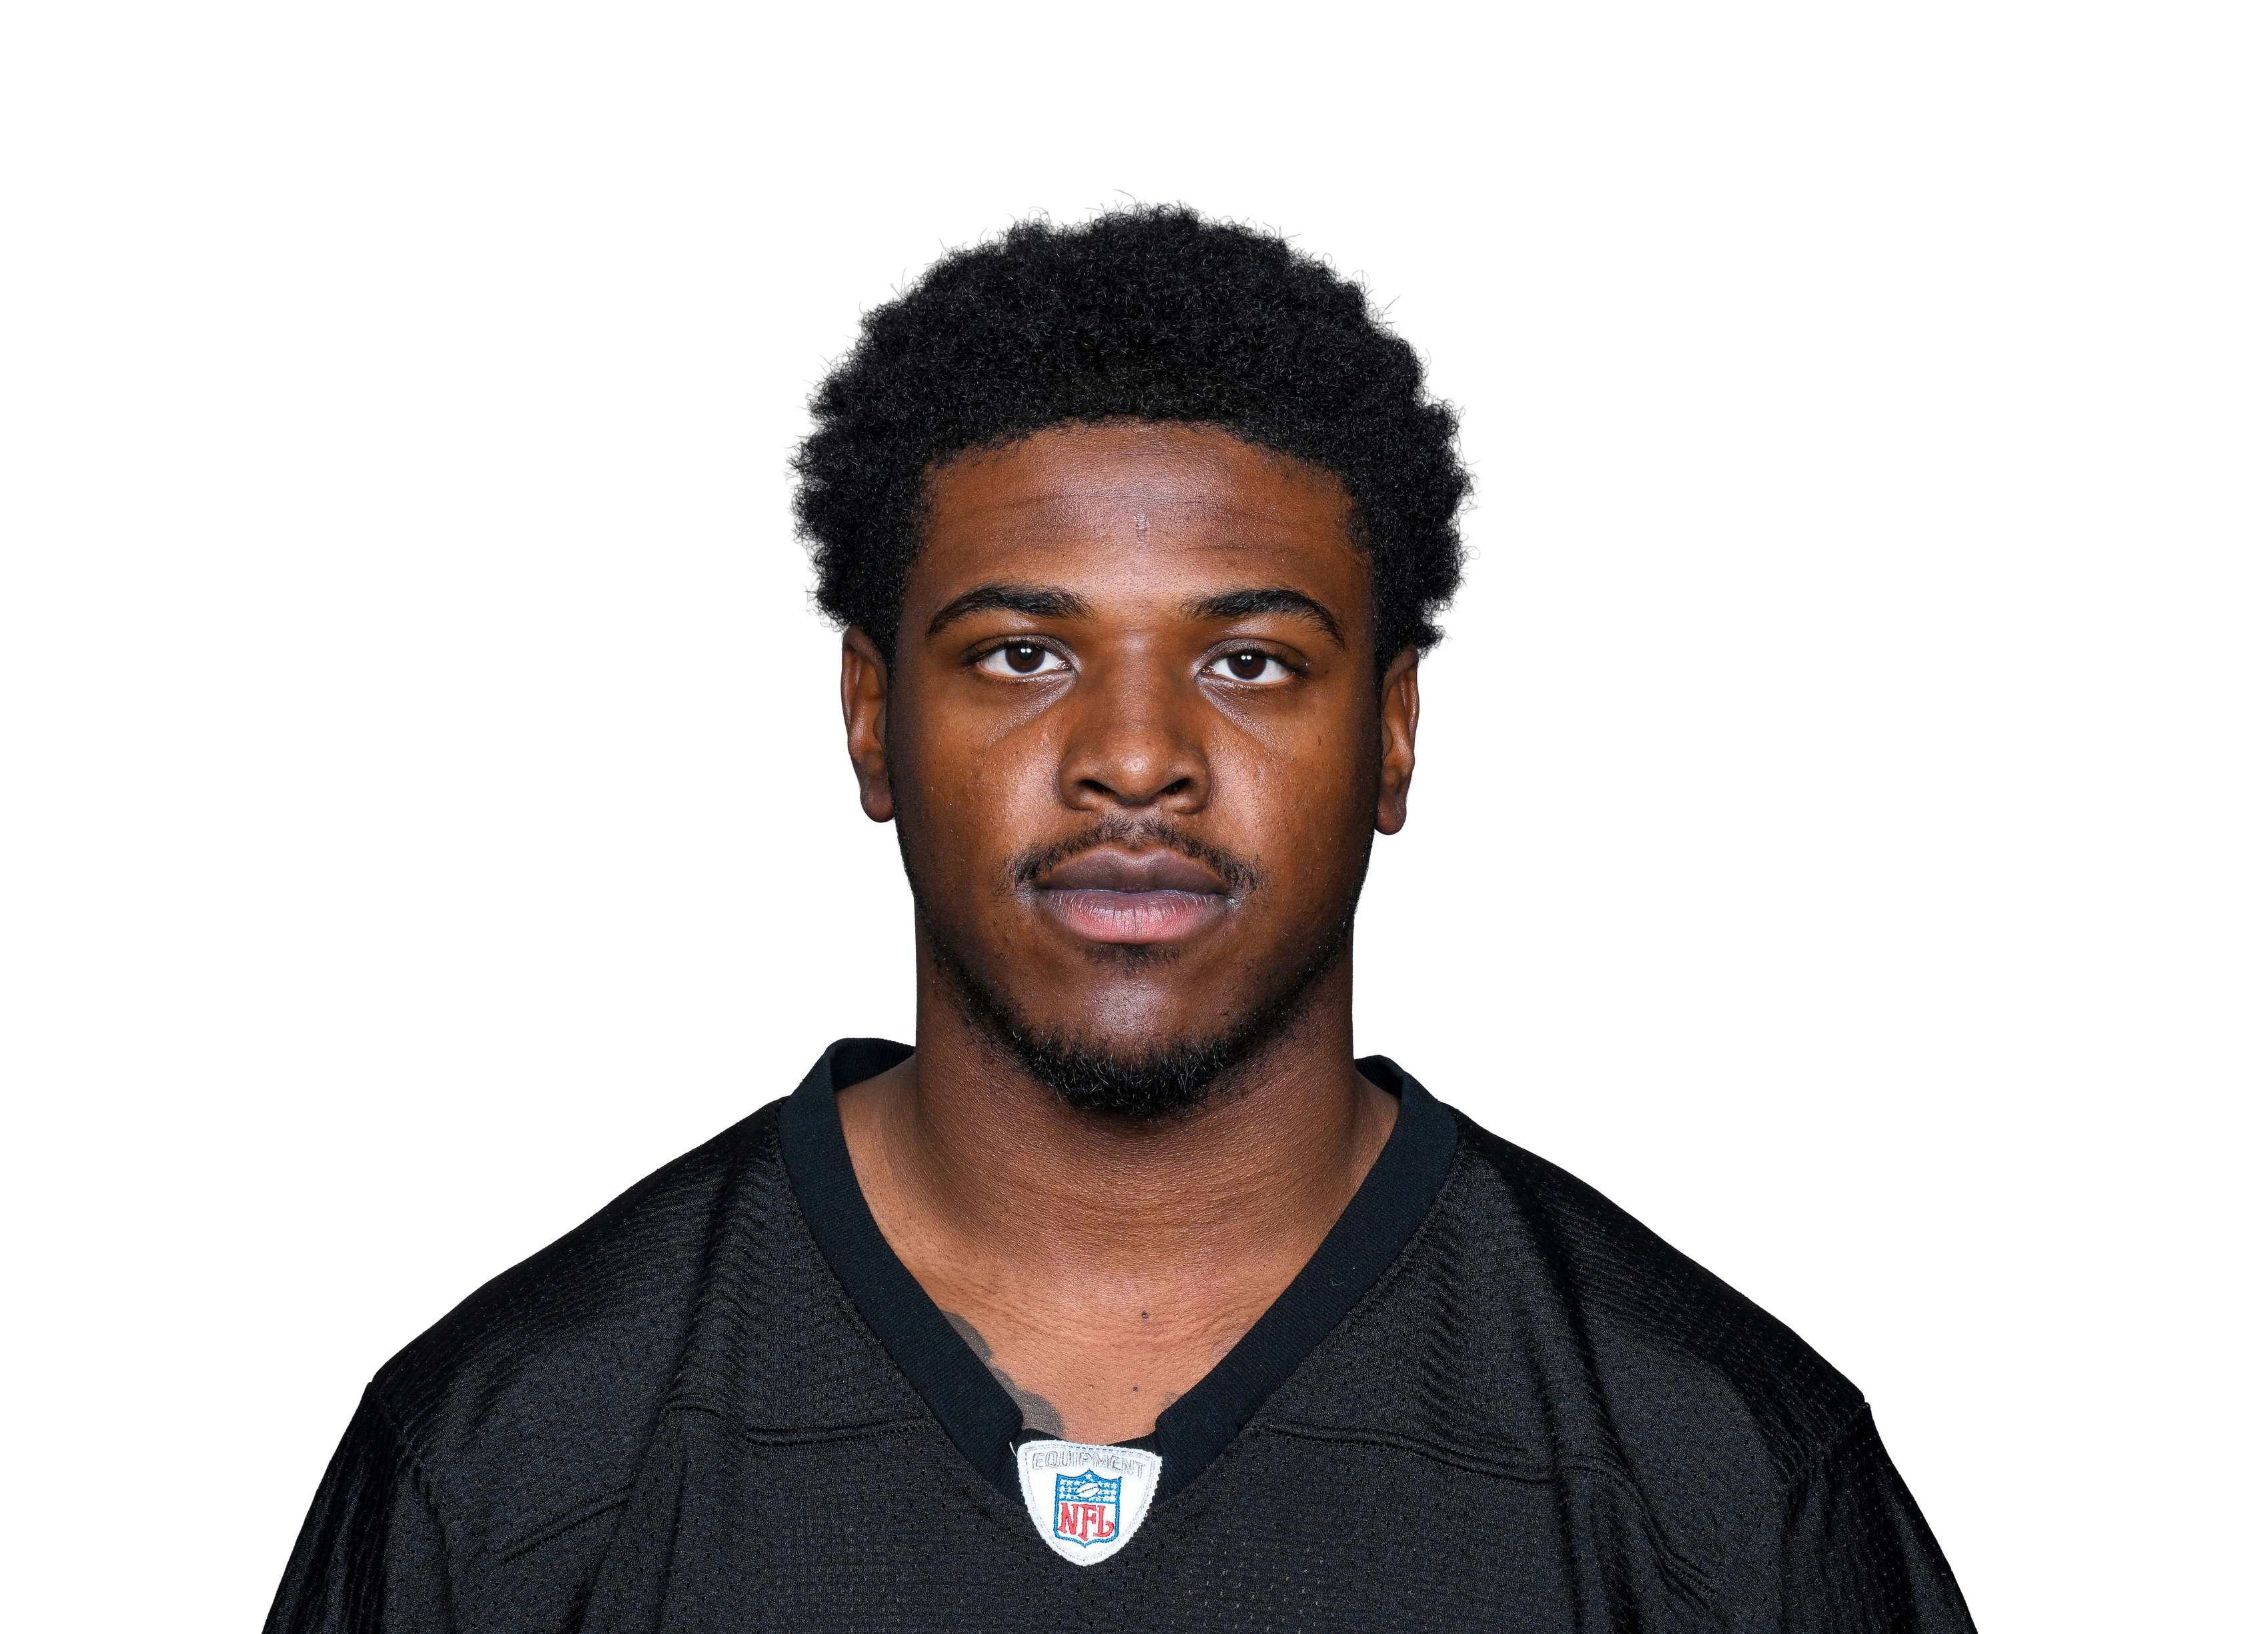 Germie Bernard@ PIT • Wk 3 | 2.4 | 1 | 1 | 14 | 0 | 0 |
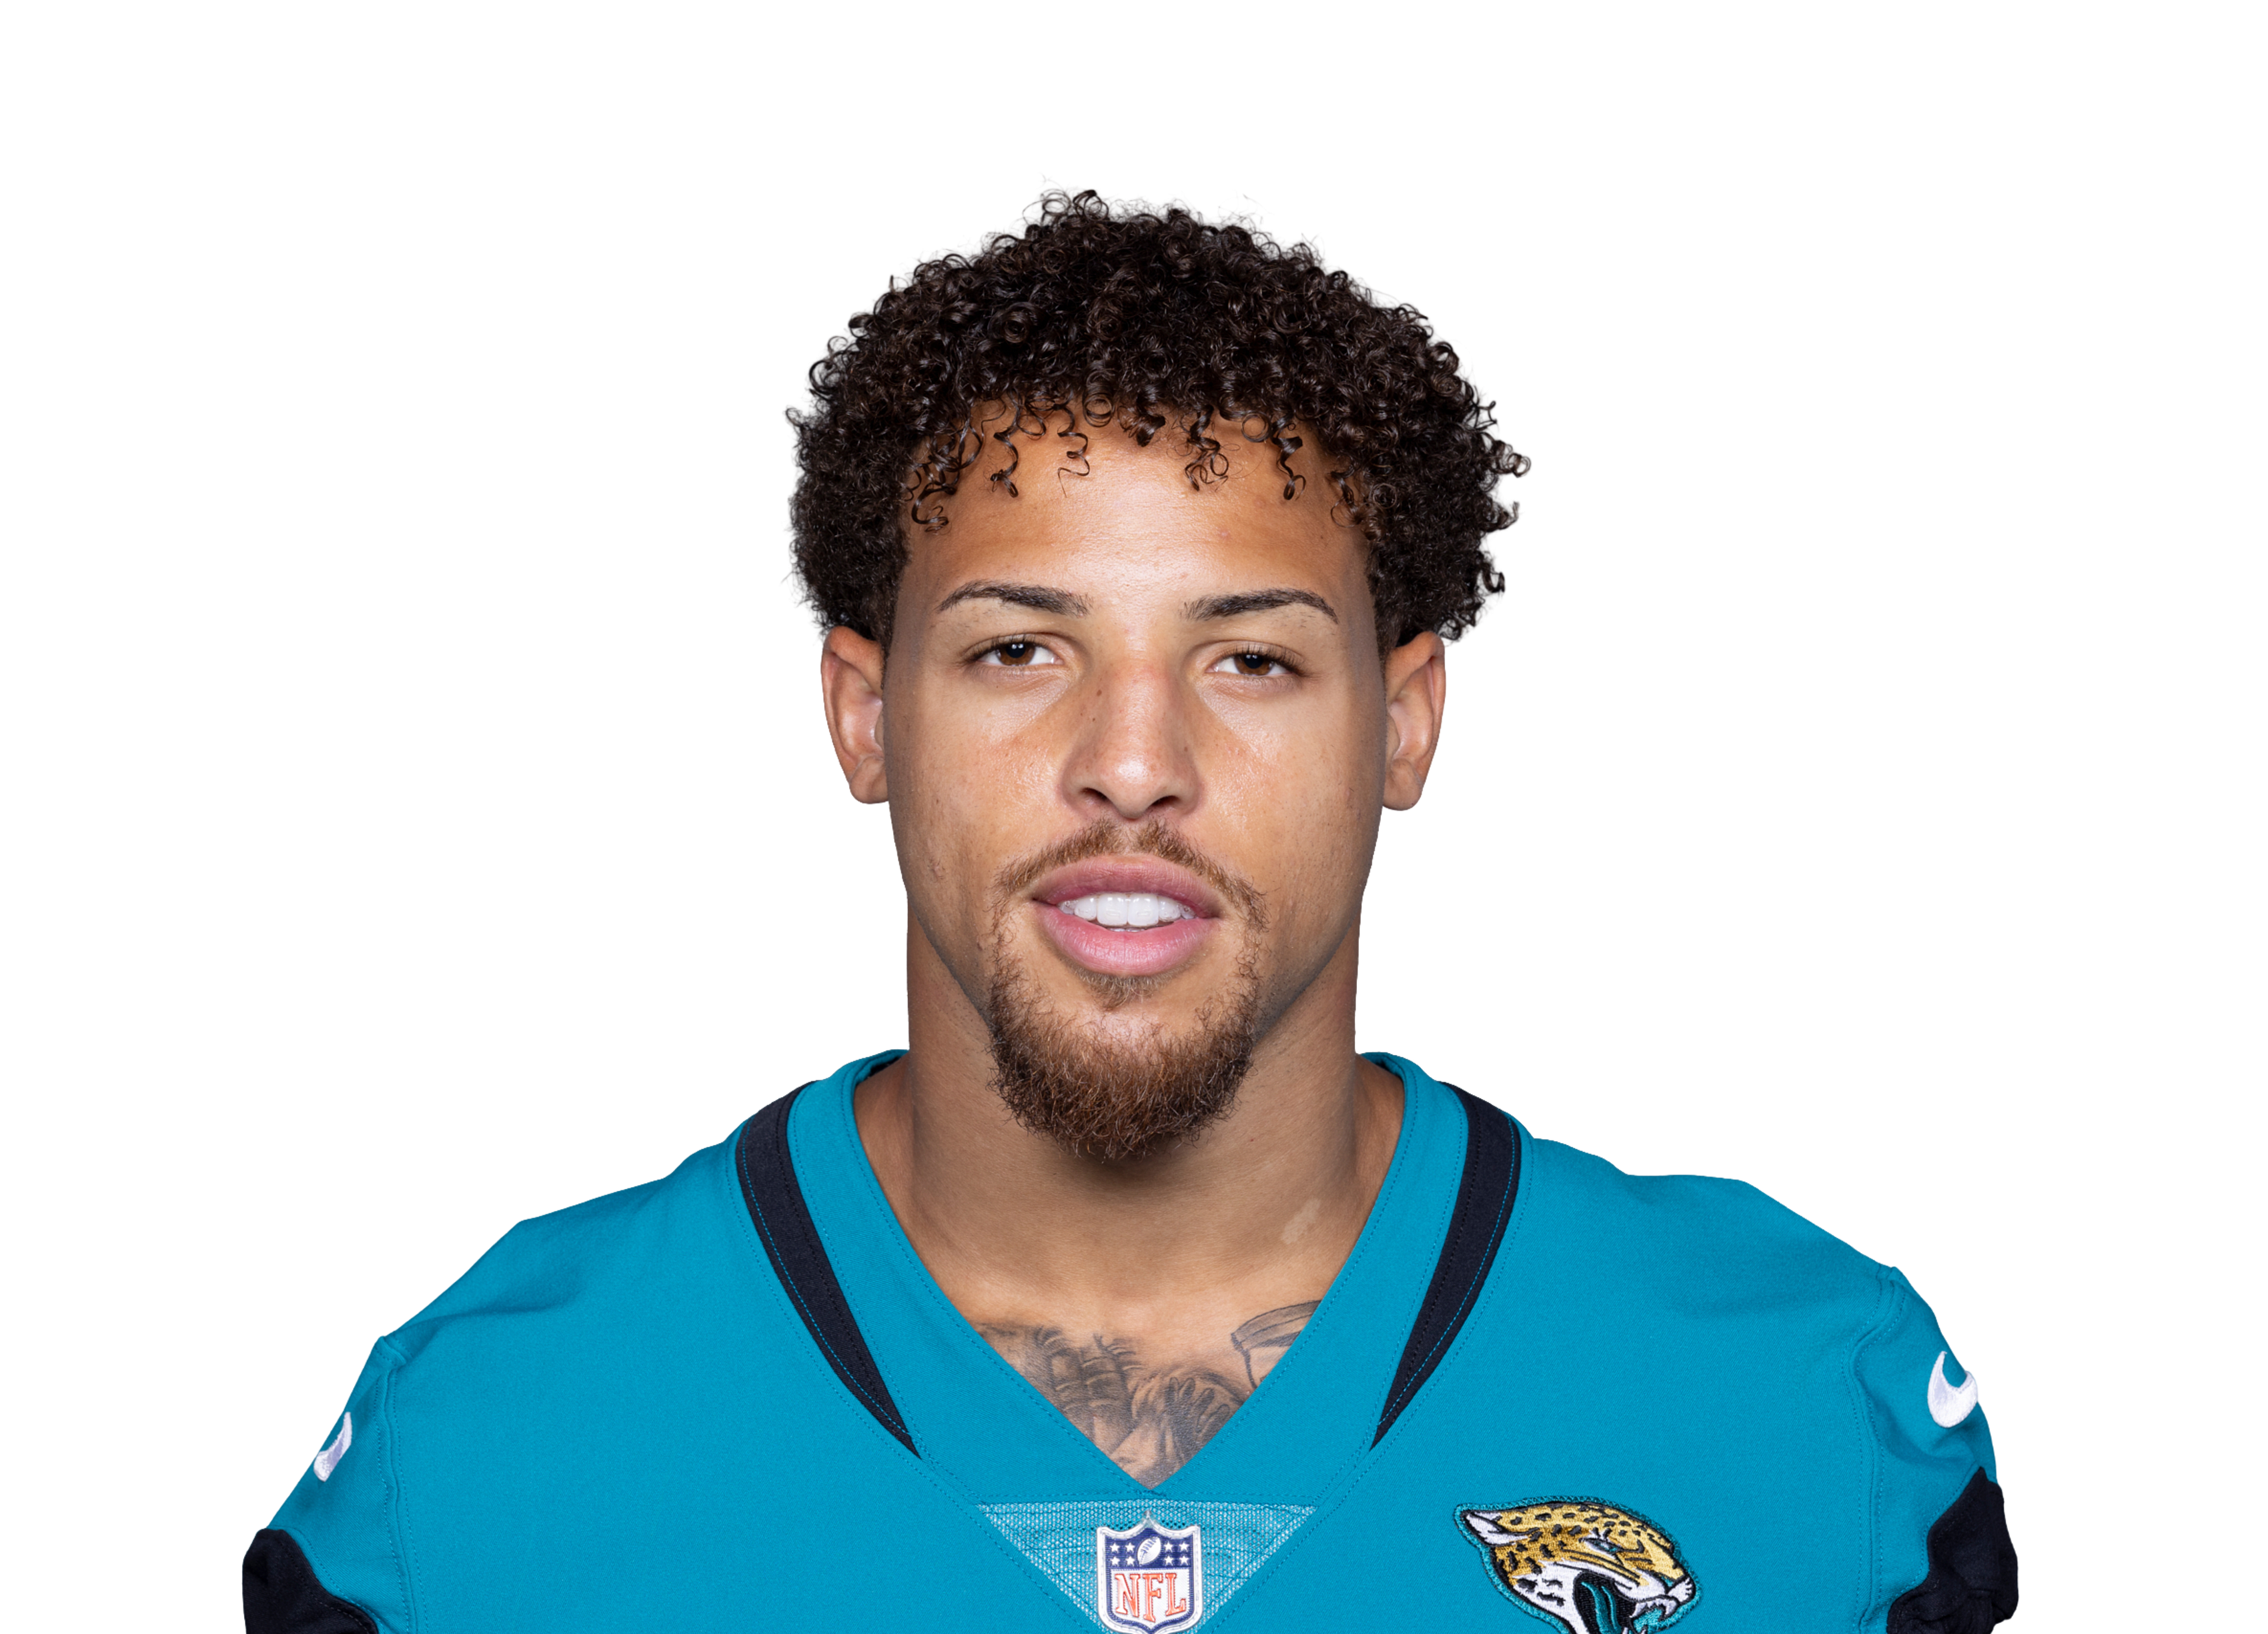 Parker Washingtonvs JAX • Wk 4 | 2.0 | 3 | 1 | 7 | 0 | 3 |
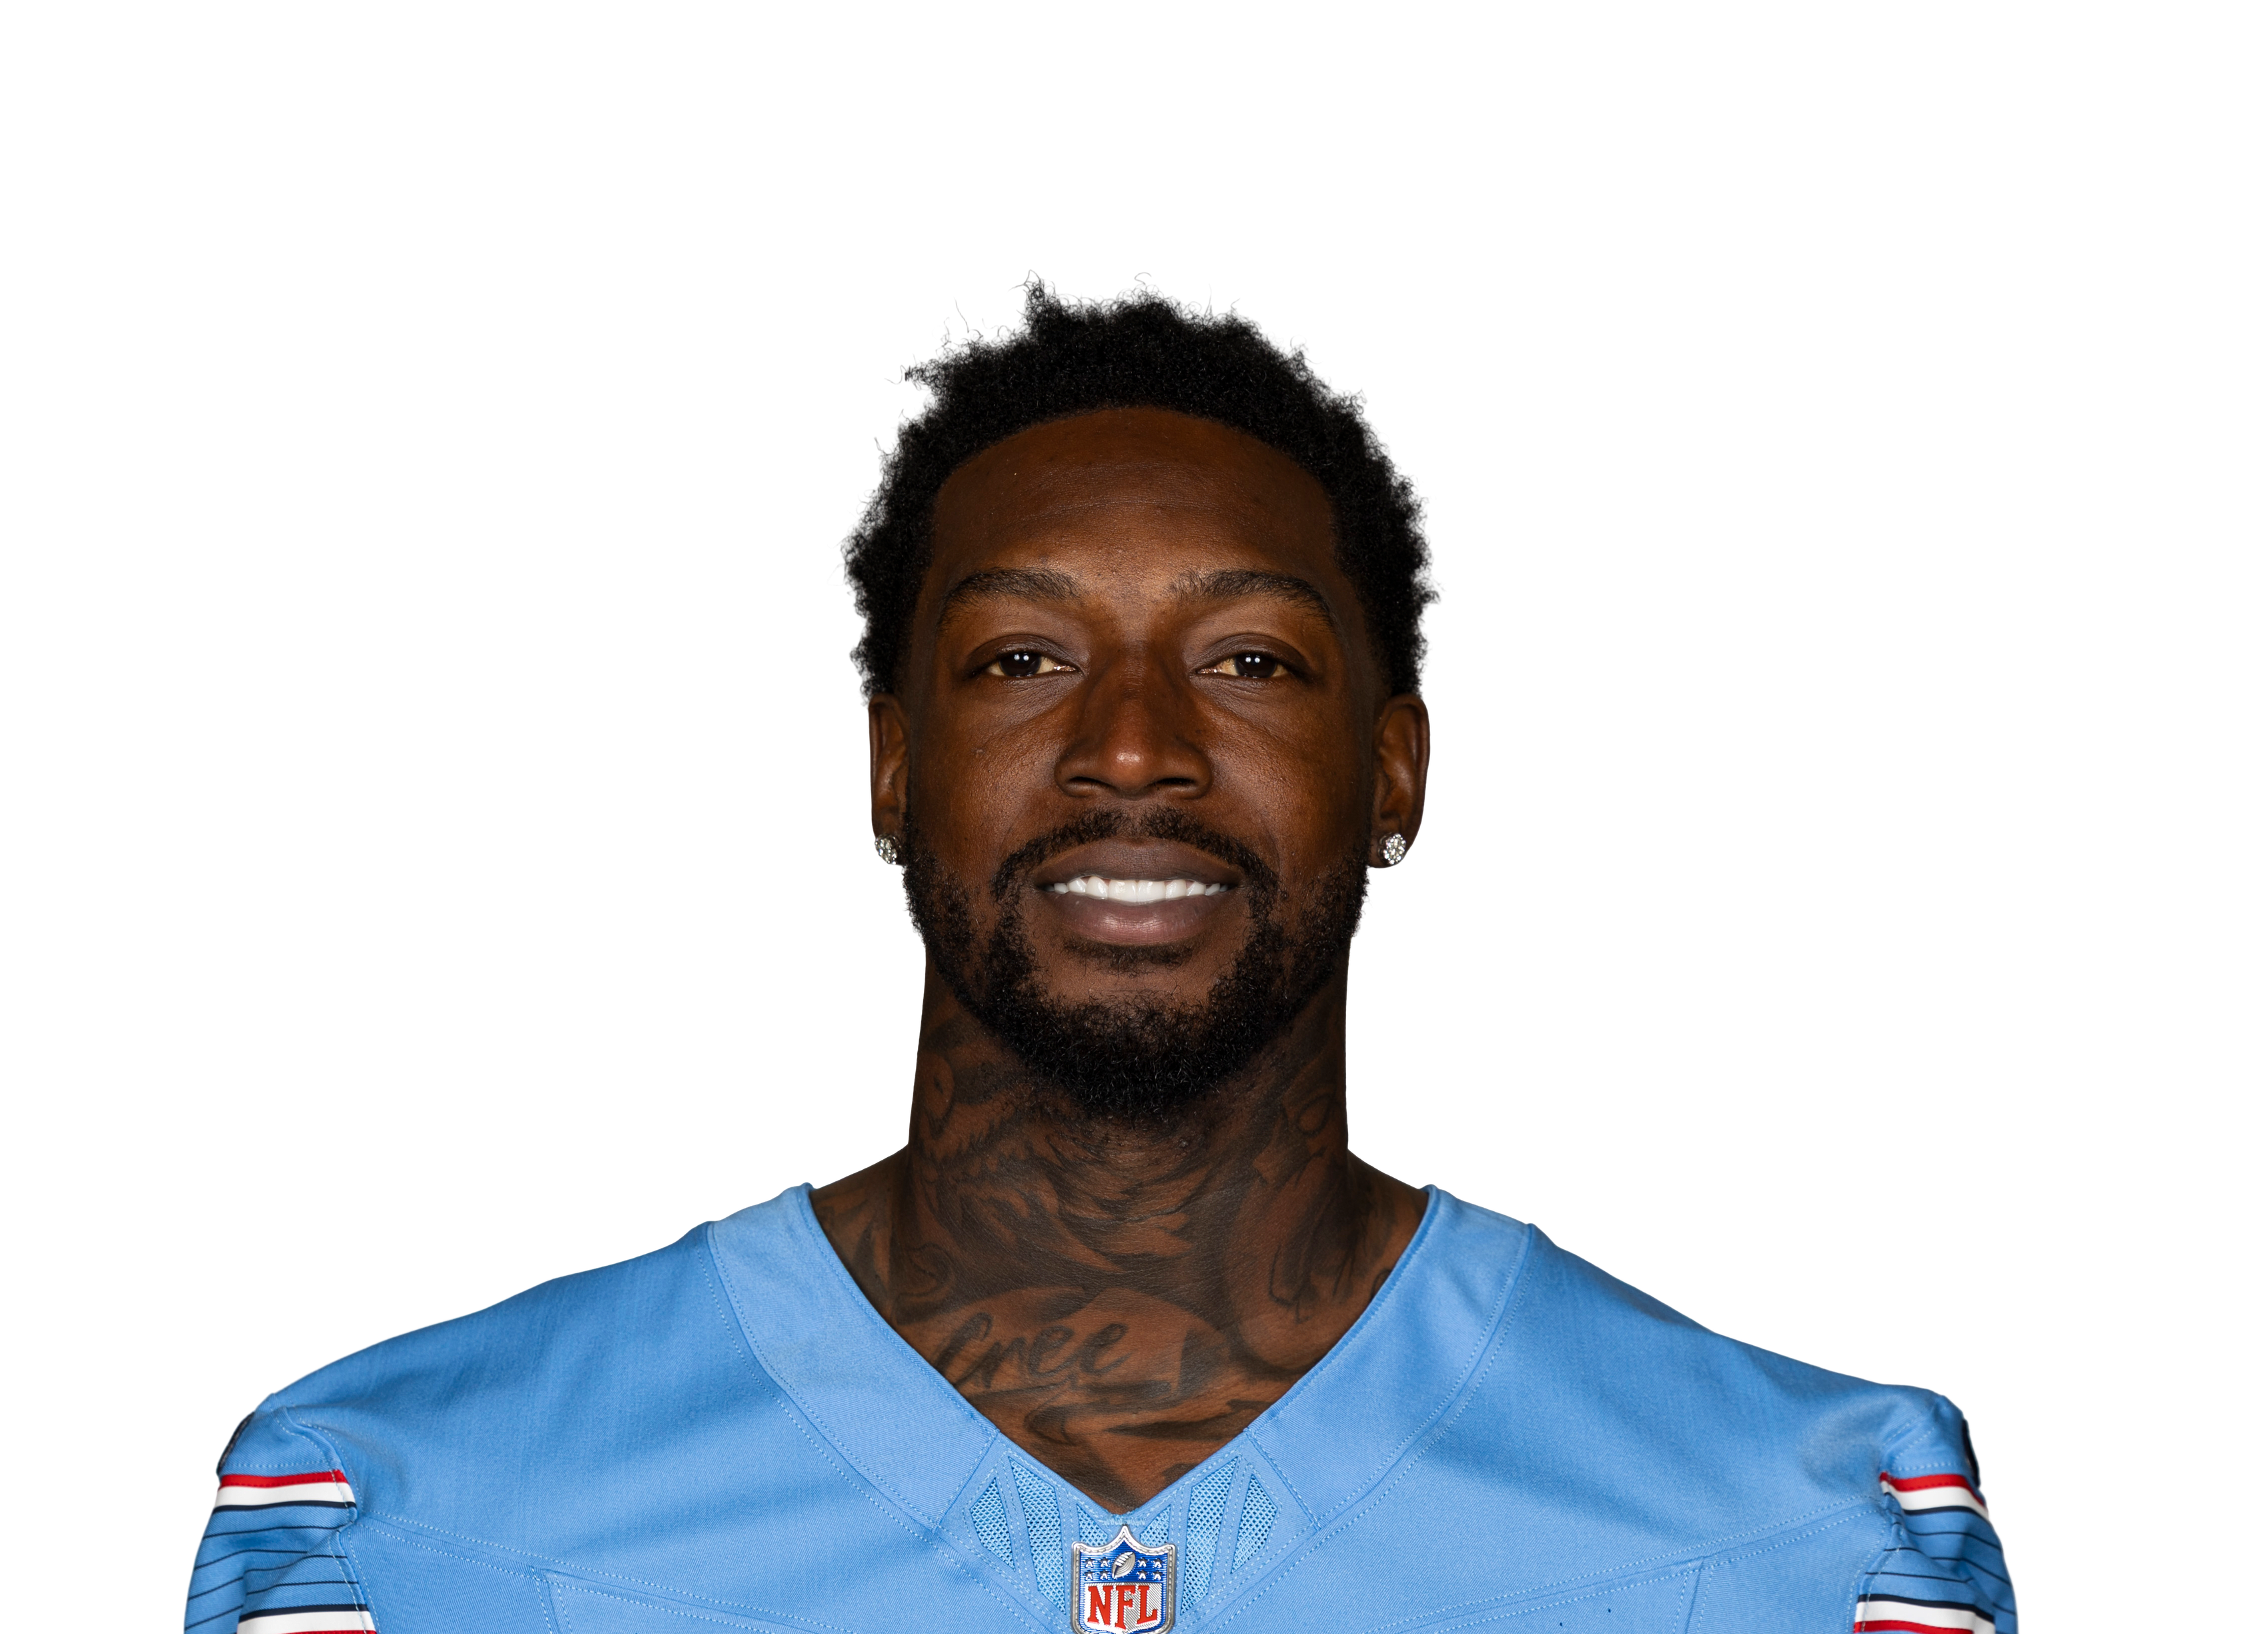 Calvin Ridleyvs TEN • Wk 8 | 2.0 | 3 | 1 | 10 | 0 | 0 |
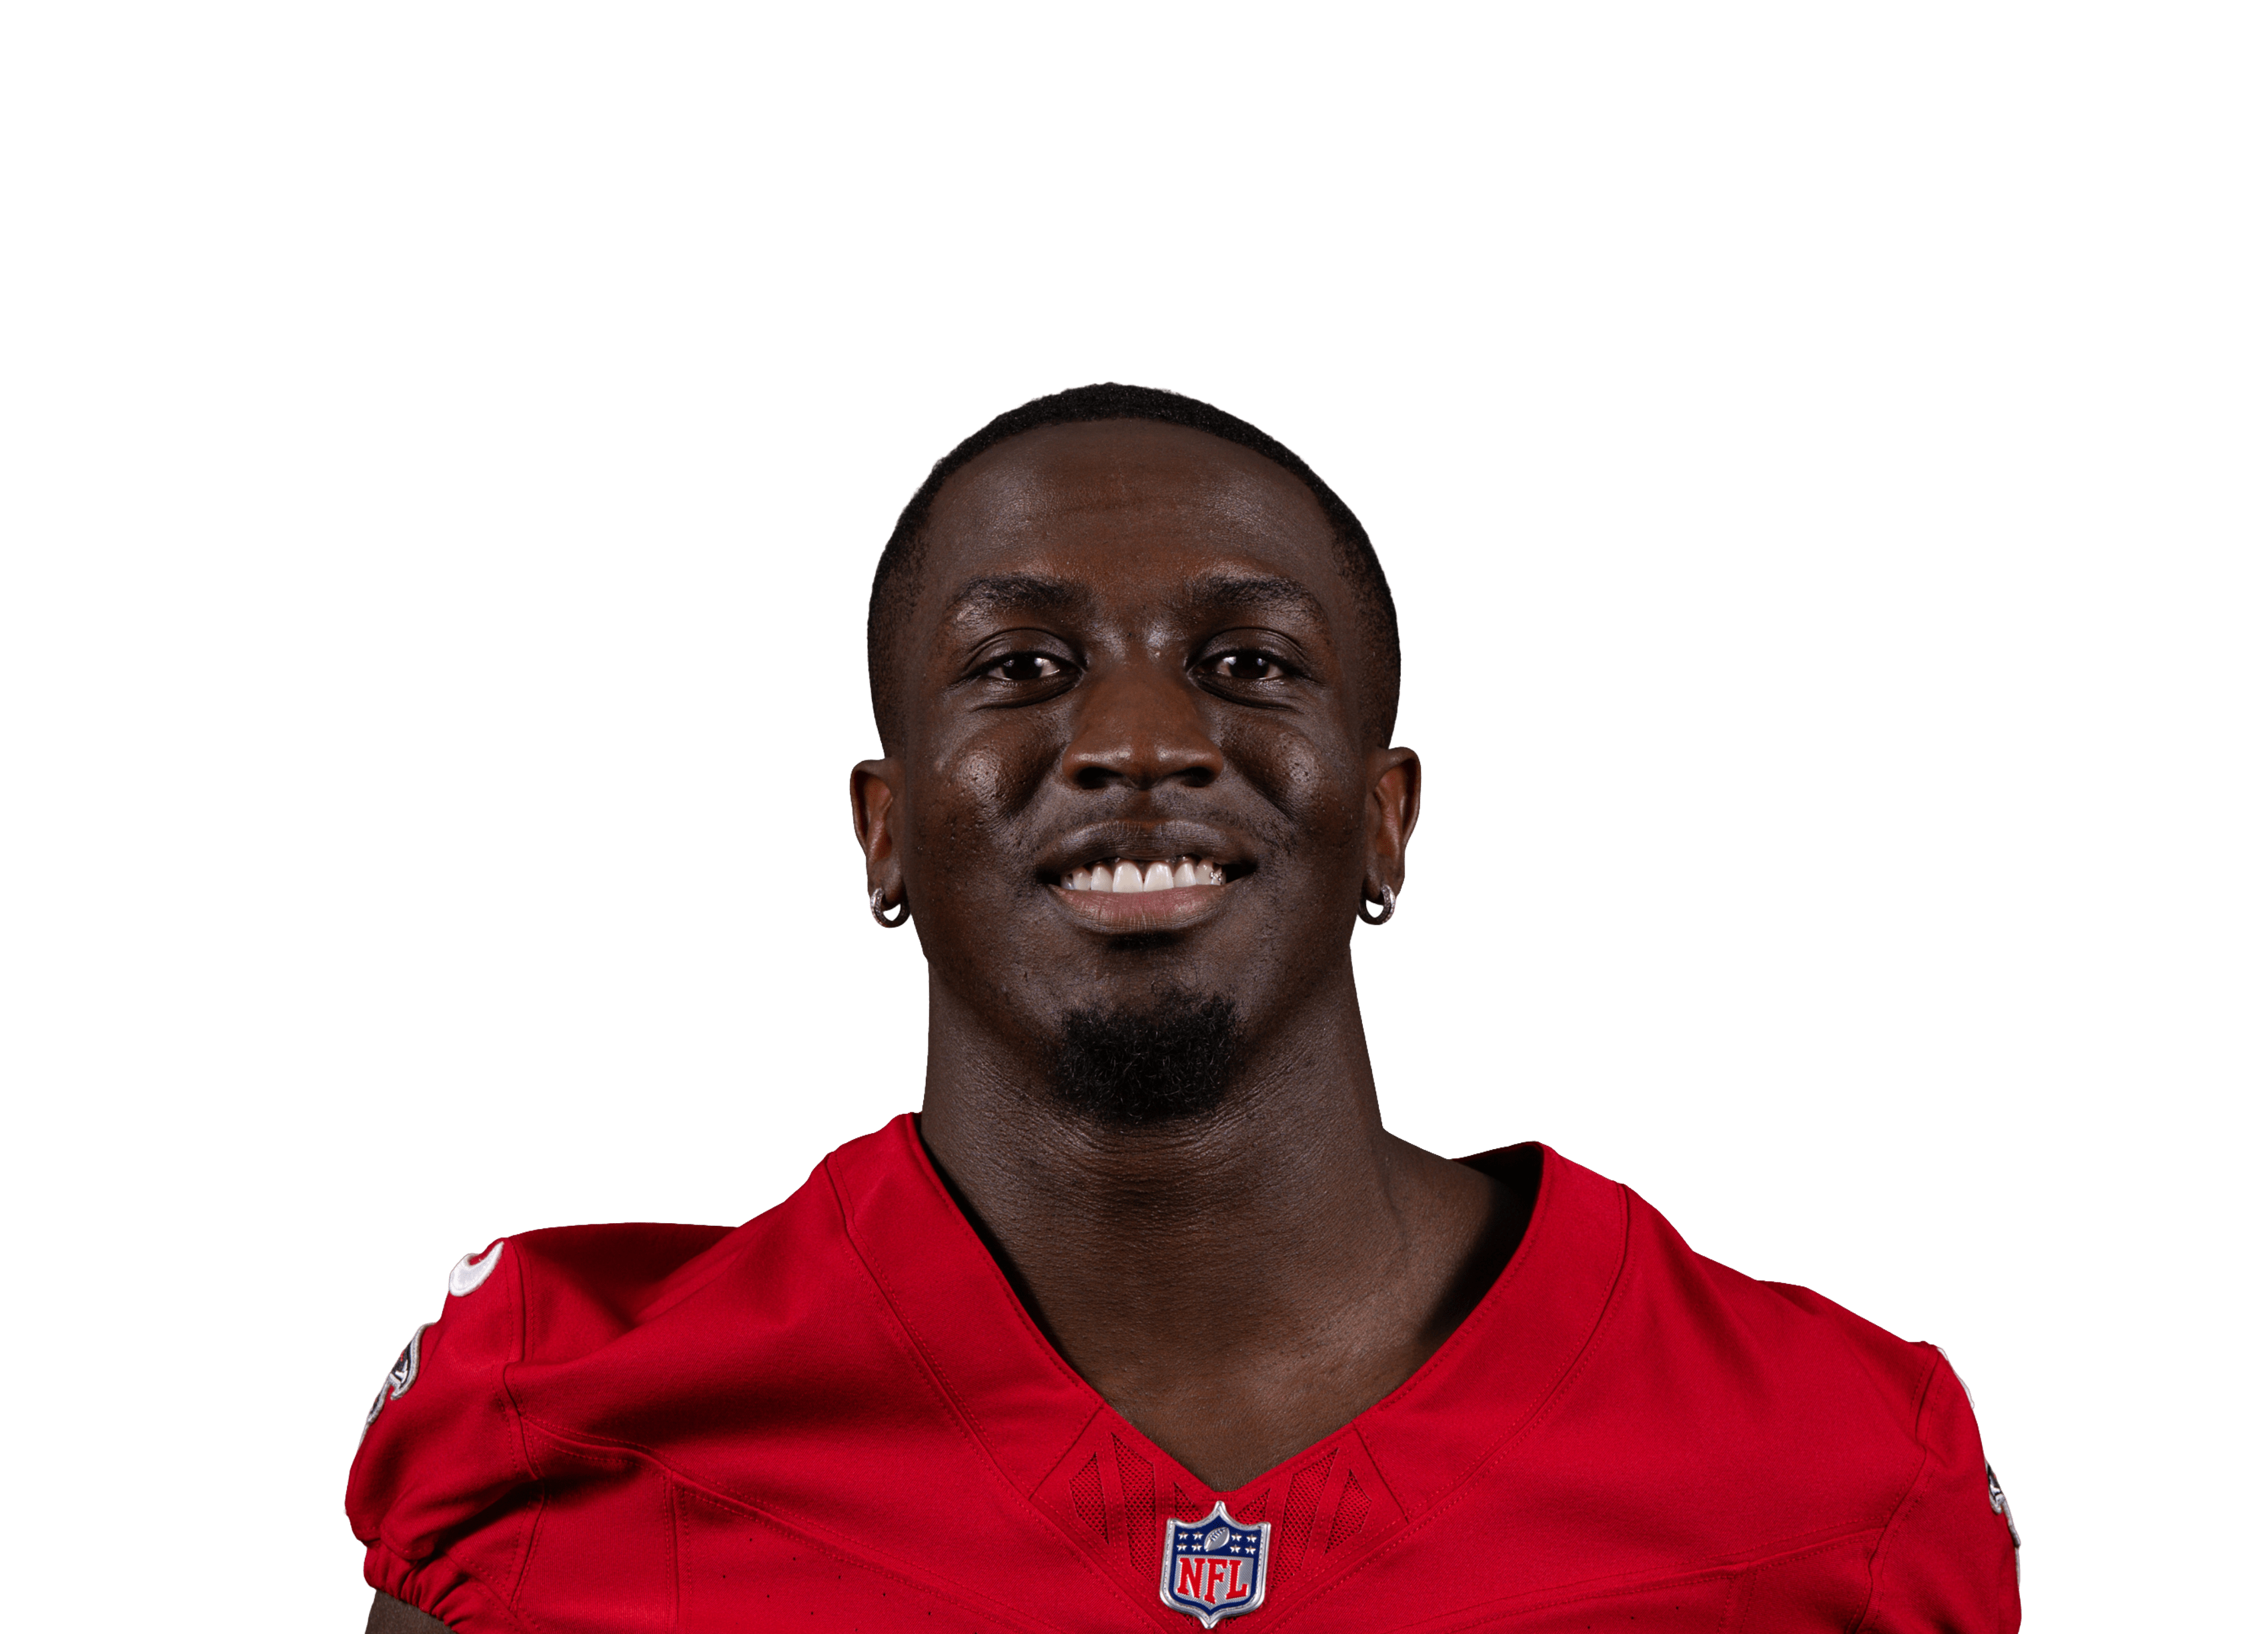 Olamide Zaccheaus@ ATL • Wk 9 | 1.5 | 3 | 1 | 5 | 0 | 0 |
| Ben Skowronekvs PIT • Wk 10 | 1.0 | 1 | 1 | 0 | 0 | 0 |
| Germie Bernardvs PIT • Wk 10 | 1.0 | 3 | 0 | 0 | 0 | 10 |
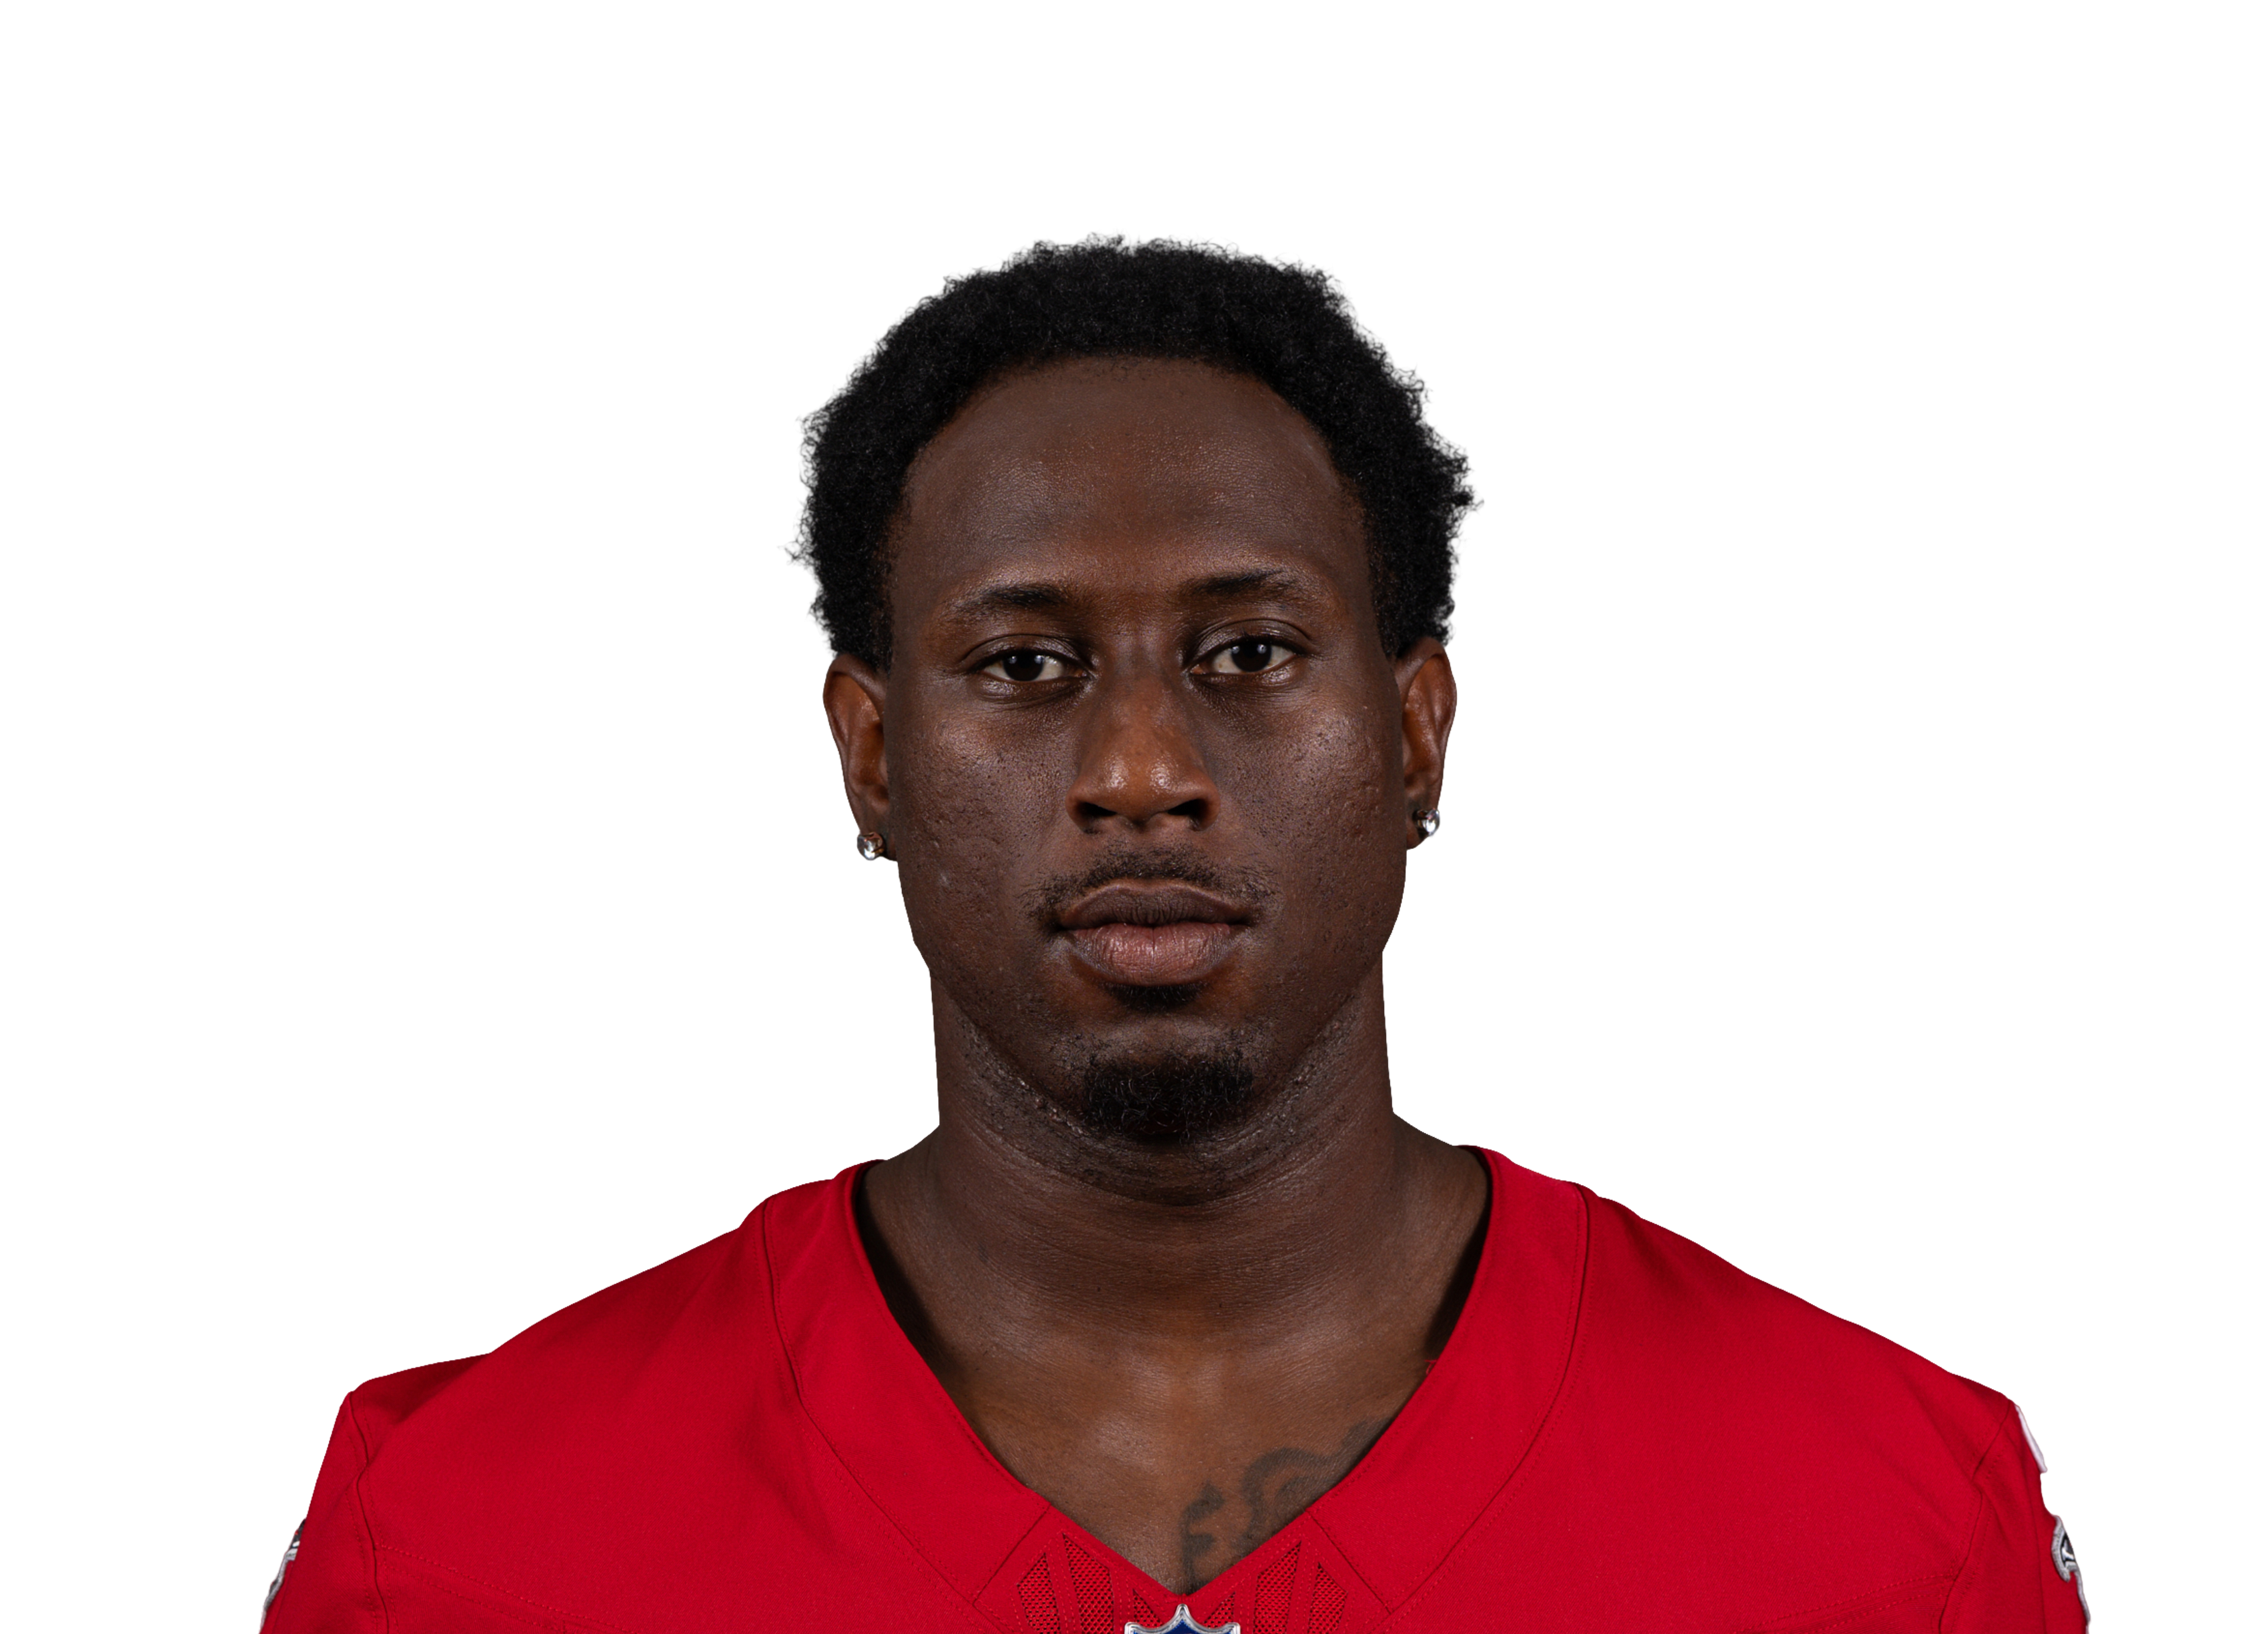 Chris Blair@ ATL • Wk 9 | 0.0 | 1 | 0 | 0 | 0 | 0 |
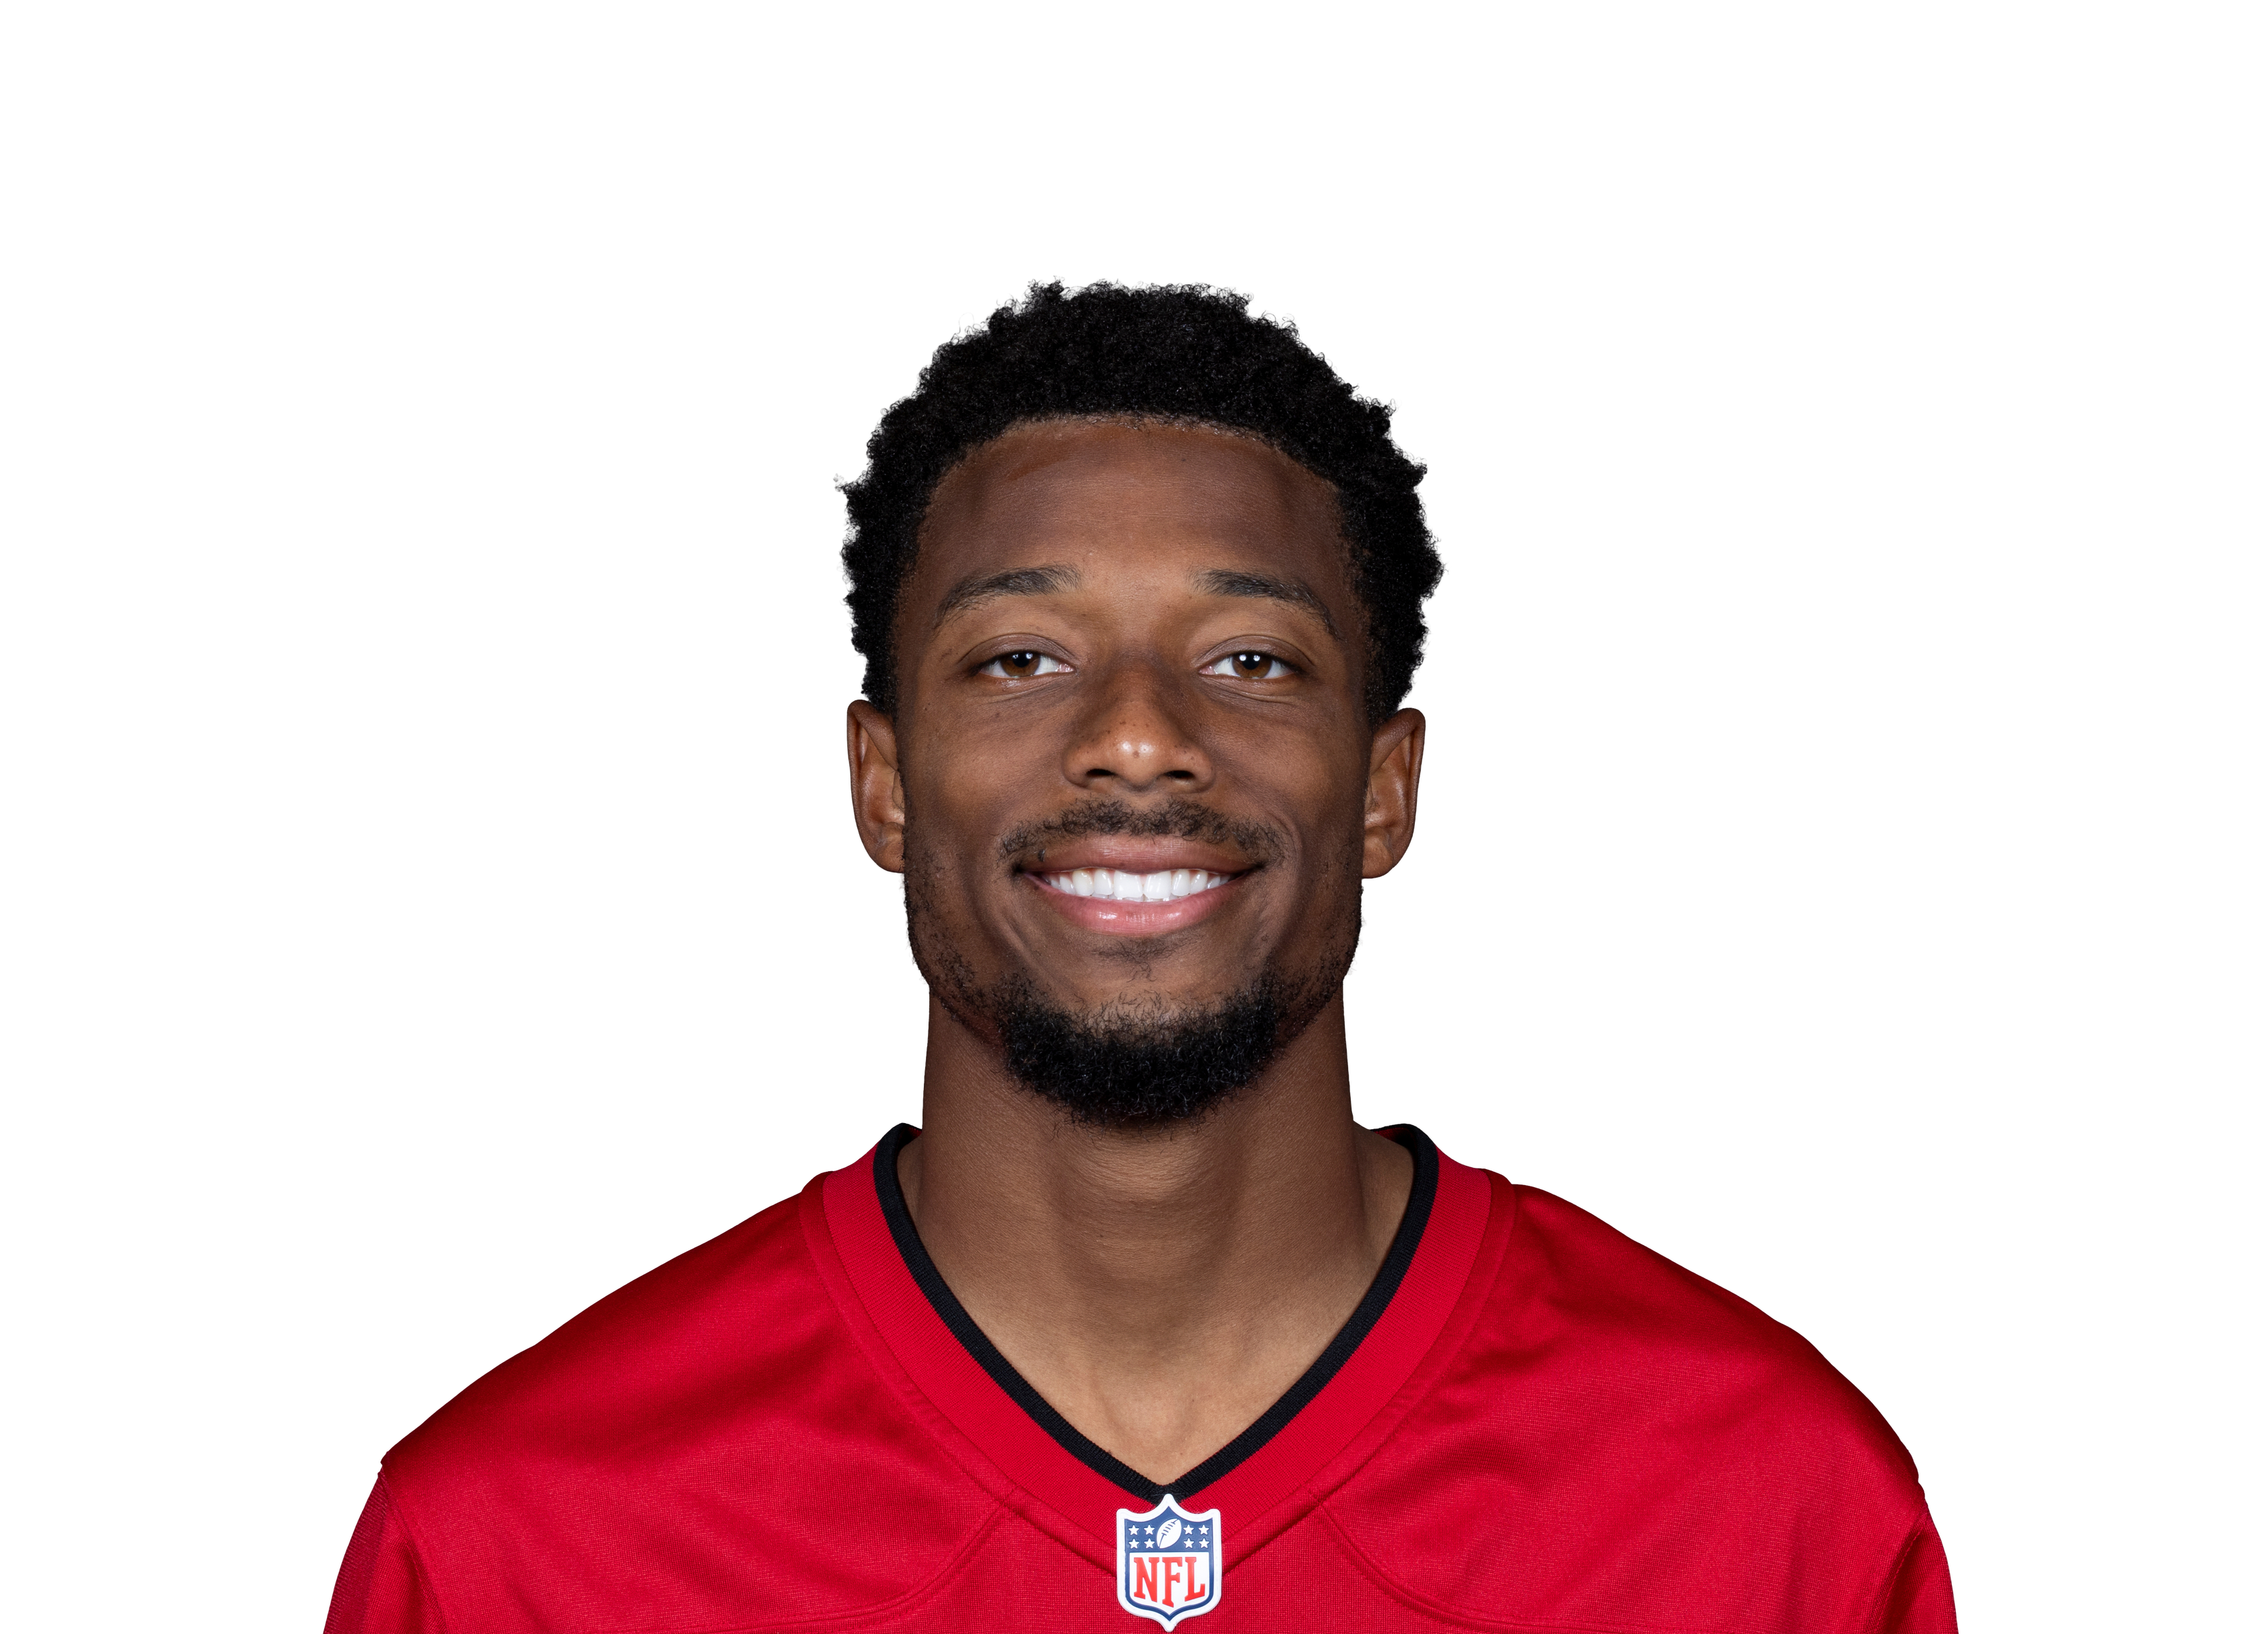 Tez Johnsonvs TB • Wk 1 | -0.4 | 1 | 0 | 0 | 0 | -4 |
Fantasy points first, then the stats that matter for his position. Ring around each photo is that player's Mania Rating. Tap a name to open his profile.
Usage
Snaps
13%
Target share
2%
Targets/G
0.5
PPR/G
1.1
By the numbers
PPR / Game
1.1
1st percentileWR avg 8.4
Targets / Game
0.5
1st percentileWR avg 4.9
Receiving Yards / Game
6.3
3rd percentileWR avg 39.4
Receptions / Game
0.5
3rd percentileWR avg 3
Share of Team Targets
1.7%
0th percentileWR avg 15.6%
Share of Team Air Yards
0.2%
0th percentileWR avg 22.2%
Red-Zone Targets / Game
0
10th percentileWR avg 0.7
End-Zone Targets / Game
0
18th percentileWR avg 0.4
Snap Share
12.5%
0th percentileWR avg 63.2%
TDs / Game
0
26th percentileWR avg 0.2
WAS WR room
S. Diggs23%
T. McLaurin22%
A. Williams15%
V. Jefferson14%
T. Burks12%
Share of targets
WAS WR room, week by week
Targets and receiving yards each week, with his share of the team targets and his snap percentage.
| Player | W1 | W2 | W3 | W4 | W5 | W6 | W8 | W9 | W10 | Per game |
|---|---|---|---|---|---|---|---|---|---|---|
| Stefon Diggs | 955 yds31% targets63% snaps | 647 yds18% targets51% snaps | 733 yds23% targets59% snaps | 935 yds25% targets66% snaps | — | 744 yds20% targets61% snaps | 638 yds22% targets65% snaps | 551 yds15% targets61% snaps | 1083 yds30% targets64% snaps | 7.448 yds a game • 6.5 per target23% targets61% snaps |
| Terry McLaurin | 414 yds14% targets87% snaps | 950 yds27% targets70% snaps | 977 yds30% targets75% snaps | — | 462 yds17% targets58% snaps | 127 yds3% targets10% snaps | — | — | — | 5.446 yds a game • 8.5 per target18% targets60% snaps |
| Van Jefferson | — | — | — | — | — | — | 10 yds4% targets12% snaps | 758 yds21% targets58% snaps | — | 4.029 yds a game • 7.3 per target12% targets35% snaps |
| Antonio Williams | 464 yds14% targets37% snaps | 324 yds9% targets49% snaps | 415 yds13% targets41% snaps | 821 yds22% targets69% snaps | 331 yds13% targets68% snaps | 450 yds11% targets67% snaps | 754 yds26% targets83% snaps | 625 yds18% targets84% snaps | 242 yds6% targets86% snaps | 4.636 yds a game • 8.0 per target15% targets65% snaps |
| Treylon Burks | — | 10 yds3% targets30% snaps | 213 yds7% targets36% snaps | 347 yds8% targets59% snaps | 526 yds22% targets73% snaps | 666 yds17% targets55% snaps | 581 yds19% targets67% snaps | — | 327 yds9% targets61% snaps | 3.637 yds a game • 10.4 per target12% targets54% snaps |
| Dyami Brown | 20 yds7% targets53% snaps | 621 yds18% targets55% snaps | 10 yds3% targets30% snaps | 465 yds11% targets56% snaps | 22 yds9% targets37% snaps | 16 yds3% targets49% snaps | 00 yds0% targets25% snaps | — | — | 2.313 yds a game • 5.9 per target7% targets44% snaps |
| Jaden Bradley | — | — | — | — | — | — | — | 112 yds3% targets27% snaps | — | 1.012 yds a game • 12.0 per target3% targets27% snaps |
| Jaylin Lane | 14 yds3% targets26% snaps | 00 yds0% targets15% snaps | 121 yds3% targets7% snaps | 00 yds0% targets2% snaps | — | — | — | — | — | 0.56 yds a game • 12.5 per target2% targets13% snaps |
| Luke McCaffrey | — | — | 00 yds0% targets0% snaps | — | 00 yds0% targets0% snaps | 10 yds3% targets12% snaps | 00 yds0% targets5% snaps | 16 yds3% targets15% snaps | 00 yds0% targets20% snaps | 0.31 yds a game • 3.0 per target1% targets9% snaps |
Each cell is targets that week, with receiving yards, share of team targets and snap percentage. Click a name to open that player.
Game log
Games4
PPR/G1.1
Game log
Lane avg 1.1NFL top 30 WRs avg 16.4
Solid dot is what he scored. Hollow dot is our projection before the game.
| Use | Game | Proj | PPR | Tgt | Rec | Rec Yd | Car | Rush Yd | TD | Snap |
|---|---|---|---|---|---|---|---|---|---|---|
W1 vs PHI | 3.8 | 1.4 | 1 | 1 | 4 | 0 | 0 | 0 | 26% | |
W2 vs DAL | 2.5 | 0 | 0 | 0 | 0 | 0 | 0 | 0 | 15% | |
W3 vs SEA | 1.4 | 3.1 | 1 | 1 | 21 | 0 | 0 | 0 | 7% | |
W4 vs IND | 1.9 | 0 | 0 | 0 | 0 | 0 | 0 | 0 | 2% |
Opponent color:Easy defense for WRsAverageTough
Schedule ahead
11 CIN12 ARI13 TEN14 HOU15 ATL16 MIN17 JAX18 DAL
Green easier, red tougher
Schedule ahead
Colored by what each defense has given up to WRs so far. Green is an easier matchup, red is a tougher one.
Wk 11 CINWk 12 ARIWk 13 TENWk 14 HOUWk 15 ATLWk 16 MINWk 17 JAXWk 18 DALSee every team's WR schedule ›
StatPer gameSeasonRank
Overall
Games—416›
PPR points1.14.51›
Receiving
Targets0.521›
Catches0.523›
Receiving yards6.2253›
Yards per target12.5—95›
Rushing
Scrimmage yards6.2253›
Usage
Snap %13%—1›
Target share %1.7%—1›
Touch share %0.8%—1›
Air yards share %0.2%21›
Tap any stat to see everyone ranked. Bars: green top 30%, yellow middle, red bottom 40%.
52.0
Mania Rating
Overall profile • Depth
OUT
Week 11 Rating
Start value vs CIN
Jaylin Lane
WAS • WR • 4 games#326 OverallWR168#8 WR on WASAge 24Out
OUT
This weekOUT
Games counted
Untick or tick any game and Mania Rating, matchup and Week 11 Rating all recalculate. Official Mania Rating 52.
Injured reserve • no Week 11 Rating
Week 11 Rating = recent role + opponent + the latest injury report (updated Sat Nov 21, 6:30 AM ET). Check final inactives before you set your lineup.
WAS WR room
S. Diggs23%
T. McLaurin22%
A. Williams15%
V. Jefferson14%
T. Burks12%
Share of targets
WAS WR room, week by week
Targets and receiving yards each week, with his share of the team targets and his snap percentage.
| Player | W1 | W2 | W3 | W4 | W5 | W6 | W8 | W9 | W10 | Per game |
|---|---|---|---|---|---|---|---|---|---|---|
| Stefon Diggs | 955 yds31% targets63% snaps | 647 yds18% targets51% snaps | 733 yds23% targets59% snaps | 935 yds25% targets66% snaps | — | 744 yds20% targets61% snaps | 638 yds22% targets65% snaps | 551 yds15% targets61% snaps | 1083 yds30% targets64% snaps | 7.448 yds a game • 6.5 per target23% targets61% snaps |
| Terry McLaurin | 414 yds14% targets87% snaps | 950 yds27% targets70% snaps | 977 yds30% targets75% snaps | — | 462 yds17% targets58% snaps | 127 yds3% targets10% snaps | — | — | — | 5.446 yds a game • 8.5 per target18% targets60% snaps |
| Van Jefferson | — | — | — | — | — | — | 10 yds4% targets12% snaps | 758 yds21% targets58% snaps | — | 4.029 yds a game • 7.3 per target12% targets35% snaps |
| Antonio Williams | 464 yds14% targets37% snaps | 324 yds9% targets49% snaps | 415 yds13% targets41% snaps | 821 yds22% targets69% snaps | 331 yds13% targets68% snaps | 450 yds11% targets67% snaps | 754 yds26% targets83% snaps | 625 yds18% targets84% snaps | 242 yds6% targets86% snaps | 4.636 yds a game • 8.0 per target15% targets65% snaps |
| Treylon Burks | — | 10 yds3% targets30% snaps | 213 yds7% targets36% snaps | 347 yds8% targets59% snaps | 526 yds22% targets73% snaps | 666 yds17% targets55% snaps | 581 yds19% targets67% snaps | — | 327 yds9% targets61% snaps | 3.637 yds a game • 10.4 per target12% targets54% snaps |
| Dyami Brown | 20 yds7% targets53% snaps | 621 yds18% targets55% snaps | 10 yds3% targets30% snaps | 465 yds11% targets56% snaps | 22 yds9% targets37% snaps | 16 yds3% targets49% snaps | 00 yds0% targets25% snaps | — | — | 2.313 yds a game • 5.9 per target7% targets44% snaps |
| Jaden Bradley | — | — | — | — | — | — | — | 112 yds3% targets27% snaps | — | 1.012 yds a game • 12.0 per target3% targets27% snaps |
| Jaylin Lane | 14 yds3% targets26% snaps | 00 yds0% targets15% snaps | 121 yds3% targets7% snaps | 00 yds0% targets2% snaps | — | — | — | — | — | 0.56 yds a game • 12.5 per target2% targets13% snaps |
| Luke McCaffrey | — | — | 00 yds0% targets0% snaps | — | 00 yds0% targets0% snaps | 10 yds3% targets12% snaps | 00 yds0% targets5% snaps | 16 yds3% targets15% snaps | 00 yds0% targets20% snaps | 0.31 yds a game • 3.0 per target1% targets9% snaps |
Each cell is targets that week, with receiving yards, share of team targets and snap percentage. Click a name to open that player.
Game log
Games4
PPR/G1.1
Game log
Lane avg 1.1NFL top 30 WRs avg 16.4
Solid dot is what he scored. Hollow dot is our projection before the game.
| Use | Game | Proj | PPR | Tgt | Rec | Rec Yd | Car | Rush Yd | TD | Snap |
|---|---|---|---|---|---|---|---|---|---|---|
| W1vs PHI | 3.8 | 1.4 | 1 | 1 | 4 | 0 | 0 | 0 | 26% | |
| W2vs DAL | 2.5 | 0 | 0 | 0 | 0 | 0 | 0 | 0 | 15% | |
| W3vs SEA | 1.4 | 3.1 | 1 | 1 | 21 | 0 | 0 | 0 | 7% | |
| W4vs IND | 1.9 | 0 | 0 | 0 | 0 | 0 | 0 | 0 | 2% |
Opponent color:Easy defense for WRsAverageTough
Schedule ahead
11 CIN12 ARI13 TEN14 HOU15 ATL16 MIN17 JAX18 DAL
Green easier, red tougher
Schedule ahead
Colored by what each defense has given up to WRs so far. Green is an easier matchup, red is a tougher one.
Wk 11 CINWk 12 ARIWk 13 TENWk 14 HOUWk 15 ATLWk 16 MINWk 17 JAXWk 18 DALSee every team's WR schedule ›
StatPer gameSeasonRank
Overall
Games—416›
PPR points1.14.51›
Receiving
Targets0.521›
Catches0.523›
Receiving yards6.2253›
Yards per target12.5—95›
Rushing
Scrimmage yards6.2253›
Usage
Snap %13%—1›
Target share %1.7%—1›
Touch share %0.8%—1›
Air yards share %0.2%21›
Tap any stat to see everyone ranked. Bars: green top 30%, yellow middle, red bottom 40%.
Mania breakdown
Fantasy Production1
Target Volume1
Team Target Role0
Red-Zone Threat0
Per-Target Efficiency96
Mania breakdown
Percentile among WRs. 100 is the best, 50 is average.
How many fantasy points and total yards he is actually producing, compared with players at his position. Ranks better than 1% of WRs.
How often he is targeted: targets per game, receptions and his share of the team targets. Ranks better than 1% of WRs.
How big a slice of his team passing game belongs to him: target share, air-yard share and snaps. Ranks better than 0% of WRs.
How often the offense uses him near the goal line: red-zone targets and end-zone targets. Ranks better than 0% of WRs.
What he produces with each chance instead of just rewarding volume: yards per target, catch rate and fantasy points per opportunity. Ranks better than 96% of WRs.
Top 30%MiddleBottom 40%Tap a category to see what it means.
Week 11 matchup
vs CIN
Good matchup
Adjustment+6.0 pts
Allows to WRs24th most
Week11
Week 11 matchup
vs CIN
+6Rating boost
Good matchup24th easiest of 32 defenses for WRs
ToughEasy
29.1PPR a game CIN allows to WRs
3.5Similar players, usual PPR a game
3.4Same players against CIN
Players with a role like his scored 3.4 PPR a game against CIN, versus 3.5 in their usual games (-4%). That moves his Week 11 Rating by +6.
How wide receivers did against CIN
29.7 PPR points a game allowed to wide receivers, 24th most of 32 defenses.
| Player | PPR | Tgt | Rec | Rec Yd | Rec TD | Rush Yd |
|---|---|---|---|---|---|---|
| Zay Flowers@ BAL • Wk 7 | 27.7 | 11 | 8 | 137 | 1 | 0 |
| Chimere Dikevs TEN • Wk 8 | 18.1 | 6 | 5 | 71 | 1 | 0 |
| Wan'Dale Robinsonvs TEN • Wk 8 | 15.7 | 7 | 6 | 57 | 1 | 0 |
| DK Metcalfvs PIT • Wk 10 | 15.4 | 6 | 2 | 54 | 1 | 0 |
| Roman Wilson@ PIT • Wk 3 | 15.0 | 6 | 3 | 60 | 1 | 0 |
| DK Metcalf@ PIT • Wk 3 | 12.1 | 5 | 3 | 31 | 1 | 0 |
| Malik Washington@ MIA • Wk 5 | 12.1 | 8 | 6 | 43 | 0 | 18 |
| Kevin Coleman Jr.@ MIA • Wk 5 | 12.0 | 7 | 3 | 30 | 1 | 0 |
| Drake London@ ATL • Wk 9 | 11.8 | 5 | 5 | 68 | 0 | 0 |
| Emeka Egbukavs TB • Wk 1 | 11.3 | 6 | 5 | 63 | 0 | 0 |
| Brian Thomas Jr.vs JAX • Wk 4 | 9.7 | 2 | 2 | 17 | 1 | 0 |
| Ben Skowronek@ PIT • Wk 3 | 9.3 | 1 | 1 | 23 | 1 | 0 |
| Chris Godwin Jr.vs TB • Wk 1 | 8.3 | 4 | 4 | 40 | 0 | 3 |
| Kayshon Boutte@ HOU • Wk 2 | 6.7 | 5 | 3 | 37 | 0 | 0 |
| Xavier Hutchinson@ HOU • Wk 2 | 6.7 | 9 | 3 | 37 | 0 | 0 |
| Ted Hurst IIIvs TB • Wk 1 | 6.6 | 3 | 3 | 36 | 0 | 0 |
| Elic Ayomanorvs TEN • Wk 8 | 6.4 | 5 | 3 | 34 | 0 | 0 |
| Jakobi Meyersvs JAX • Wk 4 | 6.3 | 4 | 3 | 33 | 0 | 0 |
| Josh Cameronvs JAX • Wk 4 | 6.2 | 2 | 2 | 42 | 0 | 0 |
| Ja'Kobi Lane@ BAL • Wk 7 | 5.5 | 5 | 3 | 25 | 0 | 0 |
| Jaylin Noel@ HOU • Wk 2 | 5.4 | 5 | 1 | 31 | 0 | 13 |
| Jared Wayne@ HOU • Wk 2 | 5.3 | 7 | 2 | 33 | 0 | 0 |
| Rashod Bateman@ BAL • Wk 7 | 5.3 | 4 | 2 | 33 | 0 | 0 |
| Michael Pittman@ PIT • Wk 3 | 3.6 | 5 | 2 | 16 | 0 | 0 |
| Jahan Dotson@ ATL • Wk 9 | 3.6 | 2 | 2 | 16 | 0 | 0 |
| Brandon Smithvs PIT • Wk 10 | 3.5 | 3 | 2 | 15 | 0 | 0 |
| Jalen Tolbert@ MIA • Wk 5 | 3.2 | 2 | 1 | 22 | 0 | 0 |
| Chris Bell@ MIA • Wk 5 | 2.6 | 2 | 0 | 0 | 0 | 26 |
| LaJohntay Wester@ BAL • Wk 7 | 2.5 | 1 | 1 | 15 | 0 | 0 |
| Germie Bernard@ PIT • Wk 3 | 2.4 | 1 | 1 | 14 | 0 | 0 |
| Parker Washingtonvs JAX • Wk 4 | 2.0 | 3 | 1 | 7 | 0 | 3 |
| Calvin Ridleyvs TEN • Wk 8 | 2.0 | 3 | 1 | 10 | 0 | 0 |
| Olamide Zaccheaus@ ATL • Wk 9 | 1.5 | 3 | 1 | 5 | 0 | 0 |
| Ben Skowronekvs PIT • Wk 10 | 1.0 | 1 | 1 | 0 | 0 | 0 |
| Germie Bernardvs PIT • Wk 10 | 1.0 | 3 | 0 | 0 | 0 | 10 |
| Chris Blair@ ATL • Wk 9 | 0.0 | 1 | 0 | 0 | 0 | 0 |
| Tez Johnsonvs TB • Wk 1 | -0.4 | 1 | 0 | 0 | 0 | -4 |
Fantasy points first, then the stats that matter for his position. Ring around each photo is that player's Mania Rating. Tap a name to open his profile.
Usage
Snaps
13%
Target share
2%
Targets/G
0.5
PPR/G
1.1
By the numbers
PPR / Game
1.1
1st percentileWR avg 8.4
Targets / Game
0.5
1st percentileWR avg 4.9
Receiving Yards / Game
6.3
3rd percentileWR avg 39.4
Receptions / Game
0.5
3rd percentileWR avg 3
Share of Team Targets
1.7%
0th percentileWR avg 15.6%
Share of Team Air Yards
0.2%
0th percentileWR avg 22.2%
Red-Zone Targets / Game
0
10th percentileWR avg 0.7
End-Zone Targets / Game
0
18th percentileWR avg 0.4
Snap Share
12.5%
0th percentileWR avg 63.2%
TDs / Game
0
26th percentileWR avg 0.2