
49.0MANIA OVERALL
MANIA RATING • DEPTH
Zavier Scott
 CHI • RB • 4 games
#418 OverallRB141#5 RB on CHIAge 27Out
OUTWEEK 11 RATINGStart value vs NO
—WEEK 11 PROJECTIONPPR
0%TOUCH SHARE1st percentile
0%SNAP SHARE1st percentile
Games counted
Untick or tick any game and Mania Rating, matchup and Week 11 Rating all recalculate. Official Mania Rating 49.
Injured reserve (Not Specified) • no Week 11 Rating • Est. return Dec 13 (Week 14, ESPN)
Week 11 Rating = recent role + opponent + the latest injury report (updated Sat Nov 21, 6:30 AM ET). Check final inactives before you set your lineup.
Mania breakdown
Fantasy Production1
Touch Volume0
Backfield Control0
Goal-Line / Red-Zone5
Per-Touch Efficiency0
Mania breakdown
Percentile among RBs. 100 is the best, 50 is average.
How many fantasy points and total yards he is actually producing, compared with players at his position. Ranks better than 1% of RBs.
How many carries and targets he gets per game compared with other running backs. Ranks better than 0% of RBs.
How much of his team backfield he owns: share of touches plus snap share. Ranks better than 0% of RBs.
Scoring-position work: red-zone carries, goal-line carries (inside the 5) and red-zone targets. Ranks better than 5% of RBs.
What he produces with each touch instead of just rewarding volume: fantasy points per touch, yards per carry and catch rate. Ranks better than 0% of RBs.
Top 30%MiddleBottom 40%Tap a category to see what it means.
Week 11 matchup
vs NO
Good matchup
Adjustment+6.0 pts
Allows to RBs1st most
Week11

Week 11 matchup
vs NO
+6Rating boost
Good matchup2nd easiest of 32 defenses for RBs
ToughEasy
29.1PPR a game NO allows to RBs
5.3Similar players, usual PPR a game
14.6Same players against NO
Players with a role like his scored 14.6 PPR a game against NO, versus 5.3 in their usual games (+177%). That moves his Week 11 Rating by +6.
How running backs did against NO
29.1 PPR points a game allowed to running backs, 2nd most of 32 defenses.
| Player | PPR | Rush | Rush Yd | Rush TD | Rec | Rec Yd |
|---|---|---|---|---|---|---|
 Chuba Hubbardvs CAR • Wk 10 | 34.2 | 27 | 92 | 2 | 5 | 80 |
 Jahmyr Gibbs@ DET • Wk 1 | 33.6 | 29 | 156 | 2 | 5 | 30 |
 Bijan Robinsonvs ATL • Wk 4 | 27.7 | 19 | 145 | 2 | 1 | 2 |
 Brian Robinsonvs ATL • Wk 4 | 25.7 | 14 | 62 | 3 | 1 | 5 |
 Aaron Jonesvs MIN • Wk 5 | 18.7 | 25 | 113 | 1 | 3 | 4 |
 Tyrone Tracy Jr.@ NYG • Wk 6 | 18.5 | 6 | 18 | 1 | 2 | 27 |
 Derrick Henry@ BAL • Wk 2 | 17.7 | 16 | 68 | 1 | 3 | 19 |
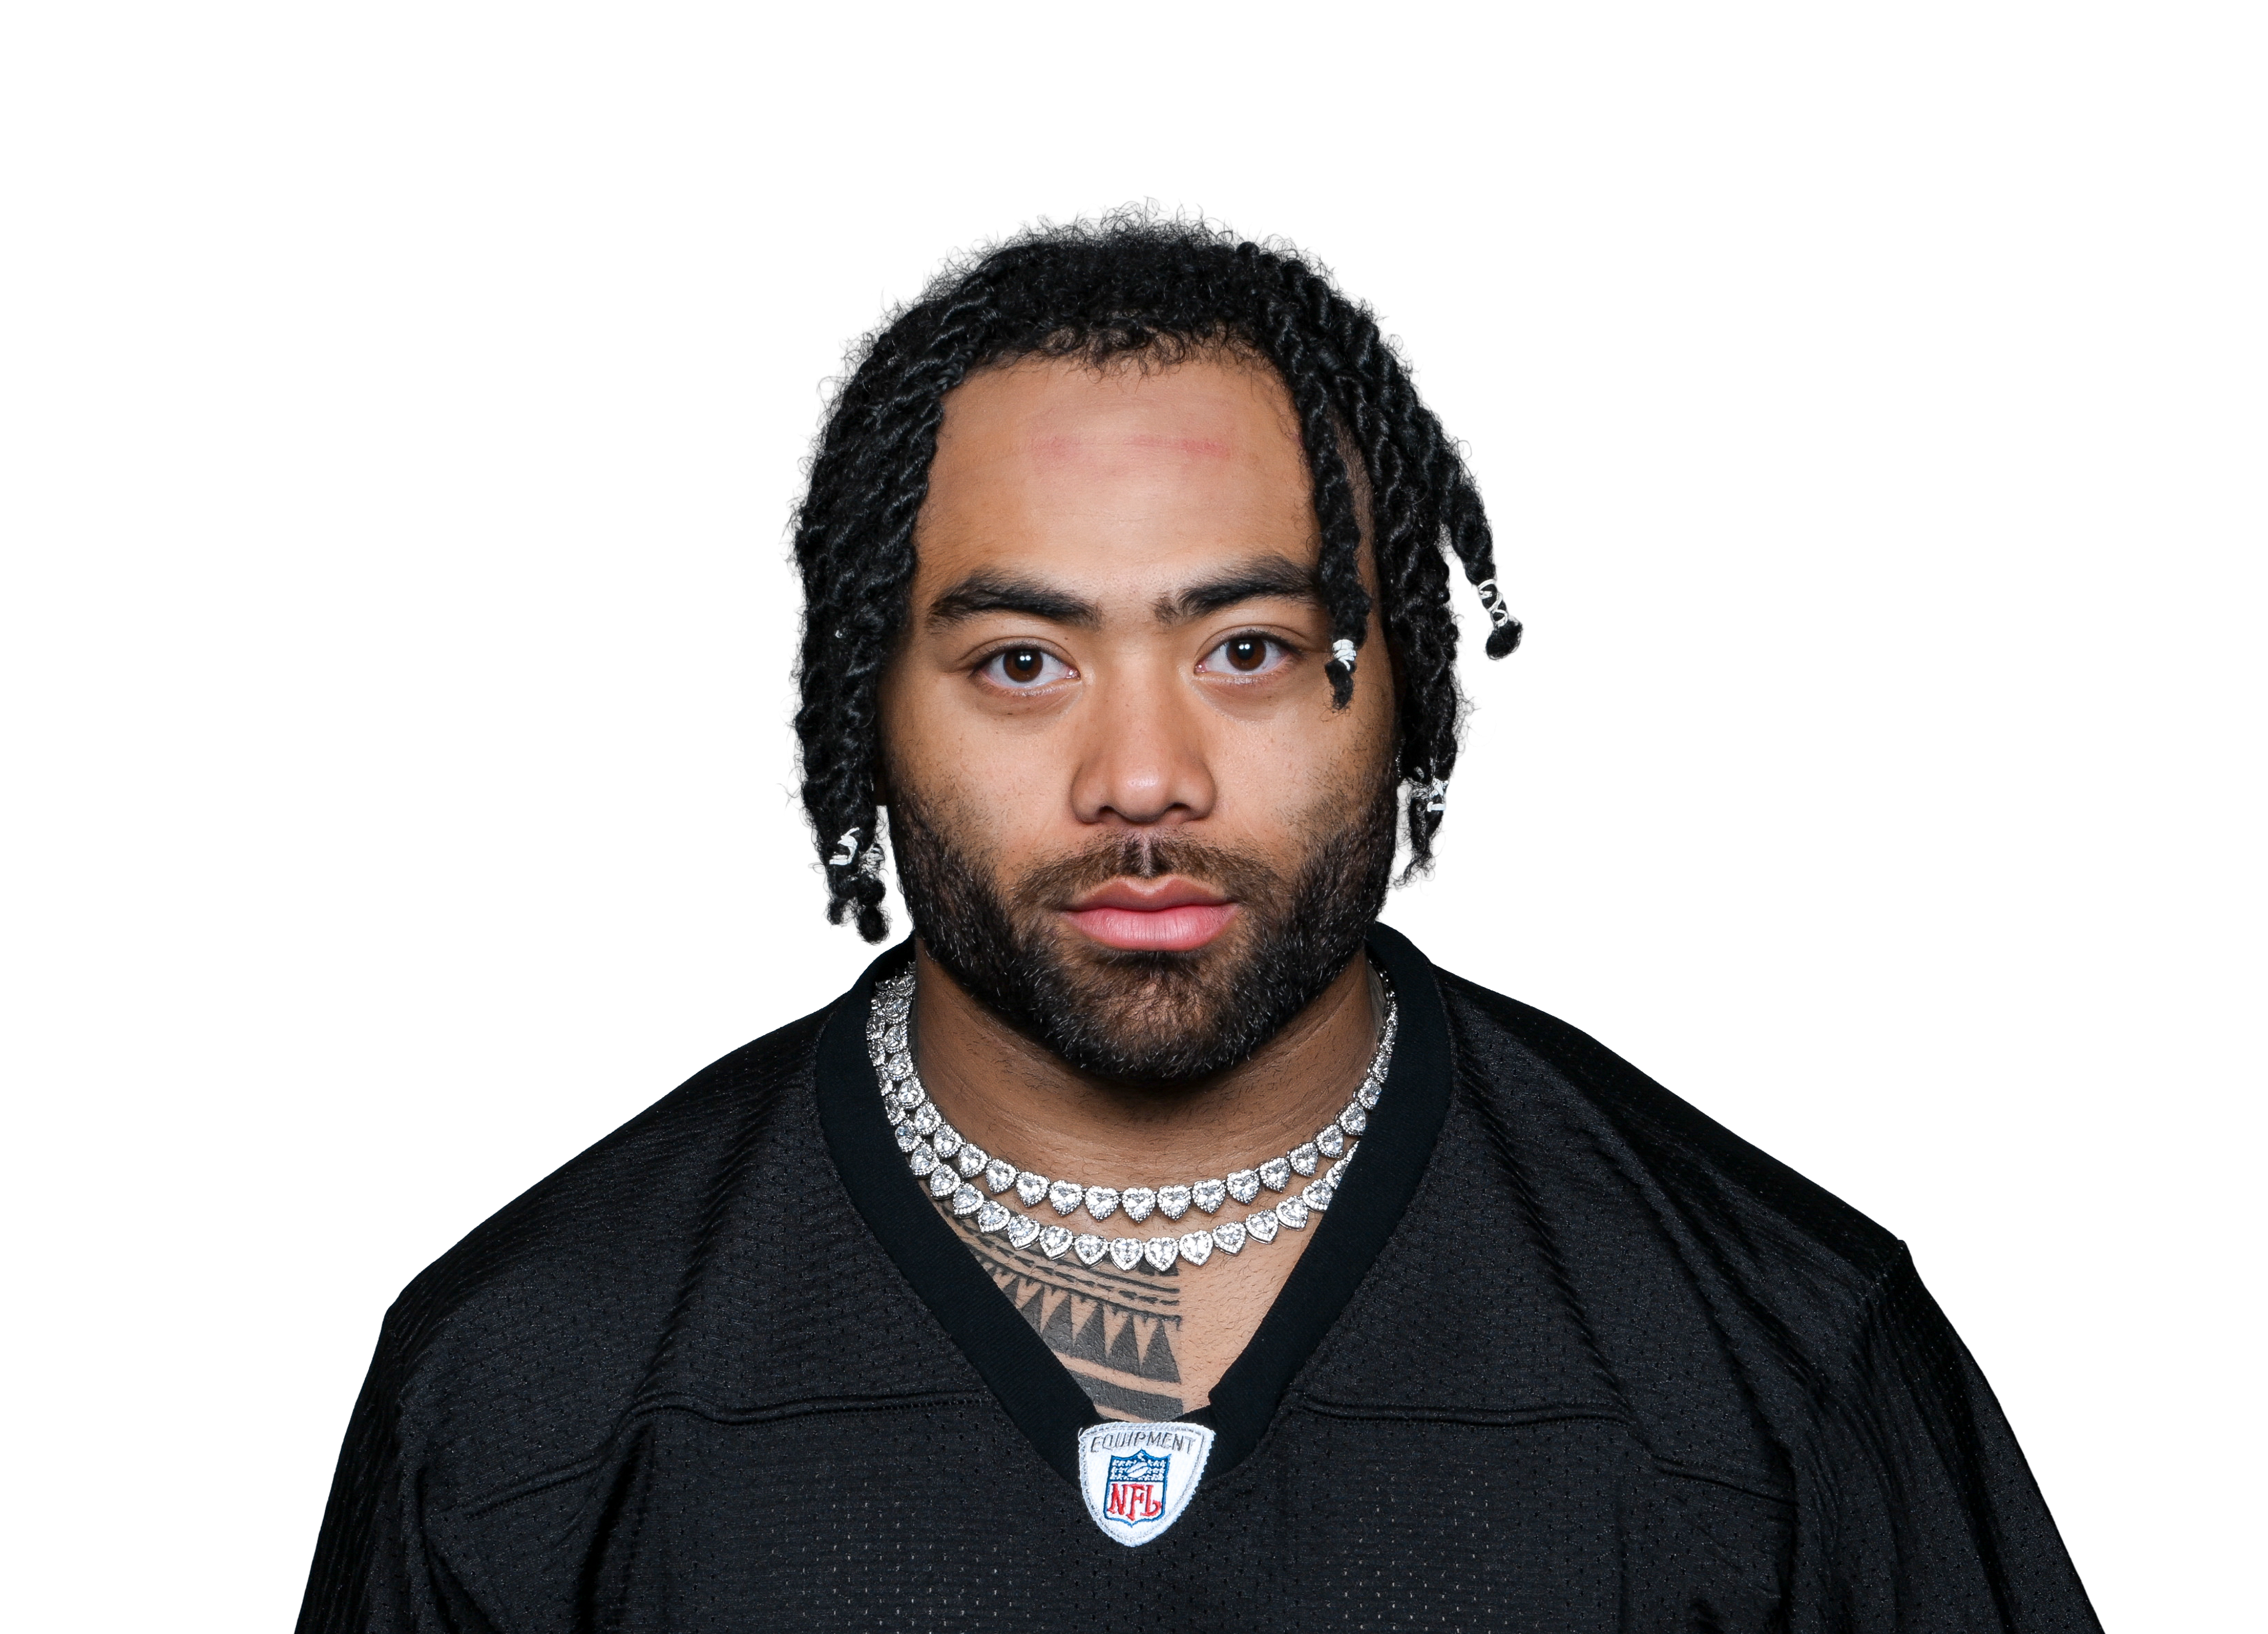 Jaylen Warrenvs PIT • Wk 7 | 16.7 | 18 | 101 | 0 | 3 | 36 |
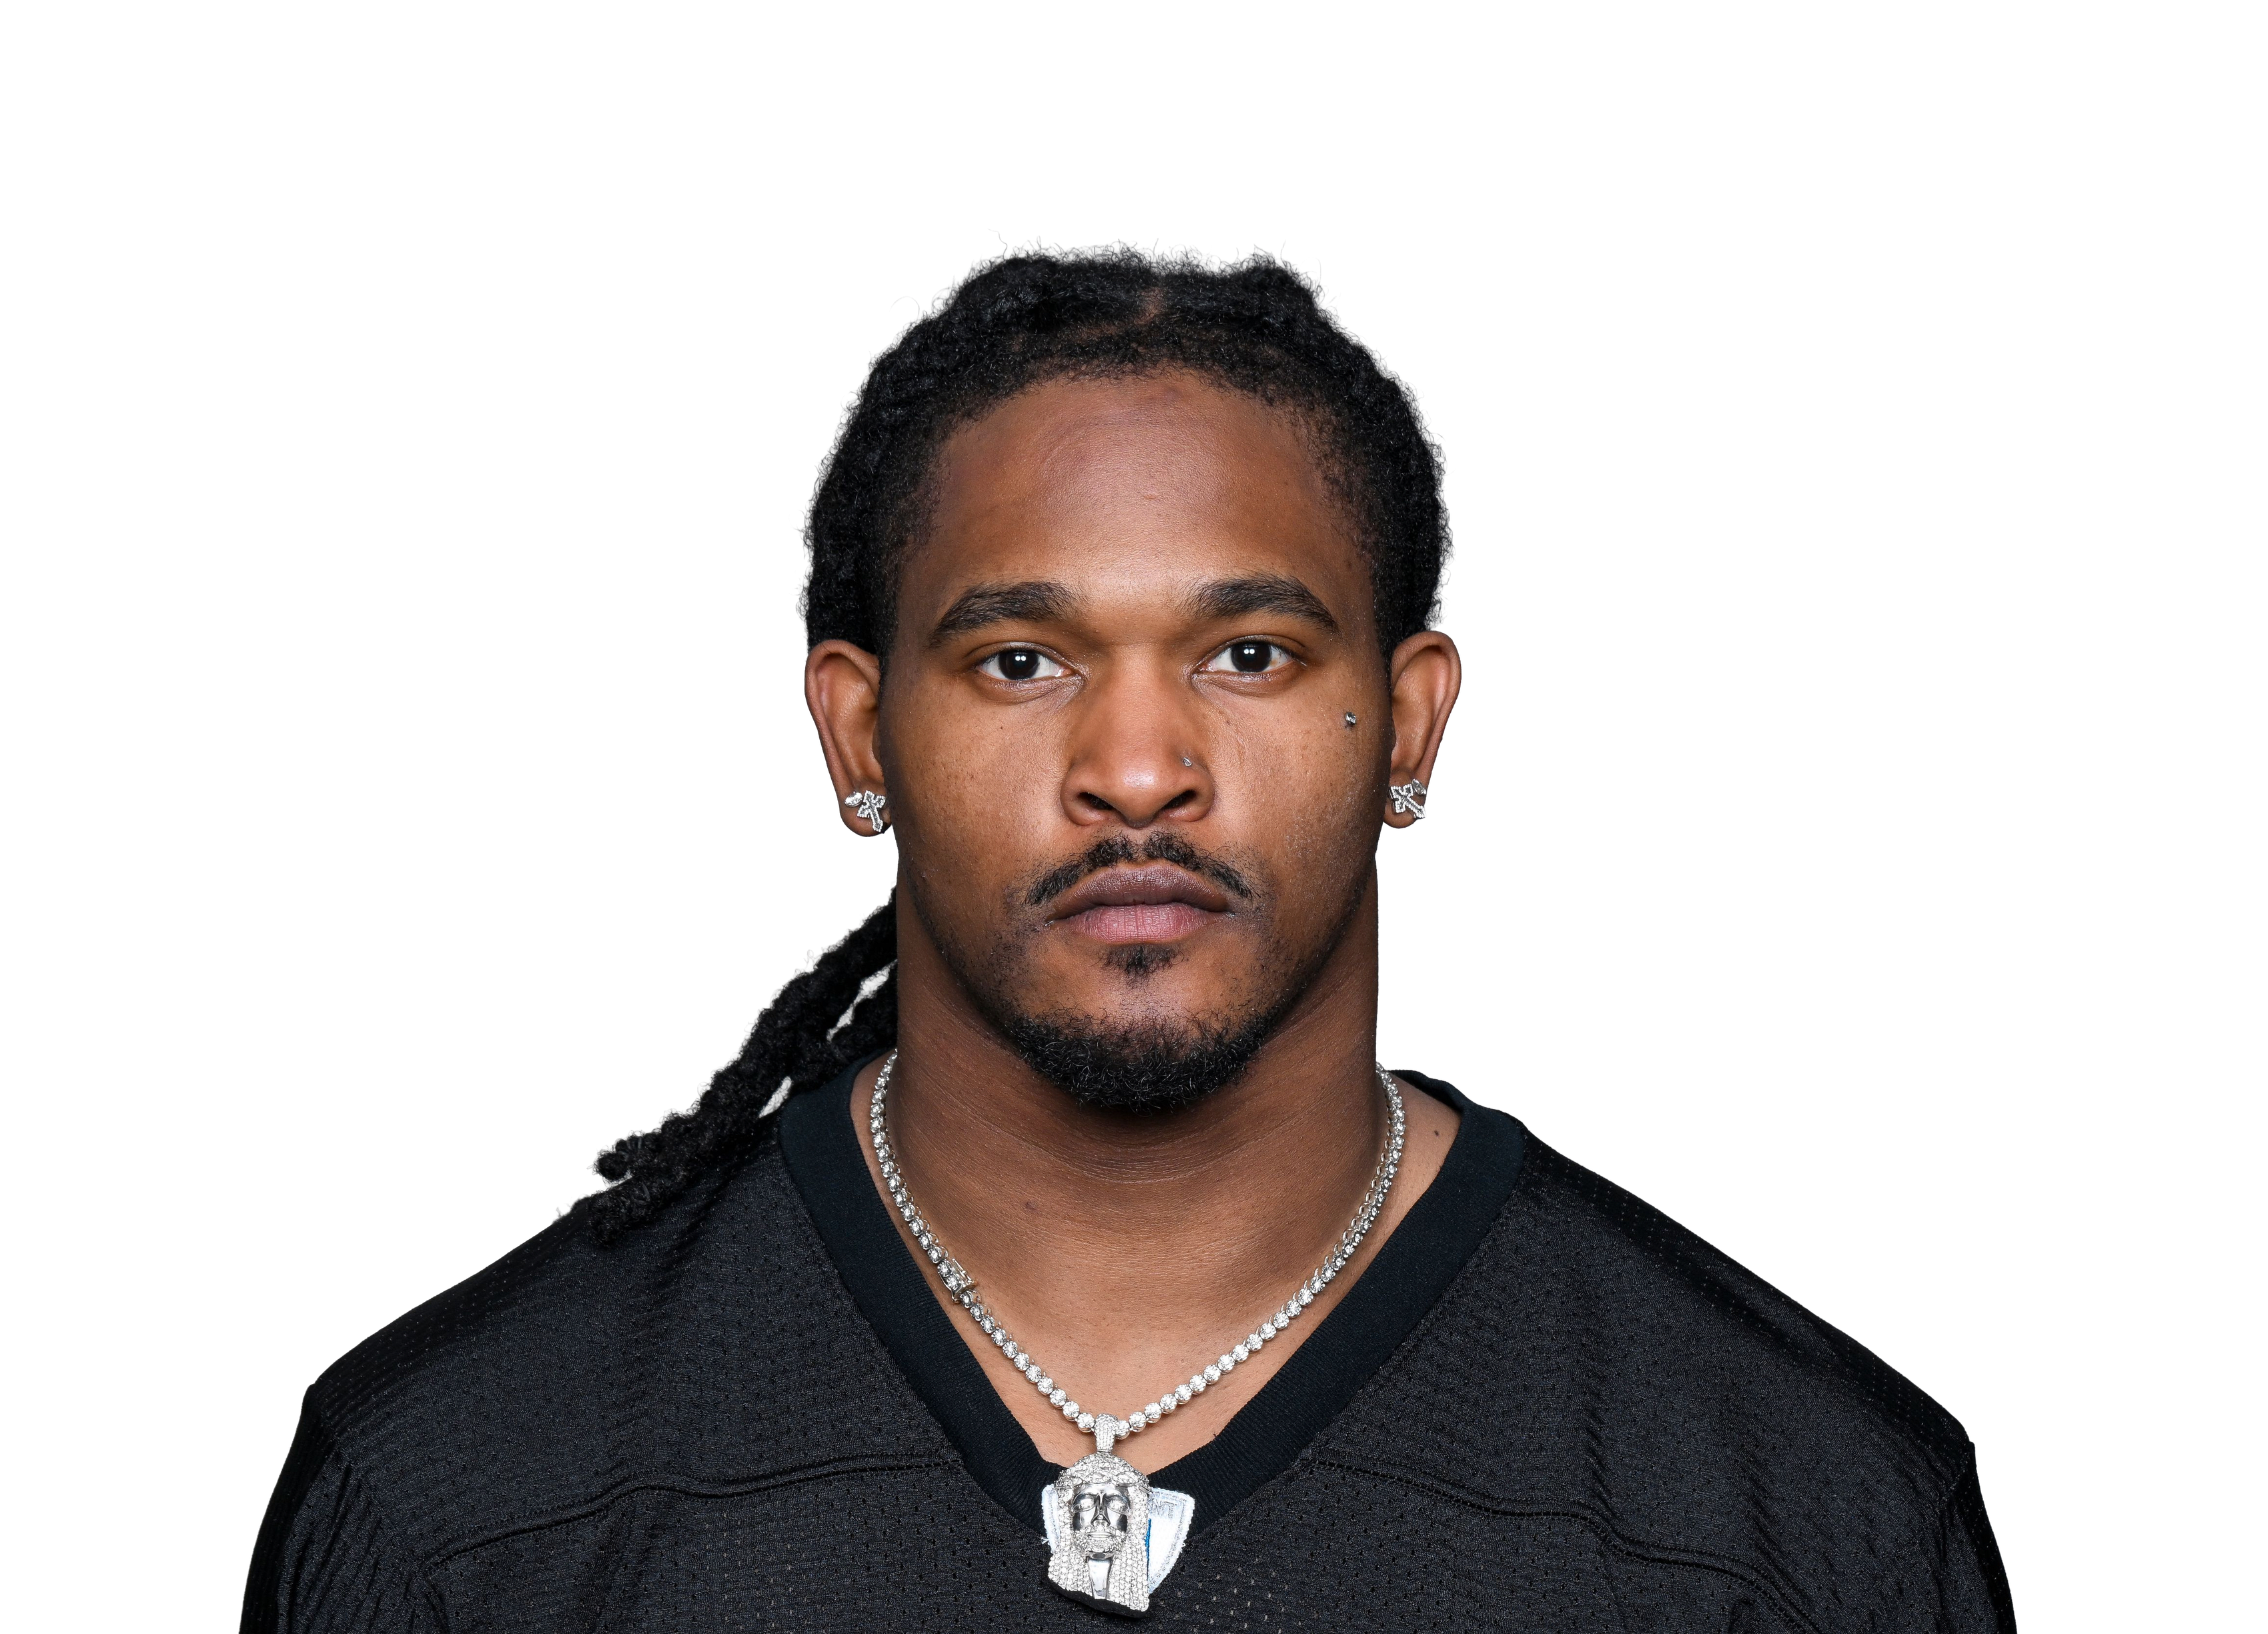 Rico Dowdlevs PIT • Wk 7 | 14.6 | 9 | 41 | 0 | 6 | 45 |
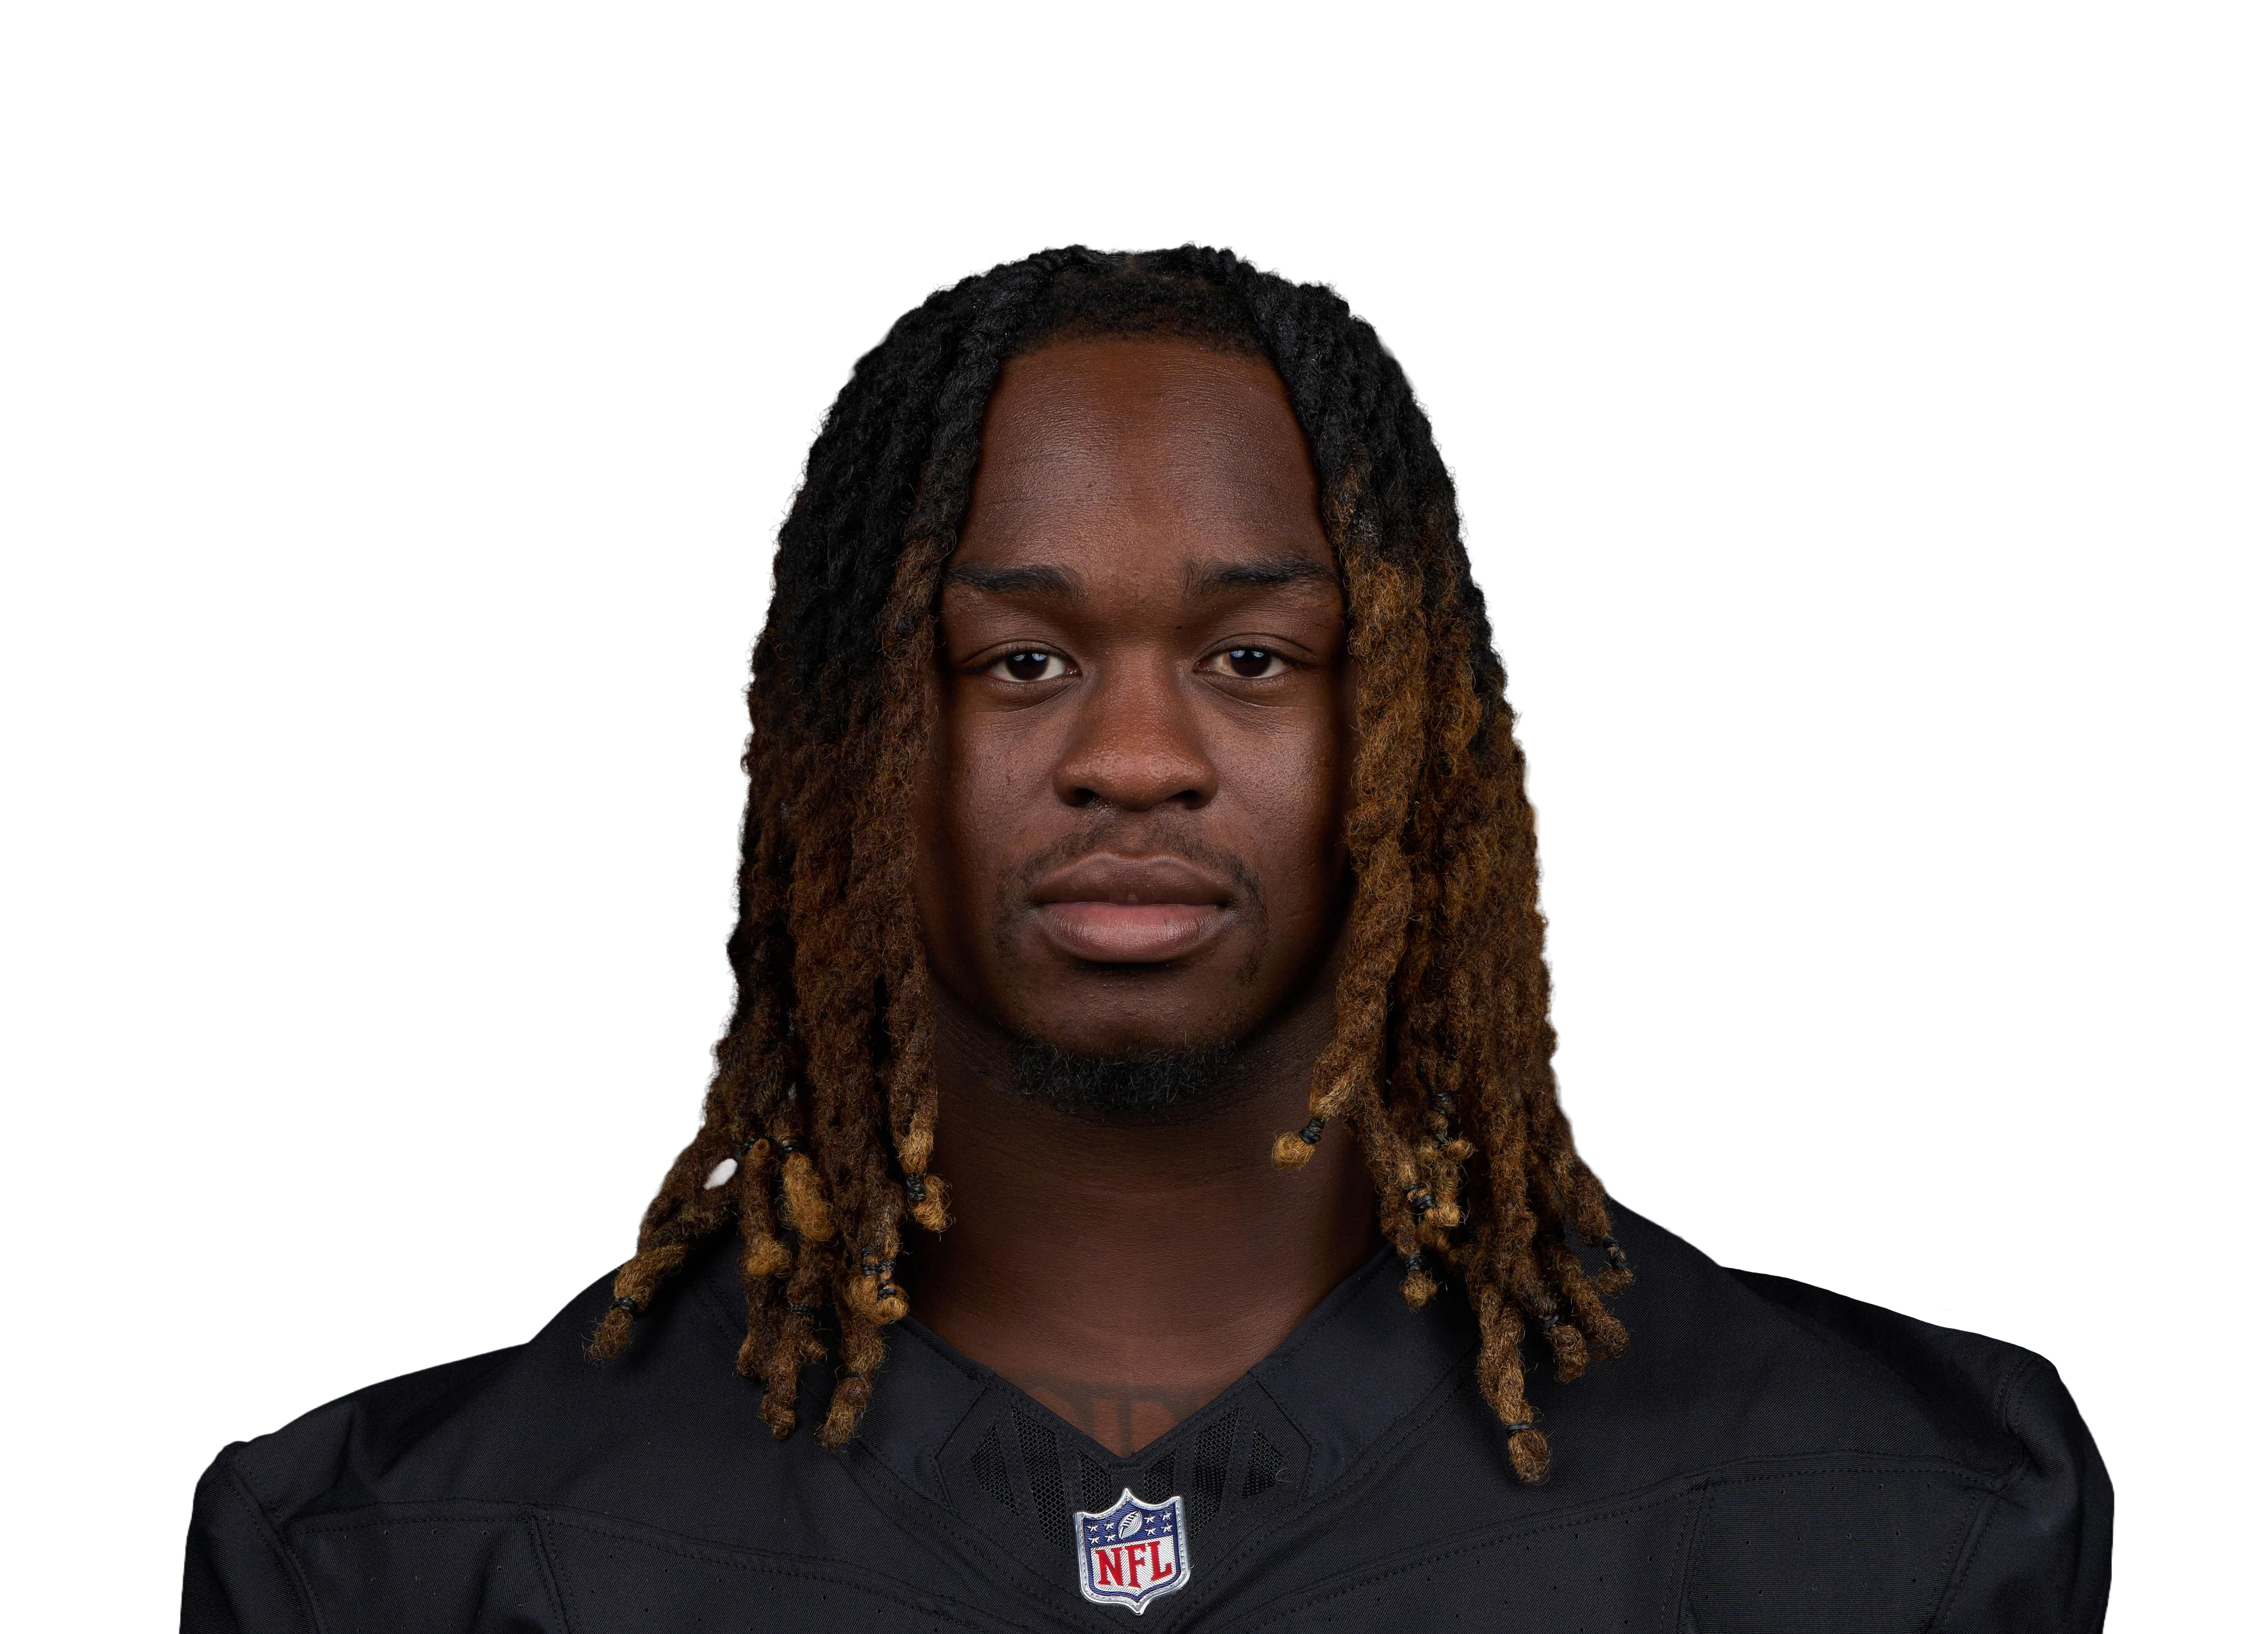 Ashton Jeantyvs LV • Wk 3 | 12.3 | 19 | 56 | 0 | 3 | 37 |
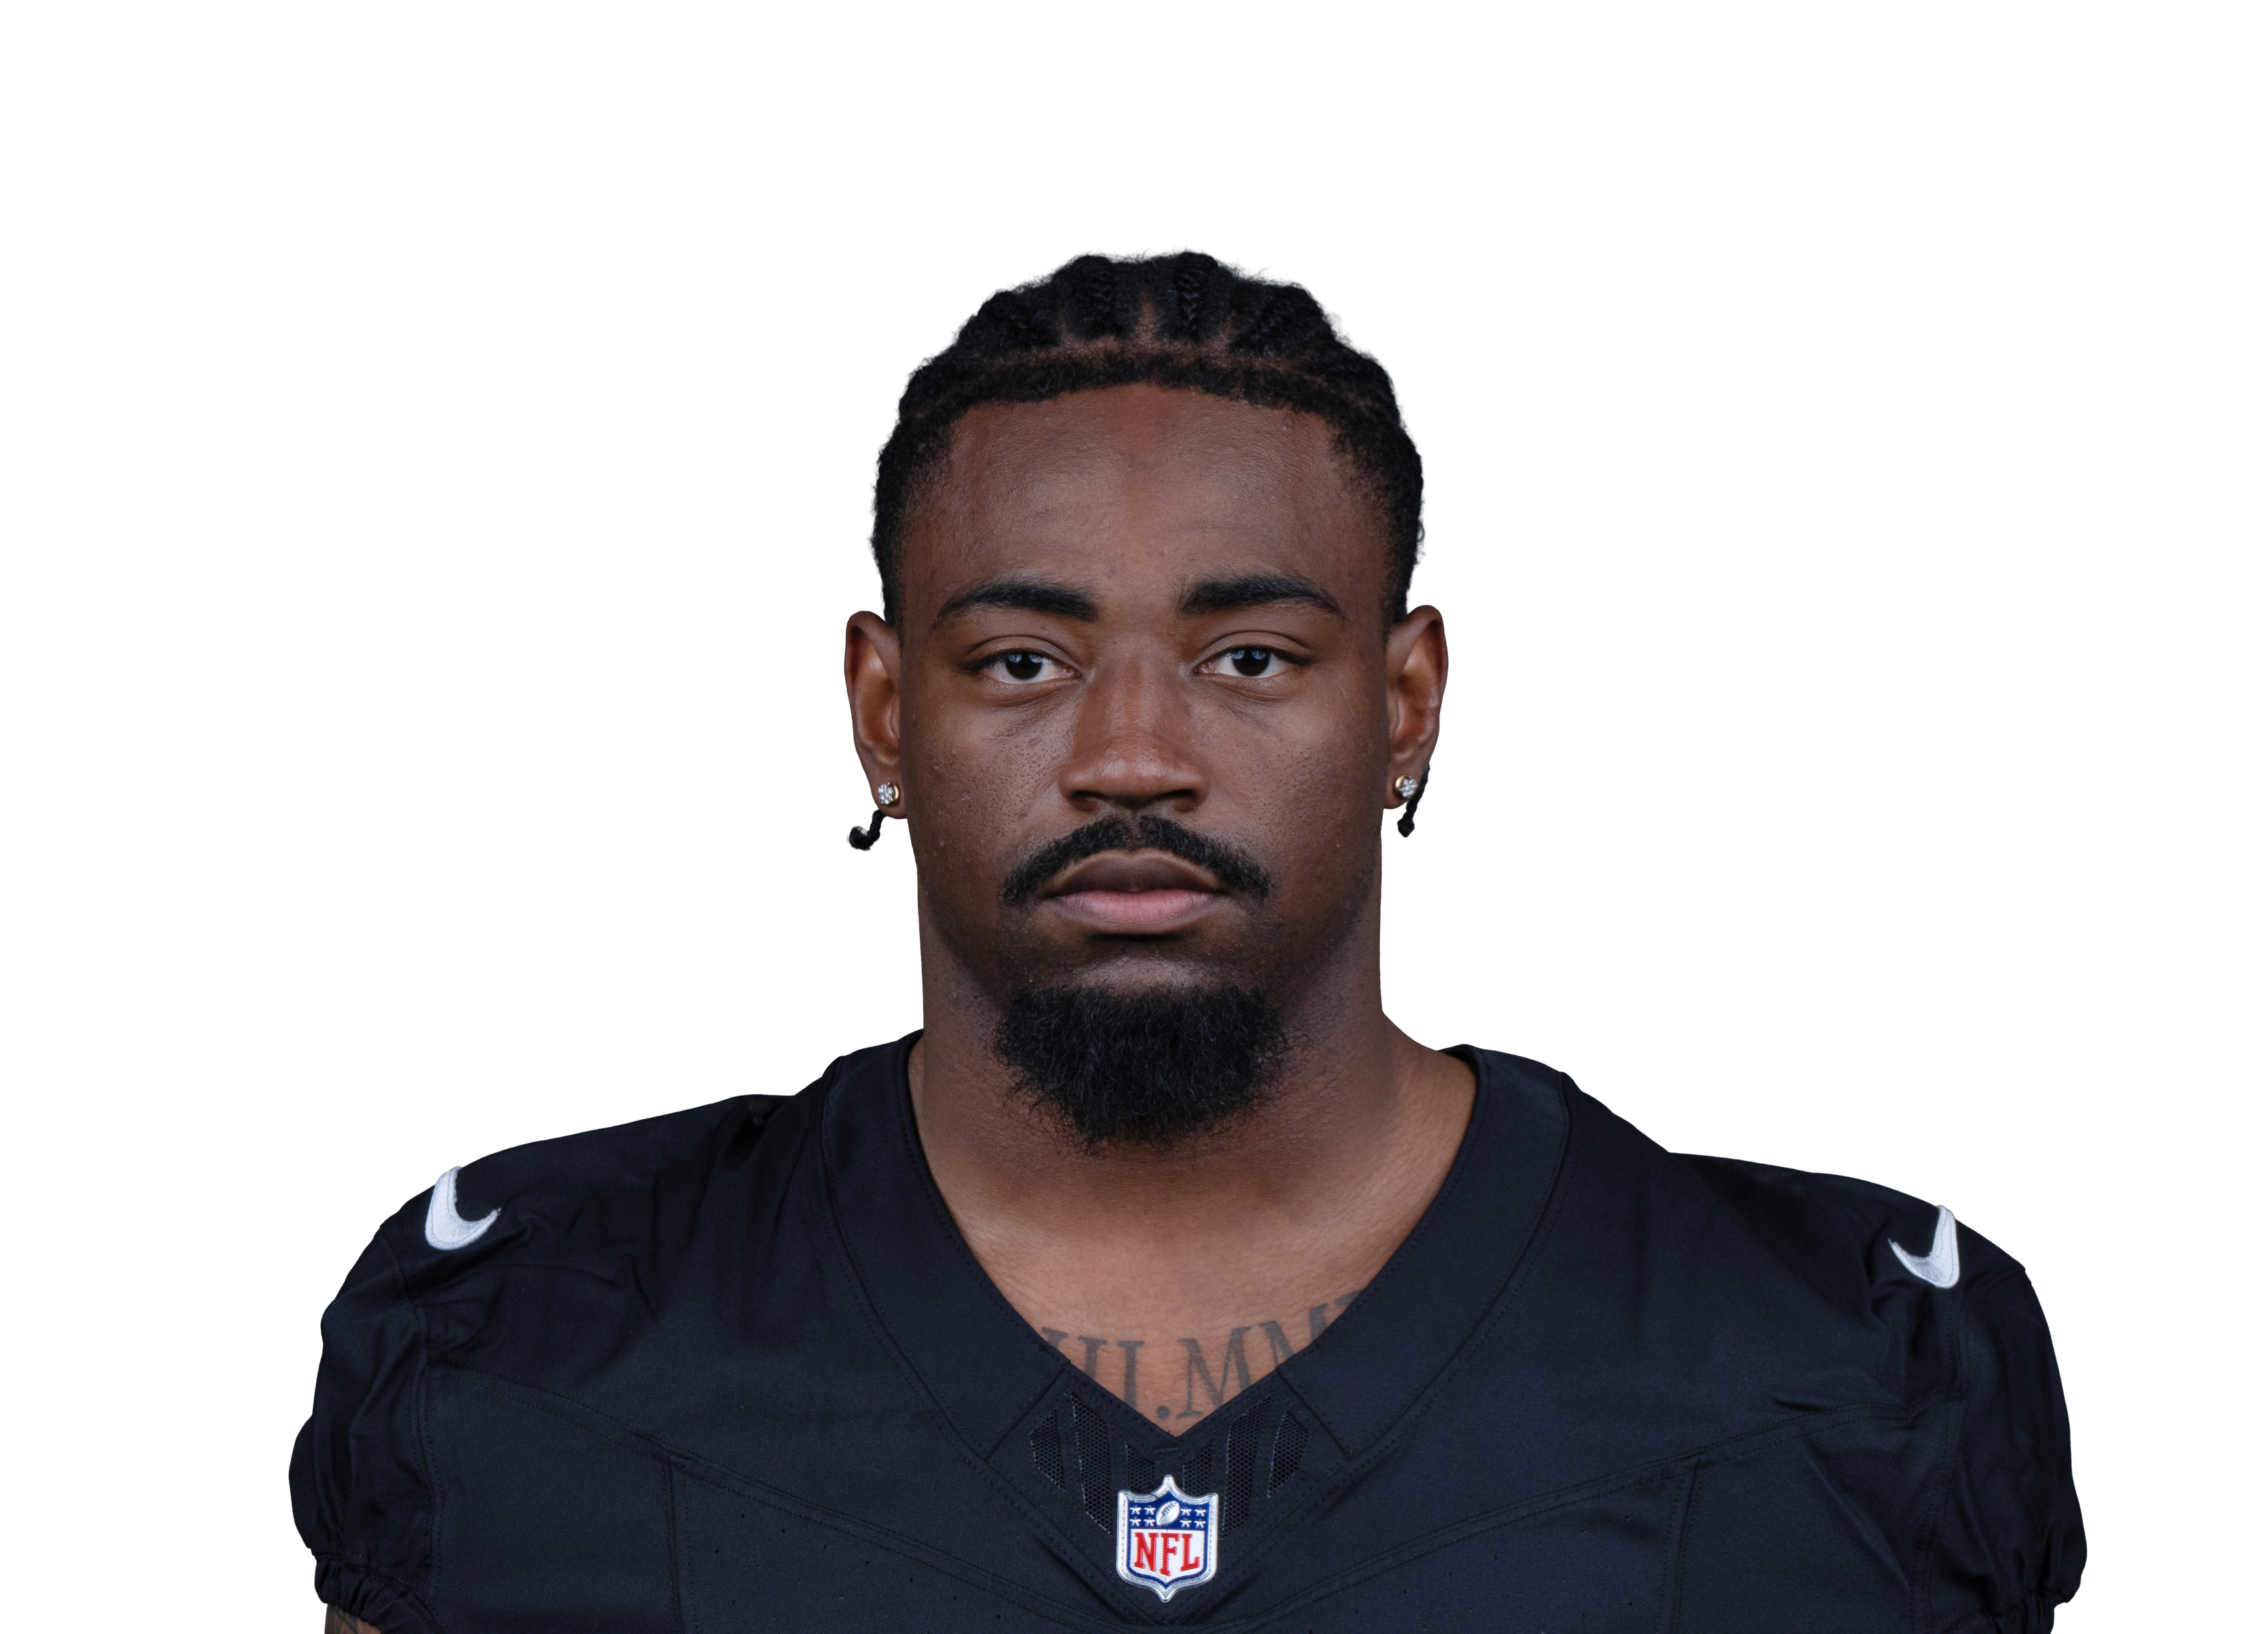 Mike Washington Jr.vs LV • Wk 3 | 11.4 | 5 | 54 | 1 | 0 | 0 |
 Dylan Sampsonvs CLE • Wk 9 | 7.8 | 8 | 21 | 0 | 3 | 27 |
 Quinshon Judkinsvs CLE • Wk 9 | 5.5 | 15 | 43 | 0 | 1 | 2 |
 Devin Singletary@ NYG • Wk 6 | 4.3 | 4 | 14 | 0 | 1 | 19 |
 Justice Hill@ BAL • Wk 2 | 3.8 | 2 | 6 | 0 | 2 | 12 |
 Trevor Etiennevs CAR • Wk 10 | 3.0 | 3 | 1 | 0 | 2 | 9 |
 Sione Vaki@ DET • Wk 1 | 2.8 | 2 | 7 | 0 | 1 | 11 |
 DeeJay Dallasvs MIN • Wk 5 | 2.1 | 0 | 0 | 0 | 1 | 11 |
 Demond Claibornevs MIN • Wk 5 | 1.6 | 0 | 0 | 0 | 1 | 6 |
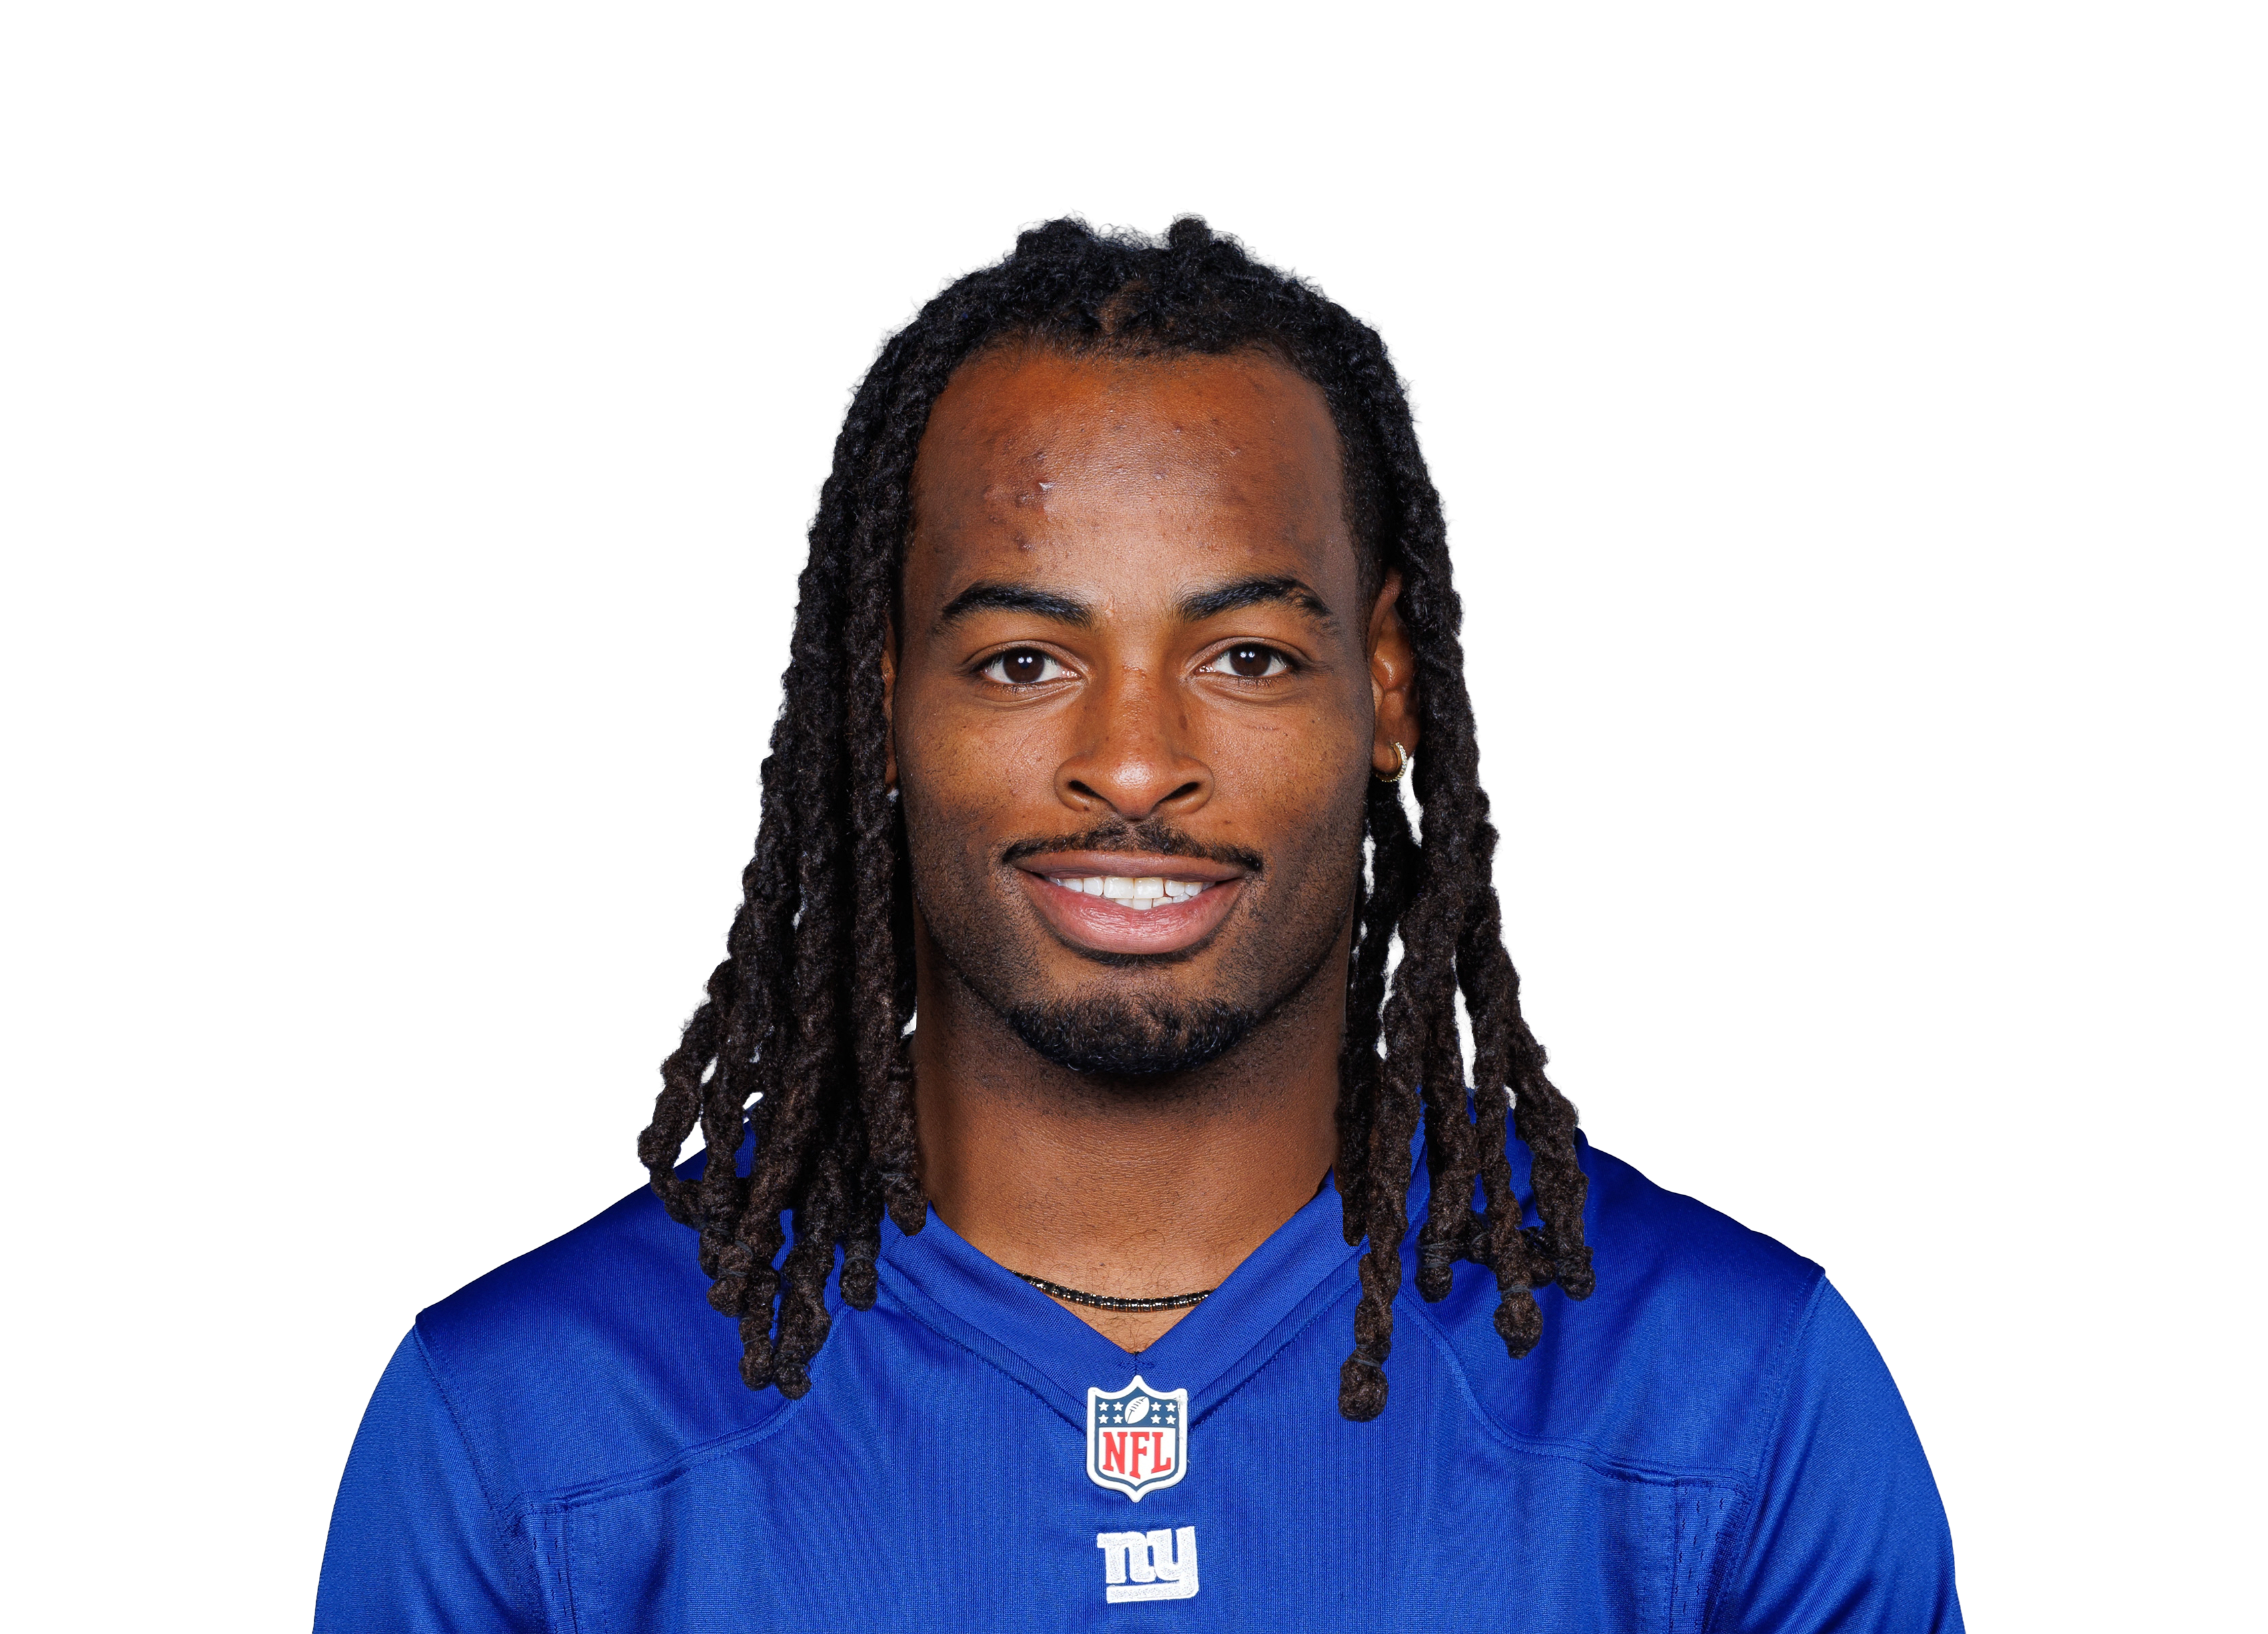 Najee Harris@ NYG • Wk 6 | 0.2 | 4 | 2 | 0 | 0 | 0 |
Fantasy points first, then the stats that matter for his position. Ring around each photo is that player's Mania Rating. Tap a name to open his profile.
Usage
Snaps
0%
Touch share
0%
Carries/G
0.0
PPR/G
0.0
By the numbers
PPR / Game
0
1st percentileRB avg 10.9
Rushing Attempts / Game
0
4th percentileRB avg 11
Rush Yards / Game
0
4th percentileRB avg 45.2
Targets / Game
0
1st percentileRB avg 2.9
Scrimmage Yards / Game
0
1st percentileRB avg 61.1
Share of Team Touches
0%
1st percentileRB avg 23.9%
Red-Zone Carries / Game
0
5th percentileRB avg 2
Goal-Line Carries / Game
0
21st percentileRB avg 0.6
Red-Zone Targets / Game
0
22nd percentileRB avg 0.4
End-Zone Targets / Game
0
81st percentileRB avg 0
Snap Share
0%
0th percentileRB avg 51.4%
TDs / Game
0
19th percentileRB avg 0.5
CHI RB room
D. Swift32%
K. Monangai22%
S. Ahmed9%
R. Johnson9%
Z. Scott0%
Share of touches
CHI RB room, week by week
Touches = carries + targets. Switch to look at just carries or just targets.
| Player | W1 | W2 | W3 | W4 | W5 | W6 | W7 | W8 | W9 | Per game |
|---|---|---|---|---|---|---|---|---|---|---|
| D'Andre Swift | 19134 yds29% touches57% snaps | 2199 yds34% touches68% snaps | 2388 yds33% touches69% snaps | 1774 yds20% touches35% snaps | 1473 yds22% touches58% snaps | 2170 yds32% touches58% snaps | 2690 yds43% touches86% snaps | 3079 yds44% touches77% snaps | 1331 yds23% touches72% snaps | 20.482 yds a game • 4.0 per touch31% touches64% snaps |
| Kyle Monangai | 12124 yds19% touches43% snaps | 1258 yds20% touches34% snaps | 1031 yds15% touches31% snaps | 31150 yds37% touches54% snaps | — | — | — | — | — | 16.391 yds a game • 5.6 per touch22% touches41% snaps |
| Roschon Johnson | 00 yds0% touches0% snaps | — | — | 523 yds6% touches11% snaps | 1240 yds19% touches39% snaps | 1585 yds23% touches40% snaps | 213 yds3% touches14% snaps | 628 yds9% touches20% snaps | 00 yds0% touches0% snaps | 5.727 yds a game • 4.7 per touch8% touches18% snaps |
| Salvon Ahmed | — | — | — | — | — | — | — | — | 525 yds9% touches28% snaps | 5.025 yds a game • 5.0 per touch9% touches28% snaps |
| Zavier Scott | — | — | — | — | 00 yds0% touches0% snaps | 00 yds0% touches0% snaps | 00 yds0% touches0% snaps | 00 yds0% touches0% snaps | — | 0.00 yds a game0% touches0% snaps |
Each cell is the count that week with his yards on those touches plus his share of the team and his snap percentage. Click a name to open that player.
Game log
Games4
PPR/G0.0
Game log
Scott avg 0.0NFL top 30 RBs avg 15.7
Solid dot is what he scored. Hollow dot is our projection before the game.
| Use | Game | Proj | PPR | Tgt | Rec | Rec Yd | Car | Rush Yd | TD | Snap |
|---|---|---|---|---|---|---|---|---|---|---|
W5 vs GB | 3.9 | 0 | 0 | 0 | 0 | 0 | 0 | 0 | 0% | |
W6 vs ATL | 2.0 | 0 | 0 | 0 | 0 | 0 | 0 | 0 | 0% | |
W7 vs NE | 1.8 | 0 | 0 | 0 | 0 | 0 | 0 | 0 | 0% | |
W8 vs SEA | 1.0 | 0 | 0 | 0 | 0 | 0 | 0 | 0 | 0% |
Opponent color:Easy defense for RBsAverageTough
Schedule ahead
11 NO12 DET13 JAX14 MIA15 BUF16 GB17 DET18 MIN
Green easier, red tougher
Schedule ahead
Colored by what each defense has given up to RBs so far. Green is an easier matchup, red is a tougher one.
Wk 11 NOWk 12 DETWk 13 JAXWk 14 MIAWk 15 BUFWk 16 GBWk 17 DETWk 18 MINSee every team's RB schedule ›
StatPer gameSeasonRank
Overall
Games—418›
PPR points—0—
Tap any stat to see everyone ranked. Bars: green top 30%, yellow middle, red bottom 40%.
49.0
Mania Rating
Overall profile • Depth
OUT
Week 11 Rating
Start value vs NO
Zavier Scott
CHI • RB • 4 games#418 OverallRB141#5 RB on CHIAge 27Out
OUT
Games counted
Untick or tick any game and Mania Rating, matchup and Week 11 Rating all recalculate. Official Mania Rating 49.
Injured reserve (Not Specified) • no Week 11 Rating • Est. return Dec 13 (Week 14, ESPN)
Week 11 Rating = recent role + opponent + the latest injury report (updated Sat Nov 21, 6:30 AM ET). Check final inactives before you set your lineup.
CHI RB room
D. Swift32%
K. Monangai22%
S. Ahmed9%
R. Johnson9%
Z. Scott0%
Share of touches
CHI RB room, week by week
Touches = carries + targets. Switch to look at just carries or just targets.
| Player | W1 | W2 | W3 | W4 | W5 | W6 | W7 | W8 | W9 | Per game |
|---|---|---|---|---|---|---|---|---|---|---|
| D'Andre Swift | 19134 yds29% touches57% snaps | 2199 yds34% touches68% snaps | 2388 yds33% touches69% snaps | 1774 yds20% touches35% snaps | 1473 yds22% touches58% snaps | 2170 yds32% touches58% snaps | 2690 yds43% touches86% snaps | 3079 yds44% touches77% snaps | 1331 yds23% touches72% snaps | 20.482 yds a game • 4.0 per touch31% touches64% snaps |
| Kyle Monangai | 12124 yds19% touches43% snaps | 1258 yds20% touches34% snaps | 1031 yds15% touches31% snaps | 31150 yds37% touches54% snaps | — | — | — | — | — | 16.391 yds a game • 5.6 per touch22% touches41% snaps |
| Roschon Johnson | 00 yds0% touches0% snaps | — | — | 523 yds6% touches11% snaps | 1240 yds19% touches39% snaps | 1585 yds23% touches40% snaps | 213 yds3% touches14% snaps | 628 yds9% touches20% snaps | 00 yds0% touches0% snaps | 5.727 yds a game • 4.7 per touch8% touches18% snaps |
| Salvon Ahmed | — | — | — | — | — | — | — | — | 525 yds9% touches28% snaps | 5.025 yds a game • 5.0 per touch9% touches28% snaps |
| Zavier Scott | — | — | — | — | 00 yds0% touches0% snaps | 00 yds0% touches0% snaps | 00 yds0% touches0% snaps | 00 yds0% touches0% snaps | — | 0.00 yds a game0% touches0% snaps |
Each cell is the count that week with his yards on those touches plus his share of the team and his snap percentage. Click a name to open that player.
Game log
Games4
PPR/G0.0
Game log
Scott avg 0.0NFL top 30 RBs avg 15.7
Solid dot is what he scored. Hollow dot is our projection before the game.
| Use | Game | Proj | PPR | Tgt | Rec | Rec Yd | Car | Rush Yd | TD | Snap |
|---|---|---|---|---|---|---|---|---|---|---|
| W5vs GB | 3.9 | 0 | 0 | 0 | 0 | 0 | 0 | 0 | 0% | |
| W6vs ATL | 2.0 | 0 | 0 | 0 | 0 | 0 | 0 | 0 | 0% | |
| W7vs NE | 1.8 | 0 | 0 | 0 | 0 | 0 | 0 | 0 | 0% | |
| W8vs SEA | 1.0 | 0 | 0 | 0 | 0 | 0 | 0 | 0 | 0% |
Opponent color:Easy defense for RBsAverageTough
Schedule ahead
11 NO12 DET13 JAX14 MIA15 BUF16 GB17 DET18 MIN
Green easier, red tougher
Schedule ahead
Colored by what each defense has given up to RBs so far. Green is an easier matchup, red is a tougher one.
Wk 11 NOWk 12 DETWk 13 JAXWk 14 MIAWk 15 BUFWk 16 GBWk 17 DETWk 18 MINSee every team's RB schedule ›
StatPer gameSeasonRank
Overall
Games—418›
PPR points—0—
Tap any stat to see everyone ranked. Bars: green top 30%, yellow middle, red bottom 40%.
Mania breakdown
Fantasy Production1
Touch Volume0
Backfield Control0
Goal-Line / Red-Zone5
Per-Touch Efficiency0
Mania breakdown
Percentile among RBs. 100 is the best, 50 is average.
How many fantasy points and total yards he is actually producing, compared with players at his position. Ranks better than 1% of RBs.
How many carries and targets he gets per game compared with other running backs. Ranks better than 0% of RBs.
How much of his team backfield he owns: share of touches plus snap share. Ranks better than 0% of RBs.
Scoring-position work: red-zone carries, goal-line carries (inside the 5) and red-zone targets. Ranks better than 5% of RBs.
What he produces with each touch instead of just rewarding volume: fantasy points per touch, yards per carry and catch rate. Ranks better than 0% of RBs.
Top 30%MiddleBottom 40%Tap a category to see what it means.
Week 11 matchup
vs NO
Good matchup
Adjustment+6.0 pts
Allows to RBs1st most
Week11
Week 11 matchup
vs NO
+6Rating boost
Good matchup2nd easiest of 32 defenses for RBs
ToughEasy
29.1PPR a game NO allows to RBs
5.3Similar players, usual PPR a game
14.6Same players against NO
Players with a role like his scored 14.6 PPR a game against NO, versus 5.3 in their usual games (+177%). That moves his Week 11 Rating by +6.
How running backs did against NO
29.1 PPR points a game allowed to running backs, 2nd most of 32 defenses.
| Player | PPR | Rush | Rush Yd | Rush TD | Rec | Rec Yd |
|---|---|---|---|---|---|---|
| Chuba Hubbardvs CAR • Wk 10 | 34.2 | 27 | 92 | 2 | 5 | 80 |
| Jahmyr Gibbs@ DET • Wk 1 | 33.6 | 29 | 156 | 2 | 5 | 30 |
| Bijan Robinsonvs ATL • Wk 4 | 27.7 | 19 | 145 | 2 | 1 | 2 |
| Brian Robinsonvs ATL • Wk 4 | 25.7 | 14 | 62 | 3 | 1 | 5 |
| Aaron Jonesvs MIN • Wk 5 | 18.7 | 25 | 113 | 1 | 3 | 4 |
| Tyrone Tracy Jr.@ NYG • Wk 6 | 18.5 | 6 | 18 | 1 | 2 | 27 |
| Derrick Henry@ BAL • Wk 2 | 17.7 | 16 | 68 | 1 | 3 | 19 |
| Jaylen Warrenvs PIT • Wk 7 | 16.7 | 18 | 101 | 0 | 3 | 36 |
| Rico Dowdlevs PIT • Wk 7 | 14.6 | 9 | 41 | 0 | 6 | 45 |
| Ashton Jeantyvs LV • Wk 3 | 12.3 | 19 | 56 | 0 | 3 | 37 |
| Mike Washington Jr.vs LV • Wk 3 | 11.4 | 5 | 54 | 1 | 0 | 0 |
| Dylan Sampsonvs CLE • Wk 9 | 7.8 | 8 | 21 | 0 | 3 | 27 |
| Quinshon Judkinsvs CLE • Wk 9 | 5.5 | 15 | 43 | 0 | 1 | 2 |
| Devin Singletary@ NYG • Wk 6 | 4.3 | 4 | 14 | 0 | 1 | 19 |
| Justice Hill@ BAL • Wk 2 | 3.8 | 2 | 6 | 0 | 2 | 12 |
| Trevor Etiennevs CAR • Wk 10 | 3.0 | 3 | 1 | 0 | 2 | 9 |
| Sione Vaki@ DET • Wk 1 | 2.8 | 2 | 7 | 0 | 1 | 11 |
| DeeJay Dallasvs MIN • Wk 5 | 2.1 | 0 | 0 | 0 | 1 | 11 |
| Demond Claibornevs MIN • Wk 5 | 1.6 | 0 | 0 | 0 | 1 | 6 |
| Najee Harris@ NYG • Wk 6 | 0.2 | 4 | 2 | 0 | 0 | 0 |
Fantasy points first, then the stats that matter for his position. Ring around each photo is that player's Mania Rating. Tap a name to open his profile.
Usage
Snaps
0%
Touch share
0%
Carries/G
0.0
PPR/G
0.0
By the numbers
PPR / Game
0
1st percentileRB avg 10.9
Rushing Attempts / Game
0
4th percentileRB avg 11
Rush Yards / Game
0
4th percentileRB avg 45.2
Targets / Game
0
1st percentileRB avg 2.9
Scrimmage Yards / Game
0
1st percentileRB avg 61.1
Share of Team Touches
0%
1st percentileRB avg 23.9%
Red-Zone Carries / Game
0
5th percentileRB avg 2
Goal-Line Carries / Game
0
21st percentileRB avg 0.6
Red-Zone Targets / Game
0
22nd percentileRB avg 0.4
End-Zone Targets / Game
0
81st percentileRB avg 0
Snap Share
0%
0th percentileRB avg 51.4%
TDs / Game
0
19th percentileRB avg 0.5