
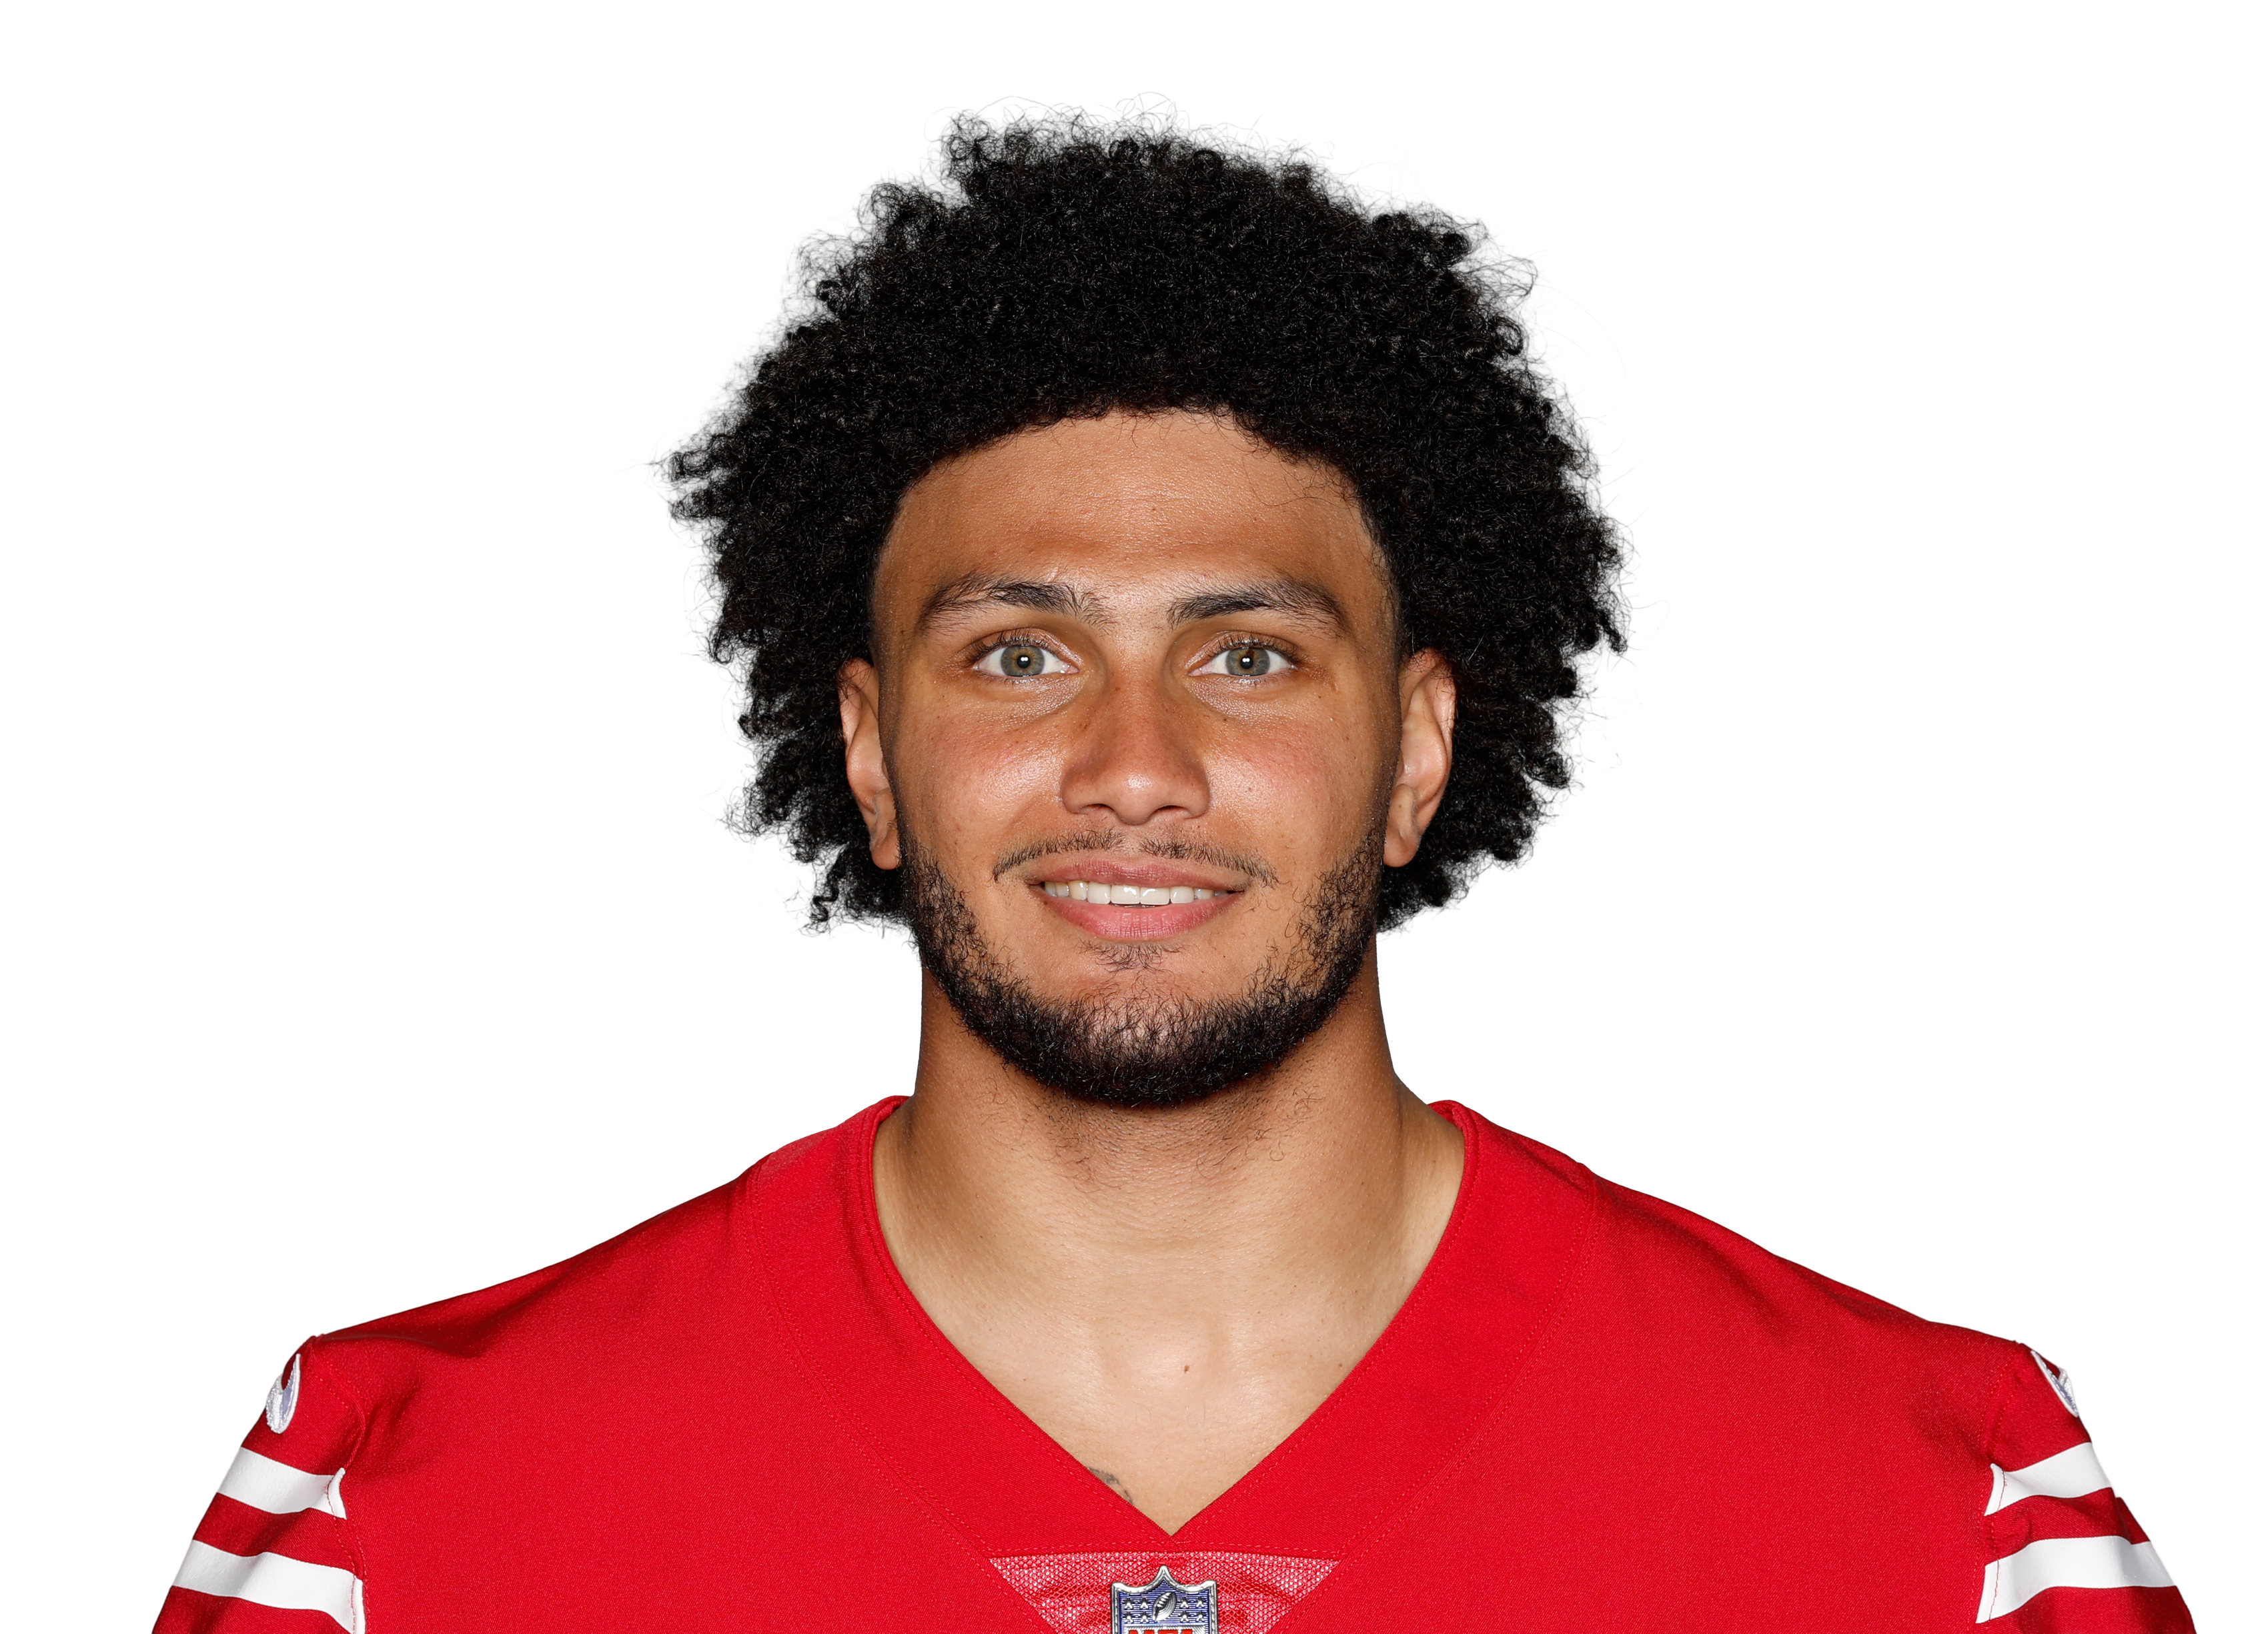
Jordan Watkins
 SF • WR • 5 games
Pick a teammate with or without. Pick more than one to combine them, like a game without the QB and without the other back.
Teammate injuries shift his Week 11 Rating1 teammate note ▾
SF MIN
How this is built
26.4 PPR points a game allowed to wide receivers, 28th most of 32 defenses.
| Player | PPR | Tgt | Rec | Rec Yd | Rec TD | Rush Yd |
|---|---|---|---|---|---|---|
 Christian Watsonvs GB • Wk 1 | 32.7 | 8 | 6 | 147 | 2 | 0 |
 Jameson Williams@ DET • Wk 8 | 17.0 | 6 | 4 | 70 | 1 | 0 |
 Matthew Goldenvs GB • Wk 1 | 15.5 | 12 | 6 | 95 | 0 | 0 |
 Amon-Ra St. Brown@ DET • Wk 8 | 12.6 | 8 | 7 | 46 | 0 | 10 |
 Malik Washingtonvs MIA • Wk 4 | 12.0 | 5 | 5 | 67 | 0 | 3 |
| Matthew Golden@ GB • Wk 10 | 12.0 | 9 | 5 | 70 | 0 | 0 |
 J. Michael Sturdivant@ GB • Wk 10 | 11.7 | 4 | 2 | 37 | 1 | 0 |
 Emeka Egbuka@ TB • Wk 3 | 11.2 | 9 | 5 | 62 | 0 | 0 |
 Ted Hurst III@ TB • Wk 3 | 11.0 | 3 | 1 | 40 | 1 | 0 |
 Khalil Shakirvs BUF • Wk 9 | 9.8 | 4 | 4 | 58 | 0 | 0 |
 Kalif Raymond@ CHI • Wk 2 | 9.0 | 5 | 5 | 40 | 0 | 0 |
 Chris Olave@ NO • Wk 5 | 8.6 | 6 | 4 | 46 | 0 | 0 |
 Rome Odunze@ CHI • Wk 2 | 7.3 | 4 | 3 | 43 | 0 | 0 |
| Christian Watson@ GB • Wk 10 | 6.7 | 5 | 3 | 37 | 0 | 0 |
 Devaughn Vele@ NO • Wk 5 | 6.6 | 6 | 4 | 26 | 0 | 0 |
 DJ Moorevs BUF • Wk 9 | 6.6 | 5 | 3 | 25 | 0 | 11 |
 Luther Burden III@ CHI • Wk 2 | 6.2 | 7 | 3 | 32 | 0 | 0 |
 Keenan Allenvs IND • Wk 7 | 6.1 | 3 | 3 | 31 | 0 | 0 |
 Chris Godwin Jr.@ TB • Wk 3 | 5.5 | 4 | 3 | 25 | 0 | 0 |
 Jayden Reedvs GB • Wk 1 | 5.0 | 7 | 3 | 20 | 0 | 0 |
 Keon Colemanvs BUF • Wk 9 | 4.7 | 6 | 3 | 17 | 0 | 0 |
 Savion Williams@ GB • Wk 10 | 4.7 | 2 | 2 | 27 | 0 | 0 |
 Laquon Treadwellvs IND • Wk 7 | 3.9 | 2 | 2 | 19 | 0 | 0 |
 Josh Downsvs IND • Wk 7 | 3.8 | 4 | 2 | 18 | 0 | 0 |
 Deion Burksvs IND • Wk 7 | 2.1 | 1 | 1 | 11 | 0 | 0 |
 Bo Meltonvs GB • Wk 1 | 2.0 | 1 | 1 | 10 | 0 | 0 |
 Tez Johnson@ TB • Wk 3 | 1.8 | 2 | 1 | 8 | 0 | 0 |
 Kevin Coleman Jr.vs MIA • Wk 4 | 1.3 | 4 | 1 | 3 | 0 | 0 |
 Skyy Moorevs GB • Wk 1 | 0.0 | 1 | 0 | 0 | 0 | 0 |
 Jalen McMillan@ TB • Wk 3 | 0.0 | 1 | 0 | 0 | 0 | 0 |
 Jalen Tolbertvs MIA • Wk 4 | 0.0 | 1 | 0 | 0 | 0 | 0 |
 Chris Bellvs MIA • Wk 4 | 0.0 | 3 | 0 | 0 | 0 | 0 |
 Bryce Lance@ NO • Wk 5 | 0.0 | 3 | 0 | 0 | 0 | 0 |
Fantasy points first, then the stats that matter for his position. Ring around each photo is that player's Mania Rating. Tap a name to open his profile.
| Player | W1 | W2 | W3 | W4 | W5 | W6 | W7 | W9 | W10 | Per game |
|---|---|---|---|---|---|---|---|---|---|---|
| Mike Evans | 749 yds21% targets75% snaps | 354 yds14% targets54% snaps | 634 yds23% targets33% snaps | 876 yds28% targets59% snaps | 10113 yds37% targets63% snaps | 594 yds17% targets40% snaps | — | — | — | 6.570 yds a game • 10.8 per target23% targets54% snaps |
| Keenan Allen | — | — | — | — | — | — | — | — | 761 yds25% targets48% snaps | 7.061 yds a game • 8.7 per target25% targets48% snaps |
| Deebo Samuel Sr. | 748 yds21% targets42% snaps | 431 yds19% targets60% snaps | 080 yds0% targets76% snaps | 626 yds21% targets67% snaps | 321 yds11% targets43% snaps | — | — | — | 331 yds11% targets68% snaps | 3.840 yds a game • 10.3 per target14% targets59% snaps |
| Demarcus Robinson | 350 yds9% targets63% snaps | 334 yds14% targets31% snaps | — | — | — | — | — | 422 yds17% targets51% snaps | — | 3.335 yds a game • 10.6 per target14% targets48% snaps |
| Jordan Watkins | — | — | 260 yds8% targets28% snaps | — | — | 122 yds3% targets76% snaps | 656 yds15% targets76% snaps | 486 yds17% targets77% snaps | 349 yds11% targets68% snaps | 3.255 yds a game • 17.1 per target11% targets65% snaps |
| Brandin Cooks | — | — | — | 10 yds3% targets12% snaps | 27 yds7% targets40% snaps | 213 yds7% targets52% snaps | 313 yds8% targets68% snaps | 225 yds9% targets44% snaps | — | 2.012 yds a game • 5.8 per target7% targets43% snaps |
| KhaDarel Hodge | 00 yds0% targets2% snaps | 118 yds5% targets38% snaps | 00 yds0% targets56% snaps | — | — | — | — | 117 yds4% targets16% snaps | — | 0.59 yds a game • 17.5 per target2% targets28% snaps |
| Jacob Cowing | 00 yds0% targets8% snaps | 00 yds0% targets46% snaps | 20 yds8% targets31% snaps | 10 yds3% targets32% snaps | 29 yds7% targets43% snaps | 00 yds0% targets24% snaps | 538 yds13% targets39% snaps | 15 yds4% targets25% snaps | 00 yds0% targets18% snaps | 1.26 yds a game • 4.7 per target4% targets30% snaps |
| Use | Game | Proj | PPR | Tgt | Rec | Rec Yd | Car | Rush Yd | TD | Snap |
|---|---|---|---|---|---|---|---|---|---|---|
W3 vs ARI | 2.8 | 8 | 2 | 2 | 60 | 0 | 0 | 0 | 28% | |
W6 vs WAS | 4.3 | 3.2 | 1 | 1 | 22 | 0 | 0 | 0 | 76% | |
W7 vs ATL | 5.6 | 8.6 | 6 | 3 | 56 | 0 | 0 | 0 | 76% | |
W9 vs LV | 7.5 | 18.6 | 4 | 4 | 86 | 0 | 0 | 1 | 77% | |
W10 vs DAL | 7.8 | 6.9 | 3 | 2 | 49 | 0 | 0 | 0 | 68% |
Too few plays to rank yet (needs 35 targets, he has 16). Here are his raw numbers so far.
Jordan Watkins
SF • WR • 5 gamesPick a teammate with or without. Pick more than one to combine them, like a game without the QB and without the other back.
Teammate injuries shift his Week 11 Rating1 teammate note ▾
SFMINHow this is built
| Player | W1 | W2 | W3 | W4 | W5 | W6 | W7 | W9 | W10 | Per game |
|---|---|---|---|---|---|---|---|---|---|---|
| Mike Evans | 749 yds21% targets75% snaps | 354 yds14% targets54% snaps | 634 yds23% targets33% snaps | 876 yds28% targets59% snaps | 10113 yds37% targets63% snaps | 594 yds17% targets40% snaps | — | — | — | 6.570 yds a game • 10.8 per target23% targets54% snaps |
| Keenan Allen | — | — | — | — | — | — | — | — | 761 yds25% targets48% snaps | 7.061 yds a game • 8.7 per target25% targets48% snaps |
| Deebo Samuel Sr. | 748 yds21% targets42% snaps | 431 yds19% targets60% snaps | 080 yds0% targets76% snaps | 626 yds21% targets67% snaps | 321 yds11% targets43% snaps | — | — | — | 331 yds11% targets68% snaps | 3.840 yds a game • 10.3 per target14% targets59% snaps |
| Demarcus Robinson | 350 yds9% targets63% snaps | 334 yds14% targets31% snaps | — | — | — | — | — | 422 yds17% targets51% snaps | — | 3.335 yds a game • 10.6 per target14% targets48% snaps |
| Jordan Watkins | — | — | 260 yds8% targets28% snaps | — | — | 122 yds3% targets76% snaps | 656 yds15% targets76% snaps | 486 yds17% targets77% snaps | 349 yds11% targets68% snaps | 3.255 yds a game • 17.1 per target11% targets65% snaps |
| Brandin Cooks | — | — | — | 10 yds3% targets12% snaps | 27 yds7% targets40% snaps | 213 yds7% targets52% snaps | 313 yds8% targets68% snaps | 225 yds9% targets44% snaps | — | 2.012 yds a game • 5.8 per target7% targets43% snaps |
| KhaDarel Hodge | 00 yds0% targets2% snaps | 118 yds5% targets38% snaps | 00 yds0% targets56% snaps | — | — | — | — | 117 yds4% targets16% snaps | — | 0.59 yds a game • 17.5 per target2% targets28% snaps |
| Jacob Cowing | 00 yds0% targets8% snaps | 00 yds0% targets46% snaps | 20 yds8% targets31% snaps | 10 yds3% targets32% snaps | 29 yds7% targets43% snaps | 00 yds0% targets24% snaps | 538 yds13% targets39% snaps | 15 yds4% targets25% snaps | 00 yds0% targets18% snaps | 1.26 yds a game • 4.7 per target4% targets30% snaps |
| Use | Game | Proj | PPR | Tgt | Rec | Rec Yd | Car | Rush Yd | TD | Snap |
|---|---|---|---|---|---|---|---|---|---|---|
| W3vs ARI | 2.8 | 8 | 2 | 2 | 60 | 0 | 0 | 0 | 28% | |
| W6vs WAS | 4.3 | 3.2 | 1 | 1 | 22 | 0 | 0 | 0 | 76% | |
| W7vs ATL | 5.6 | 8.6 | 6 | 3 | 56 | 0 | 0 | 0 | 76% | |
| W9vs LV | 7.5 | 18.6 | 4 | 4 | 86 | 0 | 0 | 1 | 77% | |
| W10vs DAL | 7.8 | 6.9 | 3 | 2 | 49 | 0 | 0 | 0 | 68% |
Too few plays to rank yet (needs 35 targets, he has 16). Here are his raw numbers so far.
26.4 PPR points a game allowed to wide receivers, 28th most of 32 defenses.
| Player | PPR | Tgt | Rec | Rec Yd | Rec TD | Rush Yd |
|---|---|---|---|---|---|---|
| Christian Watsonvs GB • Wk 1 | 32.7 | 8 | 6 | 147 | 2 | 0 |
| Jameson Williams@ DET • Wk 8 | 17.0 | 6 | 4 | 70 | 1 | 0 |
| Matthew Goldenvs GB • Wk 1 | 15.5 | 12 | 6 | 95 | 0 | 0 |
| Amon-Ra St. Brown@ DET • Wk 8 | 12.6 | 8 | 7 | 46 | 0 | 10 |
| Malik Washingtonvs MIA • Wk 4 | 12.0 | 5 | 5 | 67 | 0 | 3 |
| Matthew Golden@ GB • Wk 10 | 12.0 | 9 | 5 | 70 | 0 | 0 |
| J. Michael Sturdivant@ GB • Wk 10 | 11.7 | 4 | 2 | 37 | 1 | 0 |
| Emeka Egbuka@ TB • Wk 3 | 11.2 | 9 | 5 | 62 | 0 | 0 |
| Ted Hurst III@ TB • Wk 3 | 11.0 | 3 | 1 | 40 | 1 | 0 |
| Khalil Shakirvs BUF • Wk 9 | 9.8 | 4 | 4 | 58 | 0 | 0 |
| Kalif Raymond@ CHI • Wk 2 | 9.0 | 5 | 5 | 40 | 0 | 0 |
| Chris Olave@ NO • Wk 5 | 8.6 | 6 | 4 | 46 | 0 | 0 |
| Rome Odunze@ CHI • Wk 2 | 7.3 | 4 | 3 | 43 | 0 | 0 |
| Christian Watson@ GB • Wk 10 | 6.7 | 5 | 3 | 37 | 0 | 0 |
| Devaughn Vele@ NO • Wk 5 | 6.6 | 6 | 4 | 26 | 0 | 0 |
| DJ Moorevs BUF • Wk 9 | 6.6 | 5 | 3 | 25 | 0 | 11 |
| Luther Burden III@ CHI • Wk 2 | 6.2 | 7 | 3 | 32 | 0 | 0 |
| Keenan Allenvs IND • Wk 7 | 6.1 | 3 | 3 | 31 | 0 | 0 |
| Chris Godwin Jr.@ TB • Wk 3 | 5.5 | 4 | 3 | 25 | 0 | 0 |
| Jayden Reedvs GB • Wk 1 | 5.0 | 7 | 3 | 20 | 0 | 0 |
| Keon Colemanvs BUF • Wk 9 | 4.7 | 6 | 3 | 17 | 0 | 0 |
| Savion Williams@ GB • Wk 10 | 4.7 | 2 | 2 | 27 | 0 | 0 |
| Laquon Treadwellvs IND • Wk 7 | 3.9 | 2 | 2 | 19 | 0 | 0 |
| Josh Downsvs IND • Wk 7 | 3.8 | 4 | 2 | 18 | 0 | 0 |
| Deion Burksvs IND • Wk 7 | 2.1 | 1 | 1 | 11 | 0 | 0 |
| Bo Meltonvs GB • Wk 1 | 2.0 | 1 | 1 | 10 | 0 | 0 |
| Tez Johnson@ TB • Wk 3 | 1.8 | 2 | 1 | 8 | 0 | 0 |
| Kevin Coleman Jr.vs MIA • Wk 4 | 1.3 | 4 | 1 | 3 | 0 | 0 |
| Skyy Moorevs GB • Wk 1 | 0.0 | 1 | 0 | 0 | 0 | 0 |
| Jalen McMillan@ TB • Wk 3 | 0.0 | 1 | 0 | 0 | 0 | 0 |
| Jalen Tolbertvs MIA • Wk 4 | 0.0 | 1 | 0 | 0 | 0 | 0 |
| Chris Bellvs MIA • Wk 4 | 0.0 | 3 | 0 | 0 | 0 | 0 |
| Bryce Lance@ NO • Wk 5 | 0.0 | 3 | 0 | 0 | 0 | 0 |
Fantasy points first, then the stats that matter for his position. Ring around each photo is that player's Mania Rating. Tap a name to open his profile.